Article

End-to-End Lane Detection: A Two-Branch Instance Segmentation Approach

by
Ping Wang
1,2,*,
Zhe Luo
1,
Yunfei Zha
3,
Yi Zhang
1,2 and
Youming Tang
4
1
School of Mechanical and Automotive Engineering, Xiamen University of Technology, Xiamen 361024, China
2
Fujian Province Key Laboratory of Advanced Design and Manufacturing of Buses, Xiamen 361024, China
3
School of Mechanical and Automotive Engineering, Fujian University of Technology, Fuzhou 350118, China
4
School of Mechanical & Energy Engineering, Zhejiang University of Science & Technology, Hangzhou 310023, China
*
Author to whom correspondence should be addressed.
Electronics 2025, 14(7), 1283; https://doi.org/10.3390/electronics14071283
Submission received: 24 February 2025 / Revised: 21 March 2025 / Accepted: 23 March 2025 / Published: 25 March 2025

Abstract

:
To address the challenges of lane line recognition failure and insufficient segmentation accuracy in complex autonomous driving scenarios, this paper proposes a dual-branch instance segmentation method that integrates multi-scale modeling and dynamic feature enhancement. By constructing an encoder-decoder architecture and a cross-scale feature fusion network, the method effectively enhances the feature representation capability of multi-scale information through the integration of high-level feature maps (rich in semantic information) and low-level feature maps (retaining spatial localization details), thereby improving the prediction accuracy of lane line morphology and its variations. Additionally, hierarchical dilated convolutions (with dilation rates 1/2/4/8) are employed to achieve exponential expansion of the receptive field, enabling better fusion of multi-scale features. Experimental results demonstrate that the proposed method achieves F1-scores of 76.0% and 96.9% on the CULane and Tusimple datasets, respectively, significantly enhancing the accuracy and reliability of lane detection. This work provides a high-precision, real-time solution for autonomous driving perception in complex environments.

1. Introduction and Related Work

Lane detection methods based on computer vision are an essential component of autonomous driving and advanced driver assistance systems. In complex traffic environments, accurate lane detection can enhance vehicle safety and reliability, improving the overall driving experience. Traditional lane detection methods, which rely on computer vision techniques such as edge detection [1,2], color segmentation, or Hough transforms [3], struggle to cope with extreme lighting conditions, adverse weather effects, road surface damage, occlusions, and non-standard lane markings. These challenges result in lower detection accuracy, poorer robustness, and an inability to meet the real-time processing and high-precision requirements of modern autonomous driving systems.
Compared to traditional lane detection methods, deep neural network-based lane detection methods have demonstrated significant advantages in the field of autonomous driving. This approach utilizes an end-to-end learning framework to automatically learn and extract lane features directly from raw images, effectively overcoming the limitations of traditional methods [4]. Deep learning models are trained on large amounts of labeled data, enabling them to automatically capture complex features and subtle differences in images, thus improving the accuracy and robustness of lane detection. Furthermore, the powerful representation capability of deep neural networks allows them to maintain high performance in various complex environments, adapting to different road conditions and driving scenarios. Currently, deep learning-based lane detection methods are mainly categorized into three types: segmentation-based methods [5,6], line-based methods [7,8], and parameter-based methods [9,10].
Segmentation-based methods treat lane detection as a pixel-wise classification problem, decomposing input road images into pixel-level category labels, where each pixel is classified as either a lane area or background. The Spatial Convolutional Neural Network (SCNN) proposed by Pan et al. [11] treats different lane markings as distinct classes and introduces a patch-wise CNN structure, incorporating spatial dimension information into the network to better capture the features of elongated structures. However, this approach increases inference time. The LaneNet algorithm designed by Neven et al. [12] assigns each lane line’s pixels to different lane instances and generates pixel-level masks for each object, simplifying the traditional multi-stage processing pipeline and reducing error accumulation caused by multi-stage processing. The CurveLanes-Neural Architecture Search (CurveLanes-NAS) developed by Xu et al. [13] utilizes a network architecture combining Neural Architecture Search (NAS) with adaptive point fusion, allowing the model to automatically adjust its internal parameters based on varying road conditions. However, it requires significant computational resources and has certain limitations in unstructured road scenarios. Che et al. [14] proposed a lane detection framework for drivable area segmentation, which can simultaneously handle drivable area and lane segmentation tasks, achieving multi-task learning through shared feature extraction layers. However, its recognition accuracy is suboptimal in complex environments such as multi-lane roads and intersections, and it is highly dependent on the quality and diversity of the training data. Wang et al. [15] designed a lightweight model and adaptive stitching module, introducing a learnable parameter to adaptively connect the neck and backbone in segmentation tasks, thereby reducing the number of parameters and inference time. However, the overall memory and computational overhead of the model is relatively high, and its prediction accuracy is insufficient in scenarios with strong sunlight and nighttime conditions.
Line-based methods transform lane detection into a series of object detection tasks by using predefined anchor regions to capture candidate areas that may contain lane markings. These candidate regions are further refined to predict the specific location and shape of the lane markings. Tabelini et al. [16] proposed an anchor-based lane detection model that uses anchors in the feature pooling step to obtain local features, which are then combined with global features generated by an attention module. The results from classification and regression are concatenated for final prediction. Su et al. [17] designed a top-down vanishing point-guided anchor generator that improves lane perception with multi-level structural constraints, recovering lane details from a bottom-up approach. The anchors can be efficiently classified and regressed to achieve accurate lane position and shape. Zheng et al. [18] proposed CLRNet, which uses high-level features to detect lane markings and adjusts the lane positions based on low-level features. It captures more global context information by establishing the relationship between ROI lane features and the entire feature map. However, the aforementioned algorithms fail to fully leverage global information, perform poorly when handling curved roads or multi-lane scenarios, and struggle with non-standard lane markings (such as those in construction zones), leading to limited detection performance.
Parameter-based methods regress parameters through a mathematical model of lane markings to describe their position and shape. This approach does not require complex post-processing steps, such as pixel clustering [19,20] and non-maximum suppression [21,22], enabling faster recognition speed. Tabelini et al. [9] used images from a forward-facing camera as input and applied deep polynomial regression to output the polynomials representing each lane marking in the image, improving detection efficiency. Wouter et al. [10] designed a least squares fitting module that can be embedded into a neural network. This module takes feature maps extracted by CNNs, calculates the geometric parameters of the best-fit lane line, and updates the network weights through backpropagation to optimize the fitting results. Parameter-based methods require fewer parameters to be regressed and can flexibly adapt to lane markings of various shapes. However, they struggle with lane fitting in complex road scenarios, such as extreme curvatures or intersections. Moreover, for high-order parameterized curves, even small errors in parameter prediction can lead to significant deviations in the predicted lane line shape, making it difficult to achieve higher detection performance.
In complex and dynamic autonomous driving environments, existing lane detection methods urgently require enhanced perception capabilities to maintain high precision and robustness across diverse traffic scenarios. Specifically, to accommodate scenarios with multiple and variable numbers of lane lines, instance-level detection of each individual lane becomes critical. This paper proposes a novel lane detection framework integrating dual-branch instance segmentation with least-squares curve fitting. Our architecture features two synergistic branches: a weight map generator providing global semantic guidance, and an instance segmentation branch that precisely separates each lane instance while generating pixel-level segmentation masks with associated attribute features. The instance segmentation outputs are subsequently processed through a differentiable least-squares fitting module to derive optimal curve parameters. The final output simultaneously provides geometric parameters and instance-aware segmentation labels for all detected lanes. By integrating high-level semantic features with low-level spatial information, our method achieves enhanced multi-scale feature representation, significantly improving prediction accuracy for diverse lane configurations.

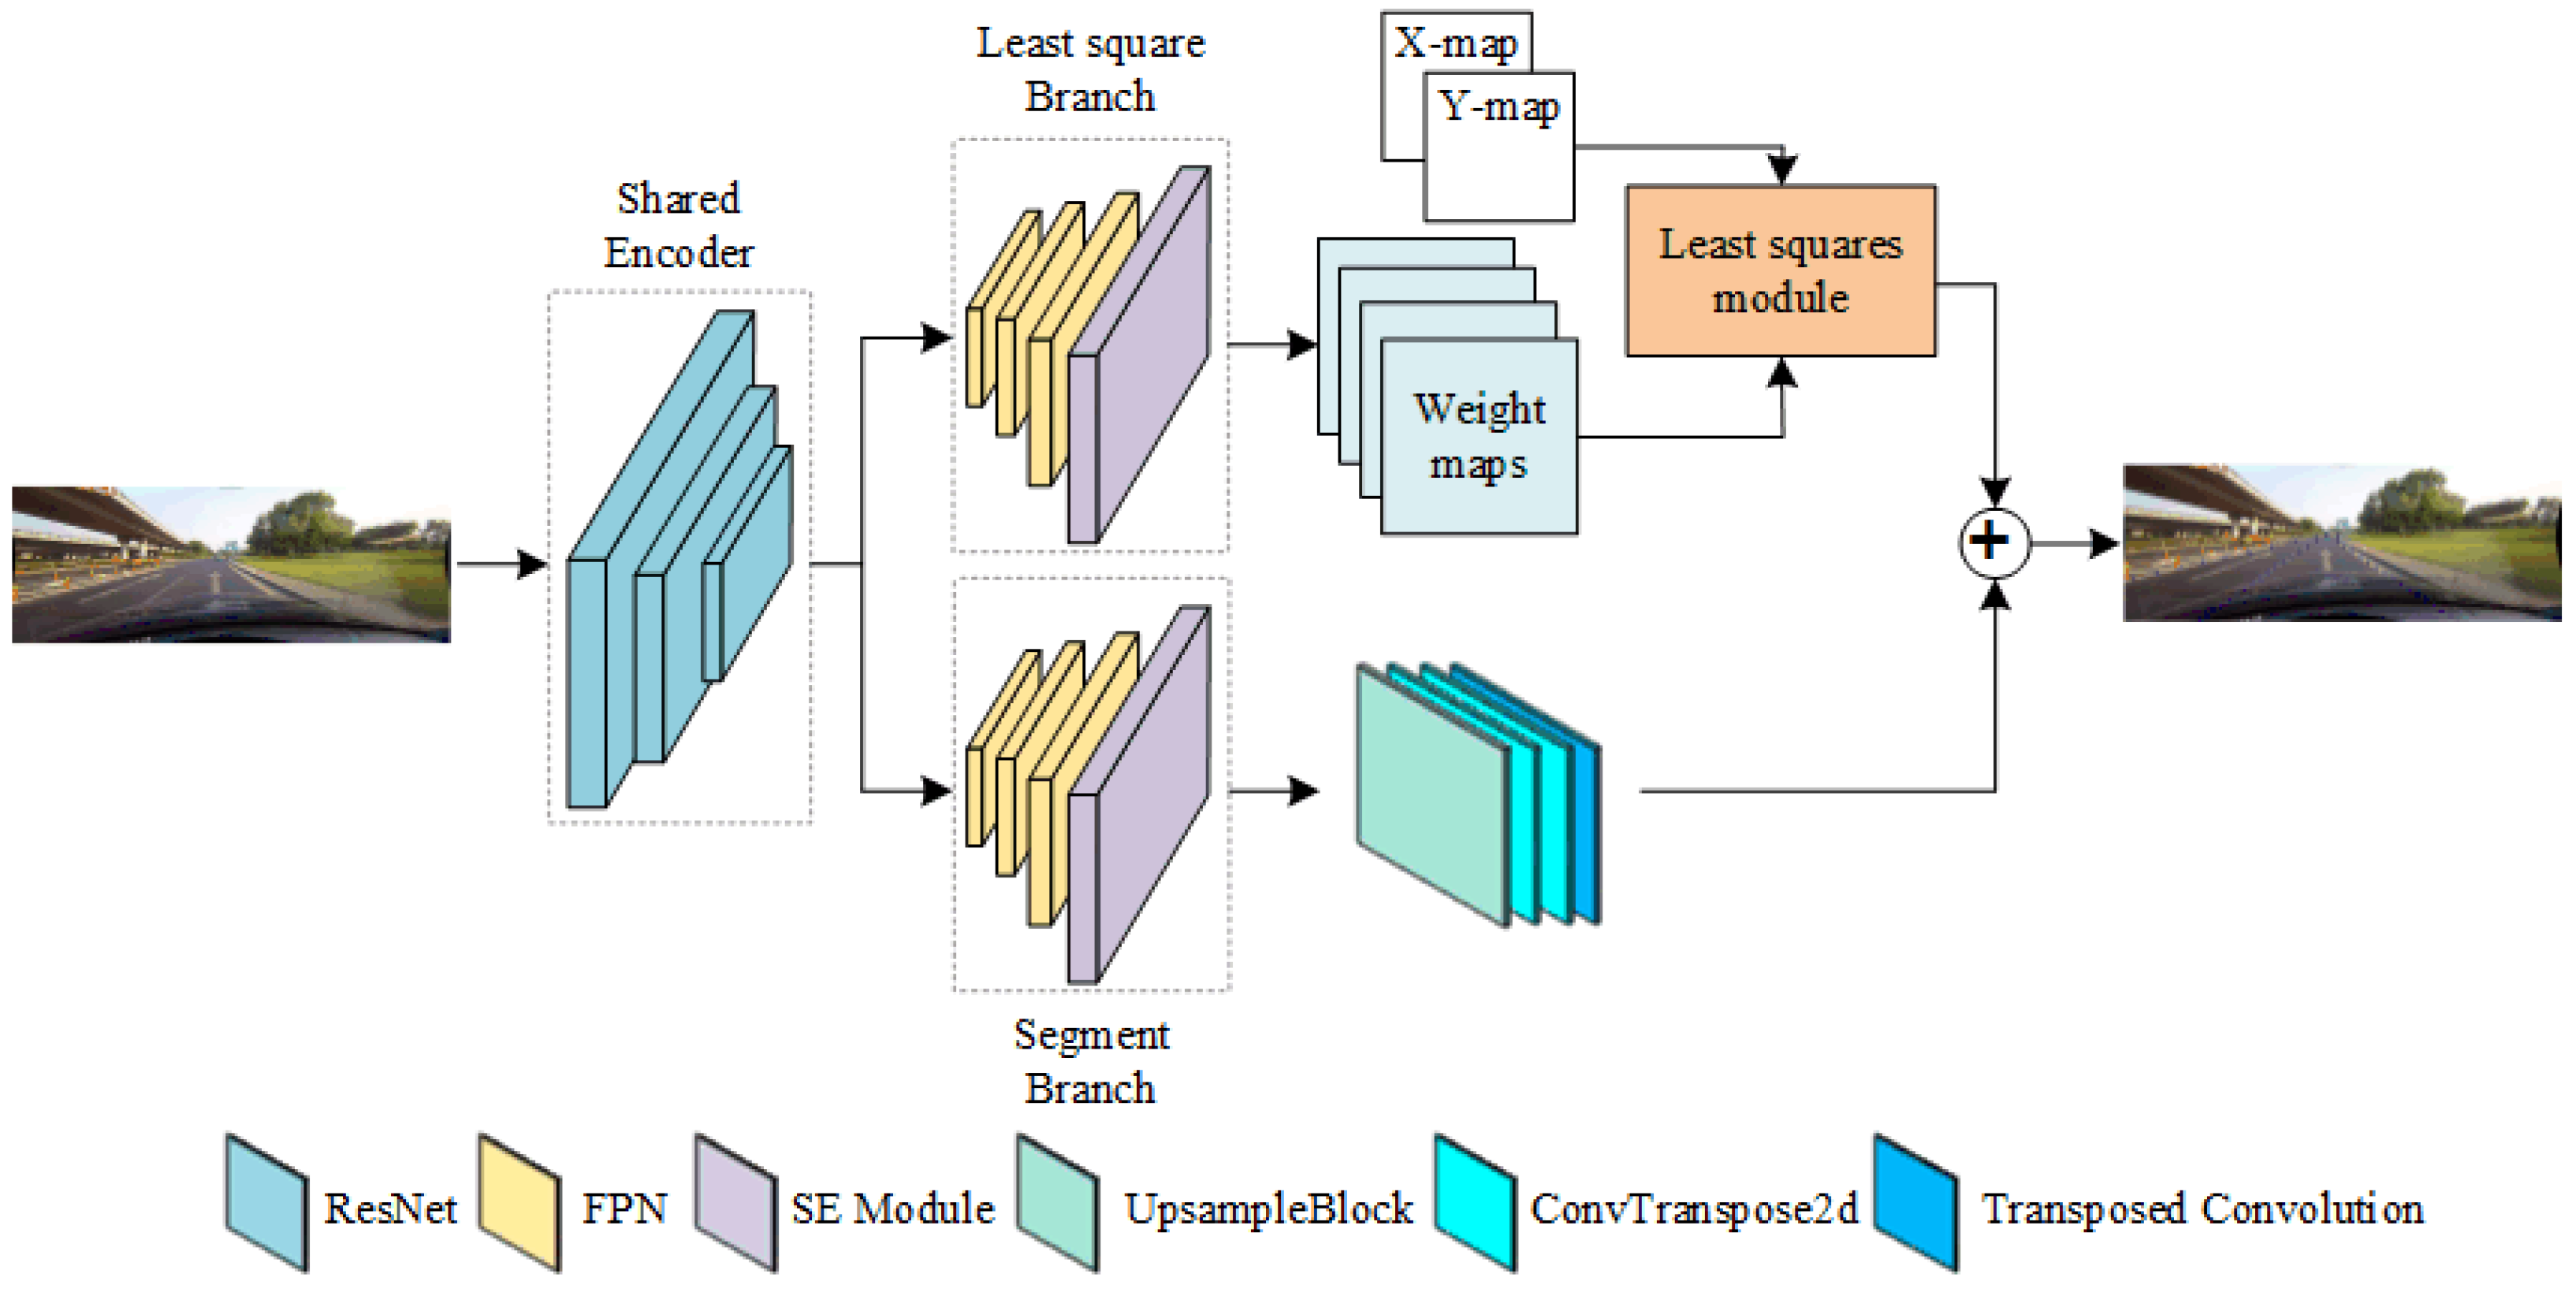
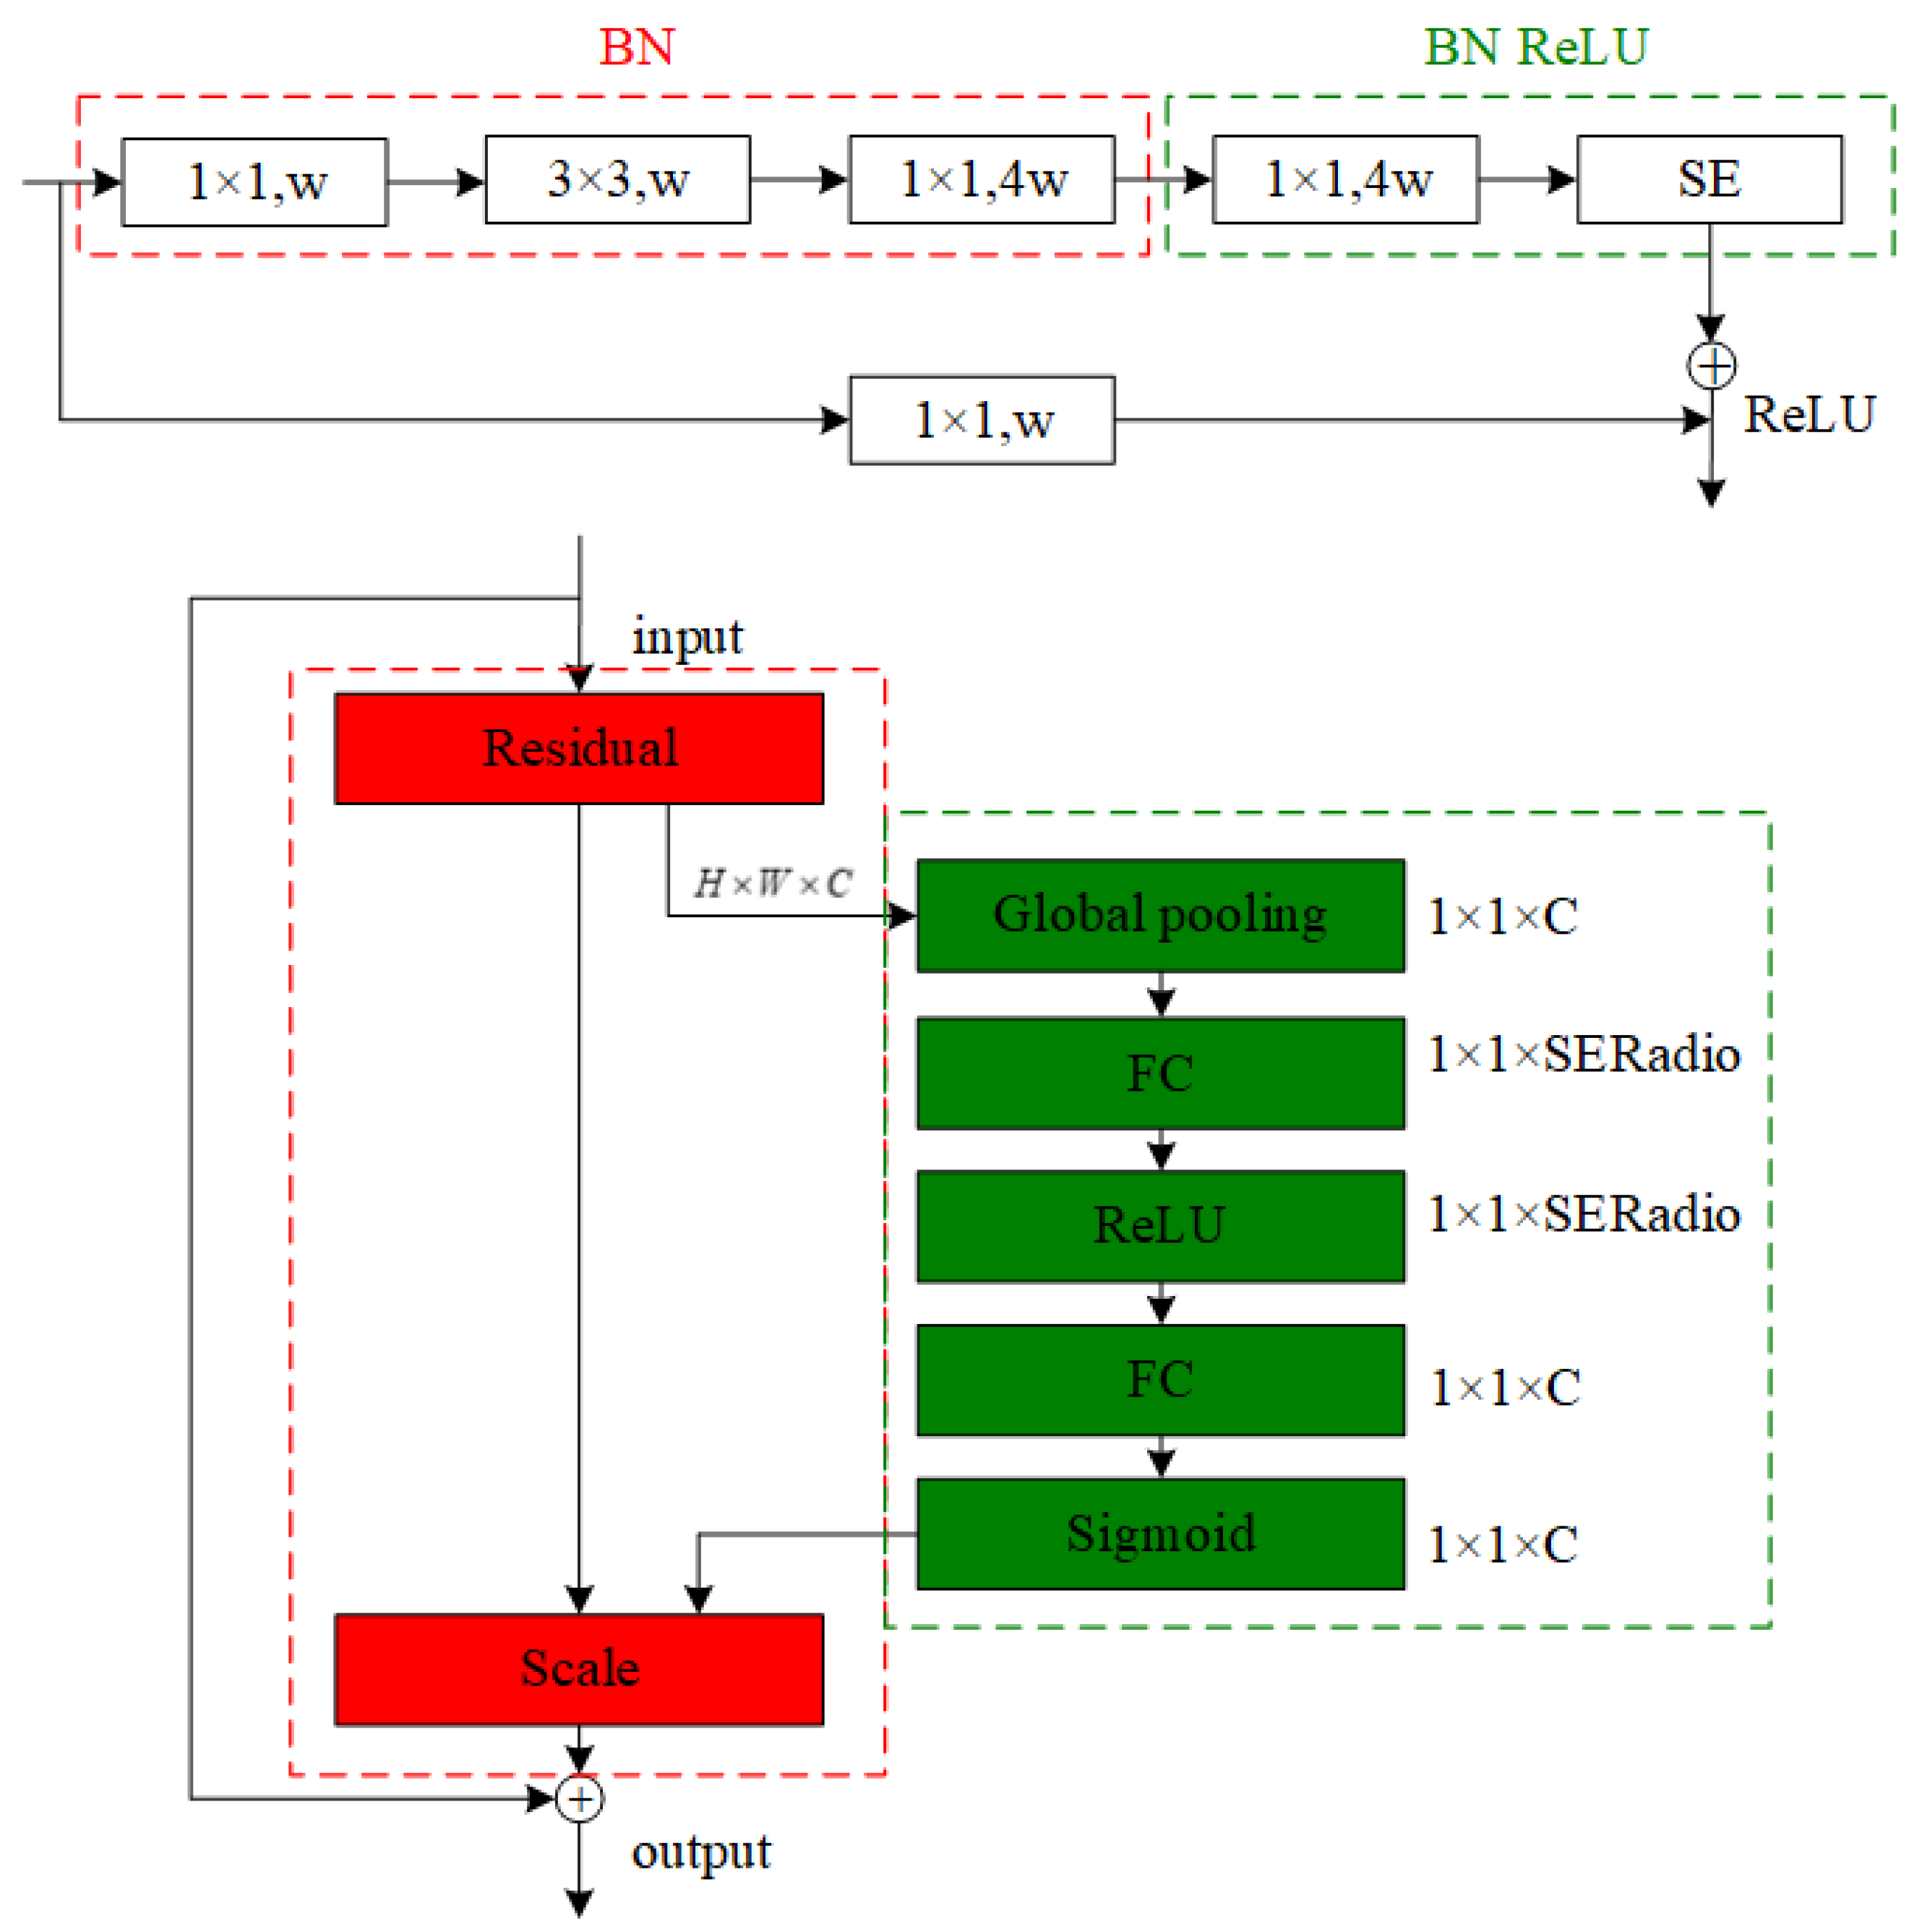
2. Two-Branch Instance Partitioning Network Model
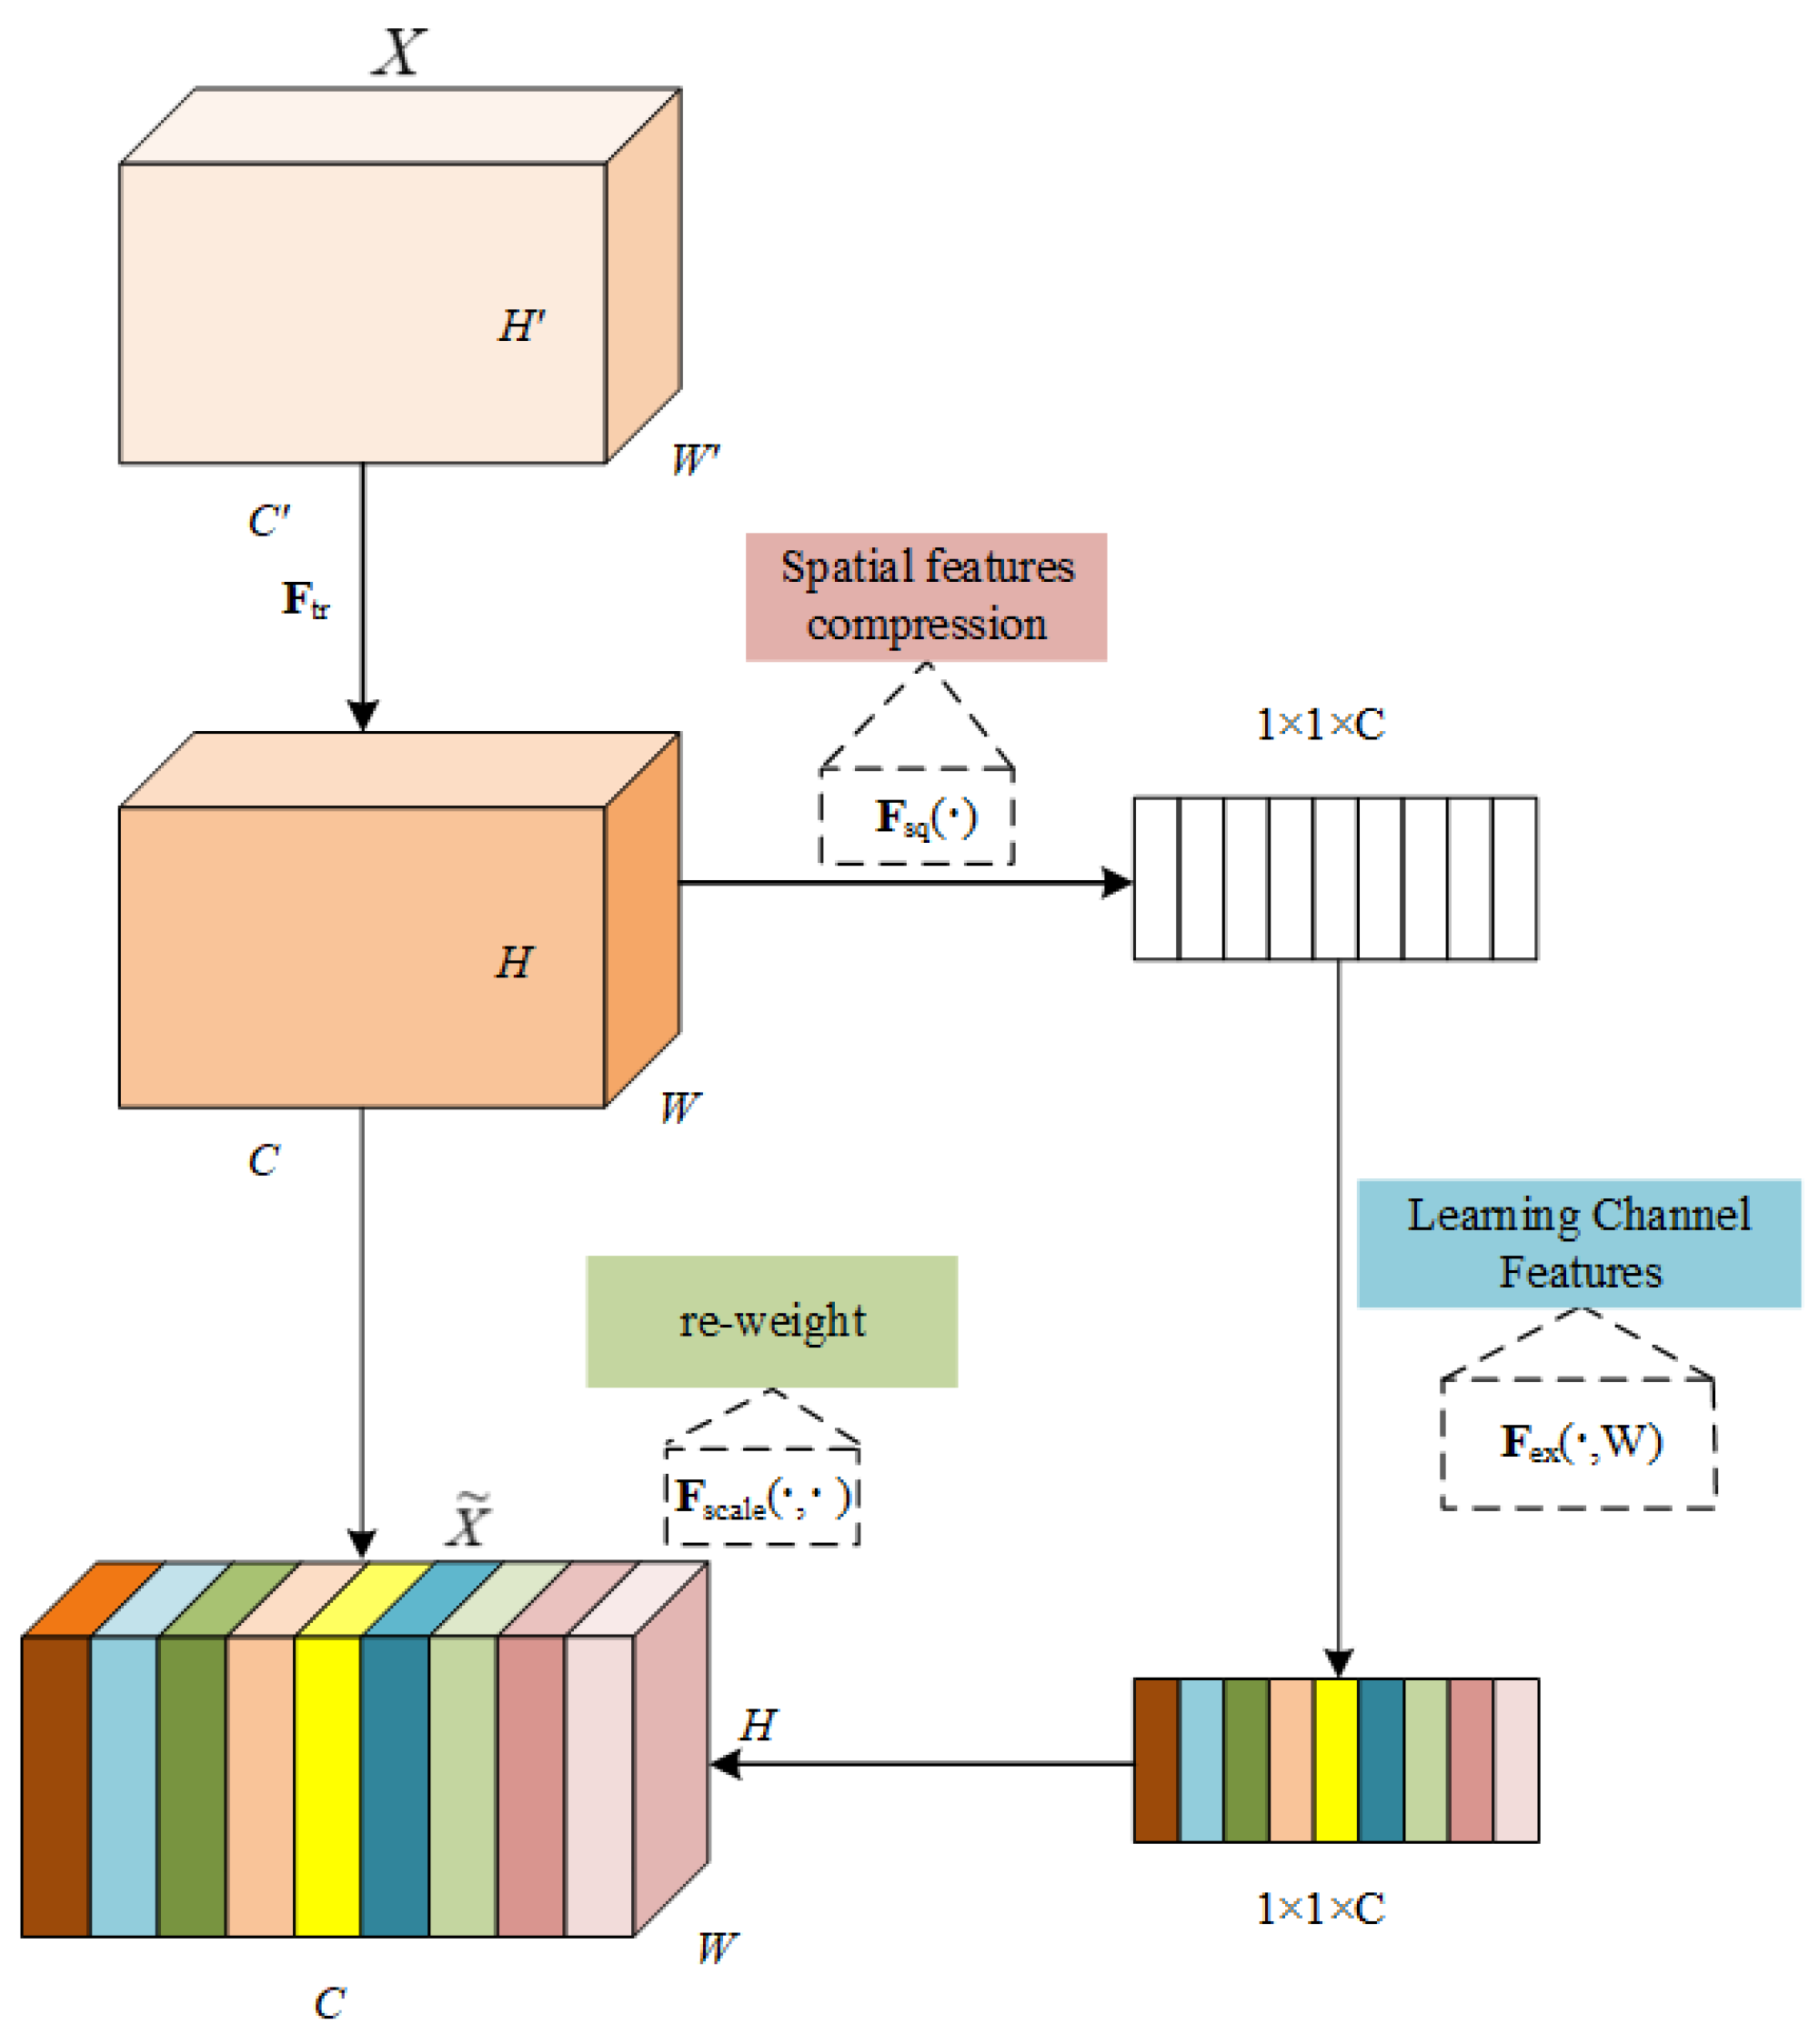
As shown in Figure 1, the network adopts an encoder-decoder architecture. The least square branch is used to generate a weight map for each lane marking, focusing on producing weights for the subsequent least squares fitting module, which enables precise fitting of the lane’s geometric shape. The segment branch is responsible for identifying and segmenting each lane instance in the image, allowing the model to accurately recognize the layout and number of lane markings in complex scenarios.

2.1. Segment Branch

This paper proposes a lane detection method that combines a differentiable least squares fitting approach [23] with instance segmentation, based on the end-to-end lane detection framework by Van Gansbeke et al. [10]. This method integrates geometric and visual features, enhancing adaptability to complex and dynamic environmental conditions and improving the model’s performance under varying road and weather conditions. First, this method integrates geometric and visual characteristics to better adapt to complex and dynamic environmental conditions, enhancing the robustness of the model in diverse road scenarios and weather variations. First, the proposed approach adopts a deep learning network to generate per-pixel weights, producing x- and y-coordinate weight maps that reflect the confidence of each pixel belonging to lane markings. The network assigns a weight value to each position of pixel in the image, indicating its probability of being part of a lane line. Second, the pixel coordinates are normalized and the network predicts the weight values w for each pixel to generate feature maps with spatial dimensions identical to the input image. The coordinates and corresponding weights ( x i , y i , w i ) of each pixel are then fed into the subsequent least squares fitting module. Finally, a weighted least-squares fitting module is integrated to directly solve lane model parameters within the network. By leveraging pixel weights obtained from previous steps in a weighted formulation, this method adjusts the influence of each coordinate point through the optimization process, enabling precise fitting of mathematical curve models that describe lane boundaries.
Due to the structural similarity between the lane markings and the road edges, especially in complex environments where the lane markings are obstructed, worn, or discontinuous, greater demands are placed on the feature extraction capabilities of the network. To accurately extract lane features, this paper leverages the residual network (ResNet) proposed by He et al. [24]. By constructing ’shortcut connections’, which provide identity mapping paths for gradient propagation, the method effectively mitigates performance degradation issues during deep network training and significantly improves the ability of the network to extract image features. The algorithm uses ResNet50 as the backbone network, which consists of five convolutional blocks, denoted as Conv1, Conv2, Conv3, Conv4, and Conv5.
As shown in Figure 2, this is the residual structure in the convolution block, where X represents the number of channels in the input to the residual module, w denotes the number of channels in the output feature matrices of each convolutional block, and each convolutional layer is followed by a batch normalization (BN) layer.
Given the elongated structural characteristics of the lane markings, the network model requires high-level semantic features to detect the lane markings and perform coarse localization, followed by precise lane localization using low-level semantic features.
Therefore, this paper employs the Feature Pyramid Network (FPN) [25], which integrates multi-scale feature information. FPN enhances the connections between features at different scales through a top-down structure, effectively extending traditional methods that rely on single-scale feature maps.
As shown in Figure 3, the Feature Pyramid Network (FPN) consists primarily of two components: the bottom-up path and the top-down path with lateral connections. The bottom-up path is responsible for progressively extracting features layer by layer in the conventional convolutional network manner, gradually reducing the spatial dimensions while increasing the semantic dimensions. In the case of ResNet-50 as the backbone network, the feature maps output from each convolutional block, from Conv2 to Conv5, are processed sequentially to achieve deep semantic feature extraction. The top-down path, on the other hand, serves to pass high-level semantic features to lower layers via upsampling. During the downwards transmission, the size of each feature map progressively increases to match the spatial resolution of the lower layers. Each upsampled feature undergoes a 1 × 1 convolution operation for channel matching, followed by pixel-wise addition with the corresponding features from the bottom-up path. The lateral connections ensure the effective fusion of features at different scales [26].
To enhance the capability of the model to capture multiscale features, we strategically replace standard convolutional layers with dilated convolutions [27] employing hierarchically increasing dilation rates. Specifically, dilation rates of 1, 2, 4, and 8 are adopted for conv2, conv3, conv4, and conv5, respectively, achieving exponential expansion of receptive fields across network depth. This progressive design enables shallow layers to concentrate on local pattern extraction (e.g., lane boundary details) while allowing deeper layers to model global structural relationships (e.g., long-range lane trajectory patterns), thereby establishing a coherent multi-scale representation hierarchy.
The enhanced architecture generates a hierarchy of semantically enriched, multi-resolution feature maps, where each map preserves detailed spatial cues from its original hierarchy while progressively incorporating higher-level semantic representations. Complex lane detection scenarios demand both precise spatial localization and advanced semantic comprehension of lane geometry and typology. To address this, we design a multi-scale feature aggregation framework by applying tailored convolutional operations and bilinear interpolation to align channel dimensions and spatial scales across heterogeneous feature hierarchies. This systematic integration enables the model to adaptively fuse fine-grained positional details with abstract contextual patterns, thereby enhancing its capacity to discern and process multi-scale lane instances with improved geometric fidelity under challenging environmental conditions.
In this paper, to address the issues of model expressiveness and feature recalibration, the SE (Squeeze-and-Excitation) module [28] is introduced into the lane detection network, as shown in Figure 4.
This module enhances the model’s focus on useful features by dynamically recalibrating different feature channels, while suppressing irrelevant information such as random noise, background elements (e.g., trees, buildings), and redundant features. This improves the overall recognition and segmentation performance of the model. The SE module consists of three steps: Squeeze, Excitation, and Reweight. First, the Squeeze step compresses each channel’s features into a single scalar by global average pooling, capturing global contextual information. The mathematical formulation of this step is as follows:
z c = F sq ( u c ) = 1 H × W i = 1 H j = 1 W u c ( i , j )
In the equation, z c represents the output; u c refers to the input feature map; H is the height of the image; W is the width of the image; and u c ( i , j ) denotes the value at the i-th row and j-th column.
Next, the Excitation step applies two fully connected layers to transform and activate the above features. The first fully connected layer reduces the dimensionality and learns the dependencies between channels, while the second layer restores the original dimensionality and uses a sigmoid function to obtain the weight s for each channel. The mathematical formulation for this step is as follows:
s = F ex ( z , W ) = σ ( g ( z , W ) ) = σ ( W 2 δ ( W 1 z ) )
In the equation, s represents the output channel weight vector; z is the channel feature vector after global average pooling; W 1 and W 2 are the weight matrices for the fully connected layers; δ denotes the ReLU activation function; and σ is the Sigmoid activation function.
Finally, the Reweight step applies the obtained attention weights to the features of each channel. Each feature map in the feature map set is multiplied by its corresponding weight to obtain the final output. The equation for this step is:
X ˜ = F scale ( u c , s c ) = s c u c
In the equation, X ˜ represents the feature map after scaling; u c is the input feature map; and s c is the scaling factor. The structure of the SE module incorporated into ResNet is shown in Figure 5.
After extracting each feature map, the obtained feature map is first processed through the SE module before subsequent upsampling and feature fusion operations. This methodology enables the network to adaptively recalibrate channel-wise feature responses prior to fusion, which enhances multi-scale information utilization and improves the model’s feature representation capability.

2.2. Least Square Branch

To fully leverage the advantages of the multi-scale Feature Pyramid Network (FPN), a weight generation mechanism is employed to ensure that features from each scale contribute effectively to the weighted least squares (WLS) fitting. First, the method generates N-channel feature maps (where N corresponds to the maximum detectable lane count) with resolution matching the input image through deep convolutional layers, where each channel characterizes the dynamic weight distribution of a specific lane. Normalized x- and y-coordinate feature maps (value range [0, 1]) are subsequently constructed, encoding pixel positions as learnable relative geometric information. A differentiable squaring operation is applied to generate non-negative weight matrices, ensuring numerical stability while achieving nonlinear mapping from confidence scores to geometric influence. For multi-lane detection in complex scenarios, each weight channel focuses on critical regions of individual lanes through attention mechanisms, with softmax suppression applied to eliminate weight overlap between different lane instances, thereby ensuring parameter estimation independence across lanes. During backpropagation, gradient signals flow through the least-squares module, enabling high-weight regions to automatically concentrate on geometrically salient features (e.g., lane curvature inflection points). To enhance weight distribution interpretability, a regularization term penalizing weight differences between adjacent rows enforces smooth variation along lane directions, while physical constraints based on lane curvature variation rates in the weight prediction head suppress abrupt weight transitions incompatible with vehicle kinematics. This framework establishes an end-to-end geometric optimization pipeline where weight generation and parameter estimation collaboratively optimize from local texture cues to global geometric patterns.
In the calculation of weights, multi-scale features f i are introduced, as described by the following formula:
w i = s = 1 S α s · f i s
In the equation, w i denotes the weight of pixel i; f i s represents the feature map at the s-th scale; and α s is the scaling coefficient for the features at each scale.
In this paper, we not only consider features at a single scale, but also use multi-scale features as input, improving the model’s robustness to complex environments by fusing information across different scales.
Before performing the weighted least squares fitting, we adjust the initial weight map using the precise lane information provided by the instance segmentation module. This information can be dynamically adjusted during the fitting process to ensure that the fitted curve aligns closely with the actual lane shape, thus maintaining high accuracy of the model in complex and variable lane environments. The equation is as follows:
w i a d j u s t e d = ( w i , Mask i )
In the equation, w i a d j u s t e d is the adjusted weight; Mask i is the lane line mask provided by the instance segmentation; and ⌀ is the weight adjustment function.
To further enhance the weighted least squares module’s attention to reliable features, we perform channel-wise weight re-normalization on the weights provided by the module. This re-normalization strengthens the model’s focus on trustworthy features (i.e., those belonging to the lane lines) while suppressing irrelevant background noise. In this paper, we use the SE module for channel-wise weight re-normalization. The equation is as follows:
w i ^ = s · w i
In the equation, w i ^ is the final weight adjusted by the SE module.

2.3. Feature Recovery Decoding

The design of the feature recovery decoding module aims to precisely reconstruct the position and shape of lane lines from the rich and deep feature maps obtained in the encoding network. Its structure consists of upsampling layers, non-bottleneck residual layers, and transposed convolution layers. First, the upsampling layer (UpsamplerBlock) increases the spatial resolution of the feature map, enhances the image resolution, reduces the number of channels in the feature map, and retains key global information. The non-bottleneck residual module effectively preserves low-level feature information, alleviates the vanishing gradient problem, and further extracts features through local convolutions, while avoiding excessive information loss and maintaining rich contextual information. Next, the transposed convolution layer (ConvTranspose2d) restores the resolution of the feature map to match that of the original input image, both enlarging the feature map and generating precise boundary and detail information, resulting in more refined segmentation outcomes. Finally, the transposed convolution layer outputs a feature map with a number of channels that match the target class count, representing the final predicted result of the image. During the pre-training phase, the network introduces a multi-channel output layer to handle additional tasks (such as background) or feature information. This structural design not only recovers image details but also ensures feature retention and information fusion during the decoding process, improving the accuracy and detail restoration ability of the segmentation task, which is crucial for precise lane detection in complex scenes.

2.4. Loss Function

The loss function is mainly divided into two parts: segmentation loss and geometric loss. Segmentation loss is used to realize the classification of lane line pixels, and in this paper, the cross-entropy loss function with weights is used, which makes the model more accurately distinguish the lane line and background pixels. Since lane line pixels are usually fewer than road background pixels, weights are introduced into the cross-entropy loss function to balance the problem of category imbalance, i.e.:
L seg = 1 N i = 1 N j = 1 M w j y i j log ( p i j )
In the equation, L seg is the segmentation loss; N is the total number of pixels; M is the number of categories; w j is the weight of category j, which is set to 0.5 for the background category and 1 for the lane line category; y i j is the true label, if pixel i belongs to category j, then y i j = 1 , otherwise y i j = 0 ; and p i j is the probability of observing that sample i belonging to category j.
The geometric loss function is used to measure the accuracy of the model in fitting the lane line geometry, and a weighted least squares fitting module is used to optimize the process through weights in order to improve the accuracy of fitting the lane line geometry:
L geo = i = 1 N w i ( y i y ^ i ) 2
In the equation, L geo is the geometric loss; N is the number of points used for fitting; w i is the weight of each pixel; y i are the true coordinates of the lane lines (ground truth lane lines) and y ^ i are the coordinates of the predicted lane lines.
In summary, the total loss of the algorithm in this paper is:
L total = α L seg + β L geo
In the equation, L total is the total loss; α is the weighting factor for segmentation loss; and β is the weighting factor for geometric loss. Since segmentation tasks typically require balancing pixel-level accuracy with geometric consistency, we initially set α = 1.0 (segmentation loss weight) and β = 1.0 (geometric loss weight) to ensure that the two types of information contribute equally to the total loss. Subsequently, via CULane validation subset of the training set on the grid search ( α ∈ 0.5, 1.0, 1.5, β ∈ 0.5, 1.0, 1.5), α and β = 1.0 was finally chosen. This combination achieves the highest F1 score and the lowest geometric error on the verification set. The same set of parameters ( α = 1.0, β = 1.0) was applied directly to TuSimple dataset training, and the model performance (F1 ± 0.5%) remained stable when the α / β ratio fluctuated in the range of 0.8∼1.2.

3. Evaluation and Experiments

3.1. Datasets

To evaluate the accuracy of the two-branch instance segmentation network method in this paper, two representative lane detection benchmarks, CULane and TuSimple, are chosen for experiments and data comparison. CULane contains 88,880 training sets, 9675 validation sets, and 34,680 test sets, which are divided into general classes and 8 challenging classes, including cross, night, noline, shadow, arrow, highlight, curve, and crowd. TuSimple consists of 3268 images for training, 358 images for validation, and 2782 images for testing, mostly highway driving scenarios.

3.2. Evaluation Metrics

The CULane dataset treats lane lines as thin curves with a width of 30 pixels, and uses the intersection and concurrency ratio (IoU) between predicted and ground truth lane lines as an evaluation metric to determine whether a lane line is predicted or not, and determines whether the prediction samples are correct or not by calculating the IoUs of the predicted and labeled lane lines. Lane lines with an intersection ratio greater than 0.5 are true positives (TP), while those less than 0.5 are false positives (FP), and those that are not detected due to omission are false negatives (FN). The F1 measurements are calculated as follows:
P F 1 = 2 ( P p r e c i s i o n × P r e c a l l ) P p r e c i s i o n + P r e c a l l
P p r e c i s i o n = N T P N T P + N F P
P r e c a l l = N T P N T P + N F N
In the equation, P F 1 is the mean of precision and recall; P p r e c i s i o n is precision; P r e c a l l denotes recall; N T P is the number of samples correctly predicted as positive classes; N F P is the number of samples incorrectly predicted as positive classes; and N F N is the number of samples in the positive category that were incorrectly predicted to be in the negative category.
For the TuSimple dataset, the main evaluation metric is accuracy, which is defined as follows:
a c c u r a c y = c l i p C c l i p c l i p S c l i p
In the equation, C c l i p is the number of correctly predicted lane points, and S c l i p is the number of all lane points.

3.3. Experimental Results and Analysis

The comparison results of other excellent algorithms in the CULane dataset are shown in Table 1.
Compared with E2Enet, SCNN, LaneATT, and UFLD, our method demonstrates performance improvements of 2.0%, 4.4%, 1.0%, and 3.7%, respectively. The proposed approach achieves the highest detection accuracy in normal, crowded, and no-line scenarios. Particularly in low-light conditions (e.g., night and shadow environments), benefiting from the dual-branch design and the dynamic optimization of semantic/edge features through SE modules, our method exhibits significantly superior performance to other algorithms. These results validate its enhanced adaptability and error tolerance in challenging illumination scenarios. Weighted least squares fitting does not perform exceptionally well in curve fitting, but it allows better control over fitting bias. While increasing the number of polynomial terms enables the fitting of complex curve shapes, this approach may lead to overfitting issues and increased computational resource consumption. Although our method shows slightly weaker performance than E2Enet and LaneATT in extreme curvature lanes and no-line scenarios, it demonstrates stronger error-elimination capabilities through information-enhanced learning in complex backgrounds or noise-interfered environments. Overall, our approach surpasses other methods in terms of recall rate and robustness.The dual-branch network architecture combining weighted least squares (WLS) fitting with instance segmentation endows the model with enhanced feature representation capability and superior generalization capacity for lane detection in complex environments. This validates the effectiveness of the proposed method in achieving higher detection accuracy and improved robustness under challenging scenarios.
In the TuSimple dataset, methods such as ResNet18, ResNet34, and LaneNet were used for experimental comparison, and the experimental results are shown in Table 2. Since the TuSimple dataset mainly contains highly normalized highway scenes with good lighting conditions, the performance differences between different lane line detection algorithms are relatively small. Compared to the other methods in Table 2, this paper’s method achieves the highest F1 score, indicating that it performs best in the trade-off between precision and recall. Meanwhile, the lower false negative rate further validates the high precision and stability of this paper’s method. The above results show that the model is able to recognize lane lines more accurately in complex driving scenarios, which effectively improves the safety and reliability of the autonomous driving system.
To validate the effectiveness of the proposed method, we conduct ablation studies on our model, with experimental results shown in Table 3. A denotes the improved FPN, B represents the SE attention module, and C indicates the WLS. The experimental data demonstrate that integrating the improved FPN, SE module, and WLS into our framework achieves optimal model performance. Compared to the baseline model, our approach achieves a 9.3% improvement in F1 score, confirming that the proposed model can better focus on task-relevant feature information, enhance the accuracy of lane shape estimation, and strengthen segmentation capability in complex scenarios.
As shown in Figure 6, the lane line detection results of this paper’s method in the CULane test set show that the method can accurately recognize lane lines in different scenarios, especially in complex scenarios such as lane line obstruction, low light, night, etc. In addition, the method can detect the number of changing lane lines more efficiently and accurately.

4. Conclusions

To address the issues of insufficient lane line recognition and segmentation accuracy in complex environments for autonomous vehicles, this paper proposes a lane detection method based on an end-to-end dual-branch instance segmentation network, which integrates multi-scale feature information and instance segmentation methods within a deep learning framework. This approach can dynamically adapt to changes in various complex environments, effectively merging multi-scale features to capture lanes at different distances and angles. As a result, it significantly enhances the accuracy and robustness of lane detection in challenging conditions such as night, shadows, crowded scenarios, and variations in lane density.
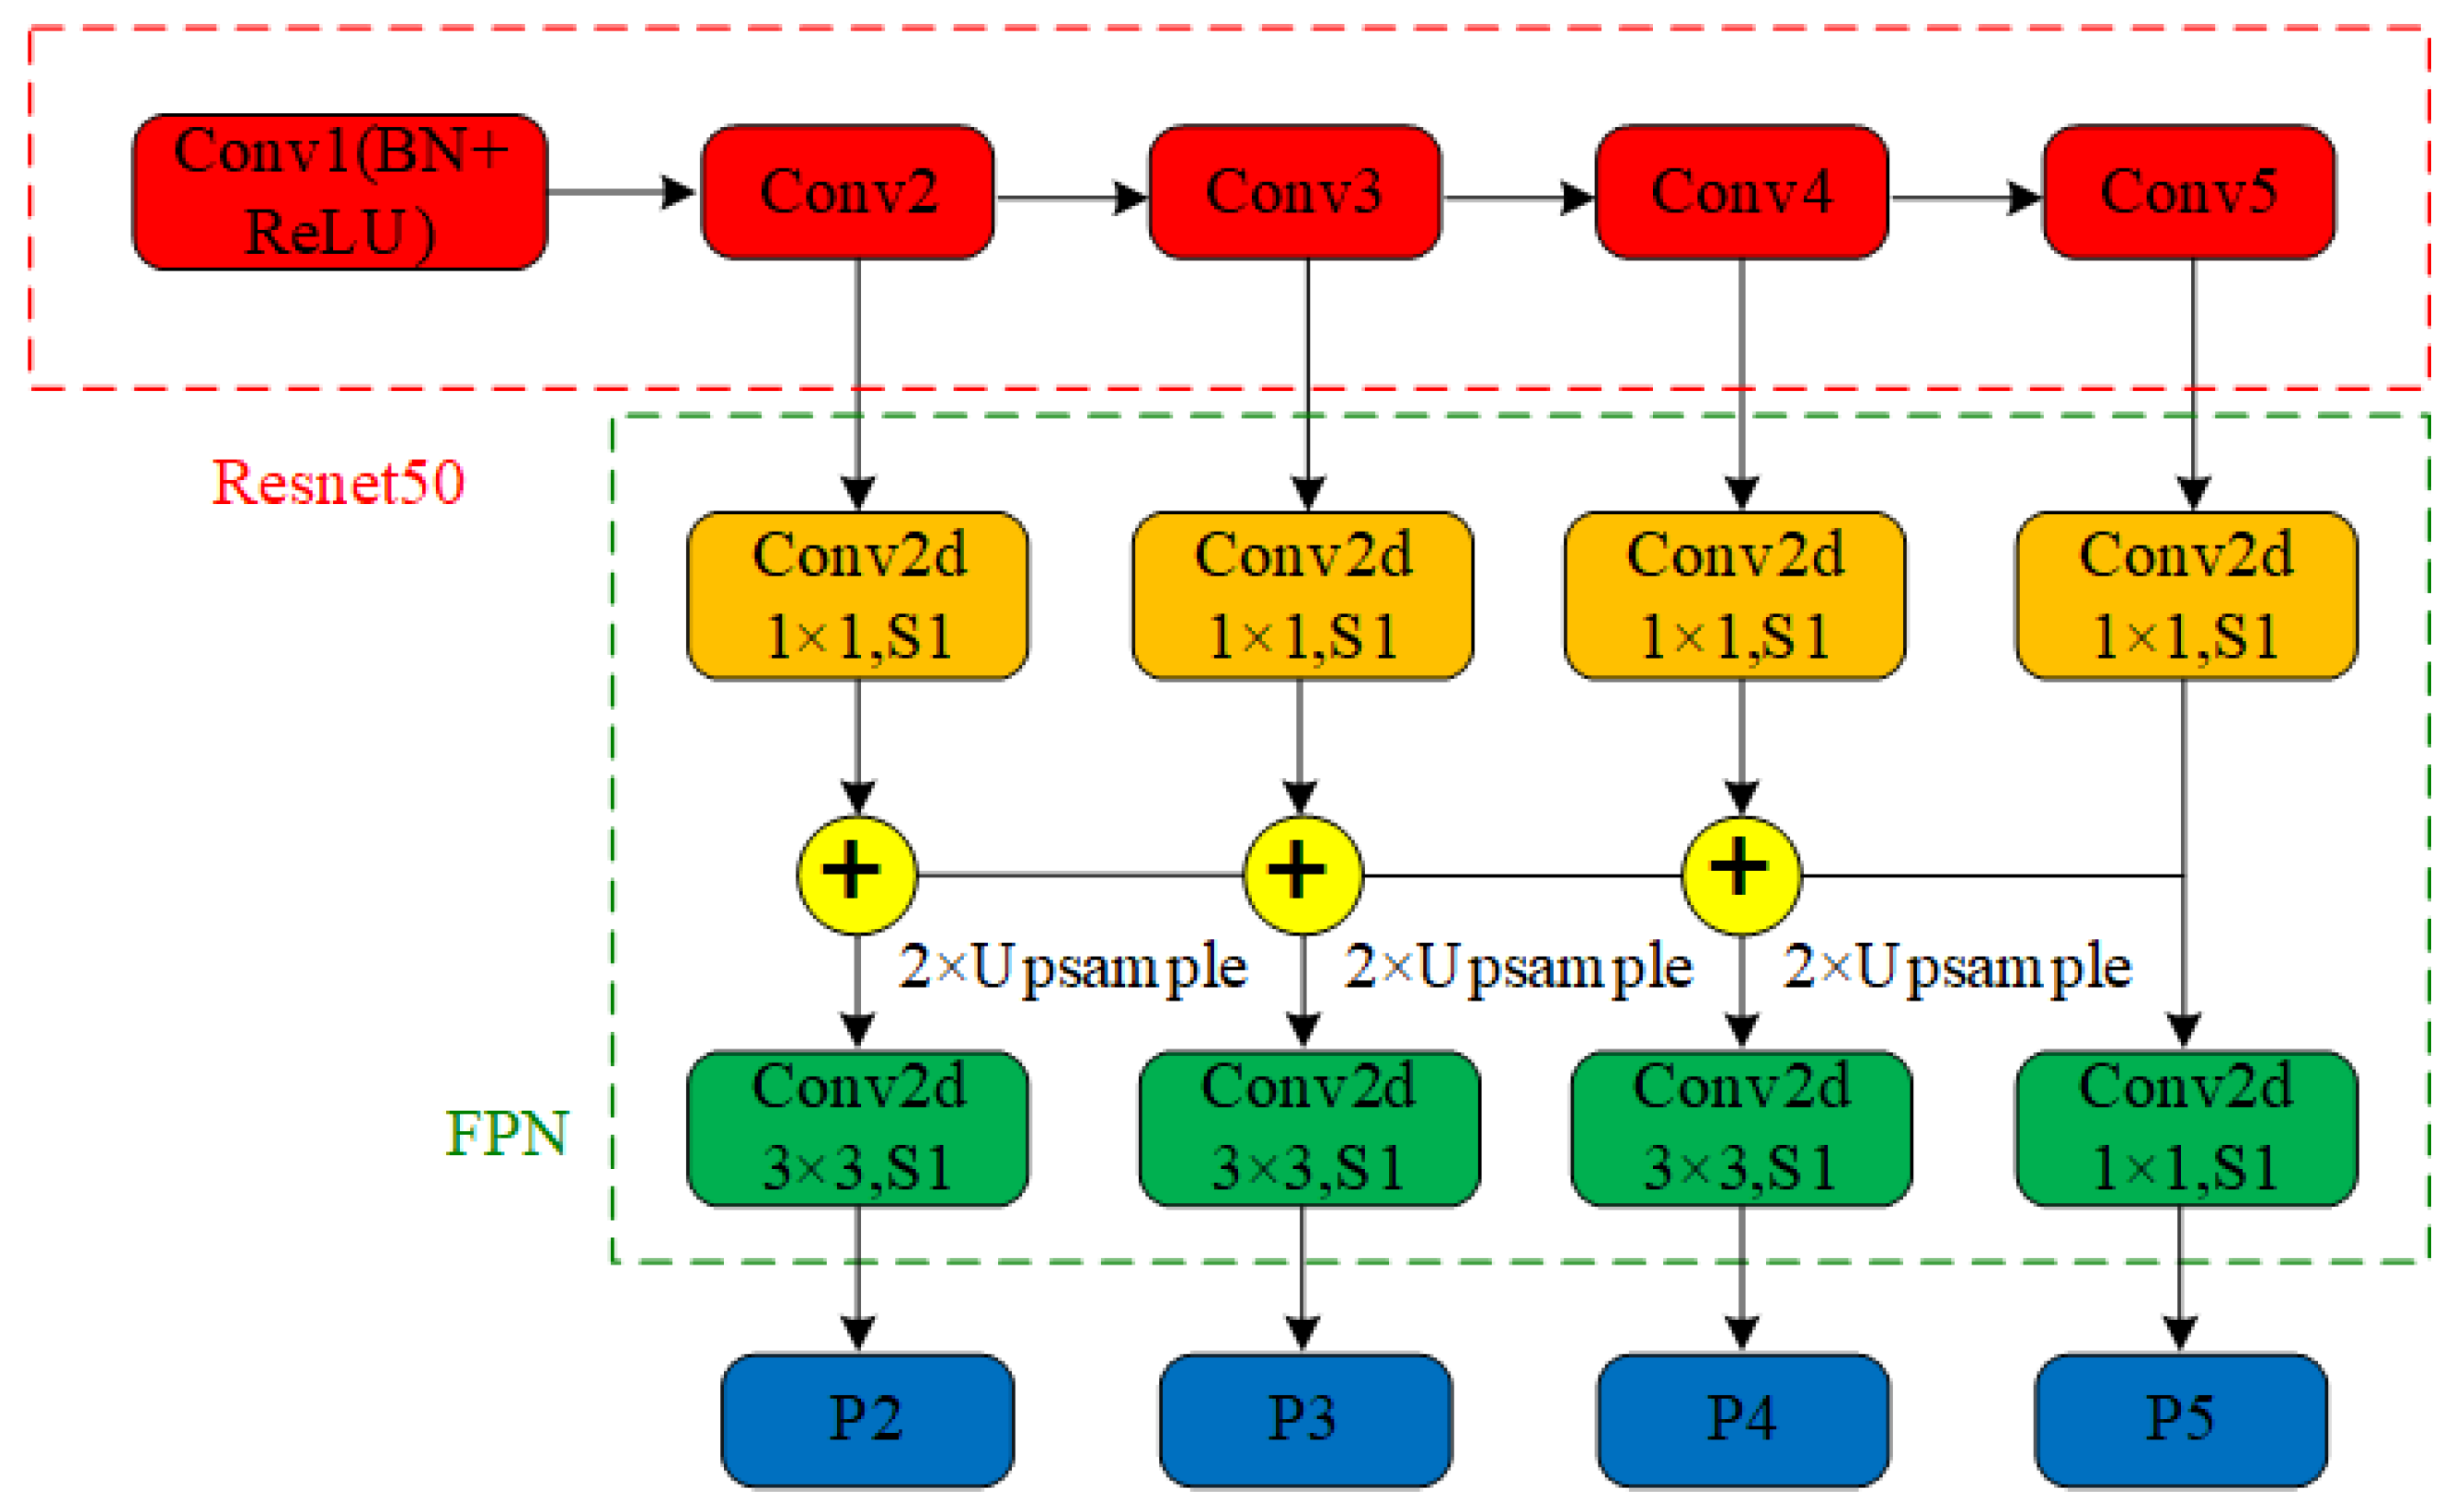
  • In this paper, the Feature Pyramid Network (FPN) in the encoding-decoding network architecture combined with the residual network (ResNet50) is used to achieve effective recognition and segmentation of each lane line instance in multiple road environments. FPN ensures that multi-scale information from global to local by integrating feature maps from different levels is fully utilized. This not only improves the limitations of traditional methods in dealing with complex scenes such as illumination changes, occlusion, and road damage, but also ensures that advanced semantic features and fine edge details are adequately extracted, thus improving the overall performance of the model.
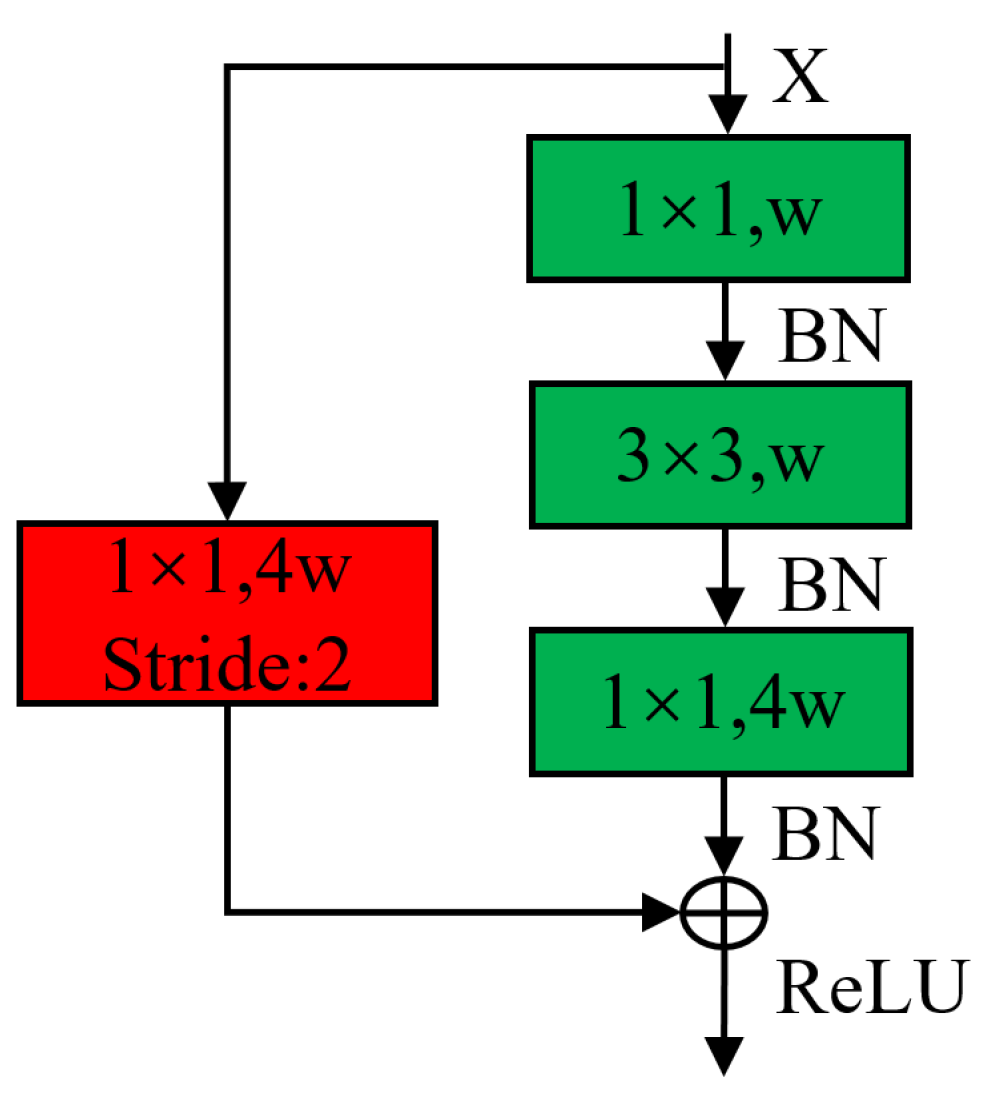
  • To enhance the capability of the decoding network, this paper introduces the expansion convolution, residual join, and weighted least squares fitting modules. The expansion convolution expands the sensory field to capture richer contextual information, which helps to deal with long-distance lane lines; the residual connection promotes the information flow of the deep network, avoids the gradient vanishing problem, and improves the training efficiency; and the weighted least squares fitting module optimizes the estimation of lane line parameters, which strengthens the model’s adaptive ability to different numbers and configurations of lane lines. This design improves the accuracy of the model’s lane line parameter estimation, enabling the model to accurately discriminate between instances of different lane lines and predict their geometries.
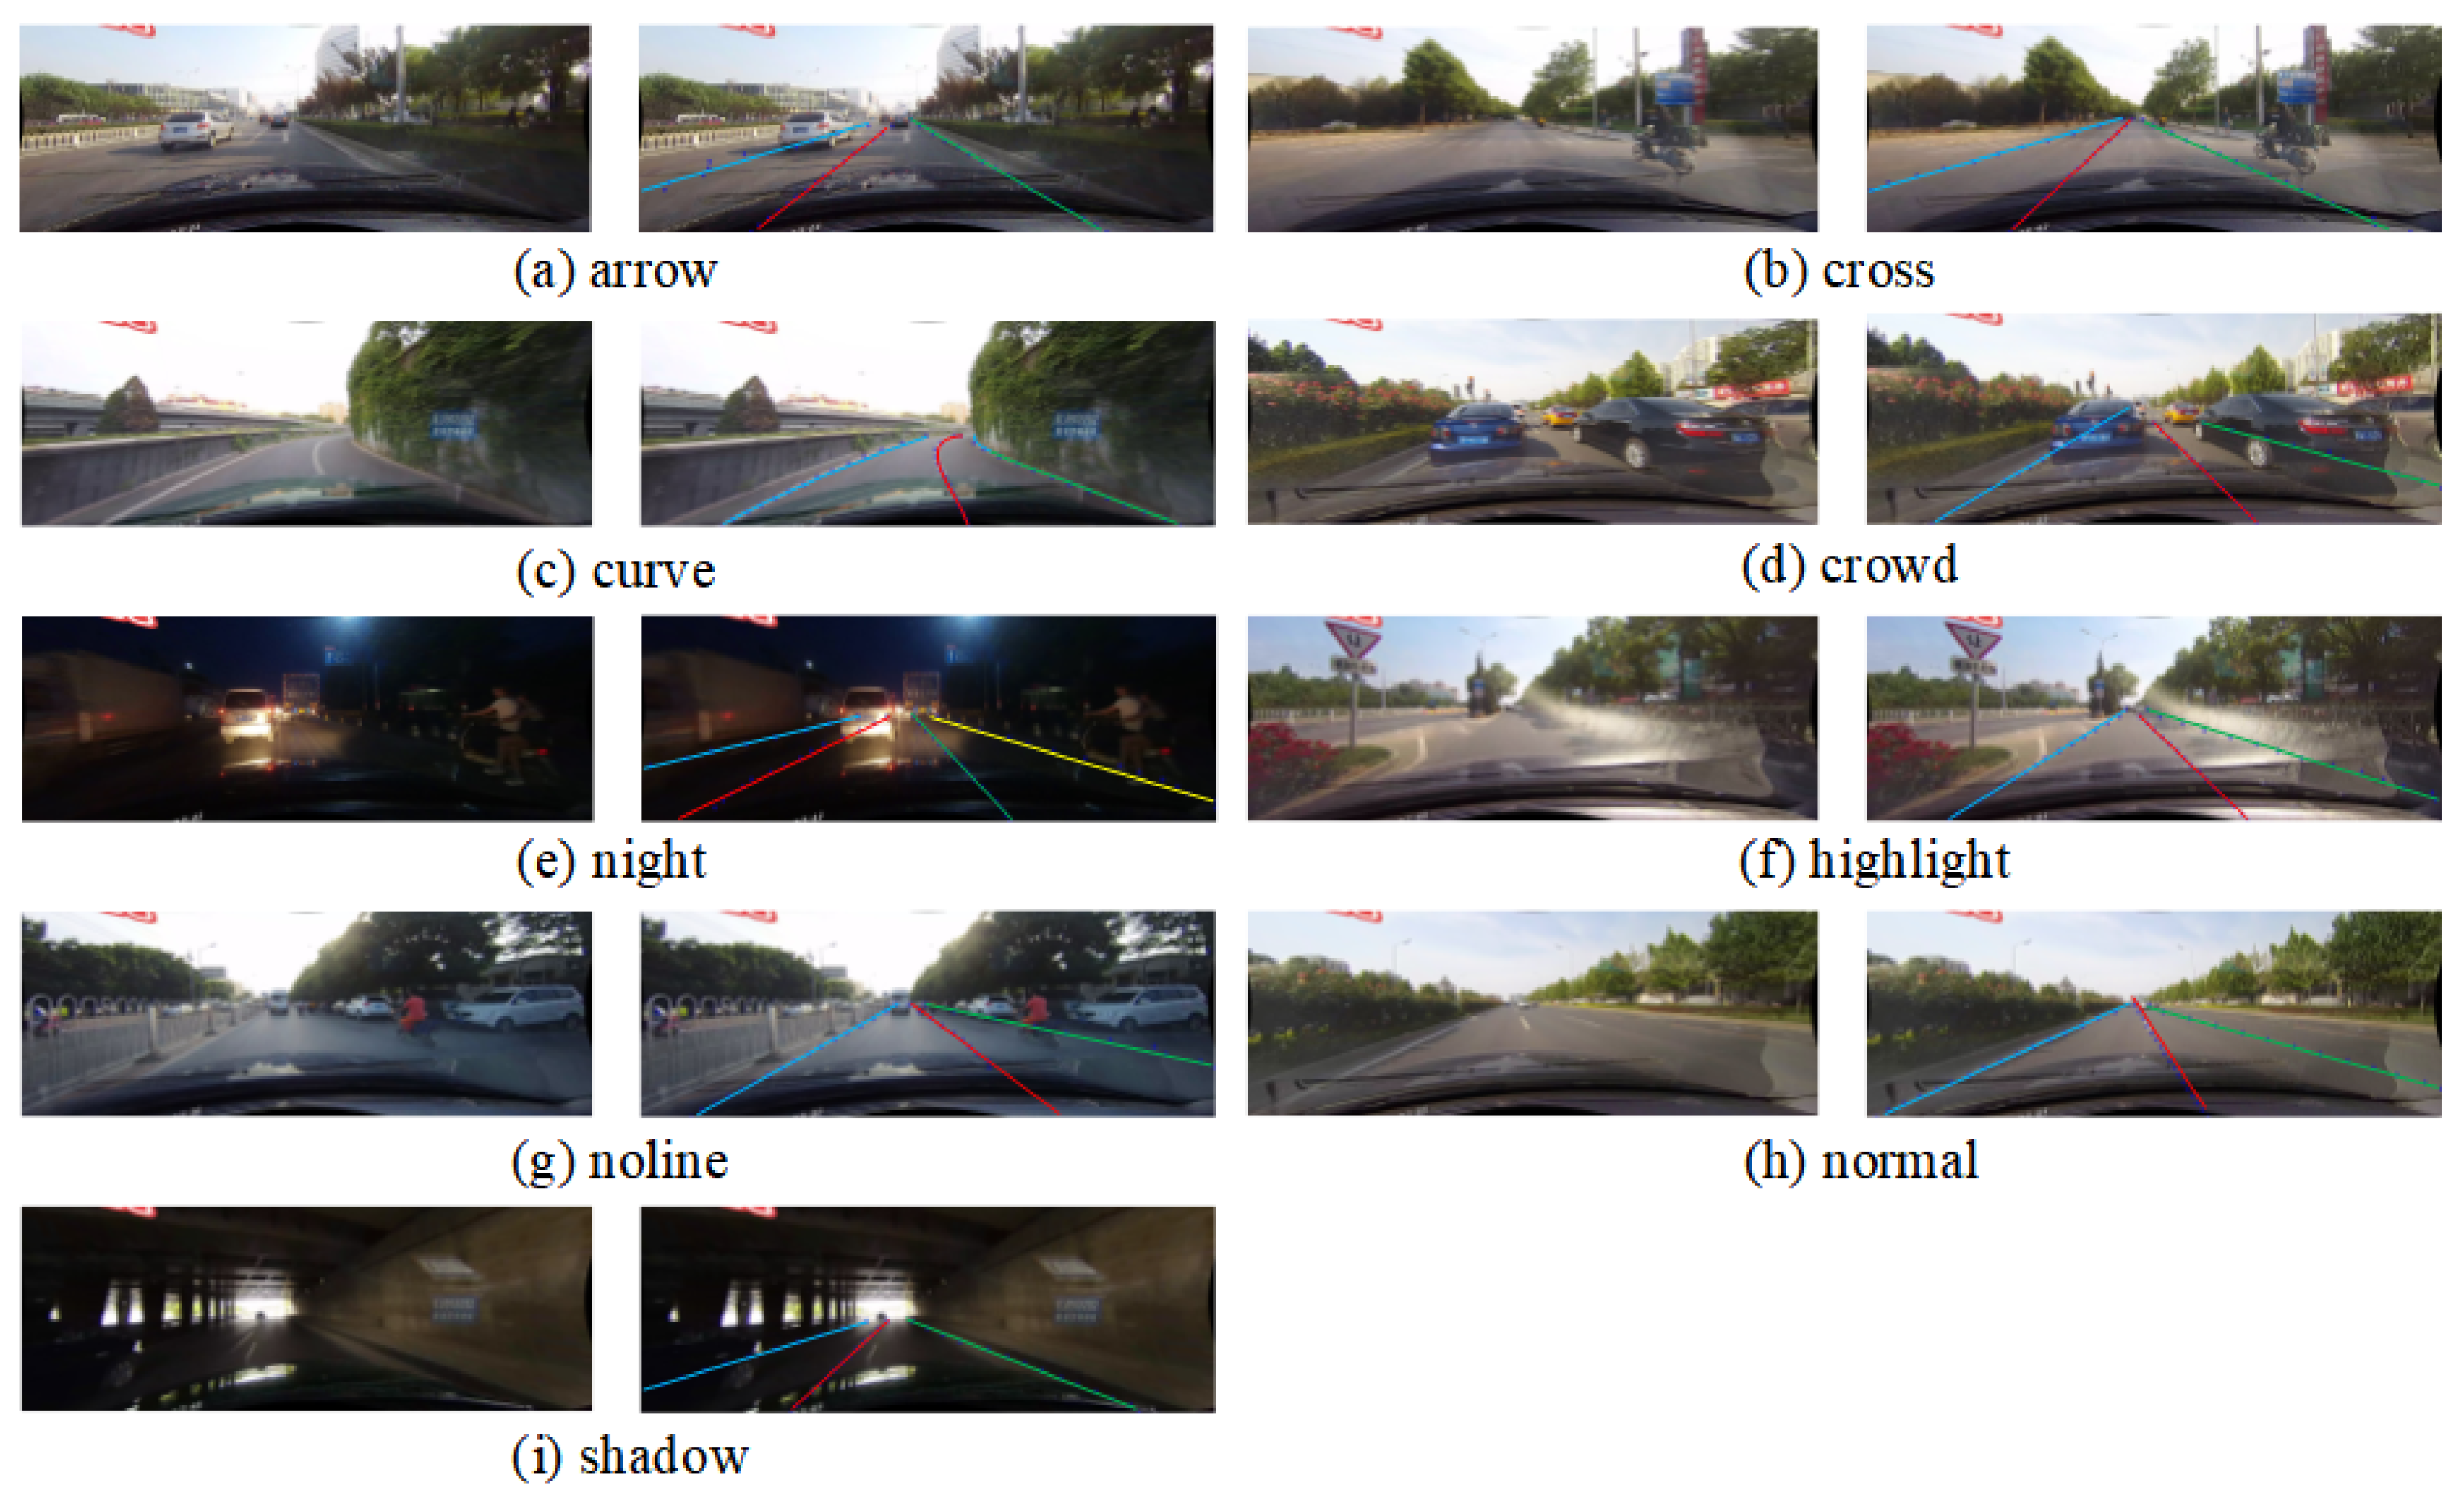
  • The method proposed in this paper was experimentally tested on two publicly available datasets: CULane and TuSimple. The results demonstrate that the F1 score on the CULane dataset reached 76%, while on the TuSimple dataset it increased to 96.9%. This indicates that the method is both efficient and effective in handling complex road scenarios, particularly under challenging conditions such as highlight, crowd, and night in multi-lane environments, achieving F1 scores of 69.3%, 74.4%, and 71.0%, respectively. Furthermore, this method exhibits excellent environmental adaptability and real-time processing capabilities, providing a reliable lane detection solution for autonomous vehicles.

Author Contributions

Conceptualization, Y.Z. (Yunfei Zha) and Z.L.; methodology, P.W. and Z.L.; software, Y.Z. (Yi Zhang) and Y.T.; validation, Z.L., P.W. and Y.Z. (Yunfei Zha); formal analysis, P.W. and Y.Z. (Yi Zhang); investigation, Z.L. and Y.T.; resources, Y.Z. (Yi Zhang) and P.W.; data curation, Z.L. and P.W.; writing—original draft preparation, Z.L. and P.W.; writing—review and editing, Z.L. and P.W.; visualization, Z.L.; supervision, Y.Z. (Yunfei Zha) and P.W.; project administration, P.W., Y.Z. (Yunfei Zha) and Z.L.; funding acquisition, Y.Z. (Yi Zhang) and Y.T. All authors have read and agreed to the published version of the manuscript.

Funding

This research was funded by the National Natural Science Foundation, China (No. 51705441), the National Key R&D Program, China (No. 2023YFB3406500), and the Educational Research Program for Young and Middle-aged Teachers of Fujian Province (No. JAT210349).

Data Availability Statement

The original contributions presented in the study are included in the article. Further inquiries can be directed to the corresponding author.

Conflicts of Interest

The authors declare no conflicts of interest.

References

  1. Maini, R.; Aggarwal, H. Study and comparison of various image edge detection techniques. Int. J. Image Process. (IJIP) 2009, 3, 1–11. [Google Scholar]
  2. Liang, D.; Guo, Y.C.; Zhang, S.K.; Mu, T.J.; Huang, X. Lane detection: A survey with new results. J. Comput. Sci. Technol. 2020, 35, 493–505. [Google Scholar]
  3. Zhang, J.Q.; Duan, H.B.; Chen, J.L.; Shamir, A.; Wang, M. HoughLaneNet: Lane detection with deep Hough transform and dynamic convolution. Comput. Graph. 2023, 116, 82–92. [Google Scholar]
  4. Zakaria, N.J.; Shapiai, M.I.; Abd Ghani, R.; Yassin, M.N.M.; Ibrahim, M.Z.; Wahid, N. Lane detection in autonomous vehicles: A systematic review. IEEE Access 2023, 11, 3729–3765. [Google Scholar]
  5. Yu, F.; Wu, Y.; Suo, Y.; Su, Y. Shallow detail and semantic segmentation combined bilateral network model for lane detection. IEEE Trans. Intell. Transp. Syst. 2023, 24, 8617–8627. [Google Scholar] [CrossRef]
  6. Bojarski, M.; Del Testa, D.; Dworakowski, D.; Firner, B.; Flepp, B.; Goyal, P.; Jackel, L.D.; Monfort, M.; Muller, U.; Zhang, J.; et al. End to end learning for self-driving cars. arXiv 2016, arXiv:1604.07316. [Google Scholar]
  7. Yang, Z.; Shen, C.; Shao, W.; Xing, T.; Hu, R.; Xu, P.; Chai, H.; Xue, R. LDTR: Transformer-based lane detection with anchor-chain representation. Comput. Vis. Media 2024, 10, 753–769. [Google Scholar]
  8. Liu, B.; Ling, Q. Hyper-Anchor Based Lane Detection. IEEE Trans. Intell. Transp. Syst. 2024, 25, 13240–13252. [Google Scholar]
  9. Tabelini, L.; Berriel, R.; Paixao, T.M.; Badue, C.; De Souza, A.F.; Oliveira-Santos, T. Polylanenet: Lane estimation via deep polynomial regression. In Proceedings of the 25th International Conference on Pattern Recognition (ICPR), Milan, Italy, 10–15 January 2021; pp. 6150–6156. [Google Scholar]
  10. Van Gansbeke, W.; De Brabandere, B.; Neven, D.; Proesmans, M.; Van Gool, L. End-to-end lane detection through differentiable least-squares fitting. In Proceedings of the IEEE/CVF International Conference on Computer Vision Workshops, Seoul, Republic of Korea, 27 October–2 November 2019. [Google Scholar]
  11. Pan, X.; Shi, J.; Luo, P.; Wang, X.; Tang, X. Spatial as deep: Spatial CNN for traffic scene understanding. In Proceedings of the AAAI Conference on Artificial Intelligence, New Orleans, LA, USA, 2–7 February 2018; pp. 32–38. [Google Scholar]
  12. Neven, D.; De Brabandere, B.; Georgoulis, S.; Proesmans, M.; Van Gool, L. Towards end-to-end lane detection: An instance segmentation approach. In Proceedings of the IEEE Intelligent Vehicles Symposium (IV), Changshu, China, 26–30 June 2018; pp. 286–291. [Google Scholar]
  13. Xu, H.; Wang, S.; Cai, X.; Zhang, W.; Liang, X.; Li, Z. Curvelane-NAS: Unifying lane-sensitive architecture search and adaptive point blending. In Computer Vision—ECCV 2020: 16th European Conference, Glasgow, UK, 23–28 August 2020; Springer International Publishing: Berlin/Heidelberg, Germany, 2020; pp. 689–704. [Google Scholar]
  14. Che, Q.H.; Nguyen, D.P.; Pham, M.Q.; Lam, D.K. TwinLiteNet: An efficient and lightweight model for driveable area and lane segmentation in self-driving cars. In Proceedings of the International Conference on Multimedia Analysis and Pattern Recognition (MAPR), Quy Nhon, Vietnam, 5–6 October 2023; pp. 1–6. [Google Scholar]
  15. Wang, J.; Wu, Q.M.J.; Zhang, N. You only look at once for real-time and generic multi-task. IEEE Trans. Veh. Technol. 2024, 73, 12625–12637. [Google Scholar]
  16. Tabelini, L.; Berriel, R.; Paixao, T.M.; Badue, C.; De Souza, A.F.; Oliveira-Santos, T. Keep your eyes on the lane: Real-time attention-guided lane detection. In Proceedings of the IEEE/CVF Conference on Computer Vision and Pattern Recognition, Nashville, TN, USA, 19–25 June 2021; pp. 294–302. [Google Scholar]
  17. Su, J.; Chen, C.; Zhang, K.; Luo, J.; Wei, X.; Wei, X. Structure guided lane detection. arXiv 2021, arXiv:2105.05403. [Google Scholar]
  18. Zheng, T.; Huang, Y.; Liu, Y.; Tang, W.; Yang, Z.; Cai, D.; He, X. CLRNet: Cross layer refinement network for lane detection. In Proceedings of the IEEE/CVF Conference on Computer Vision and Pattern Recognition, New Orleans, LA, USA, 18–24 June 2022; pp. 898–907. [Google Scholar]
  19. Bäcklund, H.; Hedblom, A.; Neijman, N. A density-based spatial clustering of applications with noise. Data Min. TNM033 2011, 33, 11–30. [Google Scholar]
  20. Liang, J.; Zhou, T.; Liu, D.; Wang, W. ClustSeg: Clustering for universal segmentation. arXiv 2023, arXiv:2305.02187. [Google Scholar]
  21. Neubeck, A.; Van Gool, L. Efficient non-maximum suppression. In Proceedings of the 18th International Conference on Pattern Recognition (ICPR’06), Hong Kong, China, 20–24 August 2006; pp. 850–855. [Google Scholar]
  22. Shepley, A.J.; Falzon, G.; Kwan, P.; Brankovic, L. Confluence: A robust non-IoU alternative to non-maxima suppression in object detection. IEEE Trans. Pattern Anal. Mach. Intell. 2023, 45, 11561–11574. [Google Scholar] [CrossRef] [PubMed]
  23. Chen, G.H.; Zhou, W.; Wang, F.J.; Xiao, B.J.; Dai, S.F. Lane detection based on improved Canny detector and least square fitting. Adv. Mater. Res. 2013, 765, 2383–2387. [Google Scholar] [CrossRef]
  24. He, K.; Zhang, X.; Ren, S.; Sun, J. Deep residual learning for image recognition. In Proceedings of the IEEE Conference on Computer Vision and Pattern Recognition, Las Vegas, NV, USA, 27–30 June 2016; pp. 770–778. [Google Scholar]
  25. Lin, T.Y.; Dollár, P.; Girshick, R.; He, K.; Hariharan, B.; Belongie, S. Feature pyramid networks for object detection. In Proceedings of the IEEE Conference on Computer Vision and Pattern Recognition, Honolulu, HI, USA, 21–26 July 2017; pp. 2117–2125. [Google Scholar]
  26. Kao, Y.; Che, S.; Zhou, S.; Guo, S.; Zhang, X.; Wang, W. LHFFNet: A hybrid feature fusion method for lane detection. Sci. Rep. 2024, 14, 16353. [Google Scholar]
  27. Yu, F.; Koltun, V. Multi-scale context aggregation by dilated convolutions. arXiv 2015, arXiv:1511.07122. [Google Scholar]
  28. Hu, J.; Shen, L.; Sun, G. Squeeze-and-excitation networks. In Proceedings of the IEEE Conference on Computer Vision and Pattern Recognition, Salt Lake City, UT, USA, 18–22 June 2018; pp. 7132–7141. [Google Scholar]
Figure 1. Lane detection network framework.
Electronics 14 01283 g001
Figure 2. Residual structure.
Electronics 14 01283 g002
Figure 3. Feature pyramid structure.
Electronics 14 01283 g003
Figure 4. SE module structure.
Electronics 14 01283 g004
Figure 5. SE Resnet module.
Electronics 14 01283 g005
Figure 6. Lane detection results in complex environments.
Electronics 14 01283 g006
Table 1. Results of lane detection on the CULane dataset.
MethodNormalCrowdNightNo-LineShadowArrowHighlightCurveCrossTotalFPS/f · s 1
E2Enet91.0%73.1%67.9%46.6%74.1%85.8%64.5%71.9%202274.0%-
SCNN90.6%69.7%66.1%43.4%66.9%84.1%58.5%64.4%199071.6%7.5
LaneATT91.1%73.0%69.0%48.4%70.9%85.5%65.7%63.4%117075.0%250
UFLD90.7%70.2%66.7%44.4%69.3%85.7%59.5%69.5%203772.3%322.5
Ours92.8%74.4%71.0%47.9%75.7%88.5%88.5%70.6%165376.0%51.8
Table 2. Results of lane detection on the TuSimple dataset.
MethodF1AccFPFN
ResNet-1887.8%95.8%19.0%3.9%
ResNet-3488.0%95.8%18.9%3.7%
LaneNet94.8%96.4%7.8%2.4%
PolyLaneNet90.6%93.3%9.4%9.3%
Res34-SAD95.9%96.6%6.0%2.0%
SCNN96.0%96.5%6.2%1.8%
Ours96.9%96.8%7.8%2.3%
Table 3. Results of ablation experiment.
MethodABCF1
Baseline×××66.7%
Baseline+A+B×75.16%
Baseline+B+C×73.59%
Baseline+A+C×74.83%
Baseline+A+B+C76.00%
Disclaimer/Publisher’s Note: The statements, opinions and data contained in all publications are solely those of the individual author(s) and contributor(s) and not of MDPI and/or the editor(s). MDPI and/or the editor(s) disclaim responsibility for any injury to people or property resulting from any ideas, methods, instructions or products referred to in the content.

