1. Introduction
The proliferation of Internet of Things (IoT) devices in the fast-digitizing era has led to an unprecedented flood of multivariate time series data across multiple domains. Although there is a lot of potential for insights and optimizations due to this abundance of data, there are also a lot of obstacles to overcome, especially when it comes to guaranteeing the security and dependability of IoT systems. Deviations from expected behaviour are indicated by anomalies in multivariate time series data, and if they go unnoticed, they can negatively impact the integrity and performance of the system.
Time series data is widely used in many different fields and provides insightful information on trends, patterns, and anomalies. The subject of Multivariate Time Series Anomaly Detection (MVTSAD) has shown notable progress in recent times due to the implementation of many approaches, such as deep learning, machine learning, and traditional statistical techniques.
Three general categories can be used to classify anomaly detection techniques: hybrid analytics, fully data-driven approaches, and model-based analytics. These techniques are essential for examining sensor readings that include a variety of data formats, including pictures, videos, and time series data. In multi-sensor Internet of Things (IoT) systems, where massive volumes of data are continuously created, machine learning techniques are especially important for MVTSAD. Prior research has emphasized the significance of diverse machine learning methodologies in the extraction of advanced information from Internet-of-Things data and the evaluation of their benefits and drawbacks [
1]. Because of its potential to speed up analytics and learning in Internet of Things applications, deep learning, a sophisticated family of machine learning techniques, has attracted a lot of attention [
2]. For anomaly identification in multivariate time series data, methods including Autoencoders, Transformers, Graph Neural Networks (GNNs), Convolutional Neural Networks (CNNs), Recurrent Neural Networks (RNNs), and Autoencoders have been investigated [
3].
An unsupervised artificial neural network called an autoencoder has been widely employed for time series anomaly identification. Among the variations used to capture temporal dependencies and spatial correlations are Convolutional Autoencoders (CAEs) and Multiple-Layer Perceptrons Autoencoders (MLP-AE). Modelling data distributions and allowing the generation of anomaly scores using probability measures, variational autoencoders, or VAEs provide a probabilistic method for anomaly identification [
4].
Using a min–max adversarial game between a generator and a discriminator to discern between real and fake data, Generative Adversarial Networks (GANs) have become highly effective tools for anomaly detection. The adaptability of GANs in finding anomalies in time series data is demonstrated by techniques like Multivariate Anomaly Detection with Generative Adversarial Networks (MAD-GAN) [
5]. For the purpose of concurrently collecting temporal dependencies and inter-sensor correlations, Graph Neural Networks (GNNs) have gained popularity in MVTSAD [
6]. By incorporating spatial connections among sensors and temporal dependencies in multivariate time series data, graph-based representations are used by Graph Deviation Networks (GDNs) and Graph Attention Networks (GATs) to improve anomaly detection [
6,
7].
Machine learning and deep learning-based anomaly detection techniques have become essential for ensuring the security and reliability of IoT systems, particularly in the face of increasingly sophisticated cyber threats and the inherent complexity of multivariate time series data generated by IoT devices. Adversarial attacks, which deliberately manipulate data to mislead detection systems, have driven the development of robust anomaly detection methods designed to withstand adversarial perturbations [
8,
9]. The creation of realistic datasets, such as the IoT botnet dataset proposed [
10], plays a critical role in enabling comprehensive evaluations of detection models under conditions that reflect real-world IoT environments.
When applied to the dynamic and heterogeneous nature of time series data generated by IoT devices, traditional anomaly detection approaches frequently fail. As a result of these difficulties, there is an urgent need for creative methods that can distinguish abnormalities among the complexity of Internet of Things environments [
11]. An unexplored field in anomaly detection for time series data is the implementation of transformer-based models, especially when handling multimodal and complex temporal connections. To guarantee their dependability in crucial applications, more research is needed on the interpretability and explainability of anomaly detection models. By enhancing anomaly detection accuracy, adaptability, and interpretability, MVTSAD frameworks that incorporate sophisticated deep learning techniques like transformers may be able to close these gaps and further the field. In this research, an innovative paradigm for natural language processing—transformer architecture—is suggested to be used for anomaly identification in multivariate time series data in Internet of Things ecosystems.
Prominent for its self-attention mechanism, the transformer architecture has proven remarkably effective at extracting intricate patterns and correlations from sequential data [
12]. Transformer design provides a promising way to tackle the complexities of anomaly identification in time series data by dynamically evaluating the significance of each piece within an input sequence. This is especially relevant in Internet-of-Things scenarios when there are erratic sampling intervals, a variety of data modalities, and a need for real-time reaction. Thus, the transformer was chosen primarily for this research due to its self-attention mechanism, which excels at capturing long-range dependencies and global contextual information, capabilities that traditional RNNs, prone to vanishing gradients and sequential processing, often lack [
13]. Additionally, unlike CNNs that focus on local feature extraction, transformers efficiently model complex temporal dynamics in multivariate time series data and readily integrate with adversarial perturbation techniques, enhancing robustness and overall performance in dynamic IoT environments. The motivation behind our work is to address the growing challenges of anomaly detection in dynamic IoT environments, where traditional methods (e.g., RNNs and CNNs) struggle with capturing long-range dependencies and adapting to volatile data patterns [
14,
15,
16,
17,
18,
19,
20].
The main goal of this research is to optimize transformer-based models for time series data provided by IoT devices in order to detect anomalies. Our goal is to improve anomaly detection capabilities by utilizing the transformer architecture’s adaptability and flexibility, which will strengthen the security and reliability of IoT systems [
21,
22,
23,
24,
25,
26]. While [
23] provides a valuable botnet dataset, it lacks representation of emerging IoT protocols (e.g., MQTT, LoRaWAN) and adversarial attack patterns. Real-World Validation: Most defences proposed by [
22,
24] are evaluated in simulated environments, raising questions about their efficacy in noisy, real-world IoT networks. Scalability: Though [
25,
26] improve edge deployment, their framework requires further testing across heterogeneous IoT hardware (e.g., ultra-low-power microcontrollers). To do this, a strong thresholding mechanism must be put in place; representation learning must be improved through an adversarial perturbations mechanism, transformer design must be adjusted to better handle abnormalities in data, and evaluation frameworks must be developed for methodical comparison with currently available anomaly detection methods. We aim to enable IoT systems to proactively detect and mitigate abnormalities by integrating transformer design. This will help to nurture improved resilience and reliability in dynamic IoT environments.
This paper’s latter sections explore the Materials and Methods in
Section 2, the results and experiments of our suggested transformer-based anomaly detection paradigm in
Section 3, and the discussion of results in
Section 4. Our objective is to showcase the effectiveness and real-world relevance of our method for improving anomaly identification in multivariate time series data generated by the Internet of Things through meticulous examination and assessment.
2. Materials and Methods
2.1. Dataset Selection and Preprocessing
The creation and assessment of anomaly detection models in the field of Multivariate Time Series Anomaly Detection (MVTSAD) heavily depends on the choice of relevant datasets and the use of strict preprocessing methods. In order to guarantee the accuracy and reliability of our findings, a thorough preparation workflow and the datasets used for our study are described in this part and summarized in
Table 1. The datasets for this study were selected based on their ability to represent diverse IoT environments and their complexity in terms of multivariate time series data.
Our study makes use of a wide range of datasets that have been carefully selected to reflect various anomaly detection areas and issues. Among these datasets are:
Mars Science Laboratory (MSL) Curiosity Rover Dataset: The Curiosity rover collected time series data on environmental features on the Martian surface, which are included in this dataset. We investigate anomalies in the Martian environment, focusing on three nontrivial sequences (A4, C2, and T1) despite the particular difficulties associated with extraterrestrial environments.
Server Machine Dataset (SMD): The SMD dataset, which consists of stacked traces showing the resource usage of 28 computers in a computer cluster, provides information about server health and performance monitoring. We focus on machine-1-1, 2-1, 3-2, and 3-07 sequences in particular to look at unusual server behaviour.
Numenta Anomaly Benchmark (NAB): NAB offers a standardised methodology for assessing anomaly detection algorithms with real-world datasets like New York City taxi demand, temperature sensor data, and cloud computing CPU utilisation. For our research, we use a subset of real-known instances datasets, eliminating sequences that have inaccurate anomaly labelling.
Secure Water Treatment (SWaT): cybersecurity events and operational aspects from an actual water treatment plant. Through the use of security-related anomalies and the simulation of potential assaults, SWaT allows us to investigate anomaly detection in critical infrastructure systems in great detail.
In order to guarantee the dependability and efficiency of our anomaly detection analysis, we incorporate an improved preprocessing methodology that consists of these steps:
A scalable and modular function for importing and transforming data to standardised formats, handling complexity, and guaranteeing structural consistency is part of the data pipeline. With the use of an anomaly labelling function, abnormalities can be precisely identified, giving evaluation-critical ground truth data. To improve model generalisation, normalisation approaches are used to keep variable scales constant across datasets. In order to accurately represent time, time series data must be thoroughly pre-processed, which includes addressing anomalies, resampling, and timestamp alignment. By splitting data into smaller, overlapping windows, sliding window processing makes data more sensitive to fluctuations and helps extract temporal patterns. Partitioning datasets for training and validation with a strong cross-validation setup makes it easier to assess performance metrics and generalisation skills throughout different subsets.
Our goal is to construct reliable, robust, and domain-specific anomaly detection models that will progress the field of MVTSAD by carefully choosing datasets that reflect various domains and utilising an extensive preprocessing pipeline.
2.2. Methodology: Leveraging TAP Model and SPOT Mechanism for Anomaly Detection
The sequence of time series data
, of length
is used as an input for a transformer-based model
in order to detect adversarial observations using SPOT with threshold
is defined:
where
is the
quantile of output data. Non-anomolies data points
for
is given as follows:
where
for
The
transformation
is estimated as cumulative distribution function using parameters
(scale value) and
(shape value):
For and
Adversarial perturbation
is obtained by maximizing the loss function
:
where
is the true identity, and
is the perturbation value. The transformer based adversarial iteration is performed to mitigate the perturbation model as follows:
where
are the training parameters at
, and
is the learning rate.
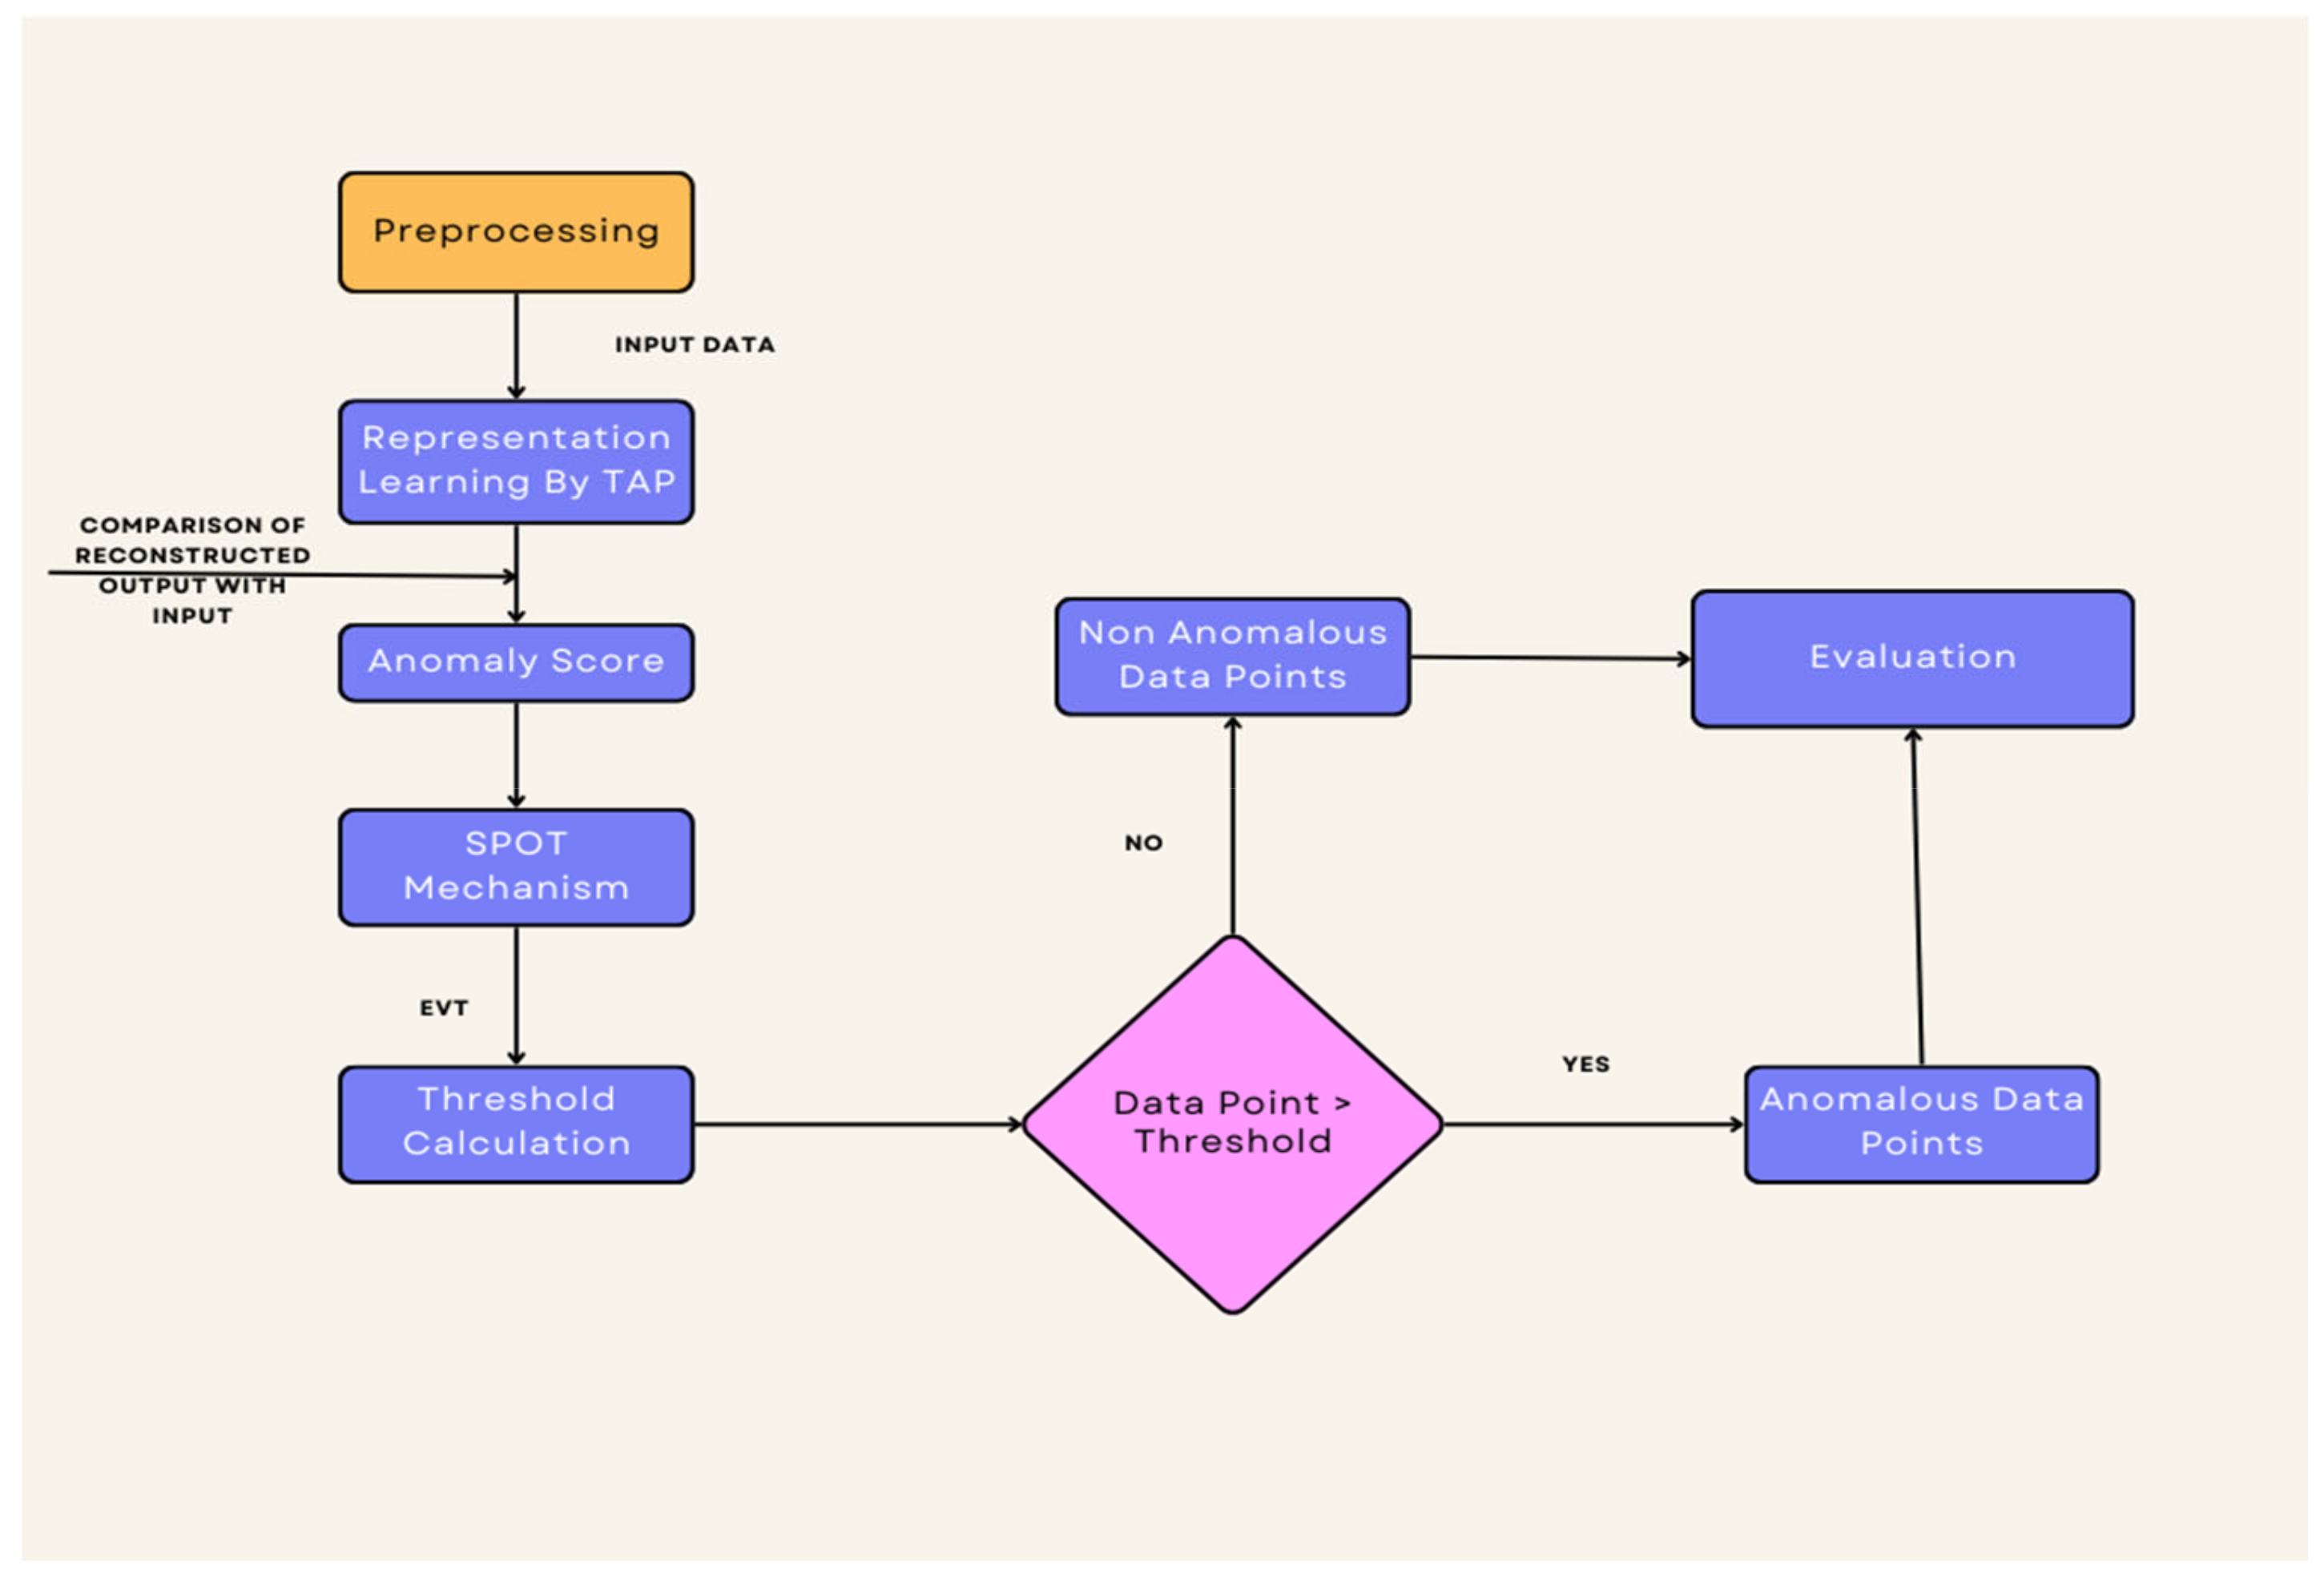
For efficient anomaly identification in multivariate time series data, we integrate the Streaming Peaks-Over-Threshold (SPOT) mechanism with the transformer-based Adversarial Perturbations (TAP) model in our suggested methodology as shown in
Figure 1. To improve the robustness and accuracy of anomaly identification systems, this novel strategy combines cutting-edge machine learning techniques with real-time anomaly detection approaches. We’ve listed the main steps in our process below:
The raw multivariate time series data is pre-processed to handle different data modalities and uneven sampling intervals before anomaly identification. Data consistency and compatibility for input into the TAP model and SPOT mechanism are ensured with this pre-processing phase. Essential hyperparameters like as the amount of features, learning rate, batch size, and window size are set up at the beginning of the TAP model. The TAP model’s design and behaviour are defined by these parameters, which also affect the model’s capacity to recognise anomalies and capture temporal trends. Positional encoding is used to incorporate chronological information into the input data in order to improve the temporal awareness of the TAP model. The core of the TAP model is the transformer architecture, which consists of encoder and decoder layers. This architecture allows the multivariate time series data to be used to extract intricate temporal correlations and patterns.
The capacity of the TAP model to produce adversarial perturbations dynamically is one of its distinctive features, which is described in
Figure 2. The model gains enhanced robustness and anomaly detection capabilities by adjusting the input sequence according to the gradients of the reconstruction loss. This allows the model to adjust to possible adversarial attacks or modifications in the data. In order to minimise the Mean Squared Error (MSE) between the target sequence and the rebuilt sequence, the TAP model is trained using a reconstruction loss function. The model can learn representations of both normal and aberrant patterns in the multivariate time series data through this training procedure.
The SPOT mechanism is integrated to perform real-time anomaly detection on streaming data in tandem with the TAP model training. In order to recognise time series peaks that surpass predetermined limits, SPOT dynamically sets thresholds. This allows it to instantly detect anomalies and adjust to shifting data patterns. Based on the features of the streaming data, SPOT’s dynamic thresholding process assesses and modifies anomaly detection thresholds. Anomaly data points over the dynamically optimised criteria are detected by SPOT through the analysis of sequential data and the computation of anomaly scores. SPOT was chosen primarily because of its strong theoretical foundation in extreme value theory, which makes it particularly adept at dynamically adjusting thresholds in streaming data environments. In IoT applications, where data characteristics can change rapidly, SPOT’s ability to update thresholds in real time ensures that even rare and critical anomalies are effectively captured. Additionally, its focus on the statistical behaviour of extreme values allows for a lower false negative rate, which is crucial when the cost of missing an anomaly is high. While other dynamic thresholding methods exist, many of them either lack the robustness provided by extreme value theory or struggle with computational efficiency in real-time scenarios. SPOT strikes a balance between theoretical rigour, adaptability, and computational efficiency, making it an optimal choice for enhancing the reliability and responsiveness of our transformer-based anomaly detection framework in dynamic IoT environments.
The integrated anomaly detection system’s performance is improved iteratively through the application of optimisation and fine-tuning approaches. This entails fine-tuning thresholding techniques, modifying hyperparameters, and improving model topologies in light of validation outcomes. Adversarial perturbations significantly enhance representation learning by deliberately introducing controlled noise during training, which forces the transformer to extract robust, invariant features rather than overfitting to specific noise patterns. This approach compels the model to focus on the core, underlying structure of the data, resulting in representations that are more resilient to minor input variations. By simulating worst-case scenarios, adversarial perturbations encourage the learning of smoother decision boundaries and a clearer distinction between normal and anomalous patterns. Consequently, this not only acts as a powerful regulariser to prevent overfitting but also improves the model’s ability to capture complex temporal dependencies and interrelationships in multivariate time series data from IoT devices, ultimately leading to more reliable anomaly detection.
Finally, relevant measures like True Positives, False Positives, True Negatives, and False Negatives are used to assess the performance of the integrated TAP model and SPOT mechanism. On labelled datasets, validation studies are carried out to evaluate the precision and potency of anomaly detection. To understand the functionality and behaviour of the combined TAP model and SPOT mechanism, the findings of anomaly detection tests are examined and assessed.
To sum up, our approach takes advantage of the complimentary advantages of the SPOT mechanism and the TAP model to provide reliable and timely anomaly identification in multivariate time series data. Our goal is to create a highly accurate and responsive anomaly detection system that can recognise anomalous patterns and possible dangers in a variety of real-world applications by fusing cutting-edge machine learning techniques with dynamic thresholding algorithms.
3. Results
We present a thorough examination of the outcomes of using the transformer-based multivariate time series anomaly detection model in this part. Our goal is to evaluate the model’s performance in identifying anomalies in a variety of datasets and offer insights into its advantages and disadvantages.
We assess the overall performance of the model using a variety of performance indicators, such as the area under the receiver operating characteristic curve (AUC-ROC), F1-score, precision, and recall. These metrics provide a thorough insight into how well the model detects abnormalities with the least amount of false positives. For evaluation, several multivariate time series datasets with various real-world circumstances are used.
Table 2 shows the training times used for each dataset.
We use a training graph, often called a training curve or training plot, which is a graphic representation of a model’s performance indicators during training. Typically, the graph shows the variance in the performance metric over the epochs or iterations of the training method.
An examination of the NAB dataset’s findings reveals encouraging performance metrics: throughout training, the model demonstrates efficient learning, as evidenced by a steady drop in loss (L1) between Epochs 0 and 4 as shown in
Figure 3. A threshold of 0.0562 is reached in testing to achieve a balanced precision-recall trade-off, which results in high precision, recall, and F1-score, as stated in
Table 3. With 24 true positives, 4005 true negatives, and very few false positives and false negatives in the confusion matrix, the ROC/AUC score of 0.9996 indicates exceptional discriminative ability.
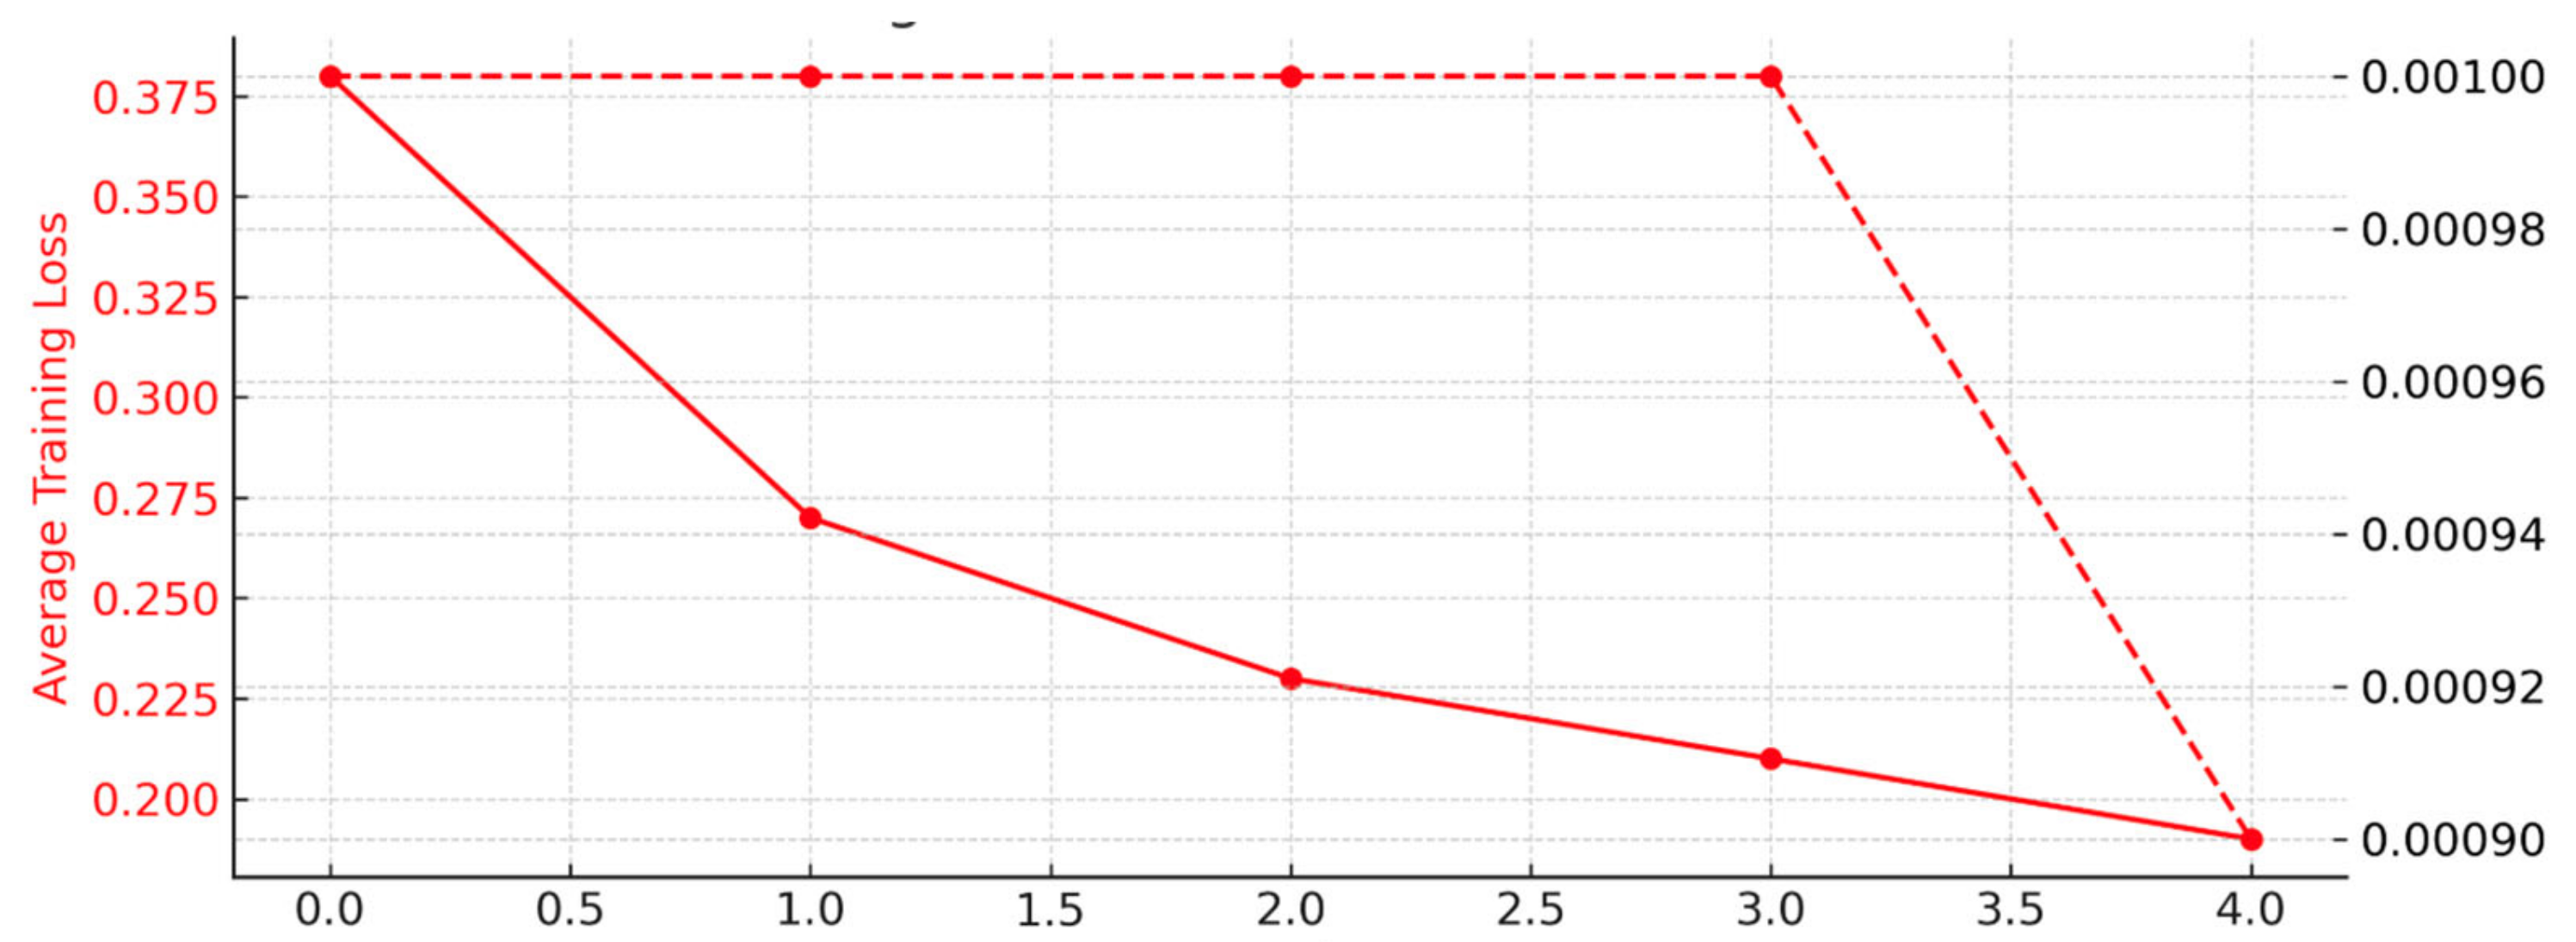
The model performs well as demonstrated by the MSL dataset results in
Figure 4 and
Table 4, which show a steady decrease in loss (L1) across five epochs throughout the training phase, indicating efficient learning. The model exhibits great recall, precision, and F1-score during testing, peaking at 0.9495. The model’s remarkable discriminative performance is demonstrated by an ROC/AUC score of 0.9916, which is corroborated by a thorough analysis of the confusion matrix.
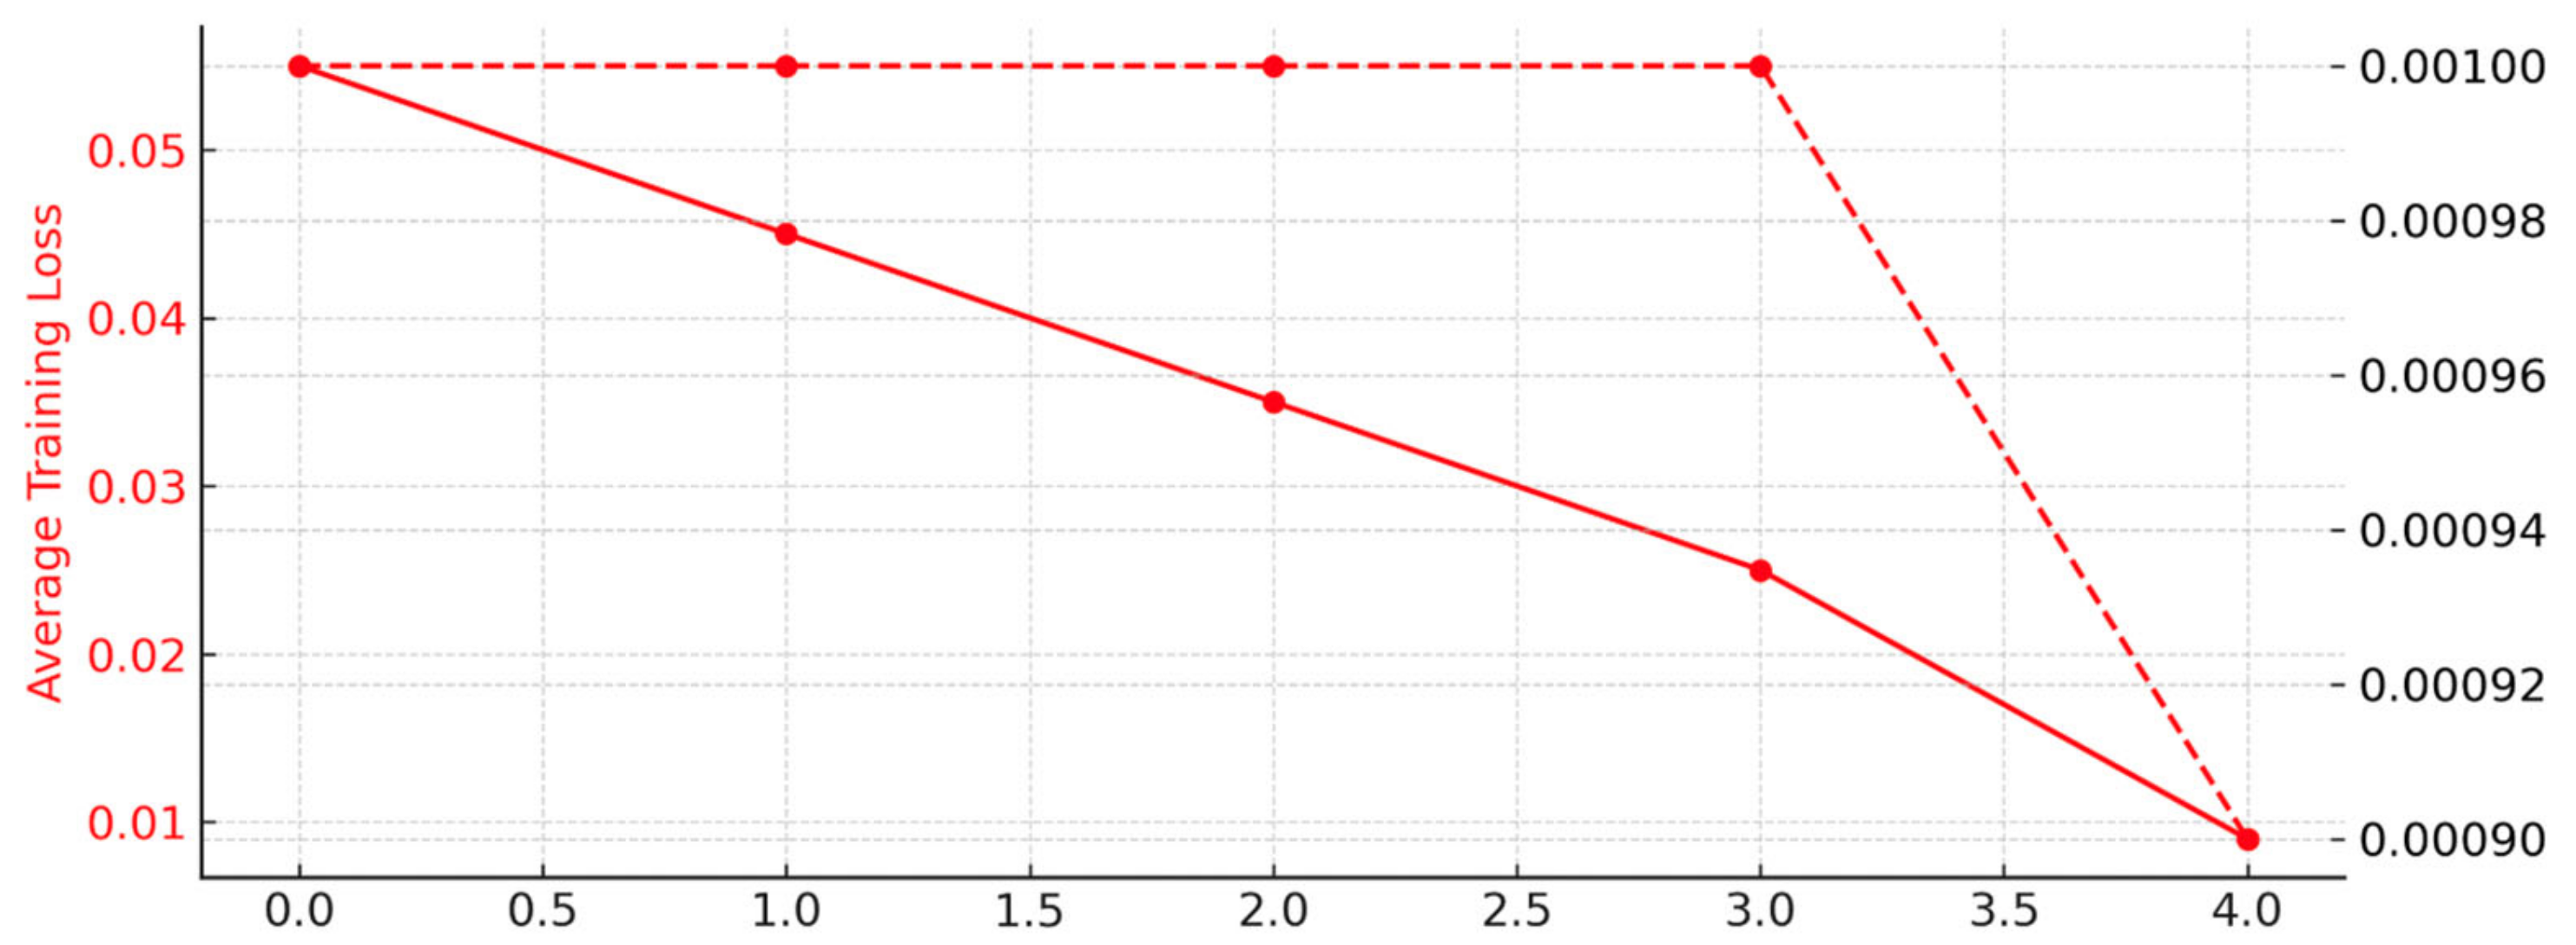
The model’s efficacy is demonstrated by the evaluation of the SWaT dataset in
Figure 5 and
Table 5, where a consistent reduction in loss (L1) over five epochs during the training phase indicates successful learning. High recall, precision, and F1-score are noted throughout the testing phase, with an F1-score of 0.8143 attained. Strong discriminative power is indicated by the ROC/AUC score of 0.8438, which is backed by low rates of false positives and false negatives in the confusion matrix.
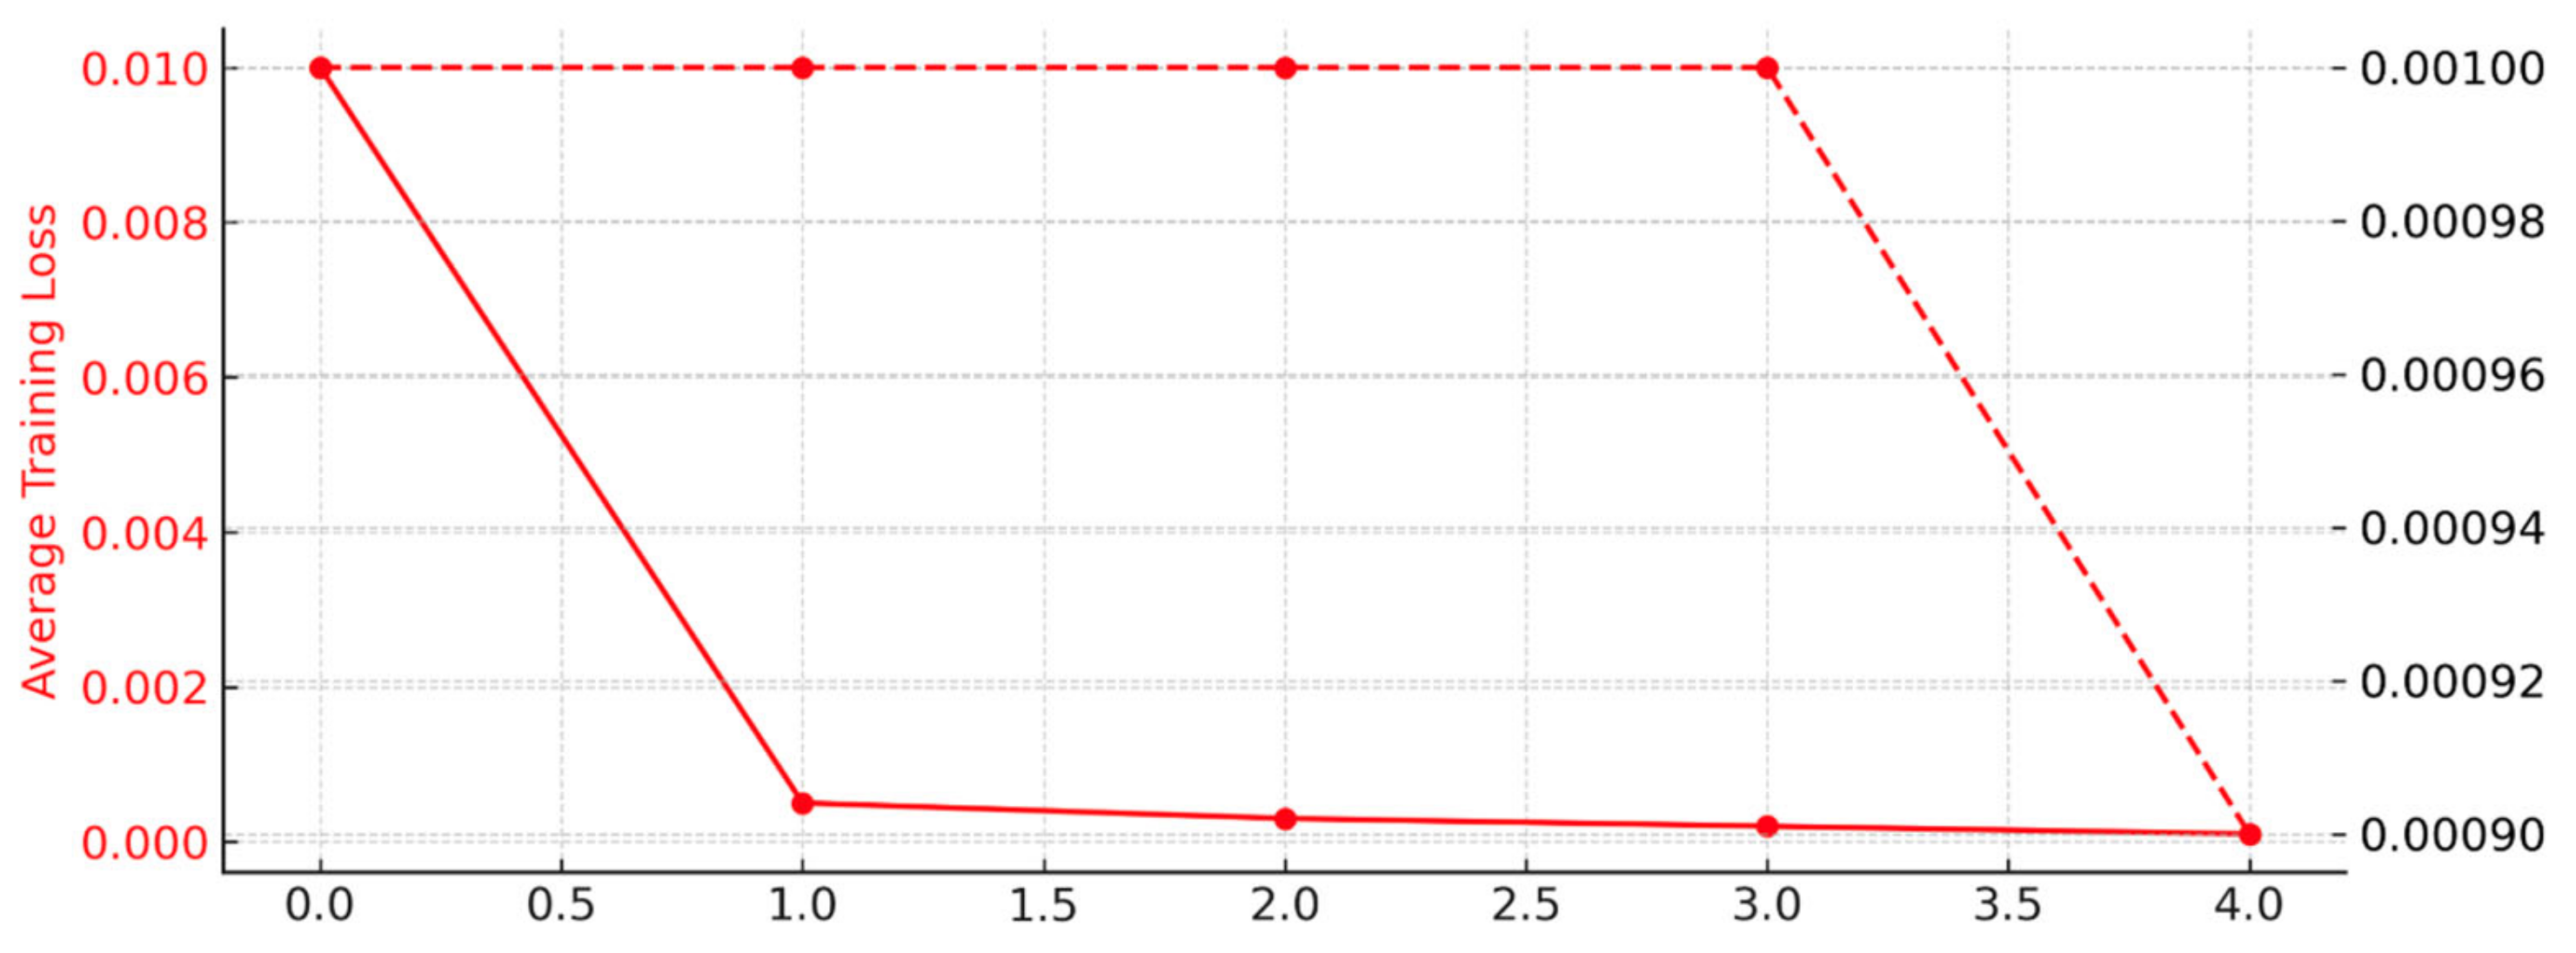
The SMD dataset results in
Figure 6 and
Table 6 highlight the model’s exceptional performance: during five epochs during the training phase, there is a continuous decrease in loss (L1), indicating effective learning. Outstanding recall, F1-score, and precision are attained throughout the testing phase, with a peak of 0.9981. Excellent discriminative ability is demonstrated by the ROC/AUC score of 0.9986, which shows few instances of false positives and false negatives in the confusion matrix.
Overall, the results analysis demonstrates the outstanding performance of the transformer-based anomaly detection model on a variety of multivariate time series datasets. The model’s great ROC/AUC scores, high accuracy, recall, and F1 score demonstrate its efficacy in identifying anomalies while reducing false positives and false negatives. These results support the model’s possible use in a variety of real-world applications for anomaly detection in intricate temporal data contexts and offer insightful information about the model’s capabilities. These empirical results not only validate the model’s technical soundness but also underscore its practical applicability in real-world scenarios. The ability to accurately detect anomalies in complex temporal data environments is crucial for various industries, including finance, healthcare, manufacturing, and cybersecurity. For instance, in financial systems, early detection of irregular transactions can prevent fraudulent activities; in healthcare, identifying unusual patient vitals can facilitate prompt medical interventions; in manufacturing, spotting deviations in machinery data can avert potential equipment failures; and in cybersecurity, recognising atypical network traffic can thwart potential security breaches.
Moreover, the model’s architecture is designed to handle the intricacies of multivariate time series data effectively. By leveraging the self-attention mechanism inherent in transformer architectures, the model captures long-range dependencies and complex interrelationships among multiple variables. This capability is particularly advantageous in scenarios where anomalies may not be evident when examining individual variables in isolation but become apparent when considering the collective behaviour of all variables. In addition to its detection capabilities, the model exhibits resilience to noise and adaptability to various data distributions. This robustness ensures consistent performance even when faced with data irregularities or shifts, which are common in dynamic real-world environments. Such reliability is essential for deploying anomaly detection systems in operational settings where data quality cannot always be guaranteed.
4. Discussion
The Adversarial Perturbation Transformer Architecture (TAP) introduces an innovative approach to anomaly detection within Internet-of-Things (IoT) systems by seamlessly integrating adversarial perturbations with transformer-based architectures. This fusion enhances the model’s capability to accurately identify anomalies in multivariate time series data. Through rigorous evaluations of multiple public datasets, TAP has demonstrated superior performance, showcasing its flexibility and resilience in real-world anomaly detection scenarios. Its proficiency in detecting intricate patterns and irregularities across diverse datasets underscores its potential to significantly enhance the stability and reliability of IoT infrastructures. The TAP model’s architecture is meticulously designed to address the complexities inherent in IoT data. By employing a transformer-based framework, TAP effectively captures long-range dependencies and temporal correlations within the data, which are crucial for identifying subtle anomalies that traditional models might overlook. The incorporation of adversarial perturbations during the training phase serves to robustify the model, enabling it to maintain high detection accuracy even in the presence of noise and unforeseen data variations.
Comparative analyses with existing benchmarks, such as the Anomaly Transformer and TranAD, highlight TAP’s distinct advantages. While these models have made significant strides in anomaly detection, TAP’s unique integration of adversarial training mechanisms equips it with enhanced robustness against adversarial attacks and data perturbations. This robustness is particularly vital in dynamic IoT environments, where data distributions are continually evolving, and the cost of false positives or negatives can be substantial. Moreover, TAP’s adaptability to various datasets implies that it can be generalized across different IoT applications, from industrial automation to smart city infrastructures, providing a versatile solution to anomaly detection challenges. Thus adversarial Perturbation Transformer Architecture stands out as a robust and adaptable model for anomaly detection in IoT systems. Its innovative combination of transformer-based structures with adversarial perturbations not only enhances detection accuracy but also fortifies the model against the challenges posed by dynamic and noisy data environments. As IoT ecosystems continue to expand and evolve, the integration of models like TAP will be instrumental in ensuring their security, reliability, and efficiency.
The TAP model shows encouraging results, but there are still a number of areas that could use more research and development. These include looking into more intricate transformer architectures to improve the model’s ability to capture complex temporal patterns, looking into additional features and data representations to improve anomaly detection robustness and accuracy in difficult environments, conducting extensive hyperparameter tuning to optimise performance across a variety of datasets and scenarios, and putting multiple models together using ensemble techniques to improve accuracy and reliability. Exploring the potential of the TAP model for anomaly diagnosis to provide deeper insights into underlying causes, developing techniques for improving model interpretability to facilitate understanding of results and enable actionable insights, concentrating on strategies for real-time deployment in IoT environments to ensure timely detection and response to anomalies, and continuing research efforts to address current limitations and expand capabilities for handling more complex anomaly detection tasks in a variety of IoT applications.
5. Conclusions
This research introduces the Adversarial Perturbation Transformer Architecture (TAP), which optimizes transformer-based models for anomaly detection in IoT time series data by incorporating adversarial perturbations. By leveraging the flexibility of the transformer design, TAP not only enhances detection capabilities but also strengthens the security and reliability of IoT systems. The Adversarial Perturbation Transformer Architecture (TAP) provides a novel and effective solution for anomaly detection in IoT systems, demonstrating superior performance in identifying anomalies in multivariate time series data across diverse datasets. Its use of adversarial perturbations and transformer-based design ensures flexibility, robustness, and adaptability in real-world scenarios, enhancing the stability and dependability of IoT infrastructure.
Our approach involves implementing a robust thresholding mechanism, advancing representation learning, and refining the transformer to better handle data irregularities. Demonstrating superior performance across diverse multivariate datasets, TAP’s innovative integration of adversarial perturbations ensures greater flexibility, robustness, and adaptability in real-world scenarios, ultimately enhancing the stability and dependability of IoT infrastructures. Motivated by the challenges posed by IoT-generated data, this study offers new perspectives and techniques to the anomaly detection community, enabling proactive detection and mitigation of abnormalities in dynamic environments. While the TAP model shows significant promise, future work should focus on advancing its capabilities, such as exploring more complex transformer architectures, incorporating diverse data representations, optimising hyperparameters, and leveraging ensemble techniques. Additionally, efforts to improve interpretability, facilitate real-time deployment, and address more intricate anomaly detection tasks will be critical for expanding its application in dynamic IoT environments.


