1. Introduction
In the past decade, interest in electroencephalographic (EEG) headsets has grown significantly as a direct link between the human brain and AI systems, fueling interdisciplinary research spanning neuroinformatics, robotics, and cognitive sciences. Challenges remain in extracting meaningful signals while reducing noise, as highlighted by Zander et al. [
1]. Early methodologies by He et al. [
2] advanced real-time EEG processing to decode cognitive and emotional states, laying the groundwork for neuroergonomics, a field merging neuroscience and ergonomics [
3]. Recent contributions, such as state-of-the-art architectures by [
4], continue to expand this domain. Applications range from cognitive state classification to device control via brain–computer interfaces (BCIs), exemplified by Wolpaw and McFarland [
5], who developed cursor control using EEG, and Nijholt and Tan [
6], who enhanced adaptability for untrained users. EEG’s intersection with AI has inspired concepts like “artificial consciousness”, with early theories by Gamez exploring EEG as feedback for adaptive AI systems [
7], and recent insights by Iovane and Landi on consciousness infostructures [
8]. Yuste et al. [
9] proposed that EEG could enable AI systems to model human states, enhancing their responsiveness to emotional and mental cues. EEG’s impact extends beyond AI, contributing to sleep research. Alves et al. [
10] developed an automated method to detect sleep microstructures, using neural networks and genetic algorithms for accurate CAP phase classification, aiding sleep disorder diagnosis. EEG also informs motor imagery (MI) studies in BCIs, as demonstrated by Yang et al. [
11], who compared virtual reality and traditional visual cues for task performance. EEG-controlled gaming offers both entertainment and therapeutic uses [
12]. In deception detection, Waleed et al. [
13] reviewed AI-EEG techniques like convolutional neural networks (CNNs) and support vector machines (SVMs), achieving high accuracy without monitoring physiological responses. EEG-based fatigue detection research by Chang et al. [
14] and advanced models like MST-DGCN by Chen et al. [
15] address dataset limitations and enhance feature extraction. Suwannarat et al. [
16] demonstrated effective BCI use with just nine electrodes, while Zhang et al. [
17] improved brain activity analysis through advanced sampling methods. Seok et al. [
18] tackled low-vigilance issues in traffic safety, and Islam S. et al. [
19] employed explainable AI (XAI) for stroke prediction, addressing critical interpretability challenges in AI-driven healthcare.
On the other hand, starting from the pioneering work in [
20], neuro-computing engines are appearing more and more interesting from different points of view. In the meantime, emotional and affective computing has enabled the move from fully rational AI to humanized AI [
21]. Great effort by the scientific community is devoted to emotional and affective experience in many fields and contexts, primarily to better understand and model intentions. Also, in the work of [
22], attention is paid to the complexity of decision-making, underlining that each decision-maker differently values the characteristics of the object targets, which is hard to include in the analysis.
Although neuroscience has significantly advanced our understanding of these mechanisms, AI research has primarily focused on replicating bioelectric processes, with biochemical modeling remaining largely underexplored [
23,
24].
Neuromorphic engineering, initiated by Carver Mead in 1989 [
25,
26,
27], serves as a foundational framework. Neuromorphic computing is an innovative approach to computing inspired by the functioning of the human brain. Unlike traditional methods, this paradigm seeks to replicate the structure and processes of the nervous system, such as neurons and synapses, to create more efficient, adaptive, and parallel systems. Among its main characteristics is the ability to process data in parallel. It stands out for its low energy consumption, and it is adaptable, whereas traditional AI relies on mathematical and statistical models to solve specific problems. While traditional AI models require large amounts of energy for training and processing, neuromorphic systems consume much less energy. Therefore, neuromorphic computing represents a significant step forward toward more efficient and natural AI. Drawing inspiration from biology, it offers a new approach to tackling complex problems in a sustainable and dynamic way, increasingly resembling the extraordinary capabilities of the human brain. In this context, as we will see, the objective of the present work is to develop a software solution that mimics the behavior of human biochemical intelligence, specifically neurotransmitters. Advances in spiking neural networks [
28,
29,
30] and neuromorphic hardware [
31,
32,
33,
34,
35,
36] illustrate the potential for brain-inspired, energy-efficient computing. This research aligns with such developments by introducing neurotransmitter-based inputs to artificial neural networks, bridging biochemical and computational paradigms. Then, the neurotransmitter paradigm is linked with emotive and affective computing. Notable works [
37,
38,
39,
40,
41,
42,
43,
44,
45] have introduced frameworks for emotional recognition and interaction, often based on speech, text, and visual stimuli. However, this research extends these paradigms by incorporating proprioceptive and biochemical stimuli, enabled by a complexity theory-based computational engine capable of simulating neurotransmitter dynamics. Using the Ekman model of emotions, this system analyzes the causal relationships between neurotransmitter states and emotional outputs.
In the context of decision support systems (DSSs), this study employs a model-driven framework grounded in complexity theory and informed by the principles of thermodynamics. Individual micro-states, characterized by distinct neurotransmitter intensities, are mapped to macro-states that represent collective emotional and affective outcomes. By leveraging this approach, the system transcends traditional diagnostic capabilities, offering actionable decision-making pathways—a critical advancement over the limitations of existing DSS methodologies [
46,
47,
48,
49,
50].
Following the introduction to the scientific context of neuromorphic computing and AI,
Section 2 is devoted to the model: how certain neurotransmitters are associated with various cognitive states, how they trigger or suppress, and how they shape emotional and affective experiences.
Section 3 introduces the method, that is, a DSS to model the impact of neurotransmitters on emotional, affective, and cognitive states.
Section 4 describes the implementation of the system, and the obtained results. Finally,
Section 5 summarizes the findings, discusses implications, and outlines possible future research directions.
2. The Model
Initially, neuroscience attributed brain function solely to electrical mechanisms. However, the discovery of neurotransmitters, such as acetylcholine, unveiled the biochemical underpinnings of neural signaling. While neuroscience has made substantial progress in elucidating these mechanisms, AI research has predominantly concentrated on replicating bioelectric processes, leaving biochemical modeling largely overlooked [
23,
24]. As is known, human behavior is mediated not only by a bioelectric brain infrastructure, but also by three biochemical systems, which are the nervous system with its biochemical component (i.e., the neurotransmitter system), the endocrine system (i.e., the hormonal system), and the immune system (i.e., the immunoglobulin system). For our purposes, in this paper, we will consider only the artificial reproduction of the nervous biochemical system to support the infrastructural nervous system (i.e., the neural system) [
51]. Indeed, we analyze the mapping between neurotransmitters’ excesses (+)/deficiencies (−) and cognitive states to put in place a modeler of cognitive states driven by neurotransmitters and quantified via indirect analysis thanks to EEG in the next sections. Taking the results in [
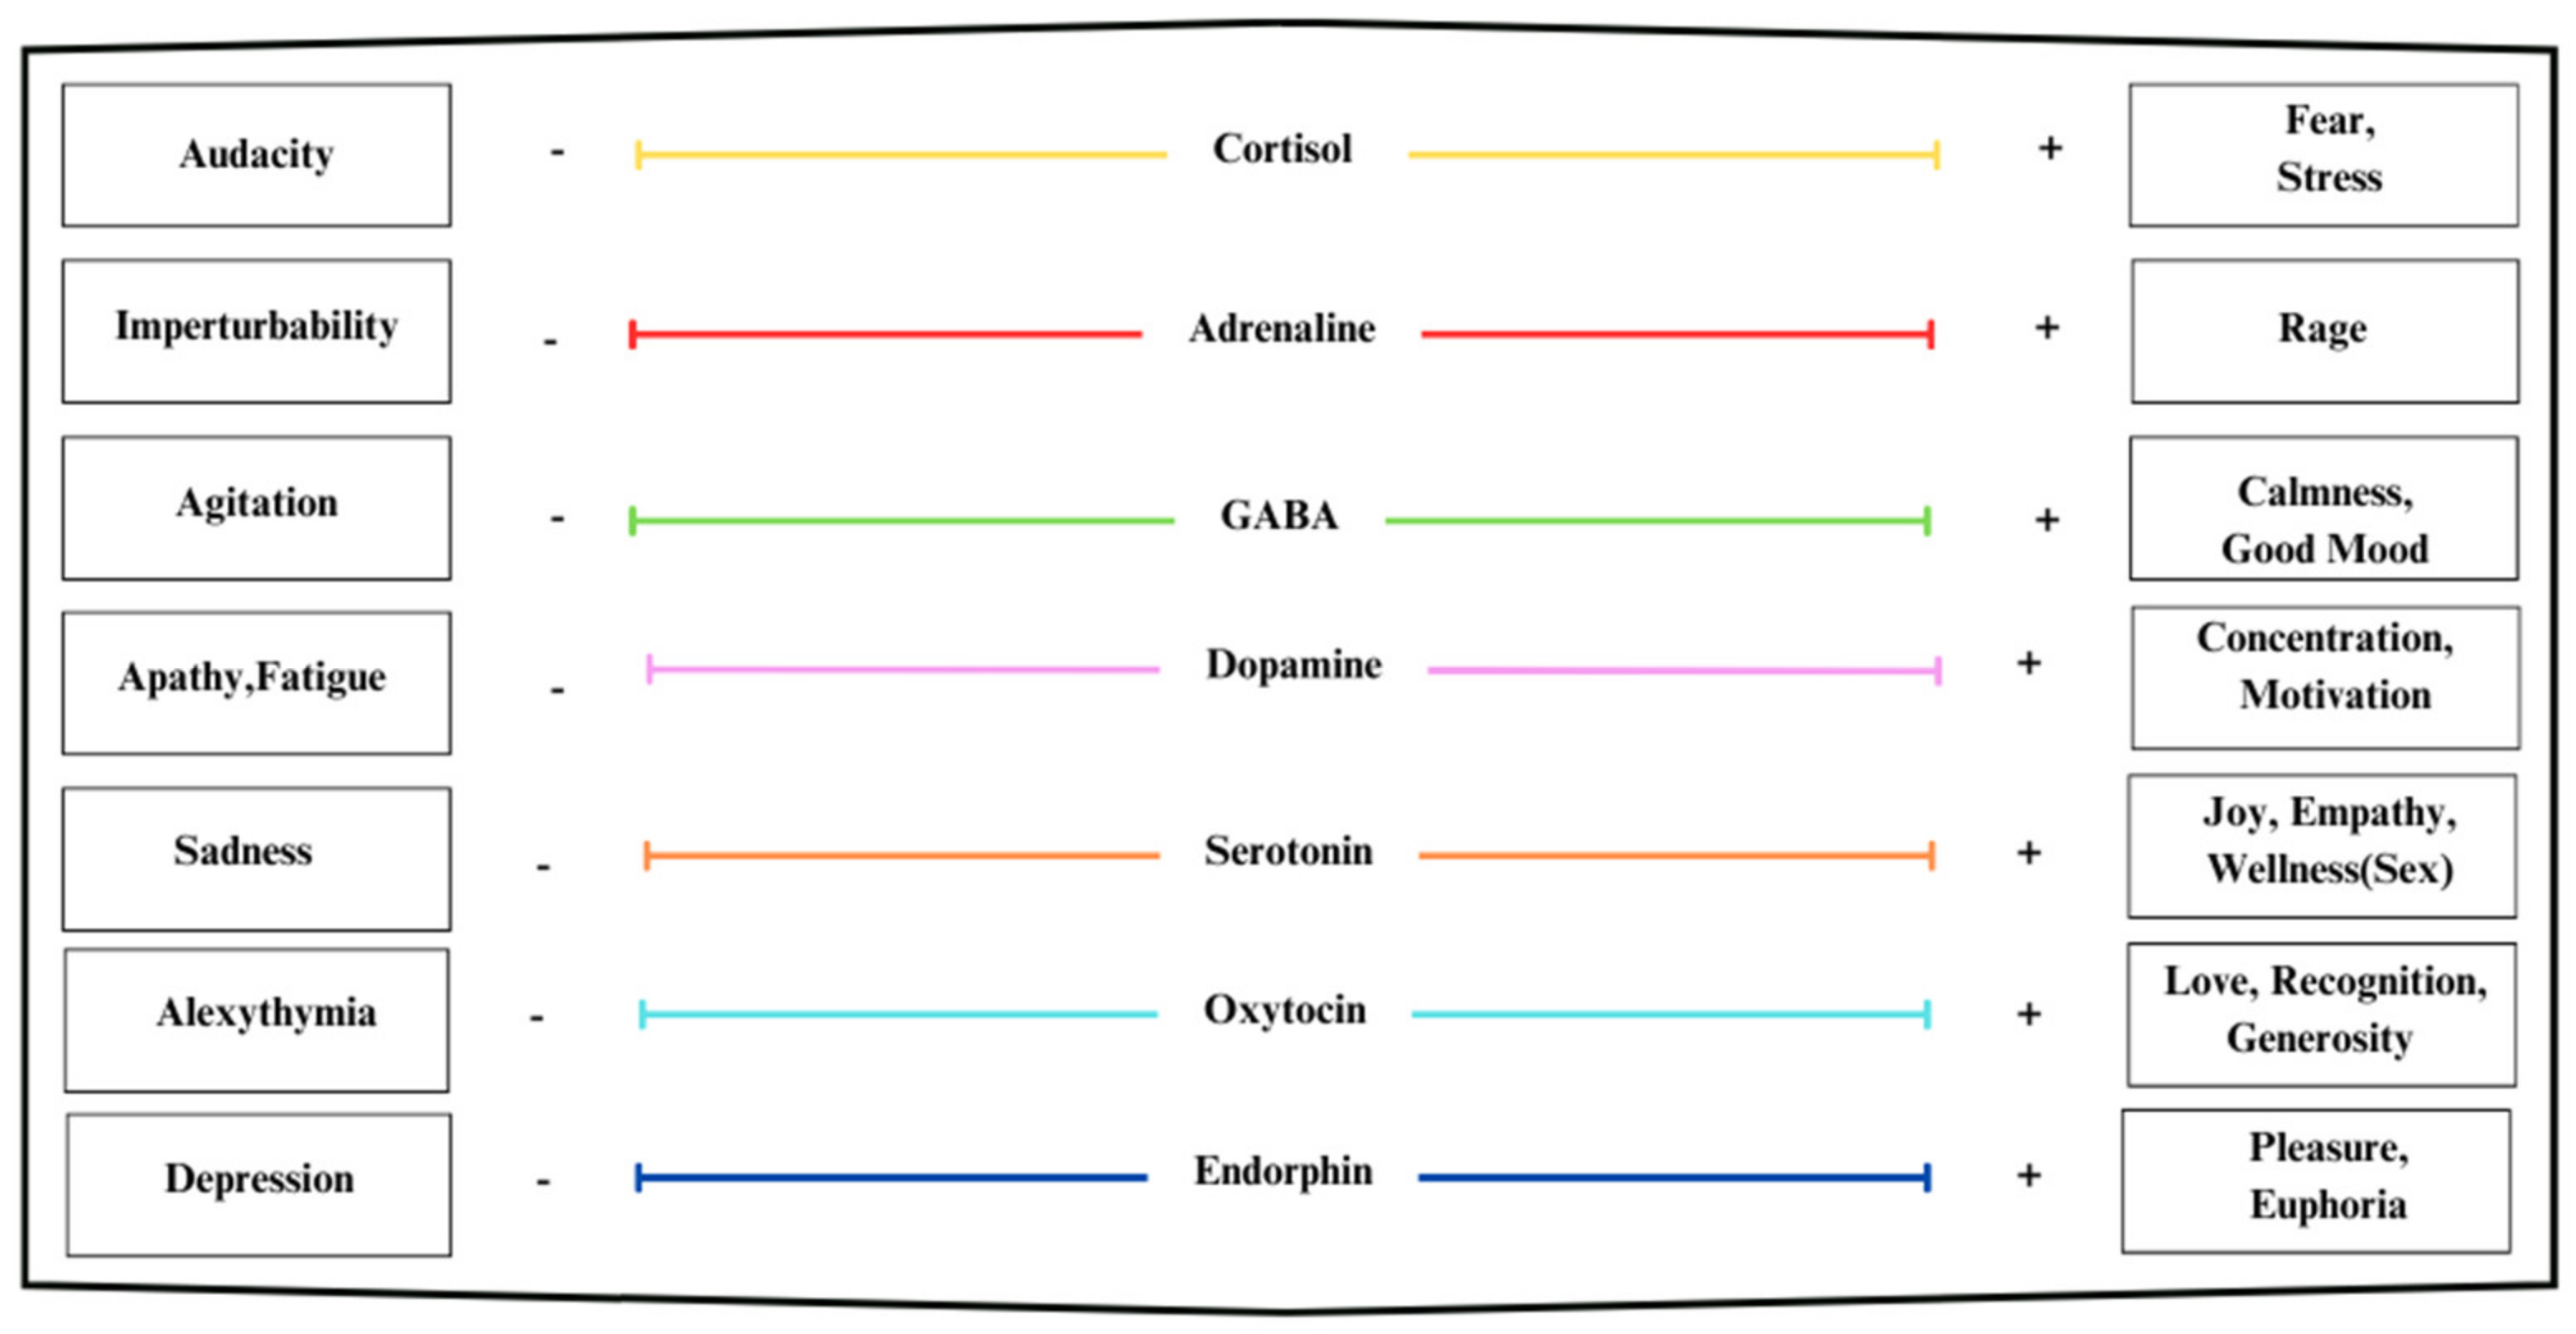
45] and starting from Ekman’s paradigm, this work studies the mapping of emotions and neurotransmitters, as shown in
Table 1. Therefore, a DSS that intends to model, with liquid intelligence, emotional–affective states with proprioceptive characteristics will have to implement a solution capable of dosing the intensities of the aforementioned substances. We stress that although Ekman’s model represents a milestone in the study of affective and emotional aspects within the context of emotive and affective computing, it does not explicitly address mixed emotional states. Conversely, the system proposed here simultaneously considers the seven neurotransmitters Xi mentioned above. The result is a natural capacity to handle complex emotional and affective states. Specifically, the system can manage 78,125 distinct mental states by varying the seven indicated neurotransmitters, each of which can take on an integer intensity ranging from 0 to 5.
From the above, to analyze the most significant cognitive states in terms of both emotions and affections, we use the following seven main parameters (between neurotransmitters and hormones) shown in
Table 1.
The following analysis aims to develop an engine or, more precisely, a DSS capable of suggesting the best decision-making pathways for the selected neurotransmitters and hormones. These pathways are aimed at improving and/or optimizing the emotional, affective, and cognitive states of liquid intelligence as simulated by the proposed solution.
The following description and the next section are based extensively on the work of the authors as presented in [
52].
Table 1 presents the mood states corresponding to a deficiency, as indicated by a minus sign, or an excess, as indicated by a plus sign, of certain neurotransmitters or hormones. For example, low levels of endorphins correspond to a depressive mood state, while high levels correspond to euphoria. Similarly, increased serotonin is associated with the states of tranquility, bliss, euphoria, or sexual excitement, while low levels correspond to the state of sadness.
For an engine based on the listed neurotransmitters and hormones, seven key indices are identified, to which target functions are given as a definition for their computational realization. These indices will also be called Critical Success Factors (CSFs) hereafter, and are identified as follows:
The CSFs in (1) are the independent variables of the computational model, whose values are either collected or simulated for further analysis. Each CSF can take one of six discrete values, (Xi = {0, 1, 2, 3, 4, 5}) for (i = 1, …, 7), semantically defined as follows: (i) 0, not acquired/not mimed; (ii) 1, low; (iii) 2, low–medium; (iv) 3, medium/normal; (v) 4, medium–high; (vi) 5, high.
The n-tuple (X1, X2, X3, X4, X5, X6, X7) describes the global state or micro-state of an individual at a given instant. A value of 3 represents a state of equilibrium where the respective parameter is in balance, which is congruent with the laws of conservation for dynamic systems. The values of 2 and 4 represent changed states where energy is dissipated with an associated rise in entropy. More specifically, the value of 2 expresses implosive tendencies, while the value of 4 reflects explosive tendencies. The values 1 and 5 are for extreme deviations from equilibrium, representing strongly anharmonic, highly dissipative processes with high entropy, whereby the value of 1 is close to implosion/freezing, while the value of 5 is close to explosion. A value of 0 indicates that no information exists. To be able to handle incomplete or partial data problems, the target functions of the proposed methodology and computational system formulate hypotheses by statistical inference in order to support sound decision-making.
As in [
52], let us consider the state function in (2) and (3):
where A = {0, 1, 2, 3, 4, 5} ⸦ ℕ e B = [0, 12] ⸦ ℕ, C = [7, 35] ⸦ ℕ. From a computational point of view, we have
where
E represents the internal energy of the system represented by the considered state,
S is its entropy,
is the median, and the coefficients
are suitable normalization coefficients defined as follows:
with
in (4) representing the activation parameter (or relative weight), such that
.
In the absence of historical information, we assume , and it is also possible to choose not to normalize (i.e., multiply by 1/7) as we will do later for simplicity without loss of generality. The choice of this interval ensures that the target function f1 produces a value within the range [0, 1], facilitating its direct association, through a fuzzification process, with the probability of Critical Success Factors (CSFs) influencing a specific systemic alteration. Consequently, f1 represents the emotional or affective state of either the individual or the artificial system.
From a mathematical perspective, the system encompasses a vast number of potential scenarios. These scenarios are expressed as permutations with repetition, where the length of the sequence is seven, and the elements are drawn from the set {1, 2, 3, 4, 5}. The total number of possible scenarios is therefore given by 5
7 = 78,125. This implies that the system can distinguish 78,125 unique emotional–affective states corresponding to variations in neurotransmitter levels, enabled by the principles of liquid intelligence. As demonstrated in [
51], these scenarios can be grouped into clusters with shared characteristics, allowing for the identification and analysis of deviations from fundamental states. Each scenario is represented by an n-tuple comprising seven components, where each component corresponds to one of the seven neurotransmitters X
i. The specific values assigned to these components collectively define the state of the system under investigation.
As indicated in [
33], there exists a correlation between these scenarios and the type of dynamic behavior exhibited by the system.
Table 2 provides a visual depiction of sub-scenarios mapped onto the entropy–energy (S-E) plane. Specifically, the model we propose includes 78,125 mental states, derived from the combination of seven neurotransmitters, each assuming a value between 1 and 5. Each time there is a transition from one mental state to another, at least one of the neurotransmitters assumes a different value. The combinatorial complexity of transitions between mental states is not manageable using conventional computational systems. To simplify the computation, the 7D space is projected into a 2D space using the function f.
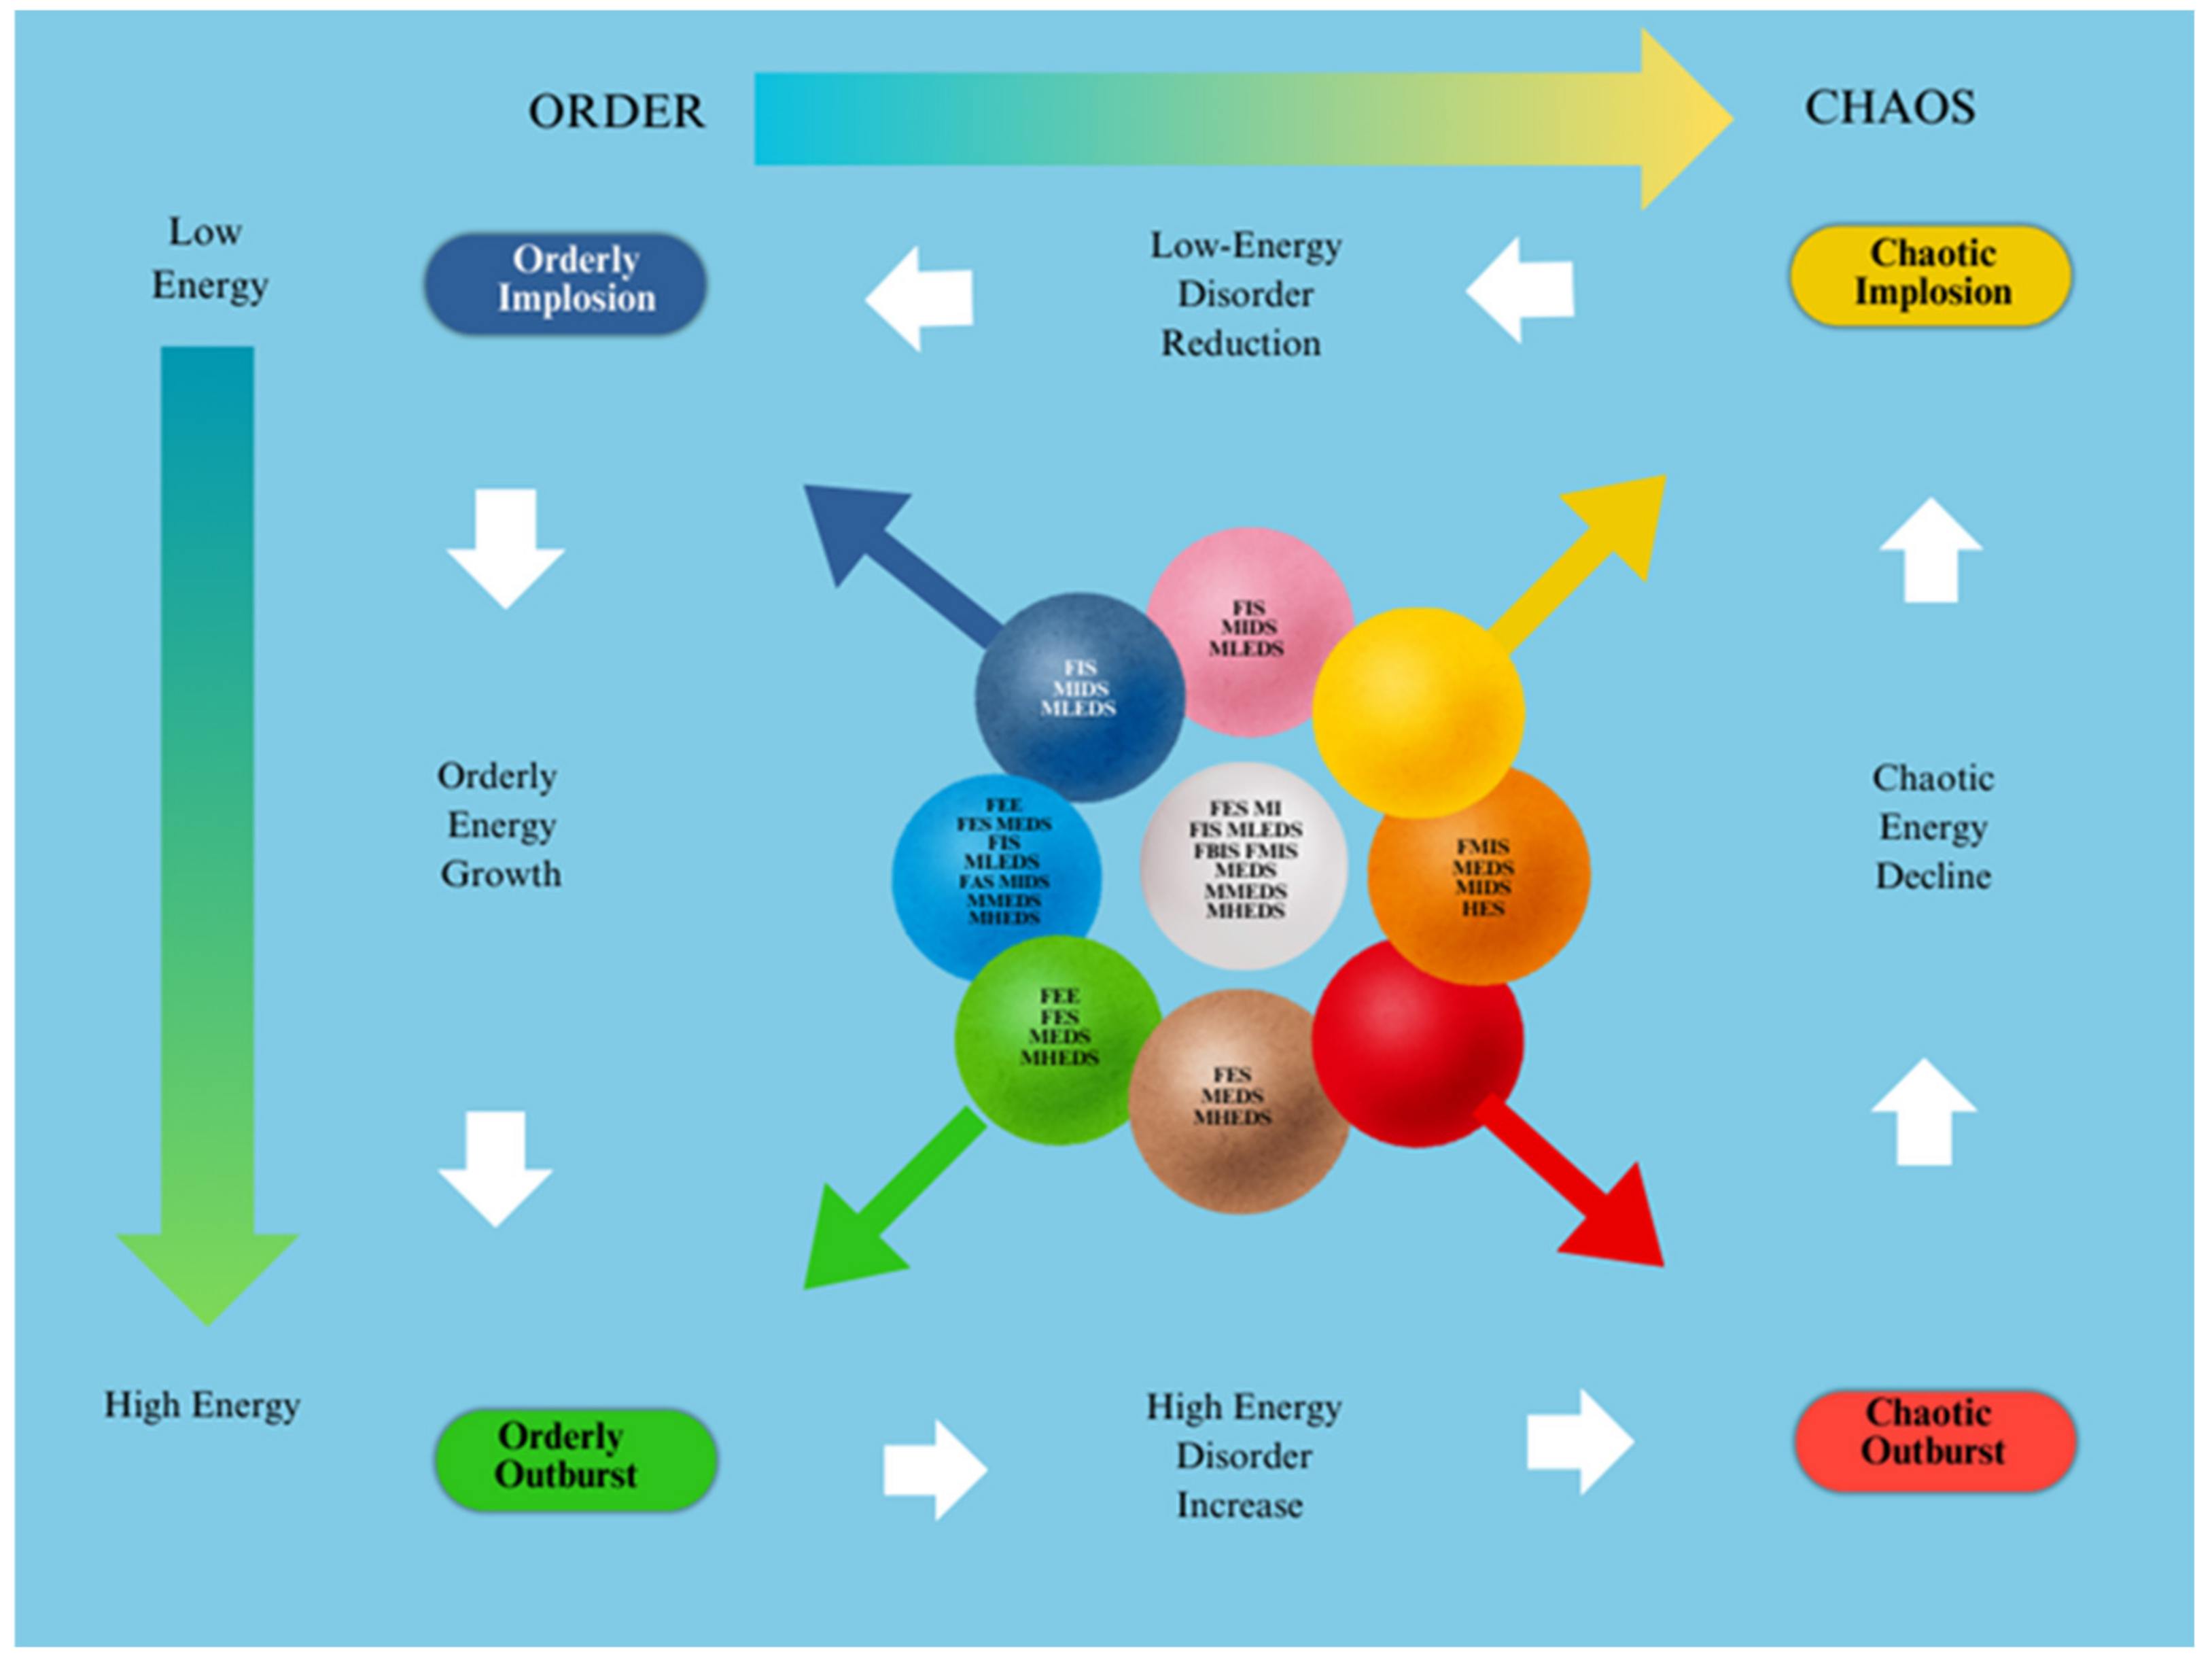
This framework provides a foundational model for understanding the dynamics of systems, i.e., individuals in this study, and for designing strategies to induce more ordered responses. These strategies are tailored to the present and anticipated intensity levels of neurotransmitters, offering a robust basis for managing transitions across different energy and entropy states. The situation is as follows (also see
Figure 1):
Blue: States with low dynamic energy, ordered.
Light blue: States with medium dynamic energy, ordered.
Green: States with high dynamic energy, ordered.
Purple: States with low dynamic energy, moderately ordered.
White: States with medium dynamic energy, moderately ordered.
Pink: States with high dynamic energy, moderately ordered.
Yellow: States with low dynamic energy, highly disordered (cold chaos or low-energy chaos).
Orange: States with medium dynamic energy, highly disordered.
Red: States with high dynamic energy, highly disordered (hot chaos or high-energy chaos).
According to the framework outlined in [
51], a refined clustering approach is presented to facilitate the analysis of the evolutionary dynamics of a system characterized by the seven previously defined X
i.
Table 3 focuses on the dynamics of transition. Here, the S-E space of the macro-states is divided into 12 scenarios characterized by specific energy and entropy ranges, each labeled with a name suggesting the evolutionary dynamics a state may follow. An illustrative example for understanding
Table 3 is the following: Suppose a person’s mental state falls under the Fundamental Implosive Scenarios. This indicates a state with low energy and moderately low entropy, such as apathy, disinterest, or a state of isolation. The objective of the mental transitions managed by the dedicated DSS component in such cases would first focus on increasing dynamism (energy) and subsequently on minimizing disorder (entropy).
3. Methods and Algorithms
Building on the analysis outlined in the preceding paragraphs, it is possible to associate each micro-state, defined by the seven neurotransmitters X
i, with a corresponding macro-state characterized by a pair of state variables (S, E). Once the macro-state has been identified, the purpose of the neurotransmitter-based liquid intelligence infrastructure or DSS is to propose strategies for transitioning the system’s current macro-state. Instead, the main endeavor of the neurotransmitter-driven solution is to suggest such moves that, on the one hand, minimize entropy while, on the other hand, maximizing internal energy corresponding to increasing the intensity of emotions and affect. This is the objective reached by a series of progressive steps, each functional to the overall aim of guiding the system to one of five basic attractors. Reaching this final goal involves the use of different algorithms, each corresponding to a certain strategy. Details about these processes and the involved decision-making algorithms can be found in [
53]. Although this work will not go into detail about those algorithms for the sake of brevity, their general strategy is aimed at reaching one of five attractors by minimizing entropy. This minimization is the essence of the decision-making strategies; each of them represents a unique route in the S-E plane, and, in principle, entropy must be reduced to zero continuously to align the system to one of the five main attractors. Each attractor corresponds to a privileged direction in the system, which describes a global dominance path. These directions depend on the state of interest and its relation within a 3 × 3 matrix centered around that state, known as the eight-connected matrix, as shown in
Figure 2.
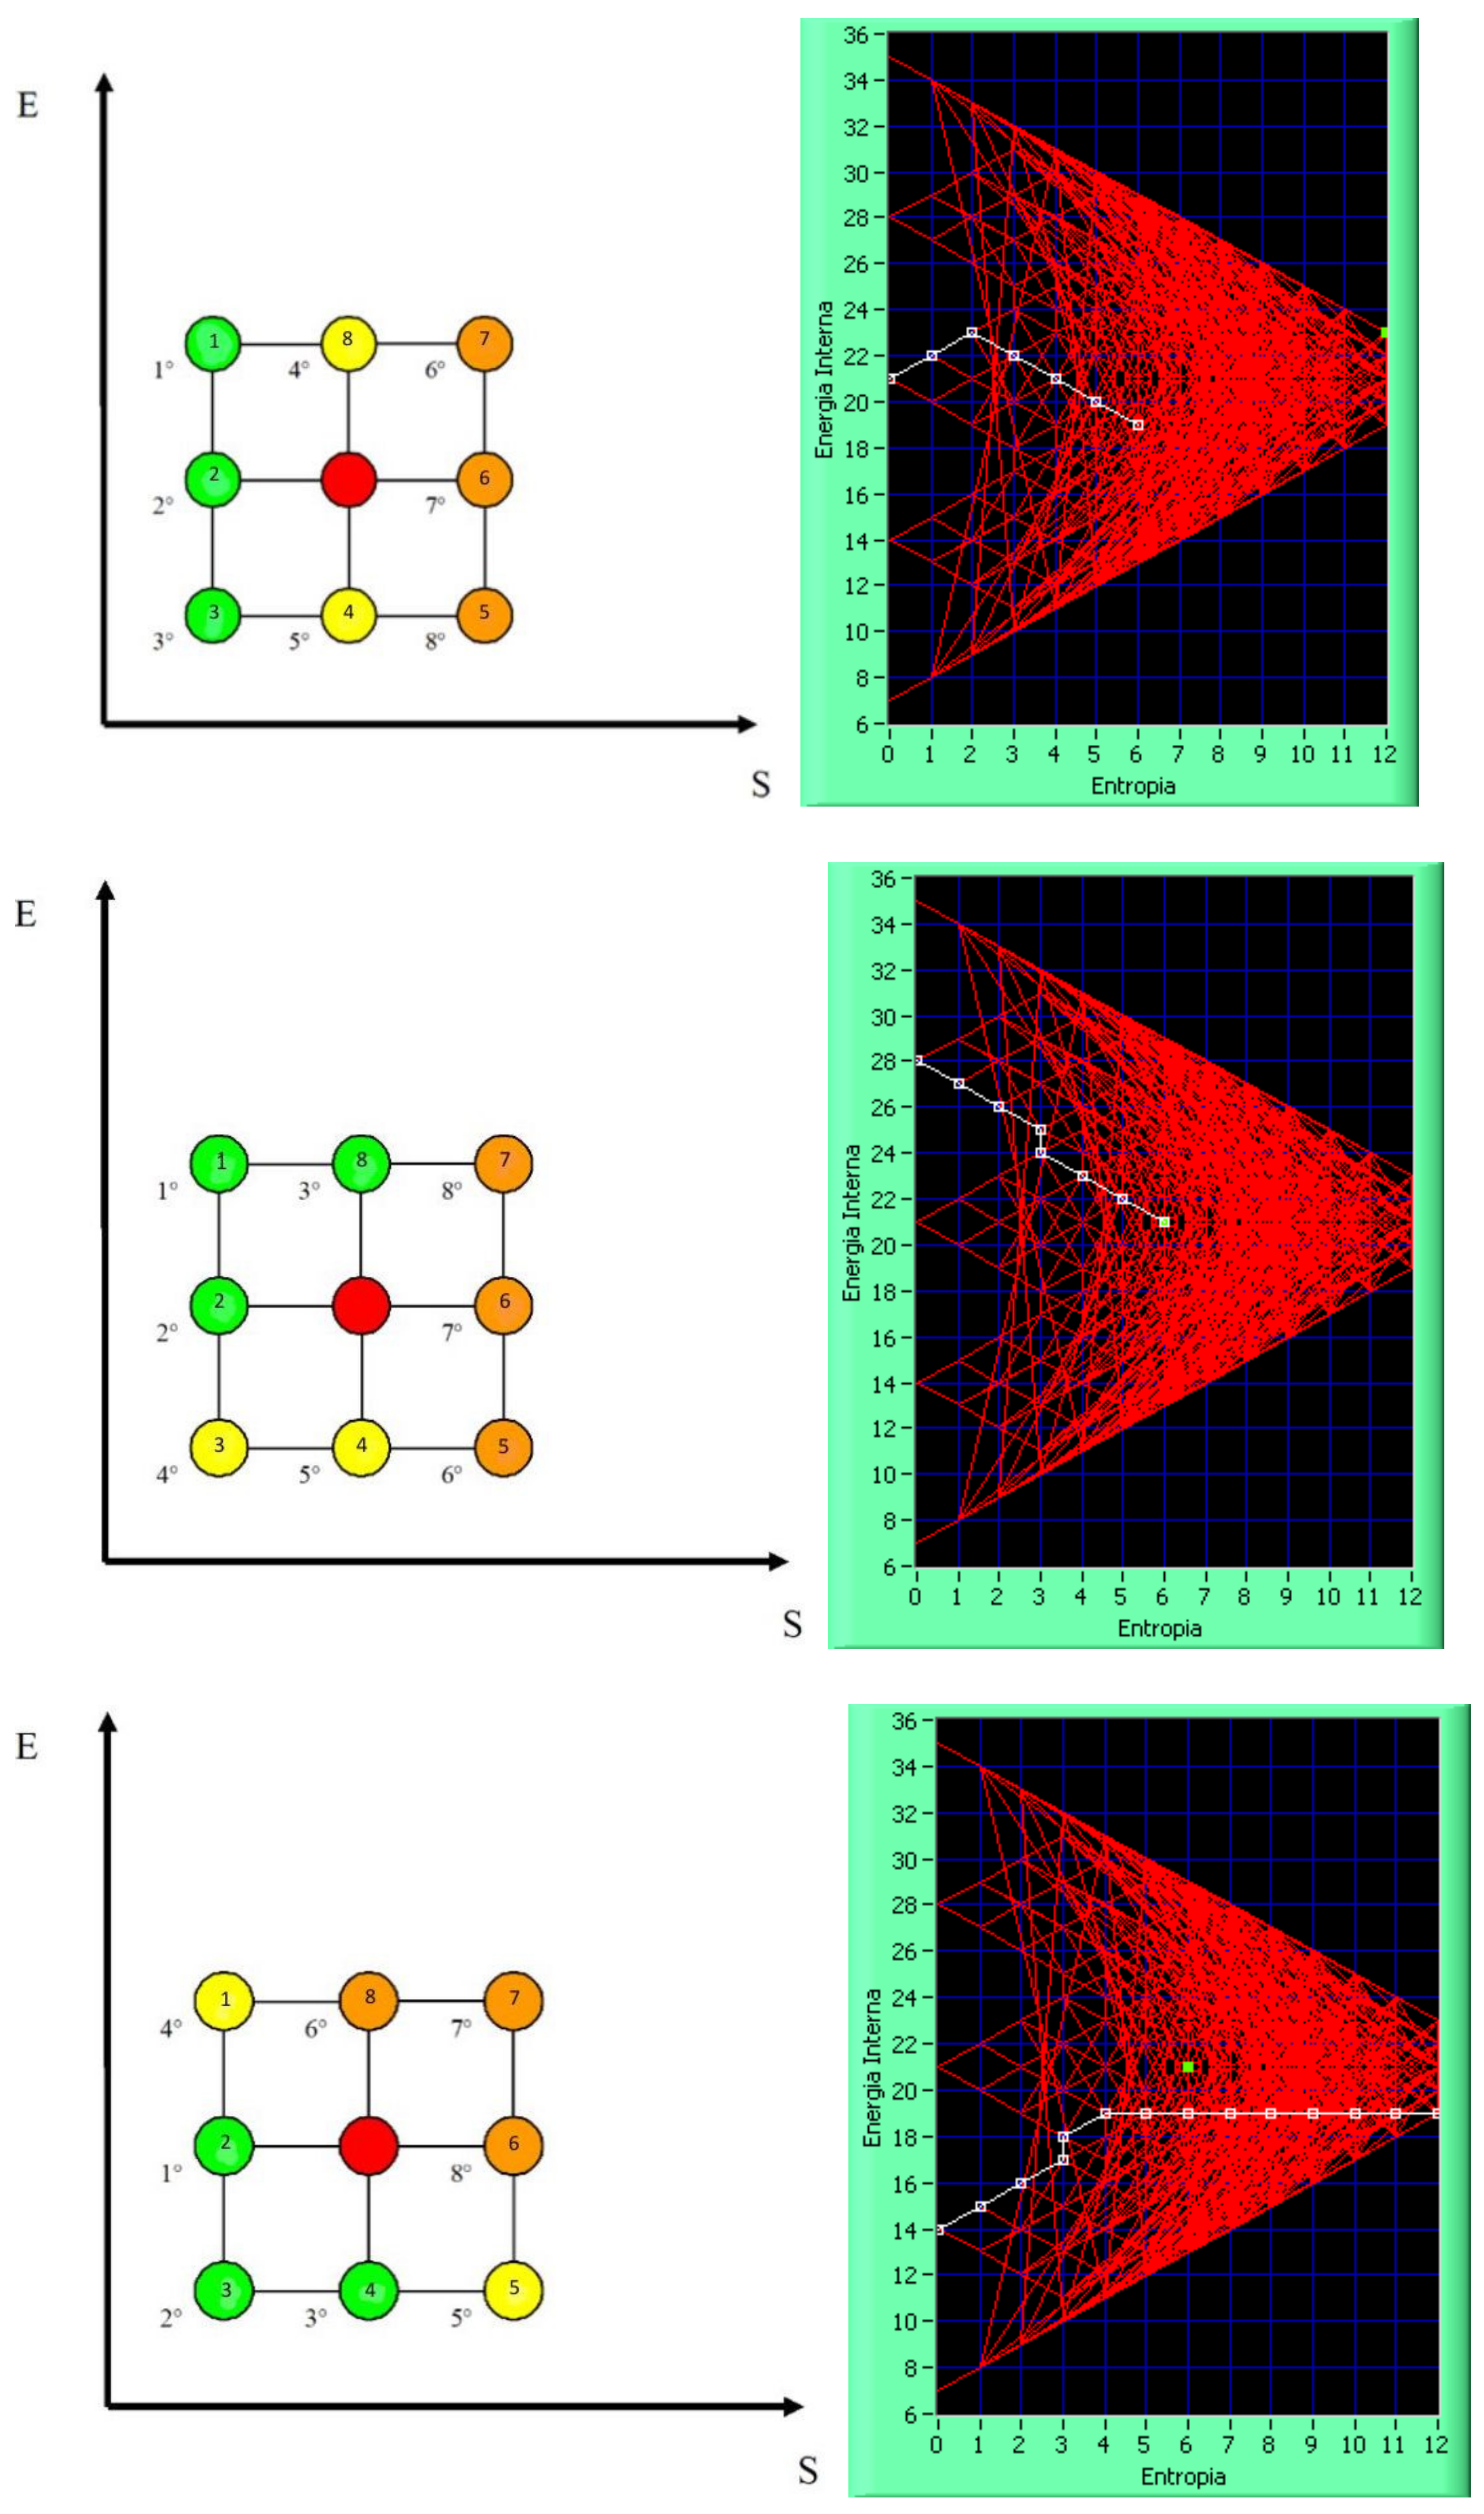
Figure 3 shows some algorithms that try to minimize entropy (S) and adjust energy (E), either by increasing or decreasing it. The left side of the figure shows the algorithms applied to a 3 × 3 matrix organized by priority levels, while the right side shows their corresponding impacts in the S-E plane. On the left-hand side of
Figure 3, a dual priority mechanism has been used: (i) a four-color semaphore system and (ii) a numerical priority system using progressively increasing numbers to differentiate between transitions of the same color. The green color is the optimal choice, followed by yellow, orange, and finally red. The same-colored group, like green, would choose its preference based on the lowest progressive number displayed within those colored markers.
The purpose of the various optimization algorithms is not to compete with one another but rather to provide the platform user with a range of opportunities to express their preferences regarding the optimization of mental dynamics. These preferences can guide the evolutionary perspective and help determine the best decision-making path for transitioning between macro-states in alignment with the indicated preferences. The 12 algorithms represent all possible transformations within the 3 × 3 lattice structure known as eight-connected. To get a deeper understanding of the algorithms, the reader is referred to [
53].
The left portion of
Figure 3 (top and left) visually represents this hierarchy. Transformations that reduce entropy are marked in green, while isentropic transformations are marked in yellow, and transformations that increase entropy are shown in orange. The internal numbers within a state indicate the state itself, while the external numbers represent their hierarchical priority. On the right-hand side of
Figure 3, some examples of state transitions are shown, along with how the fixed algorithm dictates the decision-making process. The system always tries to minimize entropy and maximize energy, leading to a net decrease in entropy and an increase in energy from the initial state.
From the bio-neurotransmitter perspective, this solution works through three strategies interlinked: a decision strategy (DS), a management strategy (MS), and an operational strategy (OS). The decision strategy moves from a static to a dynamic framework by guiding the decision-maker through a path in the entropy–energy plane; this path aims at minimizing entropy while optimizing energy according to the stated objectives. In a formal way, this is represented by a broken curve, each part of which carries information regarding the initial (macro) state, transitional dynamics, and final target state. The initial state denotes the current condition of the system, and the final state is a representation of the equilibrium that needs to be reached via optimization. These macro-states are obtained from 78,125 micro-states on the S-E plane, which group into 146 macro-states.
The management strategy identifies the actions needed in order to change the energy and/or entropy. The final operation aligns the system to be with one of five possible attractors defined by entropy–energy pairs: Maximum Attractor (MA) = (0.35), High Attractor (HA) = (0.28), Central Attractor (CA) = (0.21), Low Attractor (LA) = (0.14), and Minimal Attractor (mA) = (0.7). The defined operational strategy, which acts directly with micro-states, indicates what neurotransmitter states the system should shift into, from the perspective of a global objective. It provides the strategy to tune the seven neurotransmitters, represented as CSFs, to drive the system to equilibrium. In integrating these strategies, the experts are thus equipped to handle the complexity of liquid intelligence systems supported by mathematical modeling and operational mechanisms.
The operational strategy ultimately determines the sequence of neurotransmitter values that the system will follow, balancing smooth transitions with the need to achieve specific objectives. This structured approach will, therefore, enable experts to efficiently navigate the complexities of neurotransmitter-driven intelligence systems, using advanced modeling for accurate and actionable results. Formally, if
x is the starting micro-state corresponding to macro-state A and macro-state B, there are associated n micro-states
yi with
i = 1, …,
n; then, among these, the best
y will be the one for which the sum of the absolute values of the deviations between the different indices is minor, or formally
where, in (5), the index
j characterizes the different indices; i.e., we have an X1 index for
j = 1, an X2 index for
j = 2, etc. Every micro-state is assigned a newly defined parameter; let us call it “deviation”. The vector of micro-states
yi which belong to the same macro-state B is sorted in ascending order of deviation, and the first element of this list is chosen because it has the lowest value of deviation, thus being the closest to the micro-state defined as the “contiguity optimization objective”. In this target function, the best micro-state at every stage is calculated. With the destination macro-state decided, the system picks up an appropriate micro-state considering the previous target function to avoid micro-state degeneration. The system could give an expert or an intelligent automatic system an operational strategy involving micro-states and a solution targeting neurotransmitter level adjustments. The system proposes a step-by-step optimization configuration for the seven indices.
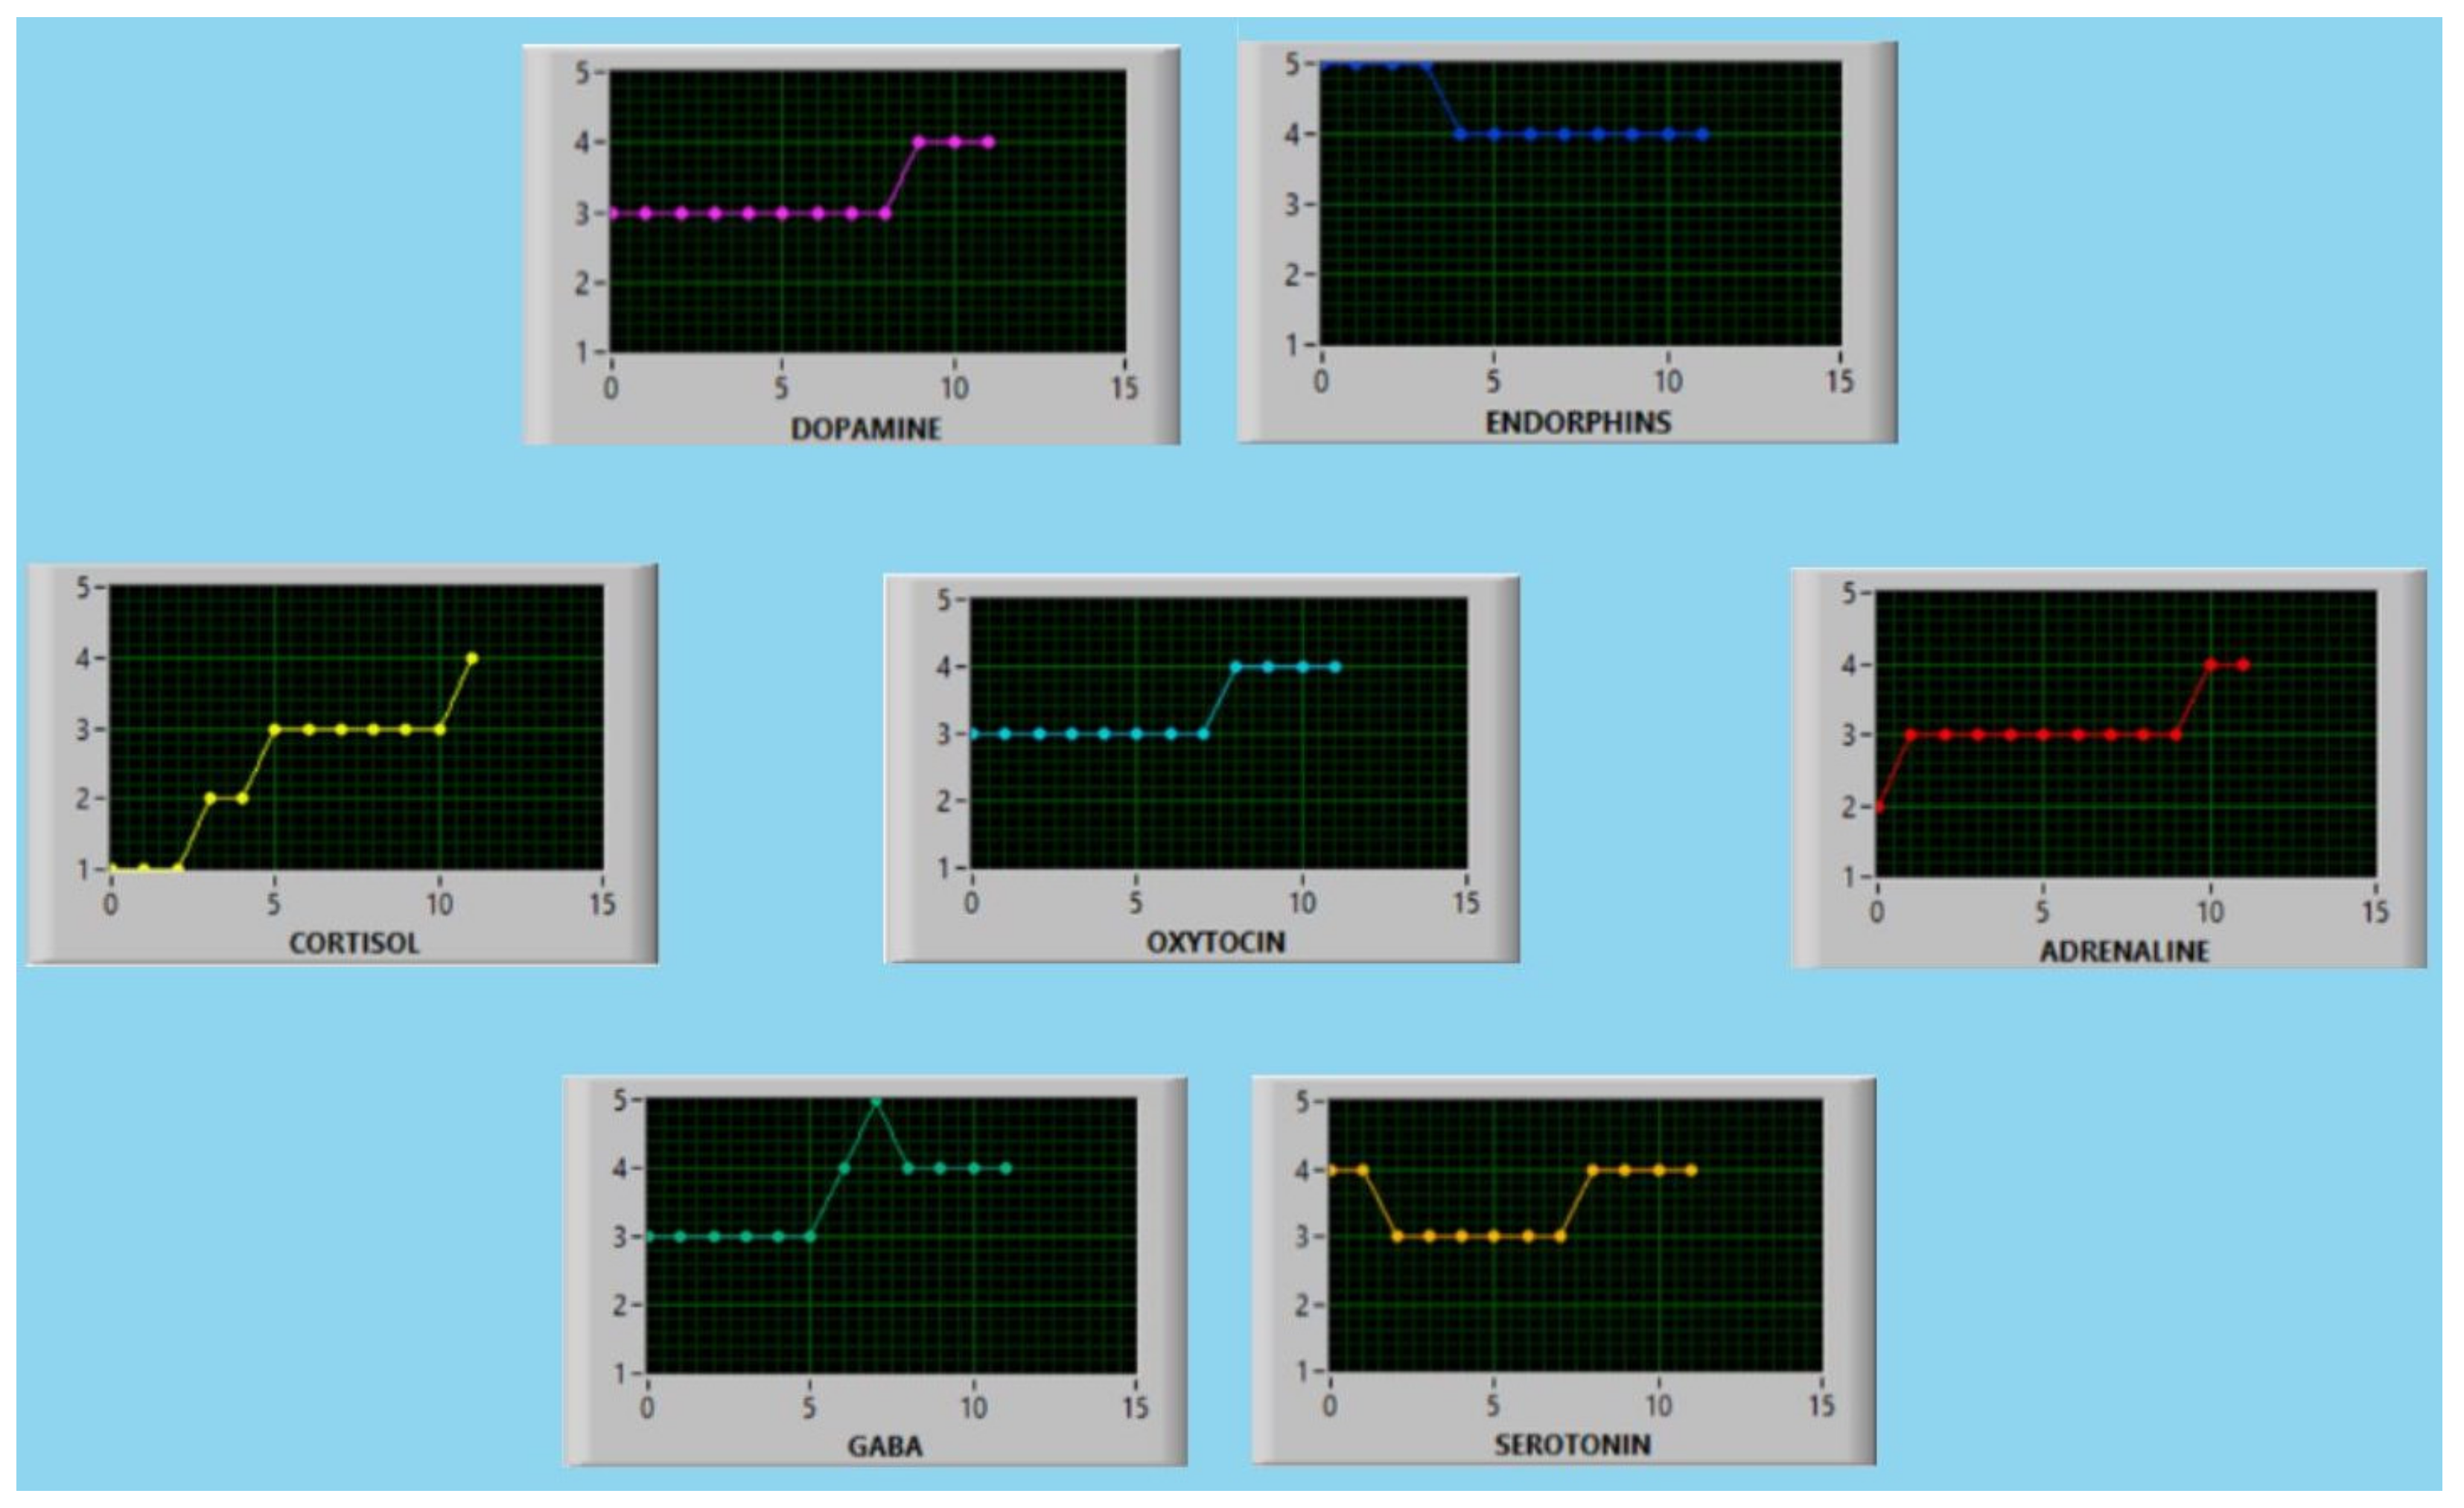
Figure 4 represents the flow of all the indices and neurotransmitters during each step until the global goal is reached. The global goal is defined as converging to one of five attractors based on a decision-making strategy and a micro-state of interest.
The just-described process completes the information processing chain by providing an integrated approach to decision-making, management, and operations with the aim to drive a system from a state of disequilibrium to a state of equilibrium. This final module provides both experts and intelligent artificial agents with concrete recommendations that can be realized directly. While the operational strategy described above is still of interest, in certain circumstances, the satisfaction of a given global aim (decision strategy) involves the use of an operational strategy where one parameter can evolve faster than another. To address this type of request, the system offers eight distinct operational strategies, each characterized by a clearly defined hierarchical priority order for the indices to be optimized. These strategies establish a structured approach to optimization, ensuring that the indices are addressed in a specific sequence based on their relative importance within the system’s framework, as in (6)–(13):
where, we remember, X
1—cortisol, X
2—adrenaline, X
3—GABA, X
4—dopamine, X
5—serotonin, X
6—oxytocin, and X
7—endorphins.
The priority of one index over another institutes conditions within the system where the evolution of certain factors is emphasized over others. For instance, if the system is to simulate a physically proactive state, the OS_1 strategy is very effective since it corresponds to a state of proactive happiness and high resistance to stress. The elevated level of cortisol contributes to reduced inflammation and improved pain tolerance, while dopamine contributes to physical well-being and serotonin supports a positive mood and happiness. OS_2 is for dynamic scenarios, high-frequency responses, and high adrenaline, dopamine, and serotonin to meet the challenges of rapid changes. OS_3 maintains a positive state of mind and serenity. OS_4 amplifies concentration and memory with well-being and calm, while OS_5 focuses on concentration and memory under conditions of stress and reactivity. OS_6 is similar to OS_1 but includes adrenaline to raise activity levels in challenging situations. OS_7 is designed to develop love and benevolence in all situations by increasing oxytocin and endorphins. Finally, OS_8 allows the user to have maximum flexibility in setting the priorities amongst neurotransmitters, thus providing very flexible strategies.
To complete the present section about the methods, let us consider the component of EEG data acquision. As is known, EEG is a noninvasive technology that allows the electrical activity of the brain to be recorded by sensors placed on the scalp [
54,
55,
56,
57,
58,
59]. This tool serves as a significant resource in our article, where the focus is aimed at understanding the reflection of various emotional and cognitive states in the brain activity and how such responses can be interpreted and used in terms of indirect evaluation of neurotransmitters’ productions. We focus our research on patterns of activation of brain areas in response to positive, negative, and neutral emotions. Our goal is to use EEG signals to identify the specific patterns of activation to positive, negative, or neutral stimuli in terms of emotions and neurotransmitters. We will analyze how EEG activity could indirectly reflect the modulation of some neurotransmitters specific to different emotional and affective states. Making the presented research results an interpretive model to identify the EEG patterns that are associated with different emotional states is one of the steps in using our findings for the further innovation of creation in a way that would make it practical for use in any future applications of emotional monitoring and motivation and for DSSs which mime neurotransmitters in an artificial context.
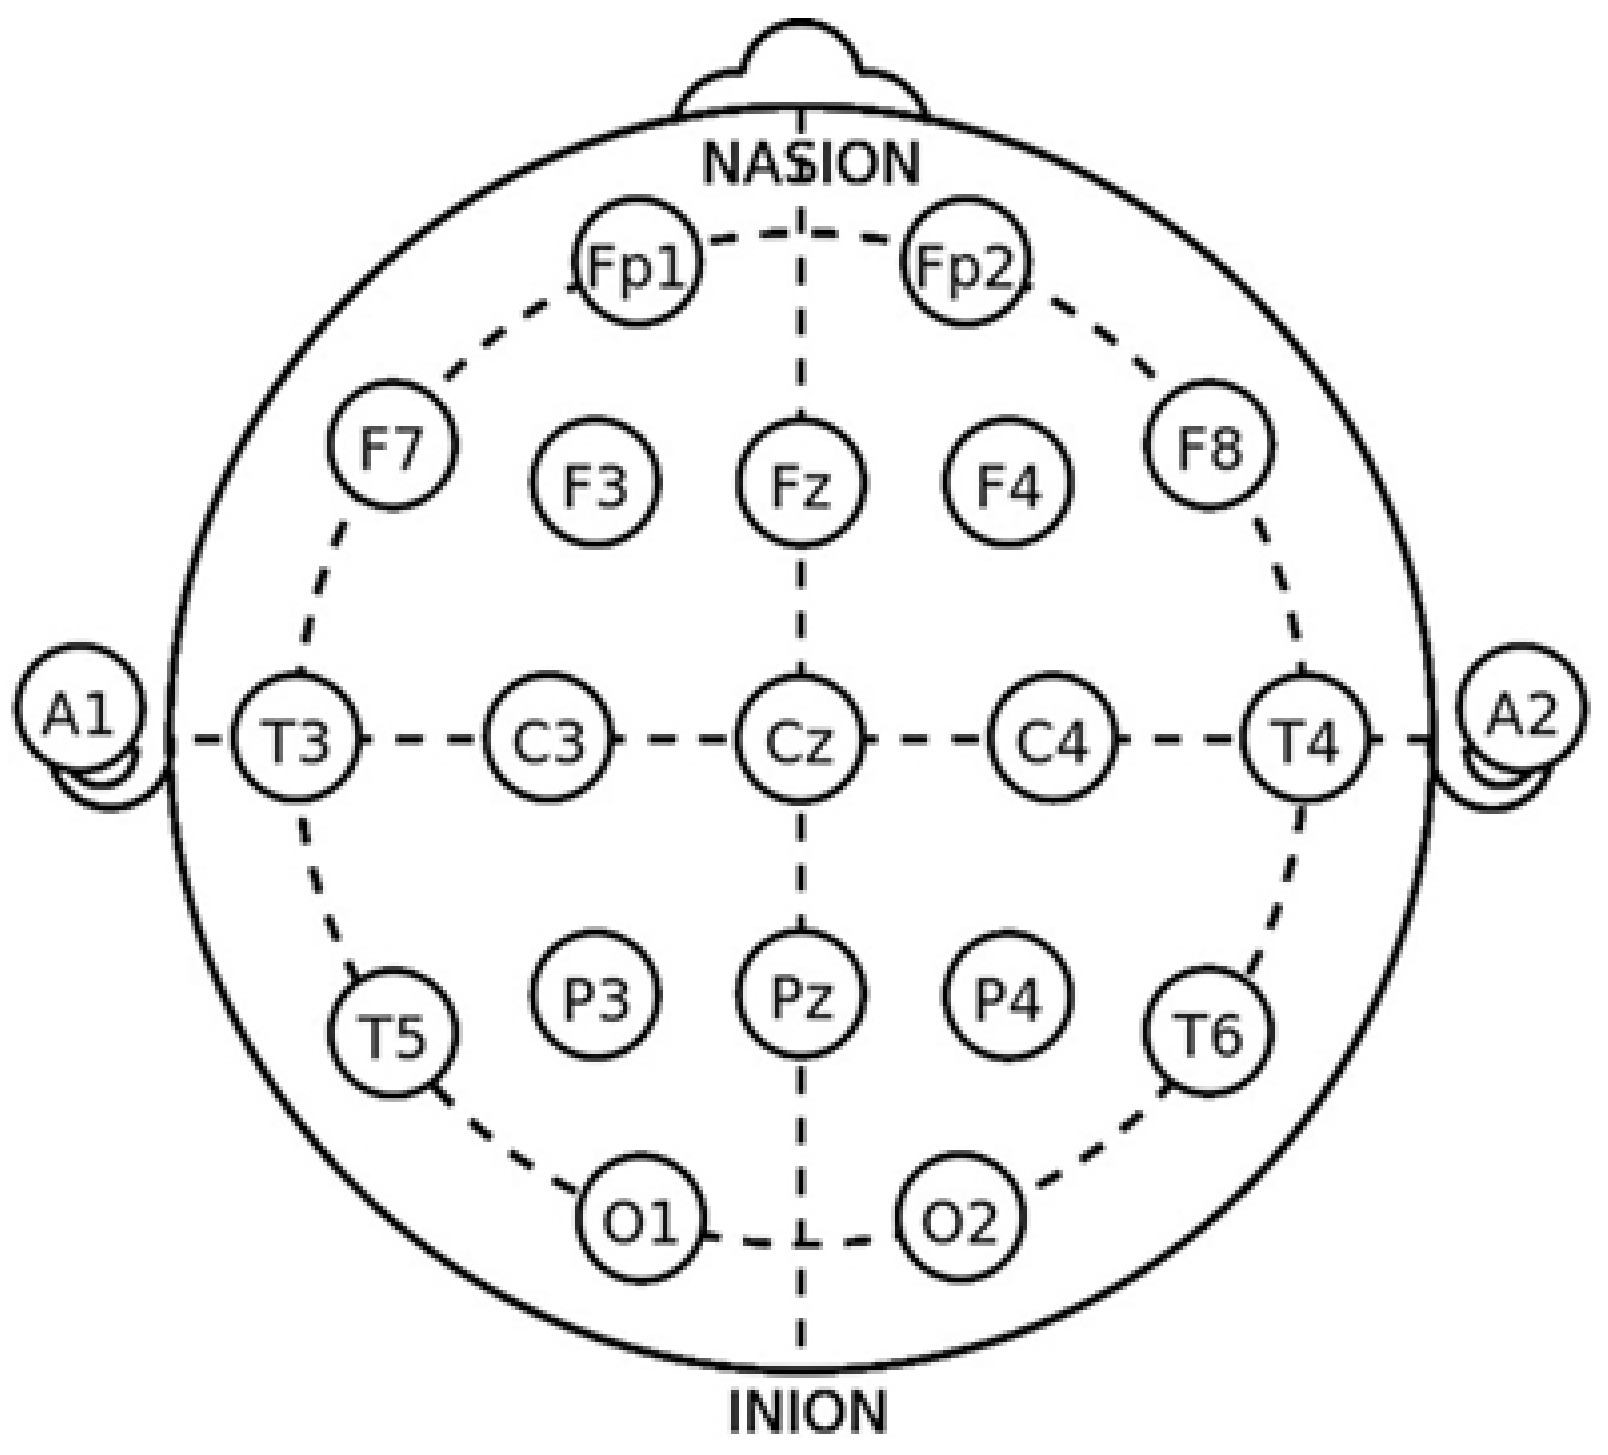
The location of EEG sensors via the 10–20 system [
56] on the head can indicate which brain area is active: (i) front: attention, planning, self-control (frontal lobes); (ii) lateral: hearing, emotions (temporal lobes); (iii) back: visual perception (occipital lobes) (see
Figure 5).
In
Figure 5, we can see the major areas as in [
54], and in the next section, we will see how they are related to emotions.
4. Results and Discussion
To analyze the results and to discuss them, let us start by considering
Figure 6. It gives a typical example of data acquisition with the EEG wireless helmet we used to acquire real data. The helmet is not a medical device, but a commercial solution used typically for meditation, gaming, and entertainment. As we had anticipated, brain waves, as detected by EEG, are associated with distinct mental and emotional states based on their frequency and the area of the brain from which they originate [
60,
61].
The appearance of such an EEG analysis allows us to pick up electrical activity in certain areas of the brain, offering a way to understand how different regions of the brain are activated by an emotional and cognitive state [
62,
63]. In our study, these signals are linked through a DSS that represents the action of seven neurotransmitters: dopamine, serotonin, GABA, adrenaline, cortisol, oxytocin, and endorphin. This mapping helps in interpreting how each neurotransmitter, through its modulation in specific areas, contributes to regulating behavior and mental states. In the EEG, different areas of the brain are associated with functions and activities that may reflect specific emotional aspects. However, it has to be considered that emotions are not localized to a single electrode or area but rather involve complex interactions between multiple regions [
55,
62,
63].
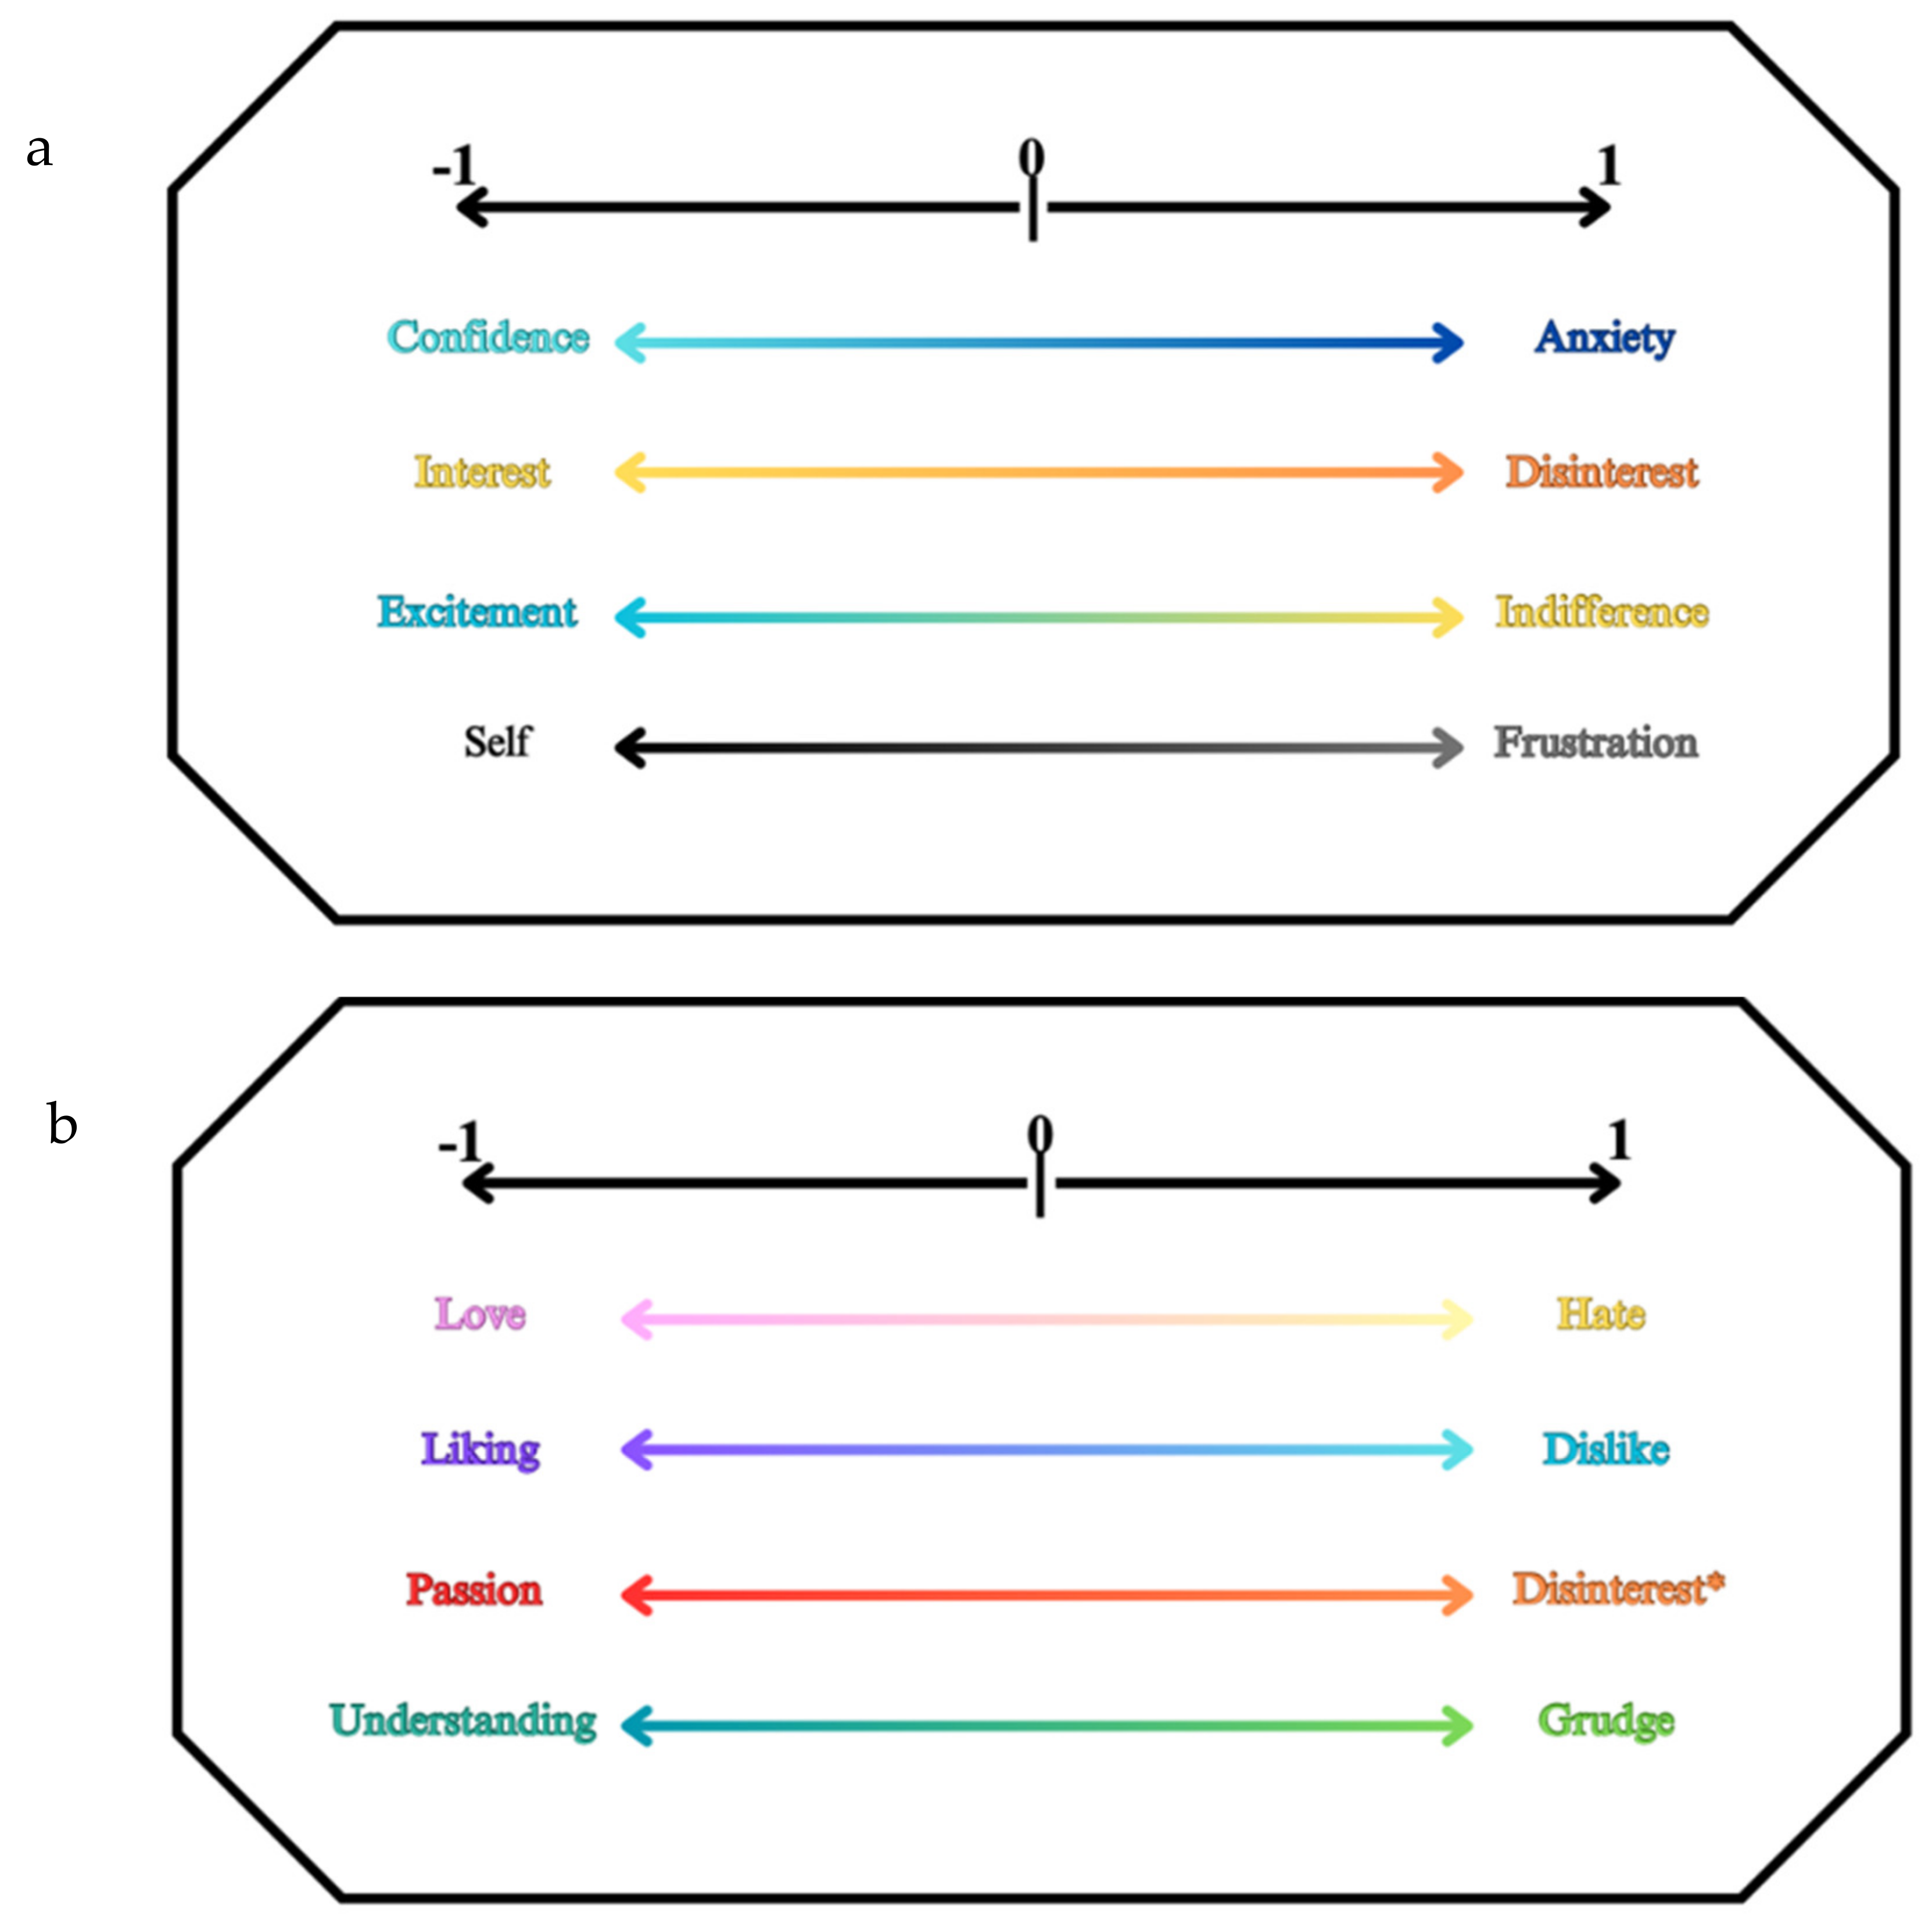
Ekman’s scale ranks the emotional states on a continuum from negative to positive, allowing a neutral area in between, enabling us to place the brain responses on seven levels of emotional intensity. By using the scale, we can link neurotransmitters and EEG values and see how substances like dopamine and serotonin, associated with positive feelings, are more strongly activated in frontal and prefrontal areas. Here, the system by Ekman enables us to detect states of motivation, well-being, and calm. Similarly, oxytocin and endorphins—in more positive values—influence social bonds (in temporal areas) and pain tolerance (in central areas), respectively. On the other hand, neurotransmitters such as adrenaline and cortisol, which correspond to more negative states in Ekman’s scale, show their activity in prefrontal and frontal areas during the situations of stress and anxiety.
Hence, there is higher activation in response to stimuli demanding attention and alertness. GABA, on the other hand, has a more balanced influence and occupies intermediate values in the Ekman scale; it takes part in the temporal fields by reducing anxious states and engendering a level of relaxation. By using EEG, a DDS, and the Ekman scale together, it may be possible to form a fine-grained and multidimensional representation of the mental action and to establish through which ways the brain modulates and responds to emotions and cognitive states of different intensities and qualities [
64]. An integrated methodology permits the exploration of emotional responses in a more quantitative and scientifically rigorous way. Ekman’s scale ranks emotional states on a continuum from negative to positive, with a neutral area in between, allowing us to place brain states (see
Figure 7a,b).
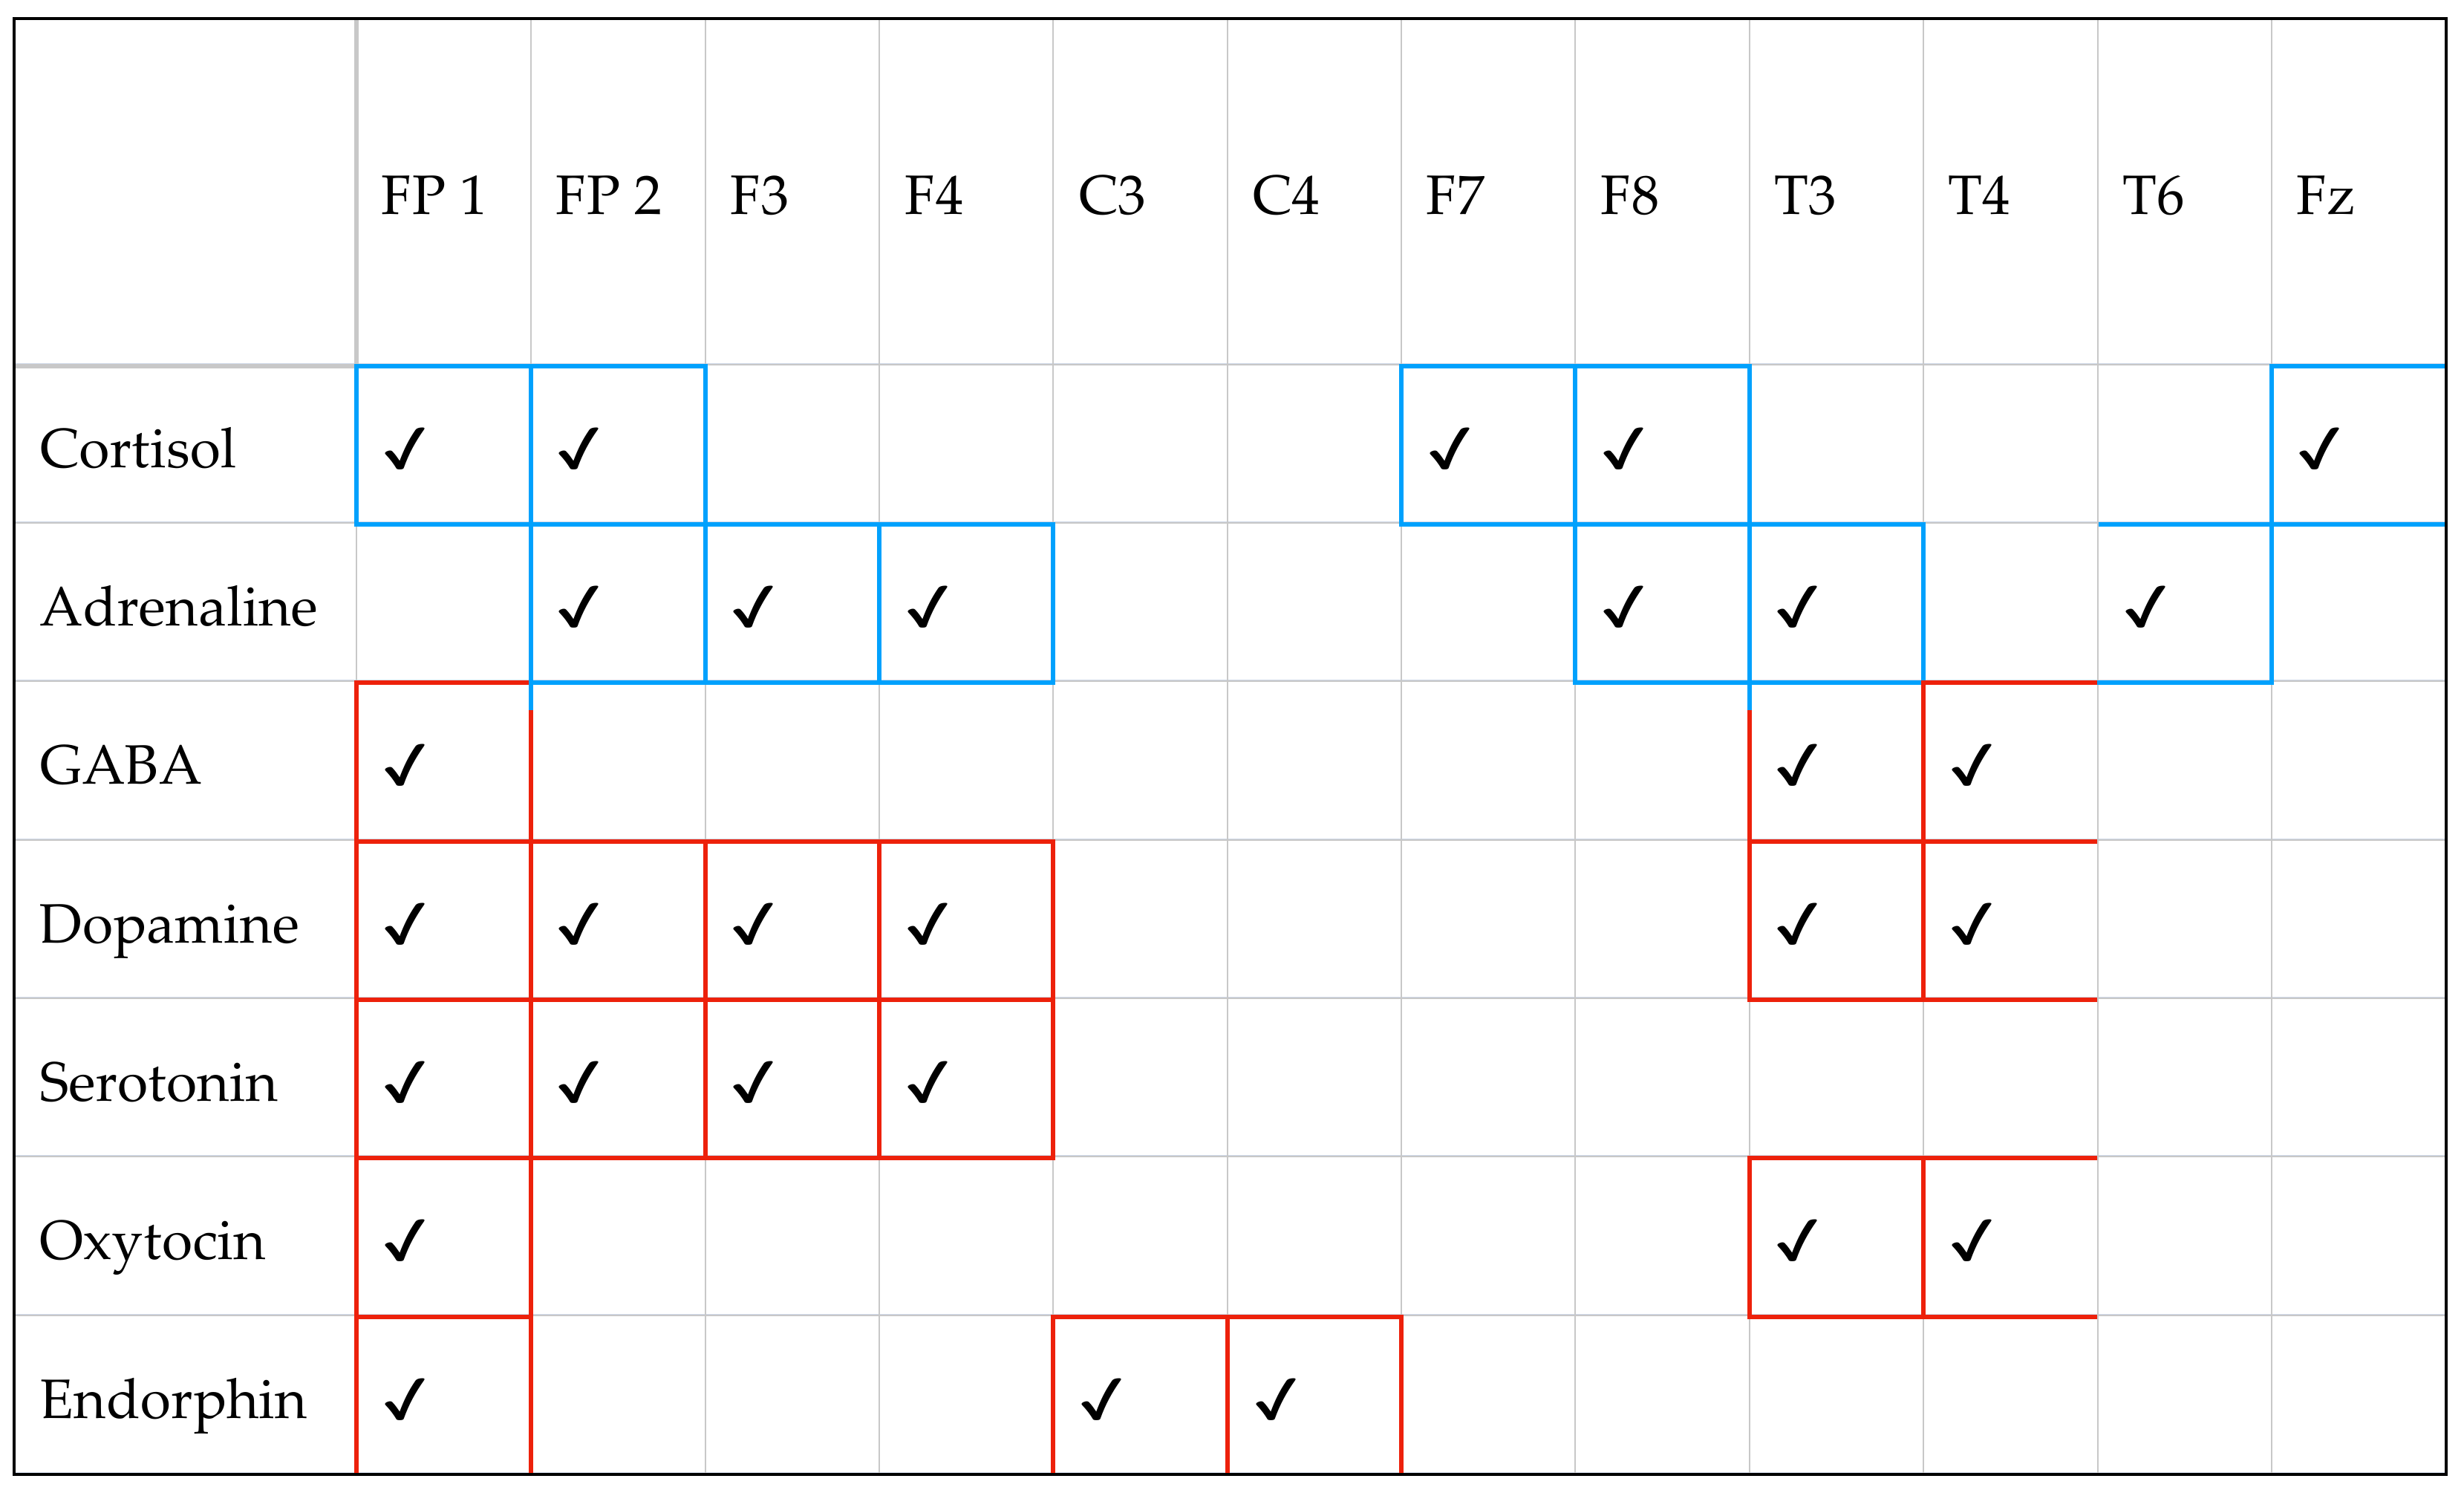
In the present study, we used EEG to monitor the activity of different areas of the brain and correlate those activities with specific neurotransmitters. By this method, we were able to determine which emotions are typically found with each neurotransmitter at each electrode location, corresponding to specific emotions and affections at the same time. Then, we developed a map showing the distribution of dopamine, serotonin, GABA, adrenaline, cortisol, oxytocin, and endorphin at various EEG locations, and with the use of Ekman’s scale, we classified each substance as positive, negative, or neutral, as reported in
Figure 8.
Figure 8 summarizes approximately one hundred tests conducted to establish the mapping between EEG signals and neurotransmitters/emotions. To stimulate the individual, 5 min audio and video content was used, designed to elicit specific emotions or affections and categorized accordingly by neurotransmitter, as well as the positive or negative nature of the neurotransmitter’s impact. Specifically, the person was placed in a state of relaxation before starting. The test involved watching a short video or listening to an audio music file with specific labels indicating the emotions they were intended to evoke. Both EEG waves and, based on them, the values of the artificial neurotransmitters produced by the platform were recorded.
Since the goal of this study was to assess the feasibility of an indirect qualitative measurement of neurotransmitters and emotions using EEG data and subsequently integrate this module into the DSS (which simulates neurotransmitter variations and constructs mental state transition paths), a small statistical analysis was performed to determine the feasibility. Such an analysis may be carried out in the future to build statistically significant samples and, more importantly, to understand the differentiation and variability across individuals when exposed to the same stimulus. Therefore, this research focuses on exploring the feasibility of developing an AI system grounded in neurotransmitter dynamics. The objective is to enhance and complement current advancements in emotional computing and AI by introducing a novel cognitive dimension. This dimension emulates the functioning of neurotransmitters in humans, enabling the generation of emotions and affections or facilitating the amplification and attenuation of emotional states.
As we can conclude from
Figure 8, the experiments have shown that if we consider cortisol, it has an impact on the following cerebral areas: FP1, FP2, F7, F8, and Fz. In addition, the color blue stands for a negative or activating state. Differently, if we look at the third row corresponding to GABA, we can conclude that the involved cerebral areas are FP1, T3, and T4. The red color stands for a positive state, and so on.
From
Figure 8, we can reach the following conclusions:
Dopamine (red): Associated with prefrontal (FP1, FP2, F3, F4) and temporal (T3, T4) areas which are involved in motivation, pleasure, and gratification. Dopamine influences positive emotions and motivation.
Serotonin (red): Associated with prefrontal areas (FP1, FP2, F3, F4) crucial for mood regulation. Serotonin is involved in emotional well-being and calmness.
GABA (red): Predominant in temporal areas (T3, T4), where it helps regulate anxiety and promotes a calm state. GABA is an inhibitor that reduces activation and anxiety.
Adrenaline (blue): Connected to frontal and prefrontal areas (FP2, F3, F4, F7, F8), where it contributes to states of alertness and activation. It is involved in the fight-or-flight response and can induce anxiety.
Cortisol (blue): Associated with prefrontal areas (FP1, FP2, F7, F8, FZ) related to stress and anxiety. Cortisol is known as the “stress hormone” and negatively affects mood under prolonged conditions.
Oxytocin (red): Present in temporal areas (T3, T4), where it influences social ties and affection. Oxytocin is considered the “love hormone” and promotes social relationships.
Endorphin (red): Present in central areas (C3, C4), where it contributes to pain reduction and feelings of pleasure. Endorphins are natural analgesics that positively affect mood.
Thus,
Figure 8 can be seen as proof in understanding how major neurotransmitters affect different emotional states in brain areas monitored by EEG. The classification into positive, negative, or neutral, based on Ekman’s scale, helps us distinguish emotional nuances and interpret EEG activations more accurately. This scheme provides a scientifically integrated picture that allows us to better understand how different neurotransmitters modulate our mental and behavioral activity.
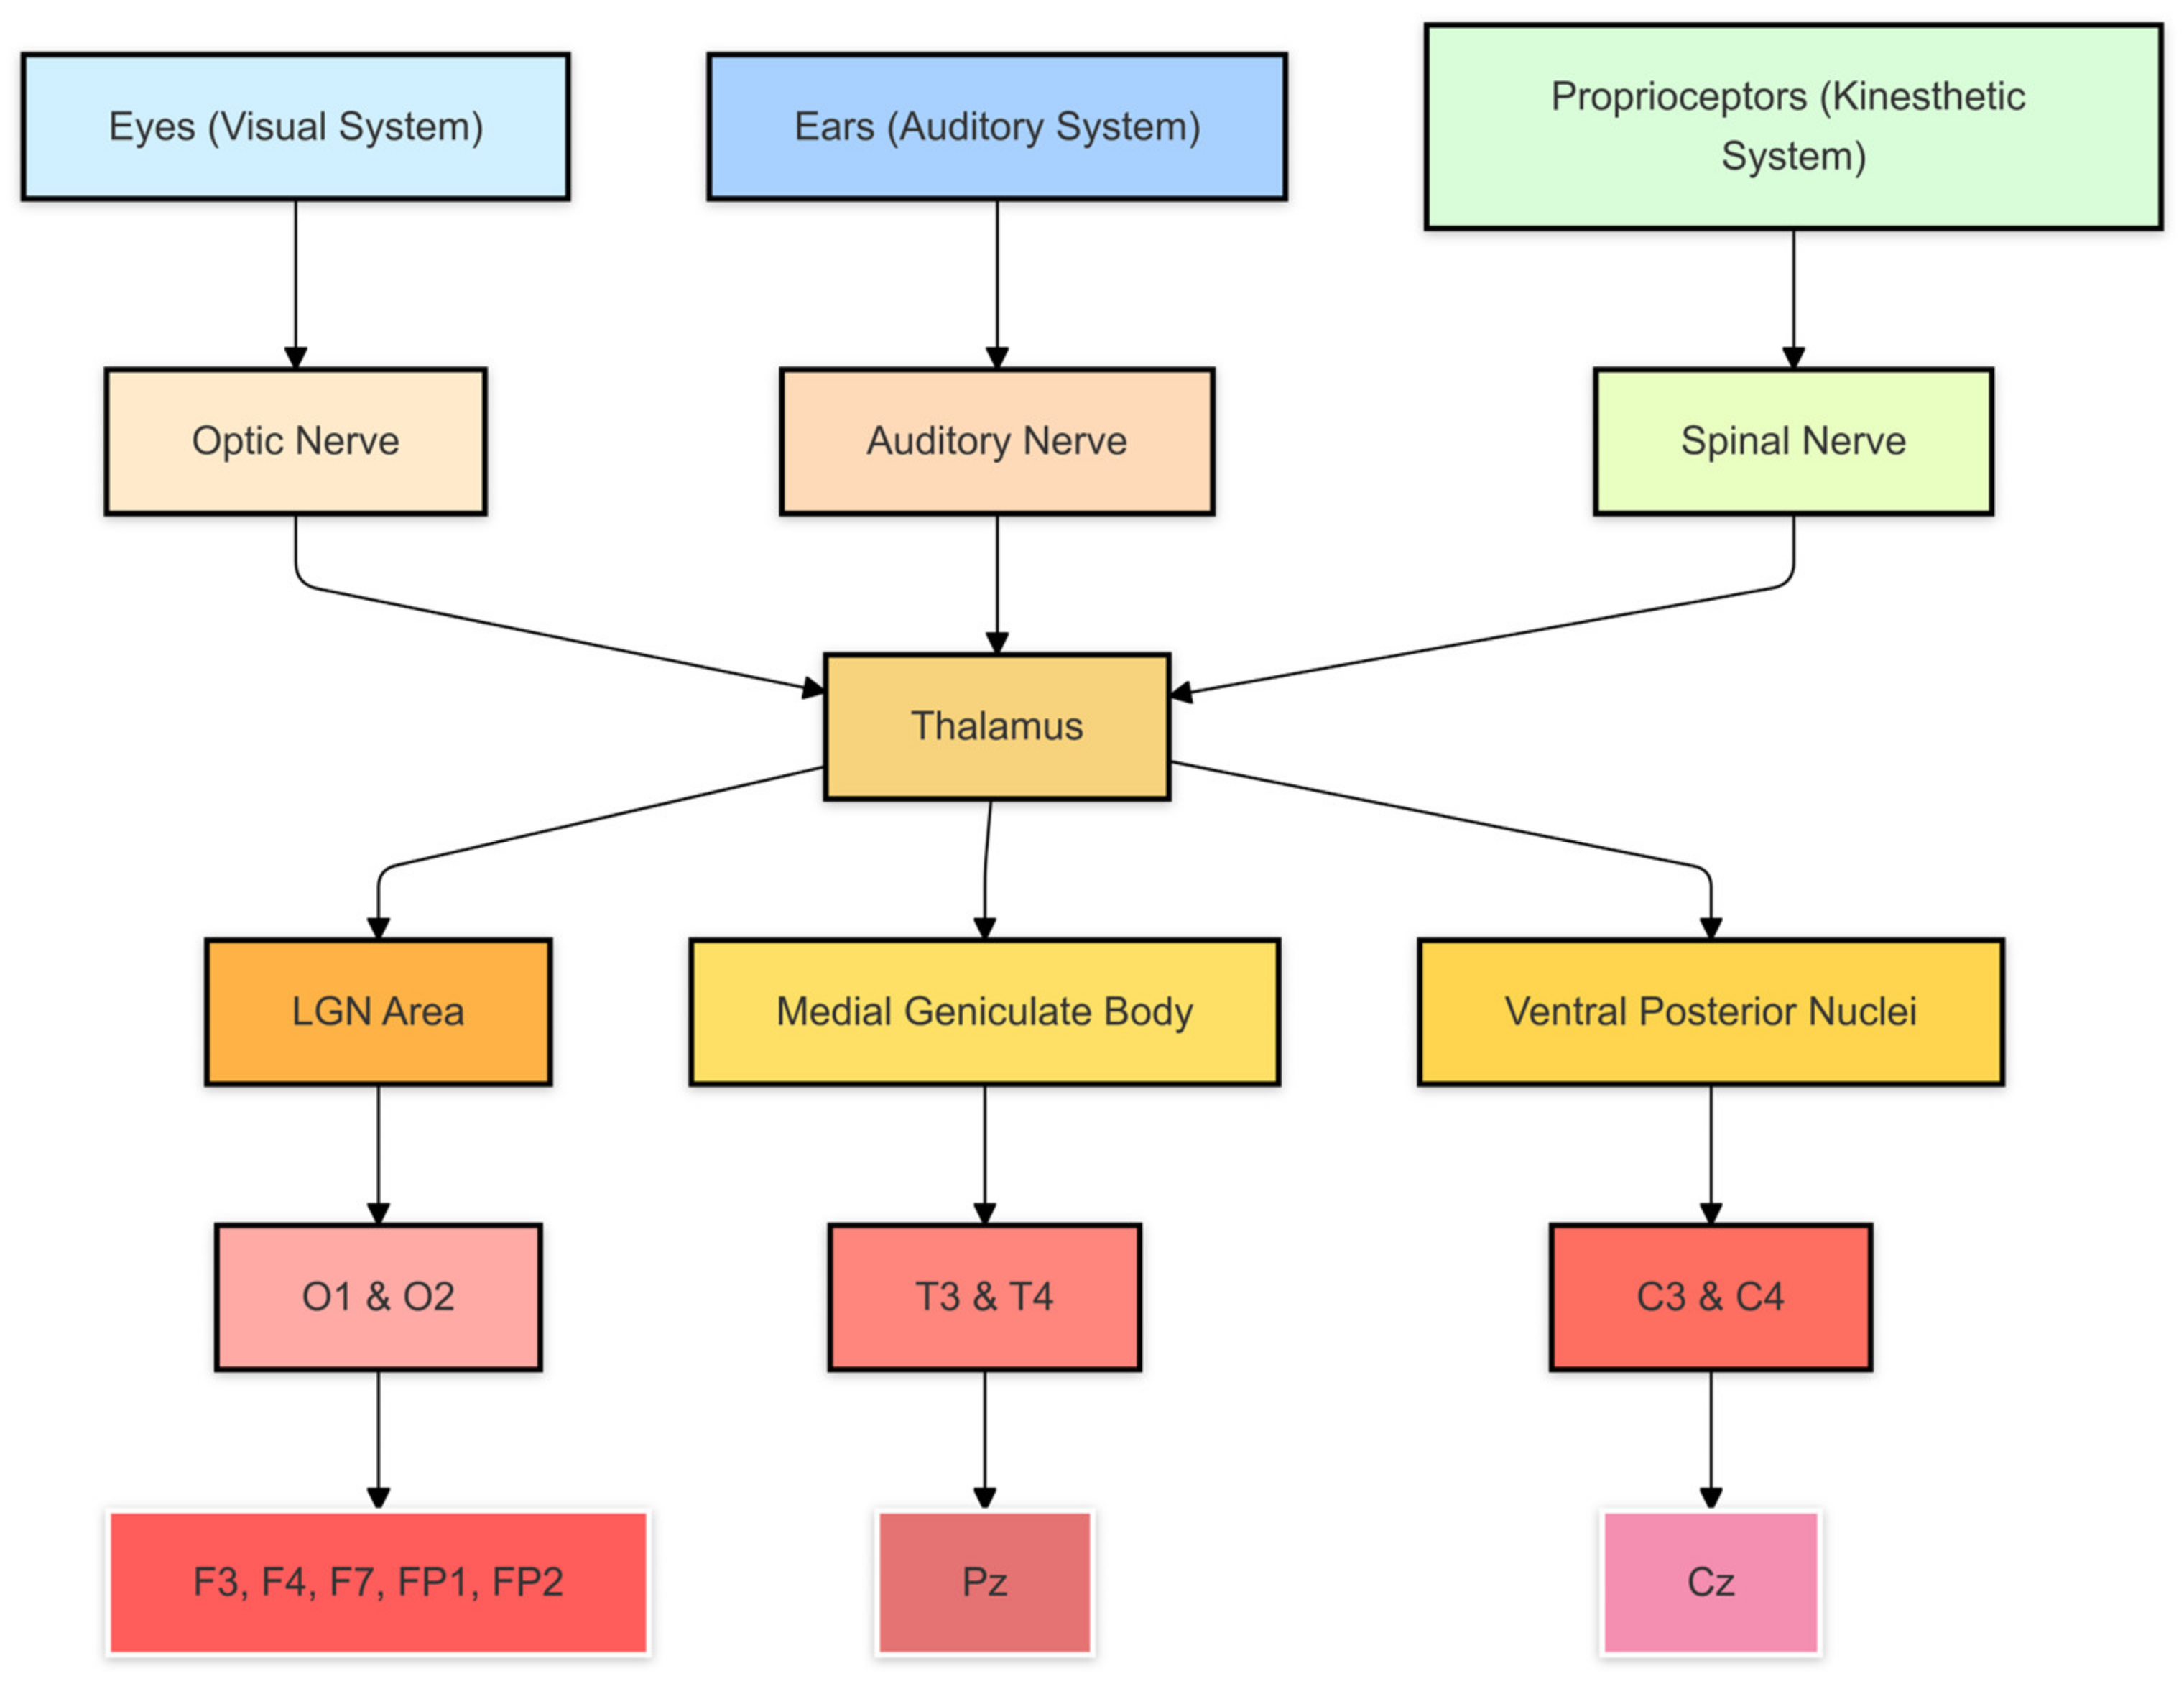
Sensory information begins its journey from our sense organs, such as the eyes and ears. Light entering the eyes and sounds picked up by the ears are transformed into electrical signals by the retina and cochlea, respectively, which are then sent to the brain through the optic nerve and auditory nerve. These signals converge at a central structure called the thalamus, which acts as a sorting center: the thalamus processes and directs information to the respective cortical processing centers.
After passing through the thalamus, visual signals are sent to the occipital areas, where EEG electrodes monitor activity related to visual perception, while auditory signals reach the temporal areas, which can be detected by EEG sensors placed on T3 and T4. In contrast, tactile and movement signals, such as those from the skin and muscles, are sent to the parietal and somatosensory areas, which are monitored by central electrodes (such as C3 and C4). Each cortical area is responsible for processing specific types of sensory information, resulting in emotional and cognitive responses that can be identified and analyzed through the activity patterns recorded by EEG electrodes. Examining this pathway, as illustrated in
Figure 9, enables us to track how various sensory stimuli interact with the brain network to activate neurotransmitters, which are subsequently mapped within our DSS.
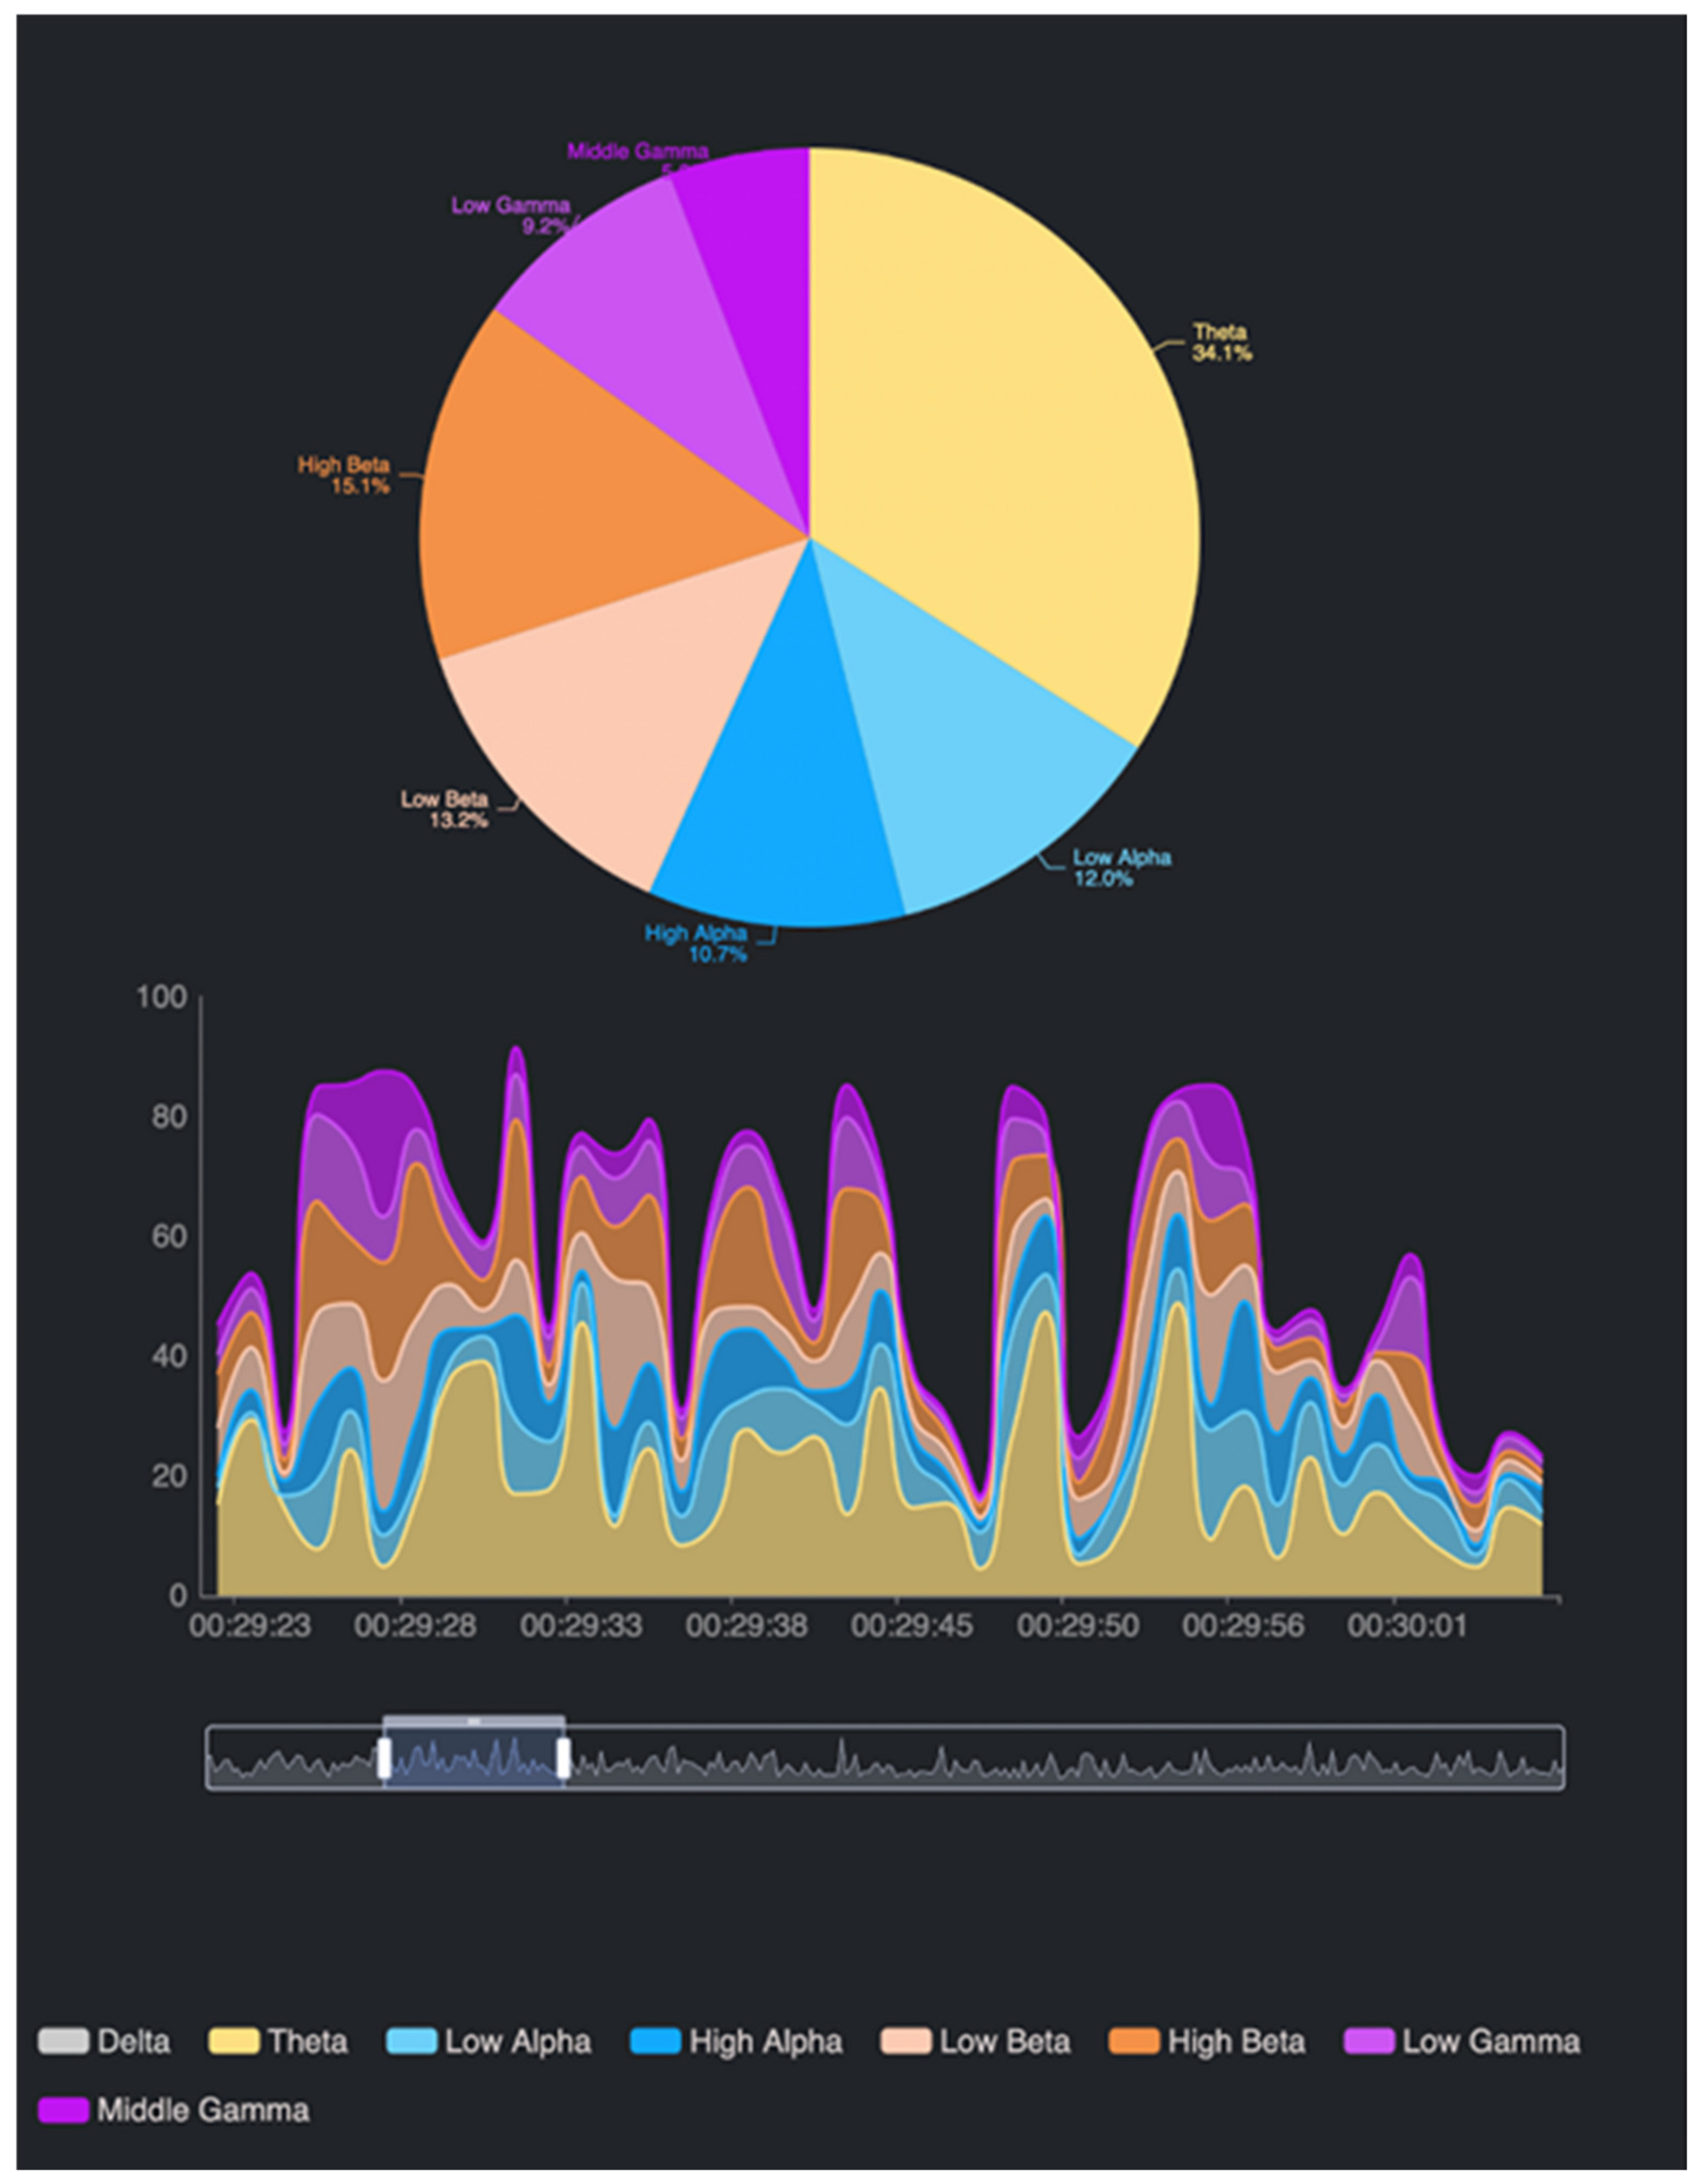
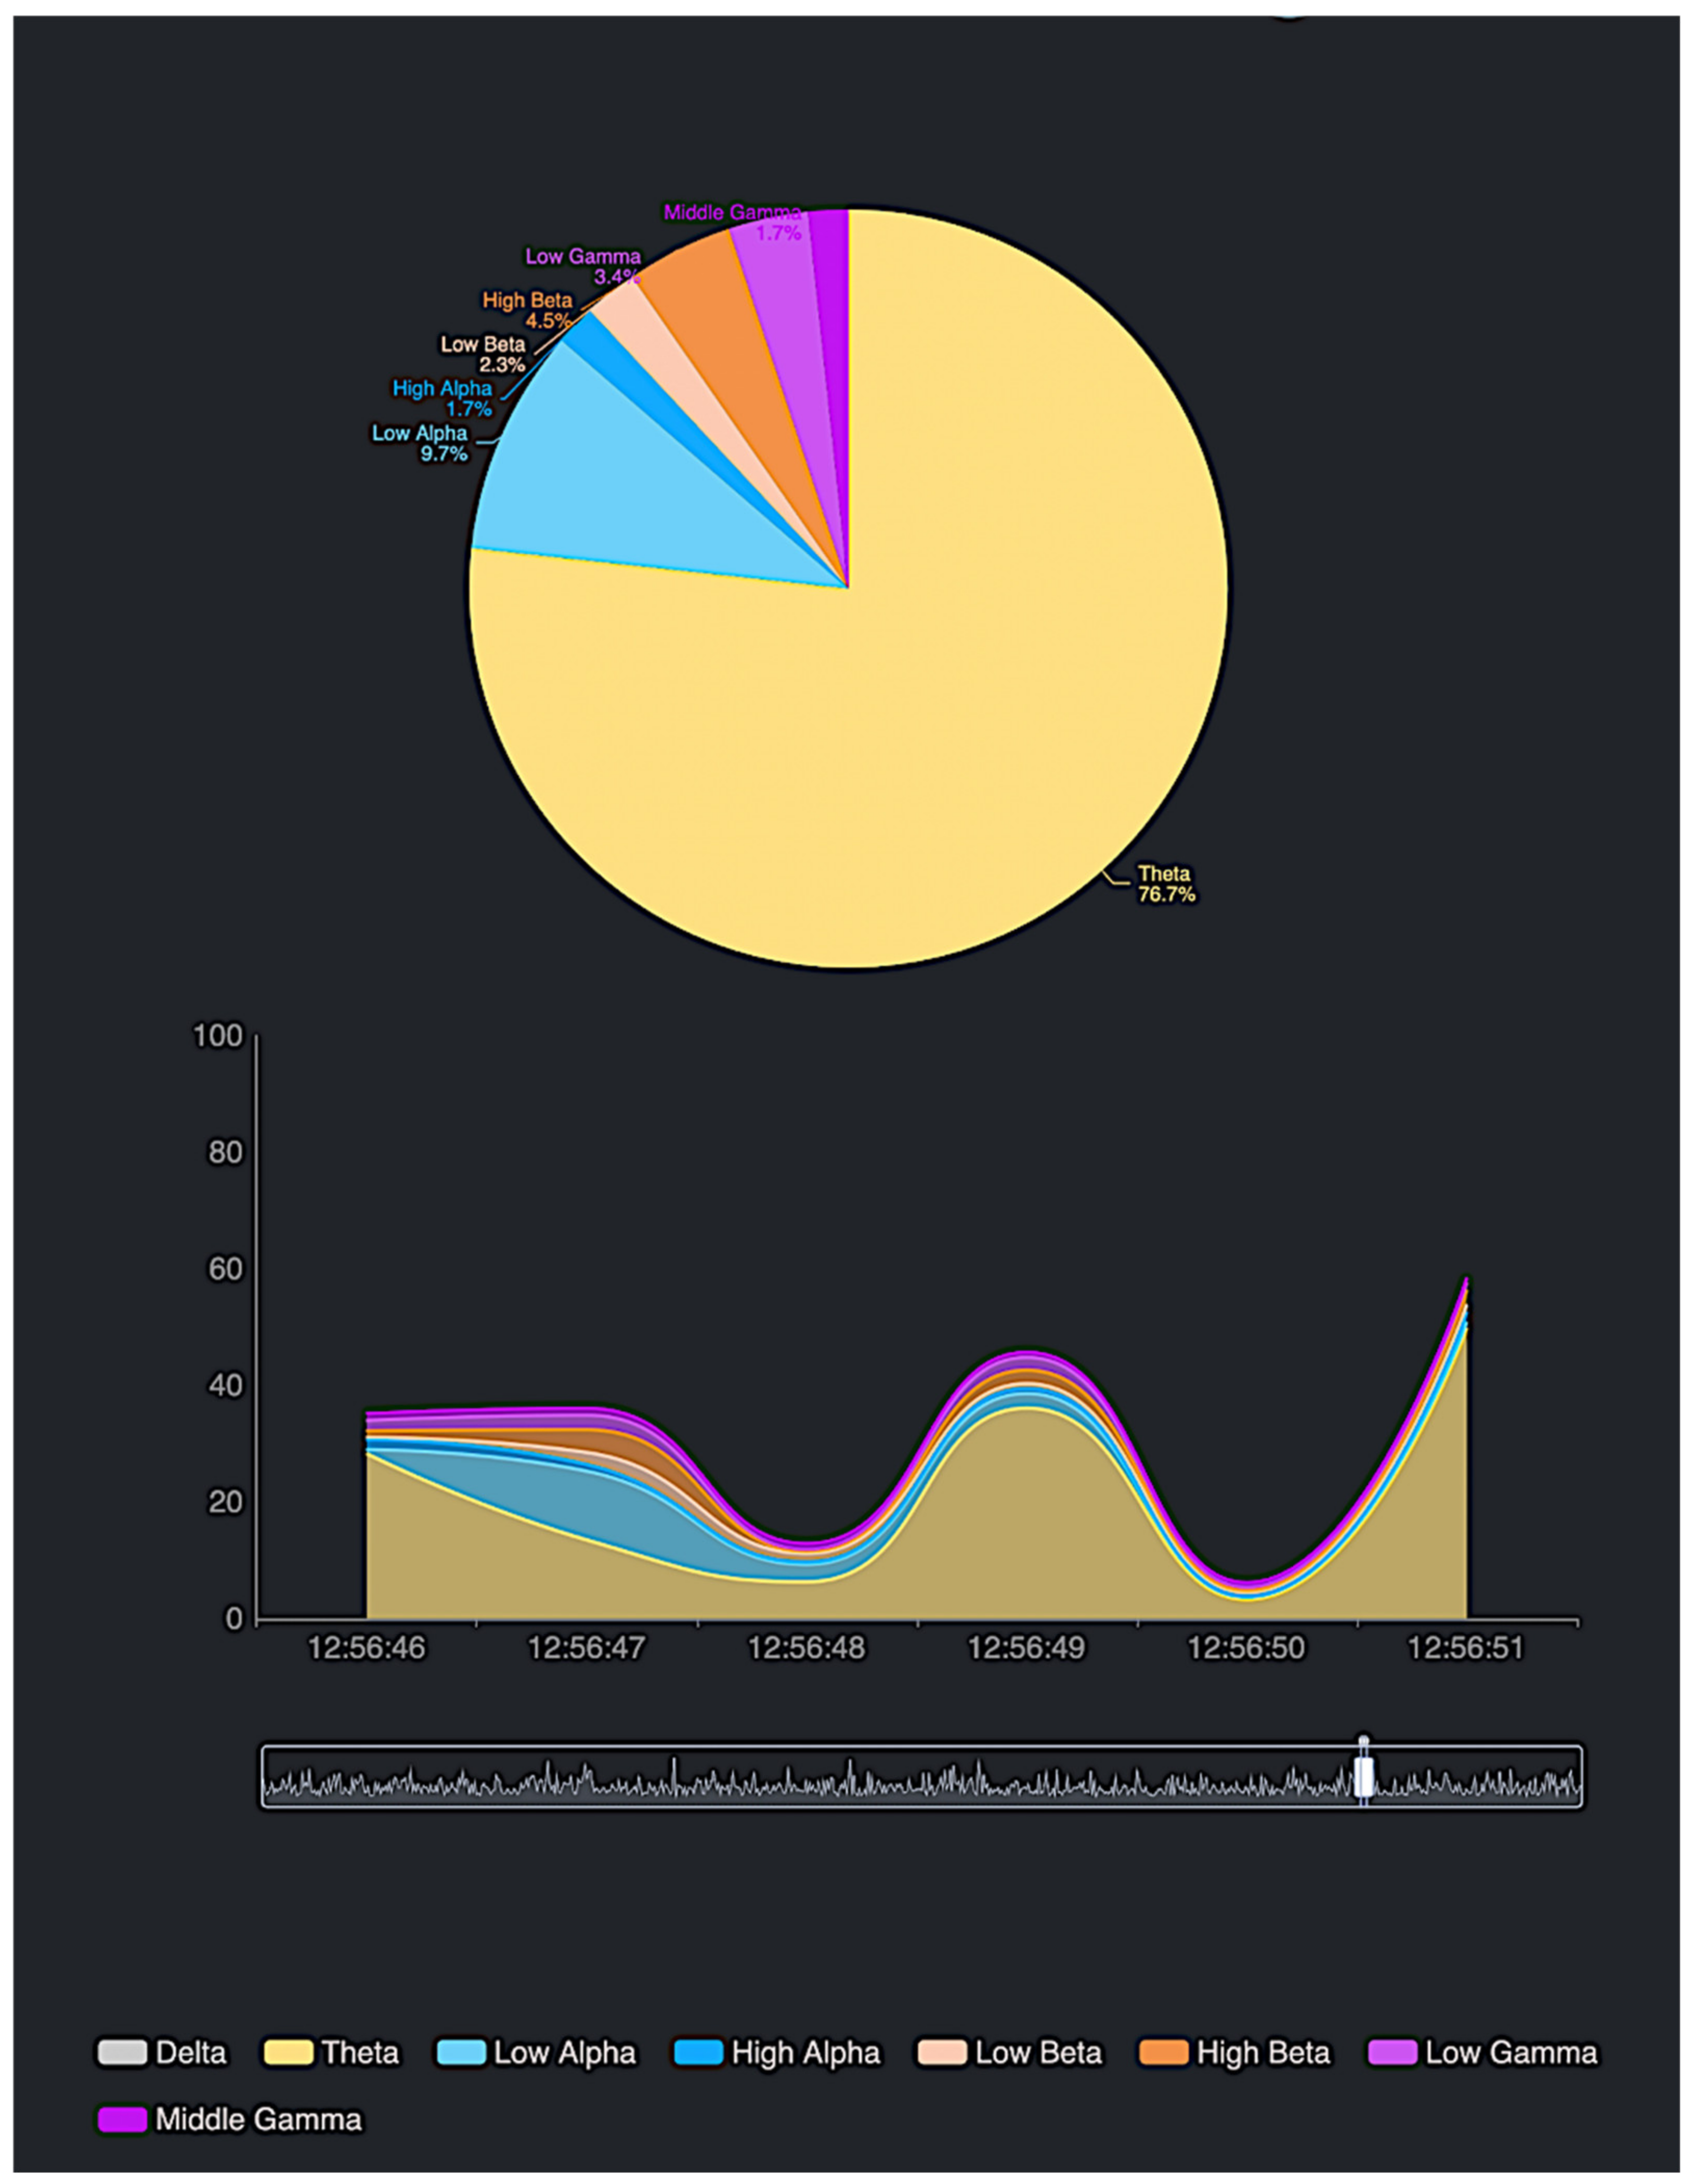
To evaluate the effectiveness of EEG technology in combination with the DSS in modeling neurotransmitter behavior, we utilized a portable EEG device. This device operates by acquiring neuronal signals through electrodes placed on the scalp, processing the signals, and transmitting the data via Bluetooth to a connected application. The EEG signals are categorized into distinct frequency bands—delta, theta, alpha, beta, and gamma—each associated with specific mental states. The collected data are then represented in various graphical formats, such as pie charts and timelines (see
Figure 10), which illustrate the evolution of brain activity over time with a specific expansion of the theta component if we compare it with the previous
Figure 6. This tool allowed us to comprehensively analyze the progression of the subject’s mental states during the session.
At the start of the session, the subject exhibited a state of neural balance, with brain wave activity relatively evenly distributed across the alpha, beta, and theta bands. This state likely corresponds to a moment of relaxation combined with moderate alertness, such as during light activity or focus on non-demanding tasks. Gamma wave activity was minimal, reflecting the absence of intense mental engagement.
As the session progressed, a significant increase in theta wave activity was observed, accompanied by a reduction in beta and gamma wave activity. This shift indicates that the subject entered a state of deep relaxation or meditation, characterized by mental quiescence and reduced responsiveness to external stimuli. Alpha waves, representing calm alertness, exhibited minor fluctuations; however, theta waves became the dominant frequency, clearly reflecting the subject’s deepened relaxation.
In subsequent stages, theta wave activity continued to dominate, signifying an advanced state of relaxation. Beta wave activity decreased further, and gamma wave activity remained at minimal levels, indicating a near-complete absence of intense cognitive effort. This phase suggests that the subject may have transitioned into a deeper state of relaxation, possibly entering a rest stage or a phase of deep meditation.
Toward the end of the session, slight fluctuations in theta waves were noted, accompanied by a moderate recovery in alpha wave activity. This pattern suggests that the subject might have been transitioning back to a state of focused or relaxed alertness. However, beta and gamma wave activity remained relatively low, indicating that while some cognitive processes were occurring, they were not associated with demanding or high-intensity tasks.
This progression demonstrates the utility of the EEG–DSS combination in monitoring and analyzing shifts in mental states, providing valuable insights into the subject’s transitions between relaxation, mindfulness, and alertness.
The absence of delta waves confirms that the experiments were conducted during working hours, i.e., in states of attention. This is because the aim of the experiments was to associate emotions/affections—induced by watching short films or listening to audio files with clear and targeted emotional/affective stimulation—with the neurotransmitters simulated by the platform developed in this study.
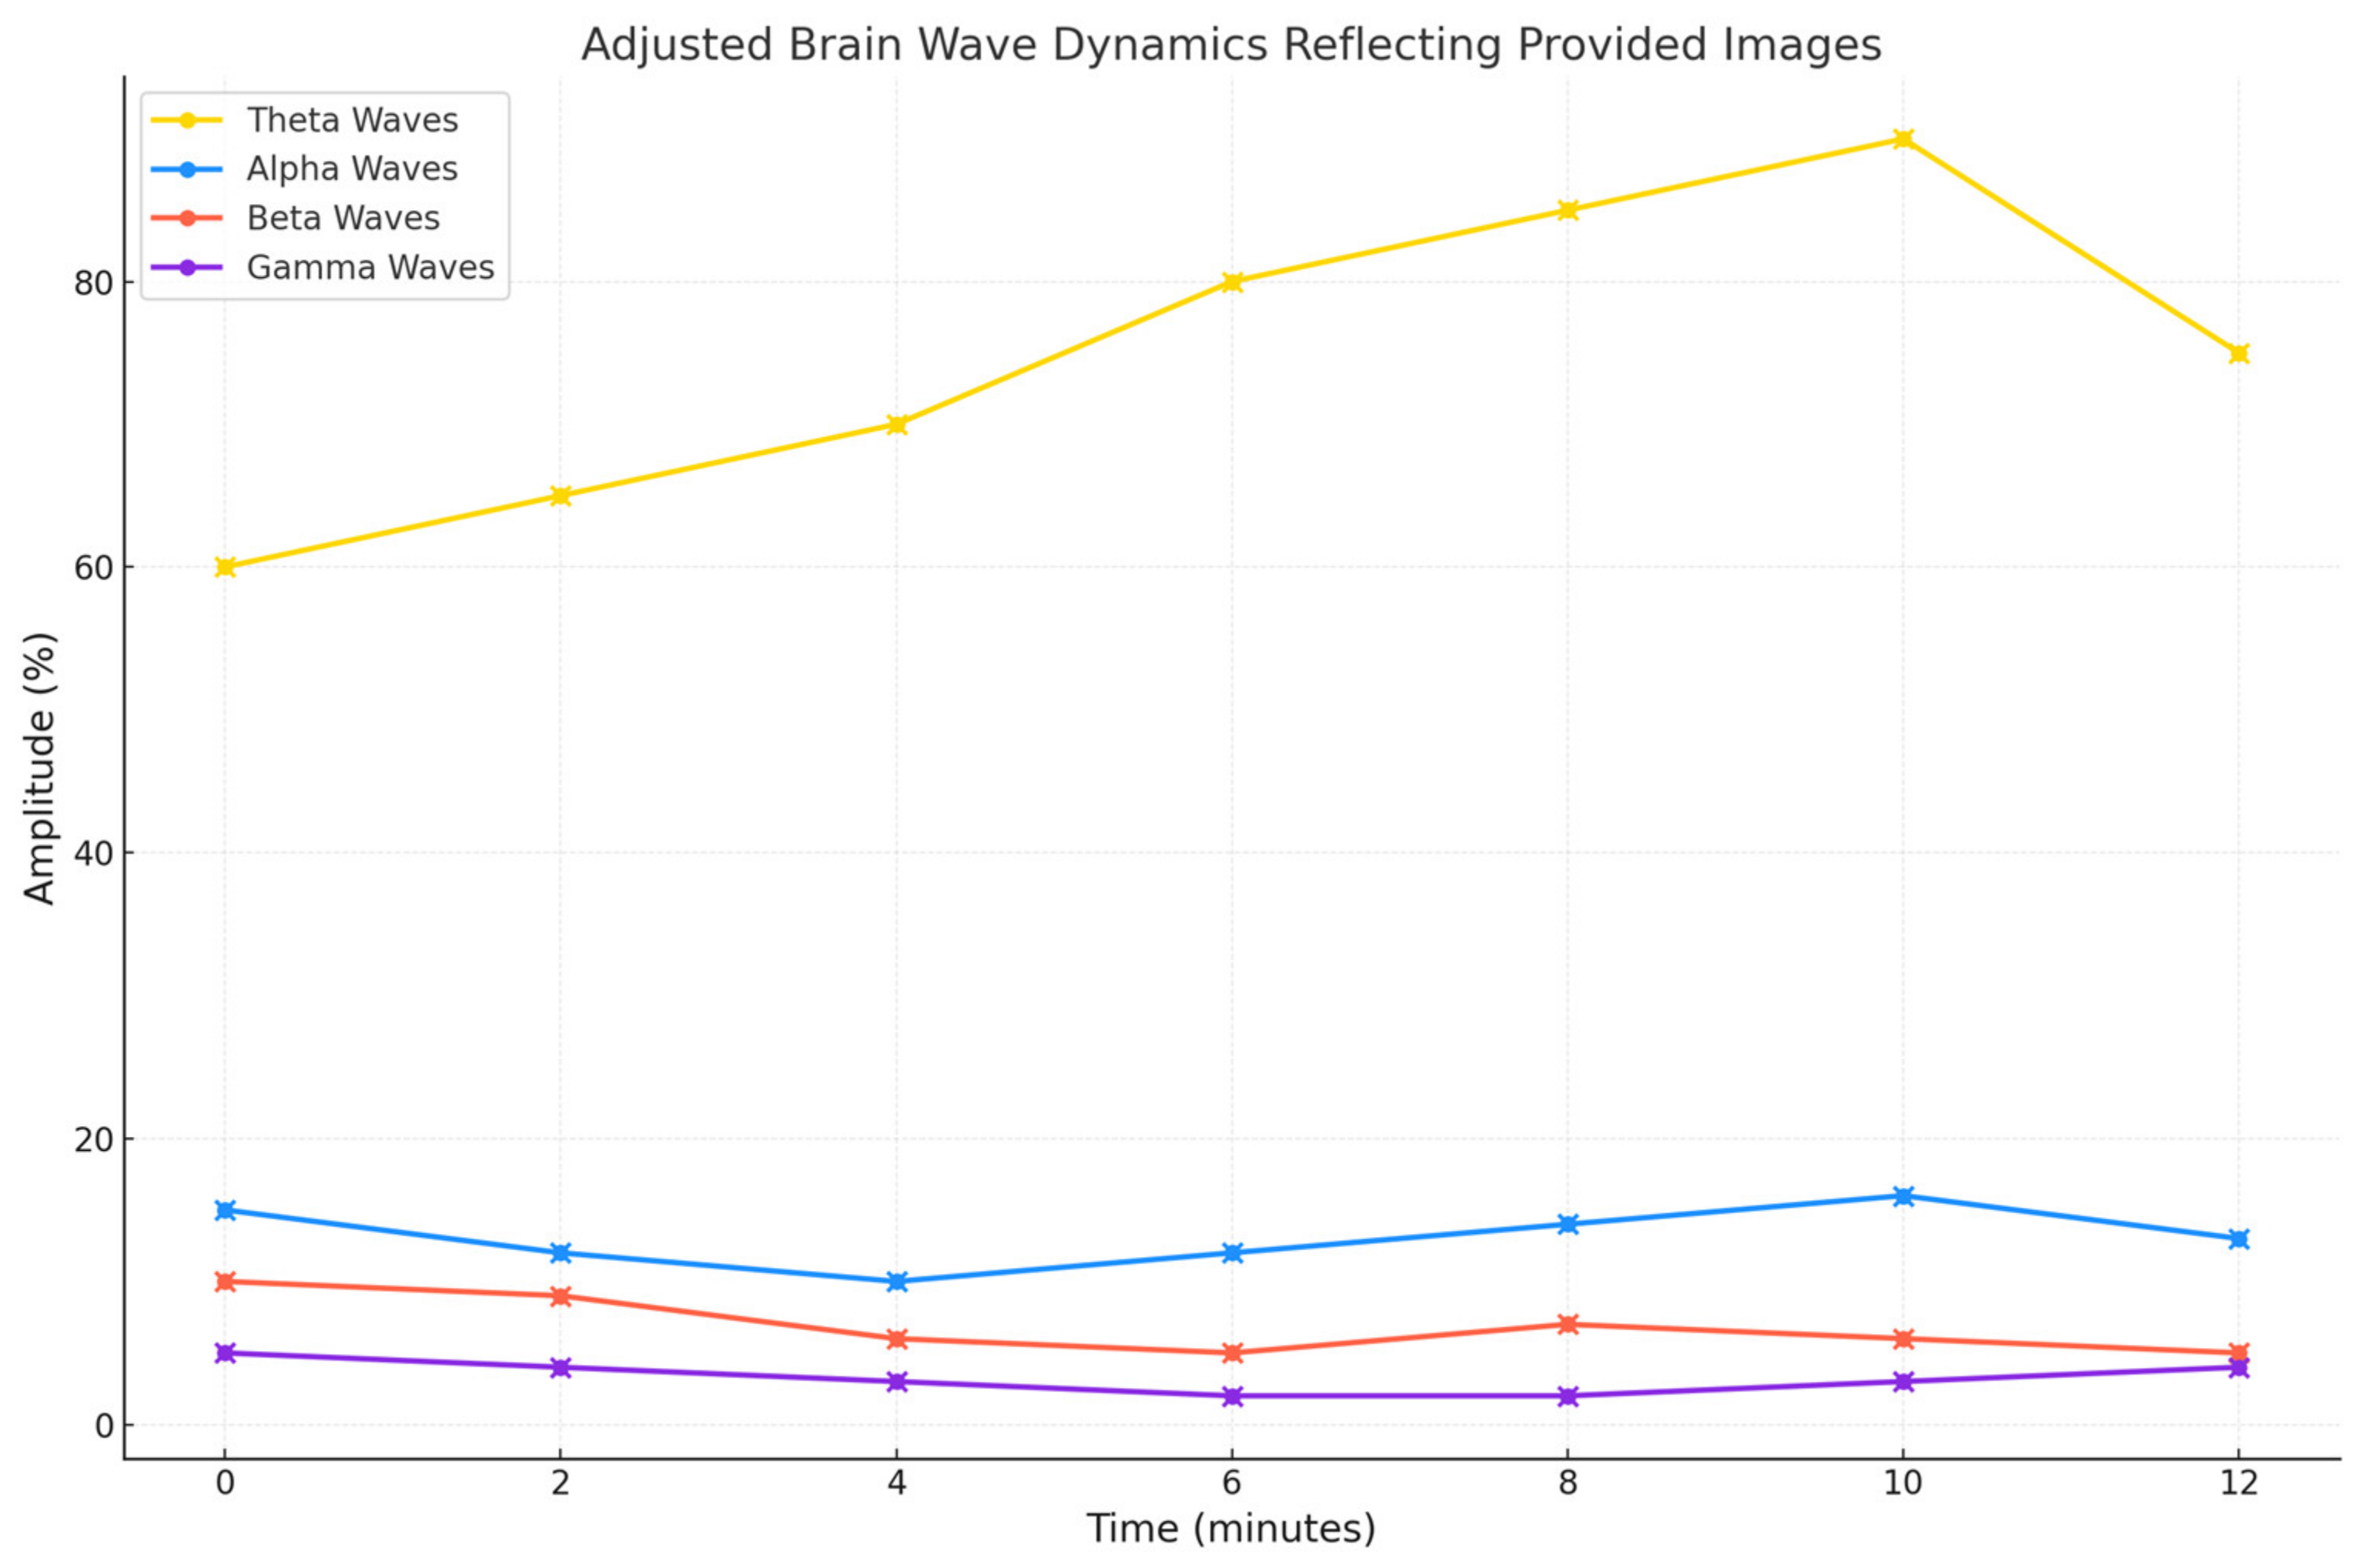
Figure 11 shows an example of EEG experimentation by observing the subject’s mental state as reflected during a typical session of data acquisition and analysis with our solution composed of an EEG device and a DSS engine for neurotransmitter status evaluation.
Initially, brain waves show a balanced distribution, indicating a state of relaxed alertness, as differently reported also in
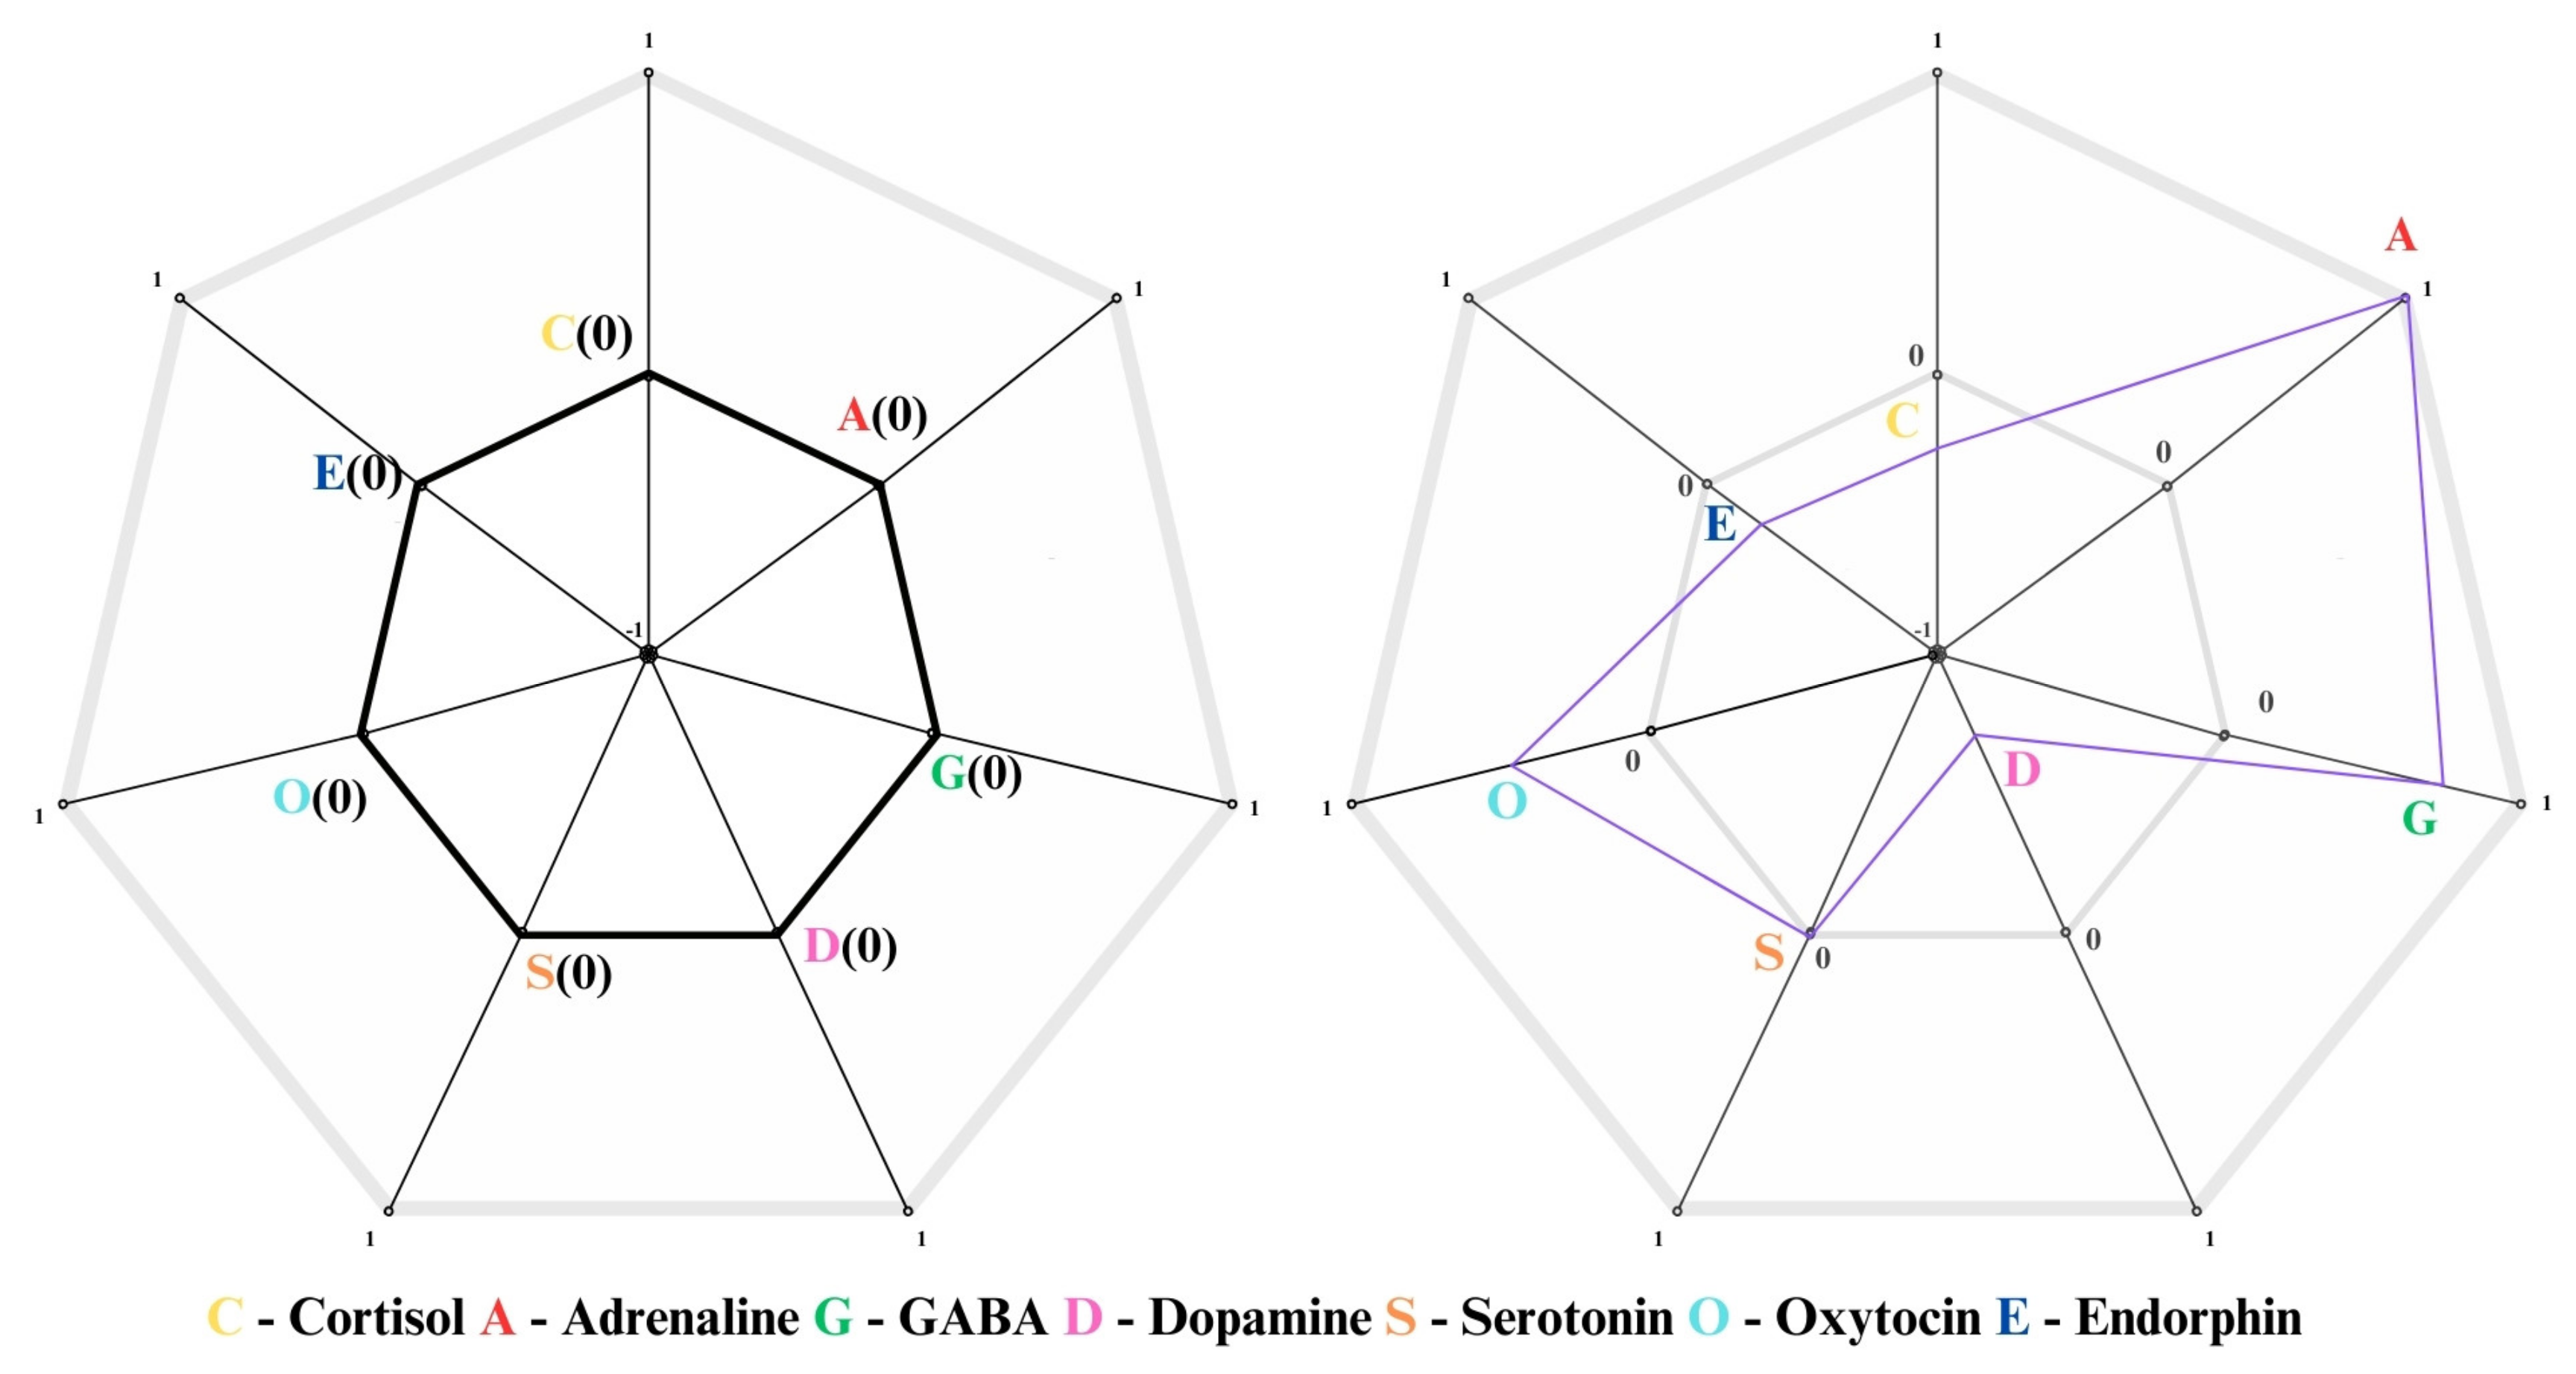
Figure 12 and
Figure 13. Indeed,
Figure 12 gives us the status of neurotransmitters with respect to the emotions and affections, while
Figure 13 shows in a fascinating graph the 7D space of neurotransmitters mapped in a custom 2D spider web chart. With time passing during the session, theta waves rise to as high as around the 10th minute in order to transition deep into relaxation or meditation. This dominance of theta waves, with a consistent decrease in beta waves and a negligible amount of gamma waves, is reflective of disengagement from cognitive tasks and external stimuli. Fluctuations in alpha waves indicate states of calm alertness, providing a baseline of mental stability. In all, the trend in the EEG data indicates a gradual transition from an initial ideal state of general awareness to a deeper mental relaxation stage and a subtle transition back towards an alert state, providing an indication of the dynamics of the subject’s mental engagement during the experiment.
If it is true, as it is, that this study is the first on the international scene to link EEG measurements with neurotransmitters through indirect estimations, it is evident that the main limitation of this work lies in its specific focus on feasibility. Therefore, future studies will be necessary to further solidify the connection between EEG measurements and neurotransmitters, supported by a more extensive and statistically robust dataset.
Additionally, to avoid promoting the EEG headset used, the brand and model have been deliberately omitted, as it is one of several commercial products intended for entertainment rather than biomedical purposes. In the future, an analysis comparing different EEG measurement systems within the entertainment sector could be an interesting avenue of research.
In the future, further research may expand this methodology and technology to include more individual and environmental variables, further strengthening the accuracy of the interpretive model, thanks to more and more, deeper and deeper experiments and data analysis.
It is relevant to mention that this research was based on determining the feasibility of the construction of an AI system based on neurotransmitters. It aims to contribute and complement current research in emotional computing and AI with the addition of a new cognitive dimension, able to emulate the way neurotransmitters operate in humans for the creation of emotions and affections, or for the amplification/attenuation of emotional states. The results obtained encourage further investigation into several aspects, especially the following:
- (i)
Wide analyses with a representative sample of people to refine the model.
- (ii)
The possibility of expanding the system to secondary and less dominant neurotransmitters, though part of human intelligence.
- (iii)
Practical applications in the real world for which the pure rationality of AI is a limitation, and where it is preferable to have a more humanized rational–emotional intelligence.
- (iv)
Exploration of the DSS for possible extension from mere application with neurotransmitters to the simulation of hormonal roles, thus making an AI system with a defined gender. This will further enhance the humanization of AI.
- (v)
As this is the first study to assess the feasibility of mapping neurotransmitters (a biochemical aspect) to EEG signals (a bioelectrical aspect), as suggested by an anonymous reviewer, the positive results obtained encourage further future research to explore the mapping of neurotransmitter activity to the intensities measured via EEG.
- (vi)
Furthermore, the reviewer highlights that muscular activity and environmental interference can affect EEG signals, generating artifacts or, more generally, background noise. Therefore, a more targeted study on clinical and empirical aspects could enable the development of specific techniques and algorithms for signal processing.
- (vii)
As a consequence of this study, a further topic to address in the context of AI will involve rational–emotional/affective mixing and their balance, control, and modulation, much like what occurs in humans.
- (viii)
The solution developed in this study could already be employed in systems that require AI to act as a rational–emotional decision-maker. For instance, it could be integrated with a traditional AI component, such as one used in natural language processing, alongside the component developed here for affective–emotional aspects. In this example of potential future development, the result would be a solution capable of processing natural language while also analyzing and considering the emotions underlying the speech.
- (ix)
Further future development of hybrid rational–emotional AI could focus on the field of image and video analysis. Specifically, a solution that integrates our neurotransmitter-based engine with deep neural network approaches, such as convolutional neural networks, generative adversarial networks, vision transformers, or reinforcement learning combined with neural networks for facial analysis and recognition, could serve as a valuable tool for analyzing facial expressions and micro-expressions. This would allow for the qualification of the emotional state of the speaker.
In turn, this will be further refined in subsequent research as a way of forwarding the convergence between artificial and human intelligence. The goal is to improve AI systems’ human cognition, emotion, and decision-making capabilities, narrowing the gap between artificial and human forms of intelligence.


