1. Introduction
The Internet of Things (IoT) is continuously evolving, playing a vital role in our daily life, while its application spreads to areas such as smart vehicles [
1], smart homes [
2], smart health [
3], smart factories [
4], and logistics [
5]. Cisco predicted that 66% of the world population will be using the Internet by 2023, a 15% increase from 2018. Also, there will be 3.6 connected devices per person, whereas it was just 2.4 connected devices per person in 2018 [
6].
The pervasiveness and subsequent acceptability of IoT in various industries have made IoT devices and infrastructures a conspicuous cyberattack target by malicious actors [
7,
8]. These actors continually exploit vulnerabilities in network infrastructures to gain unauthorized access, exfiltrate sensitive information, disrupt services, and cause significant financial and reputational damage. Consequently, the need for robust and reliable security mechanisms to counter these threats has never been more critical. To combat the ever-present cyberattacks, the concept of intrusion detection systems (IDSs) was coined. IDSs serve as an integral defence mechanism against such attacks. Over the years, IDSs have been broadly classified into three groups: misuse- or signature-based, anomaly-based, and hybrid IDSs. Misuse-based approaches tend to check network traffic for a known pattern of intrusion. As the system checks incoming traffic signatures, it can only detect known attacks. Furthermore, it is incredibly challenging to write signatures for all possible variations of attack. On the other hand, anomaly-based IDSs are capable of detecting both known and unknown attacks. These algorithms learn the patterns of non-intrusive traffic. Hence, they are capable of identifying an intrusive or unusual traffic pattern when they occur [
9]. Hence, the research community has adopted anomaly-based IDSs [
10] by virtue of them being able to detect both known and unknown attacks. Machine learning and deep learning models have been used to varying degrees of success for anomaly detection [
11]. Meanwhile, ML models have suffered from low detection accuracy, and DL models have been prone to overfitting [
12]. These models are trained to learn the patterns of normal traffic and of anomalous traffic; then, they are deployed to classify traffic in real time.
Computer vision and image processing have since been gaining traction and have widely been used to great effects in the healthcare sector, especially for the detection of lung cancer. However, transferring that success to the detection of network anomalies is still at an infant stage. One of the drawbacks to this is the apparent need to transform network data (which, by their nature, are non-image data) into image data. Converting non-image data to images has emerged as a promising technique in data analysis. It offers several advantages, including the utilization of powerful deep learning models for image recognition and pattern detection. Deep learning algorithms, such as convolutional neural networks (CNNs), have demonstrated remarkable performance in image-related tasks [
13]. By transforming non-image data into image representations, researchers can leverage the vast array of CNN architectures and image processing techniques, enabling them to extract meaningful patterns and insights from complex datasets [
14]. Furthermore, transforming network data into images allows the proposed IDSs to utilize advanced image processing and deep learning techniques, such as CNNs. This transformation not only enhances feature representation by capturing intricate spatial and frequency patterns but also enables more effective classification of complex attack types. By leveraging these techniques, the IDS achieves improved detection accuracy and robustness compared to traditional methods. Moreover, accurate IDSs require careful parameter selection to retain relevant and discriminative variables while discarding redundant ones [
15]. Existing approaches, such as filter-based and wrapper-based methods [
16], have limitations: wrapper methods are computationally expensive, while filter methods can be unstable [
17]. Hybrid filter-based selection methods offer a reliable alternative by combining multiple statistical approaches to assess input variable characteristics and inter-relationships. This ensures discriminative parameter selection, minimizing computational costs and addressing the curse of dimensionality.
This work presents a four-phase architecture for detecting and classifying cyberattacks in IoTs. The first phase consists of three steps—basic data preprocessing, outlier removal using the interquartile range (IQR), and data normalization using three algorithms—with the best-performing one automatically selected. To eliminate indiscriminate and redundant parameters, a hybrid filter-based parameter selection algorithm is proposed and implemented in the second phase. Parameter selection is a process of identifying optimal parameters using mathematical formulas or tools [
15,
18]. In the third phase, non-image network data are transformed into image data using the algorithm proposed in [
19], in order to leverage the power of image processing and classification. The Gabor filter is applied to capture relevant shape information from the resulting images. Finally, in the fourth phase, an ensemble CNN model is proposed for classification, consisting of a meta-classifier and three base CNN models with distinct architectures, hyperparameters, and feature representations. The ensemble model combines predictions from multiple base models to enhance the accuracy of IDSs.
The subsequent sections of this paper are organized as follows:
Section 2 discusses related techniques used in IDSs.
Section 3 provides detailed explanations of each of the four phases of the proposed scheme.
Section 4 describes the experimental setup, presents the observed results, and provides discussions. Finally, this paper is concluded in
Section 5.
2. Related Works and Background Study
The SHDA [
20] scheme introduces a novel approach to mitigate slow HTTP DDoS attacks by leveraging SDN controllers instead of deploying applications on web servers. By performing DDoS checks on incoming incomplete HTTP requests and forwarding only the complete ones to the server, the scheme effectively filters out malicious traffic. Similarly, in [
21], authors propose a cluster-based solution for DDoS mitigation in wireless sensor networks. Through random number assignment and periodic validation, sensor nodes are protected from unauthorized access, ensuring the integrity of the network. Additionally, the REATO framework [
22] addresses various DDoS attacks with a focus on rapid detection, countermeasures, and recovery, demonstrating favourable response time and latency. Furthermore, a multi-level mitigation framework [
23] aligns with the layers of the Industrial Internet of Things (IIoT) architecture, protecting IIoT nodes through SDN-based gateways, IIoT control units at the fog level, and big data analysis at the cloud computing level for enhanced defence against cyberattacks. In the fog-to-things intrusion detection architecture [
24], a two-level classification approach is proposed. Ensemble learning is used for anomaly detection in the first level, while the second level focuses on attack classification. In another study [
25], an IDS is implemented using ensemble learning and decision tree recursive feature elimination (RFE) on the NSL-KDD dataset. Evaluation of ensemble techniques in [
26] shows that stacking outperforms AdaBoost and Bagging. Additionally, a cluster-based ensemble classifier in [
27] combines clustering and boosting for improved IDS prediction. SEHIDS, a self-evolving host-based intrusion detection system designed for IoT networks was introduced in [
28]. SEHIDS enhances security by utilizing adaptive deep learning models that evolve dynamically to counter new threats. It employs a hybrid detection approach, combining signature-based and anomaly-based methods to improve the detection accuracy while minimizing false positives. The system integrates federated learning, enabling distributed training across IoT nodes while preserving privacy.
An ML-based network intrusion detection optimization for cloud computing environments was proposed in [
29]. This system combines support vector machine and extreme gradient boosting (XGBoost) with the crow search algorithm (CSA) for hyperparameter optimization. The model enhances classification accuracy using XGBoost-based feature selection and is evaluated on NSL-KDD and UNR-IDD datasets. Results demonstrate improved detection performance and efficiency compared to traditional approaches. A hybrid CNN-BiLSTM-based network intrusion detection system tailored for SDN was proposed in [
30]. The model integrates a CNN for spatial feature extraction and BiLSTM for temporal feature learning, enhancing intrusion detection performance. This study utilizes various datasets, incorporating hybrid feature selection to improve classification accuracy. Their approach outperforms baseline models, such as CNN, AlexNet, and LeNet-5, achieving high accuracy and efficiency in detecting diverse attack types. However, a common limitation of these approaches is their dependency on traditional tabular data representations, which may not fully capture the complex patterns in network traffic. Additionally, while ensemble techniques enhance classification, they often suffer from high computational costs, making them impractical for real-time IDS deployment in IoT environments.
Numerous studies have delved into the application of CNNs in IDS. However, only a limited subset of these endeavours have involved a comprehensive transformation of network data into image data. In a recent study in [
31], an innovative IDS grounded in representation learning via fast Fourier transformation (FFT) was introduced. This unique approach entails the conversion of each traffic instance into an image format, effectively recasting the intrusion detection task as a classification problem. In a similar vein, the work in [
32] proposed the utilization of network spectrogram images, generated through short-time FFT, for enhancing intrusion detection performance and mitigating false alarm rates. Building upon these concepts, a more recent contribution by authors [
33] presented an IDS system that initially translates network traffic into image data. To bolster discriminative features, the system employs Gabor filters before harnessing CNNs for the classification task. Authors [
34] proposes Lightweight-Fed-NIDS, a federated learning-based IDS that integrates structured model pruning for efficiency. Using ResNet-50, ResNet-101, and VGG-19, it extracts features from network flow images while reducing computational overhead. Evaluations on UNSW-NB15, USTC-TFC2016, and CIC-IDS-2017 show a 99% accuracy. Despite the advantages of image-based IDS models, they introduce computational complexity that may hinder deployment in low-resource environments. FFT-based transformations, while effective in feature enhancement, are computationally expensive and may not scale well for large datasets. Additionally, most existing image-based IDS methods focus primarily on detection accuracy without optimizing computational efficiency, making them impractical for real-time applications.
In the realm of IDSs, approaches that convert network traffic into image data typically fall into one of two categories. The initial method entails the conversion of one-dimensional traffic data into a multidimensional matrix, while the alternative method employs FTT to effectuate the image transformation process [
35]. Despite the advantages offered by these techniques, they still exhibit notable limitations. The first approach can compromise the inherent correlations among different features [
36], and the utilization of FFT has been observed to introduce complexity concerns, particularly when applied to large-scale datasets [
37]. Furthermore, none of the aforementioned studies explicitly address the trade-offs between detection performance and computational cost, particularly in resource-constrained IoT environments. Optimizing feature selection remains an open challenge, as many methods either prioritize accuracy at the expense of efficiency or vice versa. This research introduces a novel hybrid approach that integrates feature selection and computational cost reduction, ensuring that network traffic transformation into image data are both effective and computationally viable. Notably, this study employs a cutting-edge technique for translating network traffic into image data. Following this initial transformation, the data undergo further refinement before constructing a classifier model using an ensemble CNN.
3. System Methodology
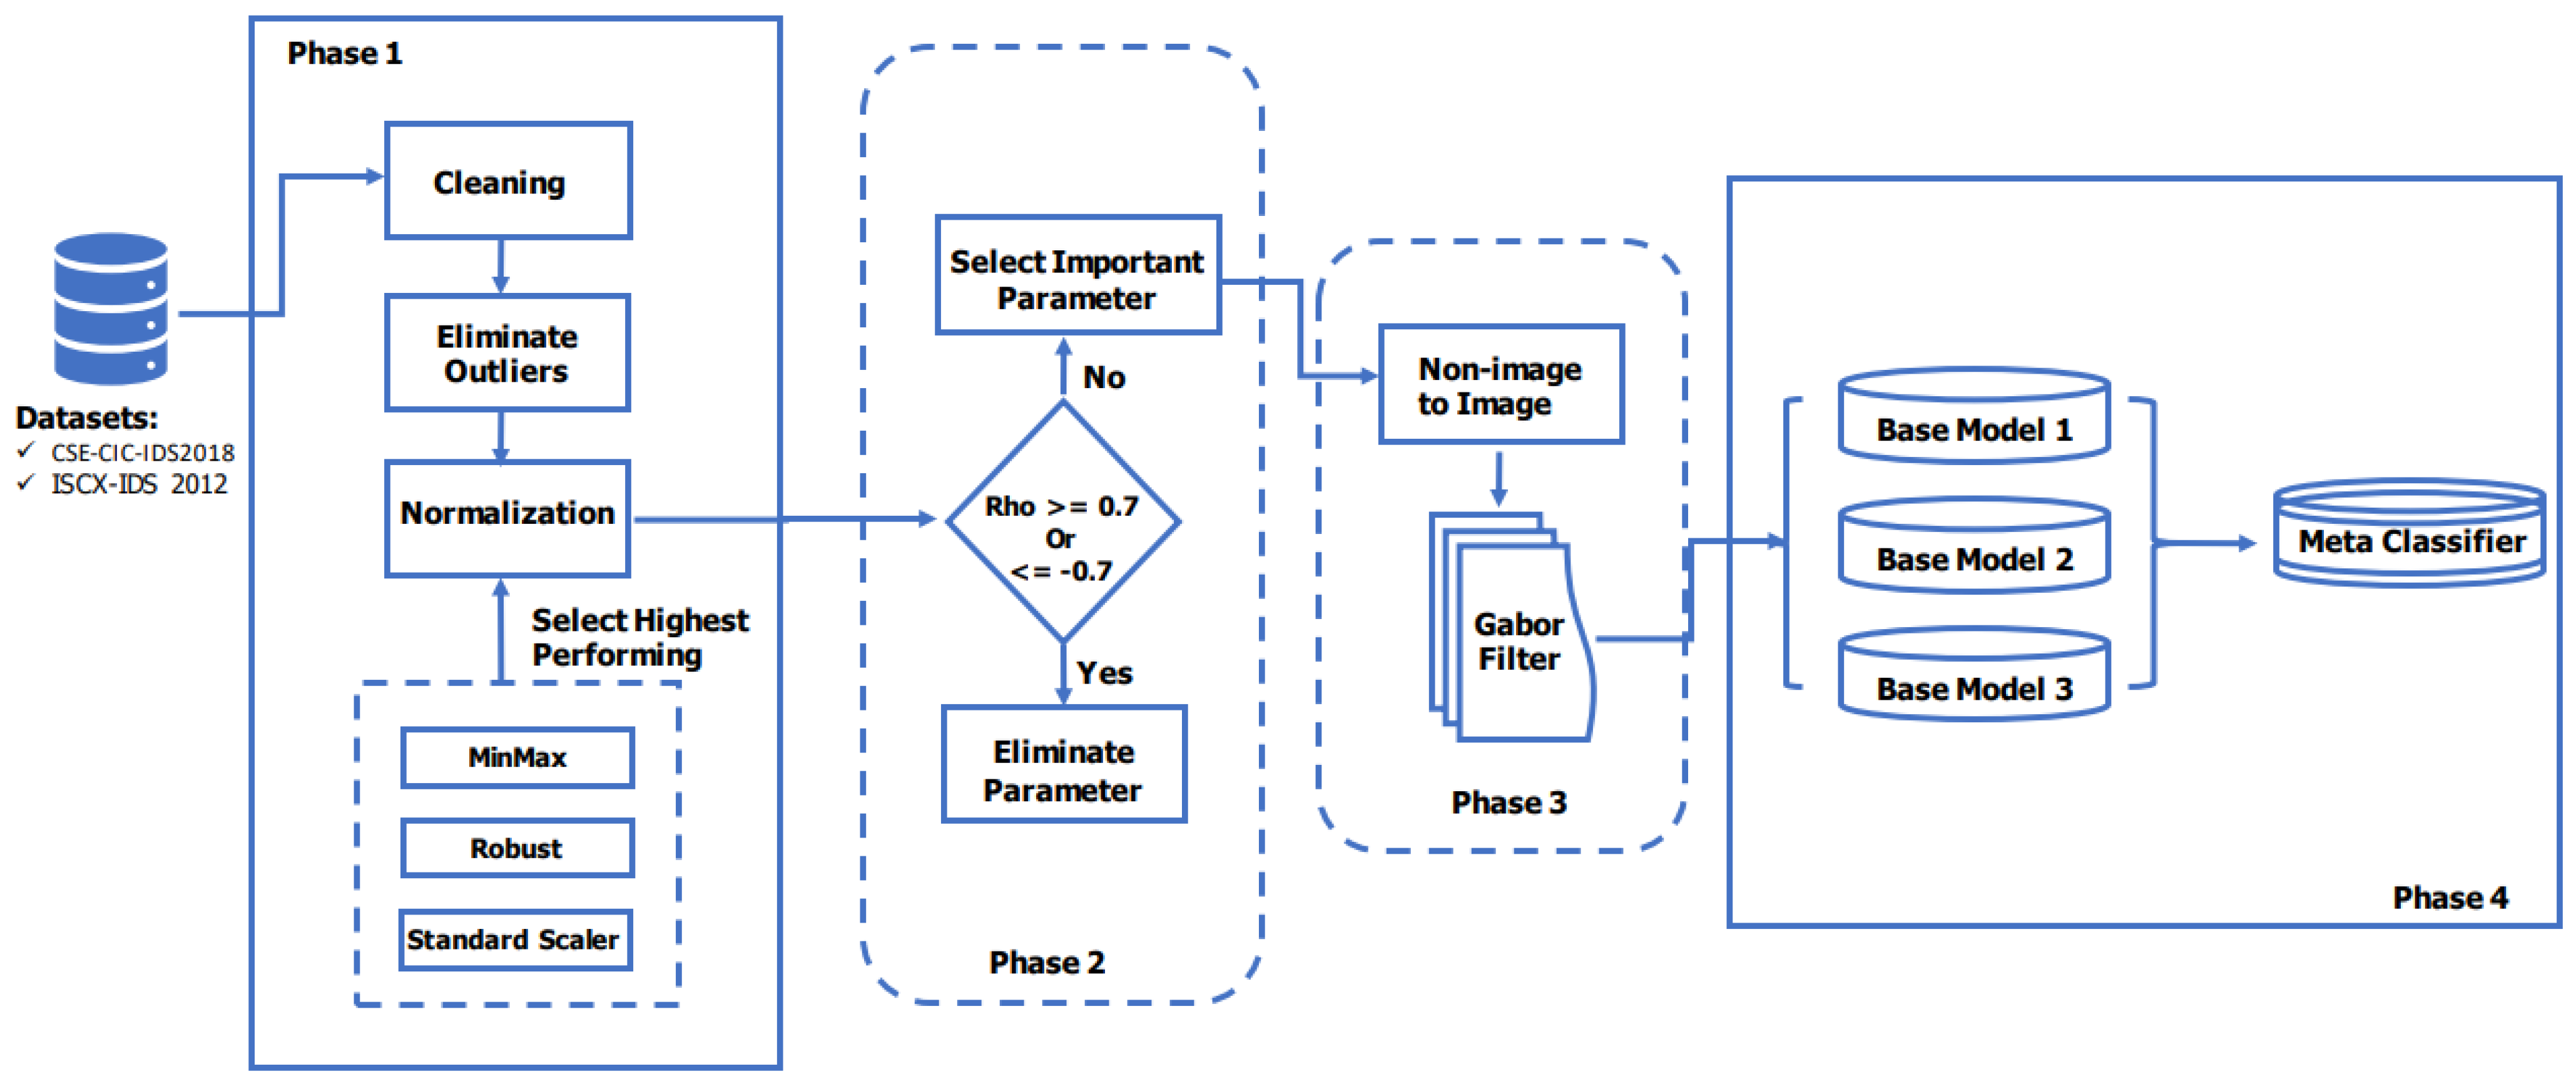
The proposed system framework consists of four phases: preprocessing, parameter selection, data transformation, and classification.
Figure 1 provides a graphical representation of a complete IDS. In the preprocessing phase, the dataset undergoes cleaning to remove zeroes (columns that consist of only zero values) and null values, followed by outlier elimination using the IQR method. Data normalization is then performed using three different methods: min–max, standard scaler, and robust scaler. The method with the highest average percentile rank is automatically selected. This marks the transition to phase two, which involves eliminating highly correlated features and ranking the remaining features based on their importance. This parameter selection phase yields the optimal parameters that contribute the most to the model. Moving on to the data transformation phase, the selected features are transformed from their tabular form into images to employ the power of image processing algorithms. The Gabor filter is applied to further enhance the transformed images. Finally, in the classification phase, an ensemble CNN, consisting of three base models, is utilized to accurately detect and classify network traffic into various attack types and benign traffic. The subsequent subsections delve into the details of each phase, their components, and objectives.
3.1. Preprocessing
This study utilizes three state-of-the-art datasets: CSE-CIC-IDS2018 [
38] (Data A), ISCX-IDS-2012 [
39] (Data B), and IoT-23 [
40] (Data C). These datasets were collected over multiple days and accurately represent real network traffic. Due to their differences, the processing techniques applied to each dataset vary slightly. The datasets consist of multiple CSV files, which are merged together for both Data A and B. Column names are standardized by removing extra trailing spaces in Data B.
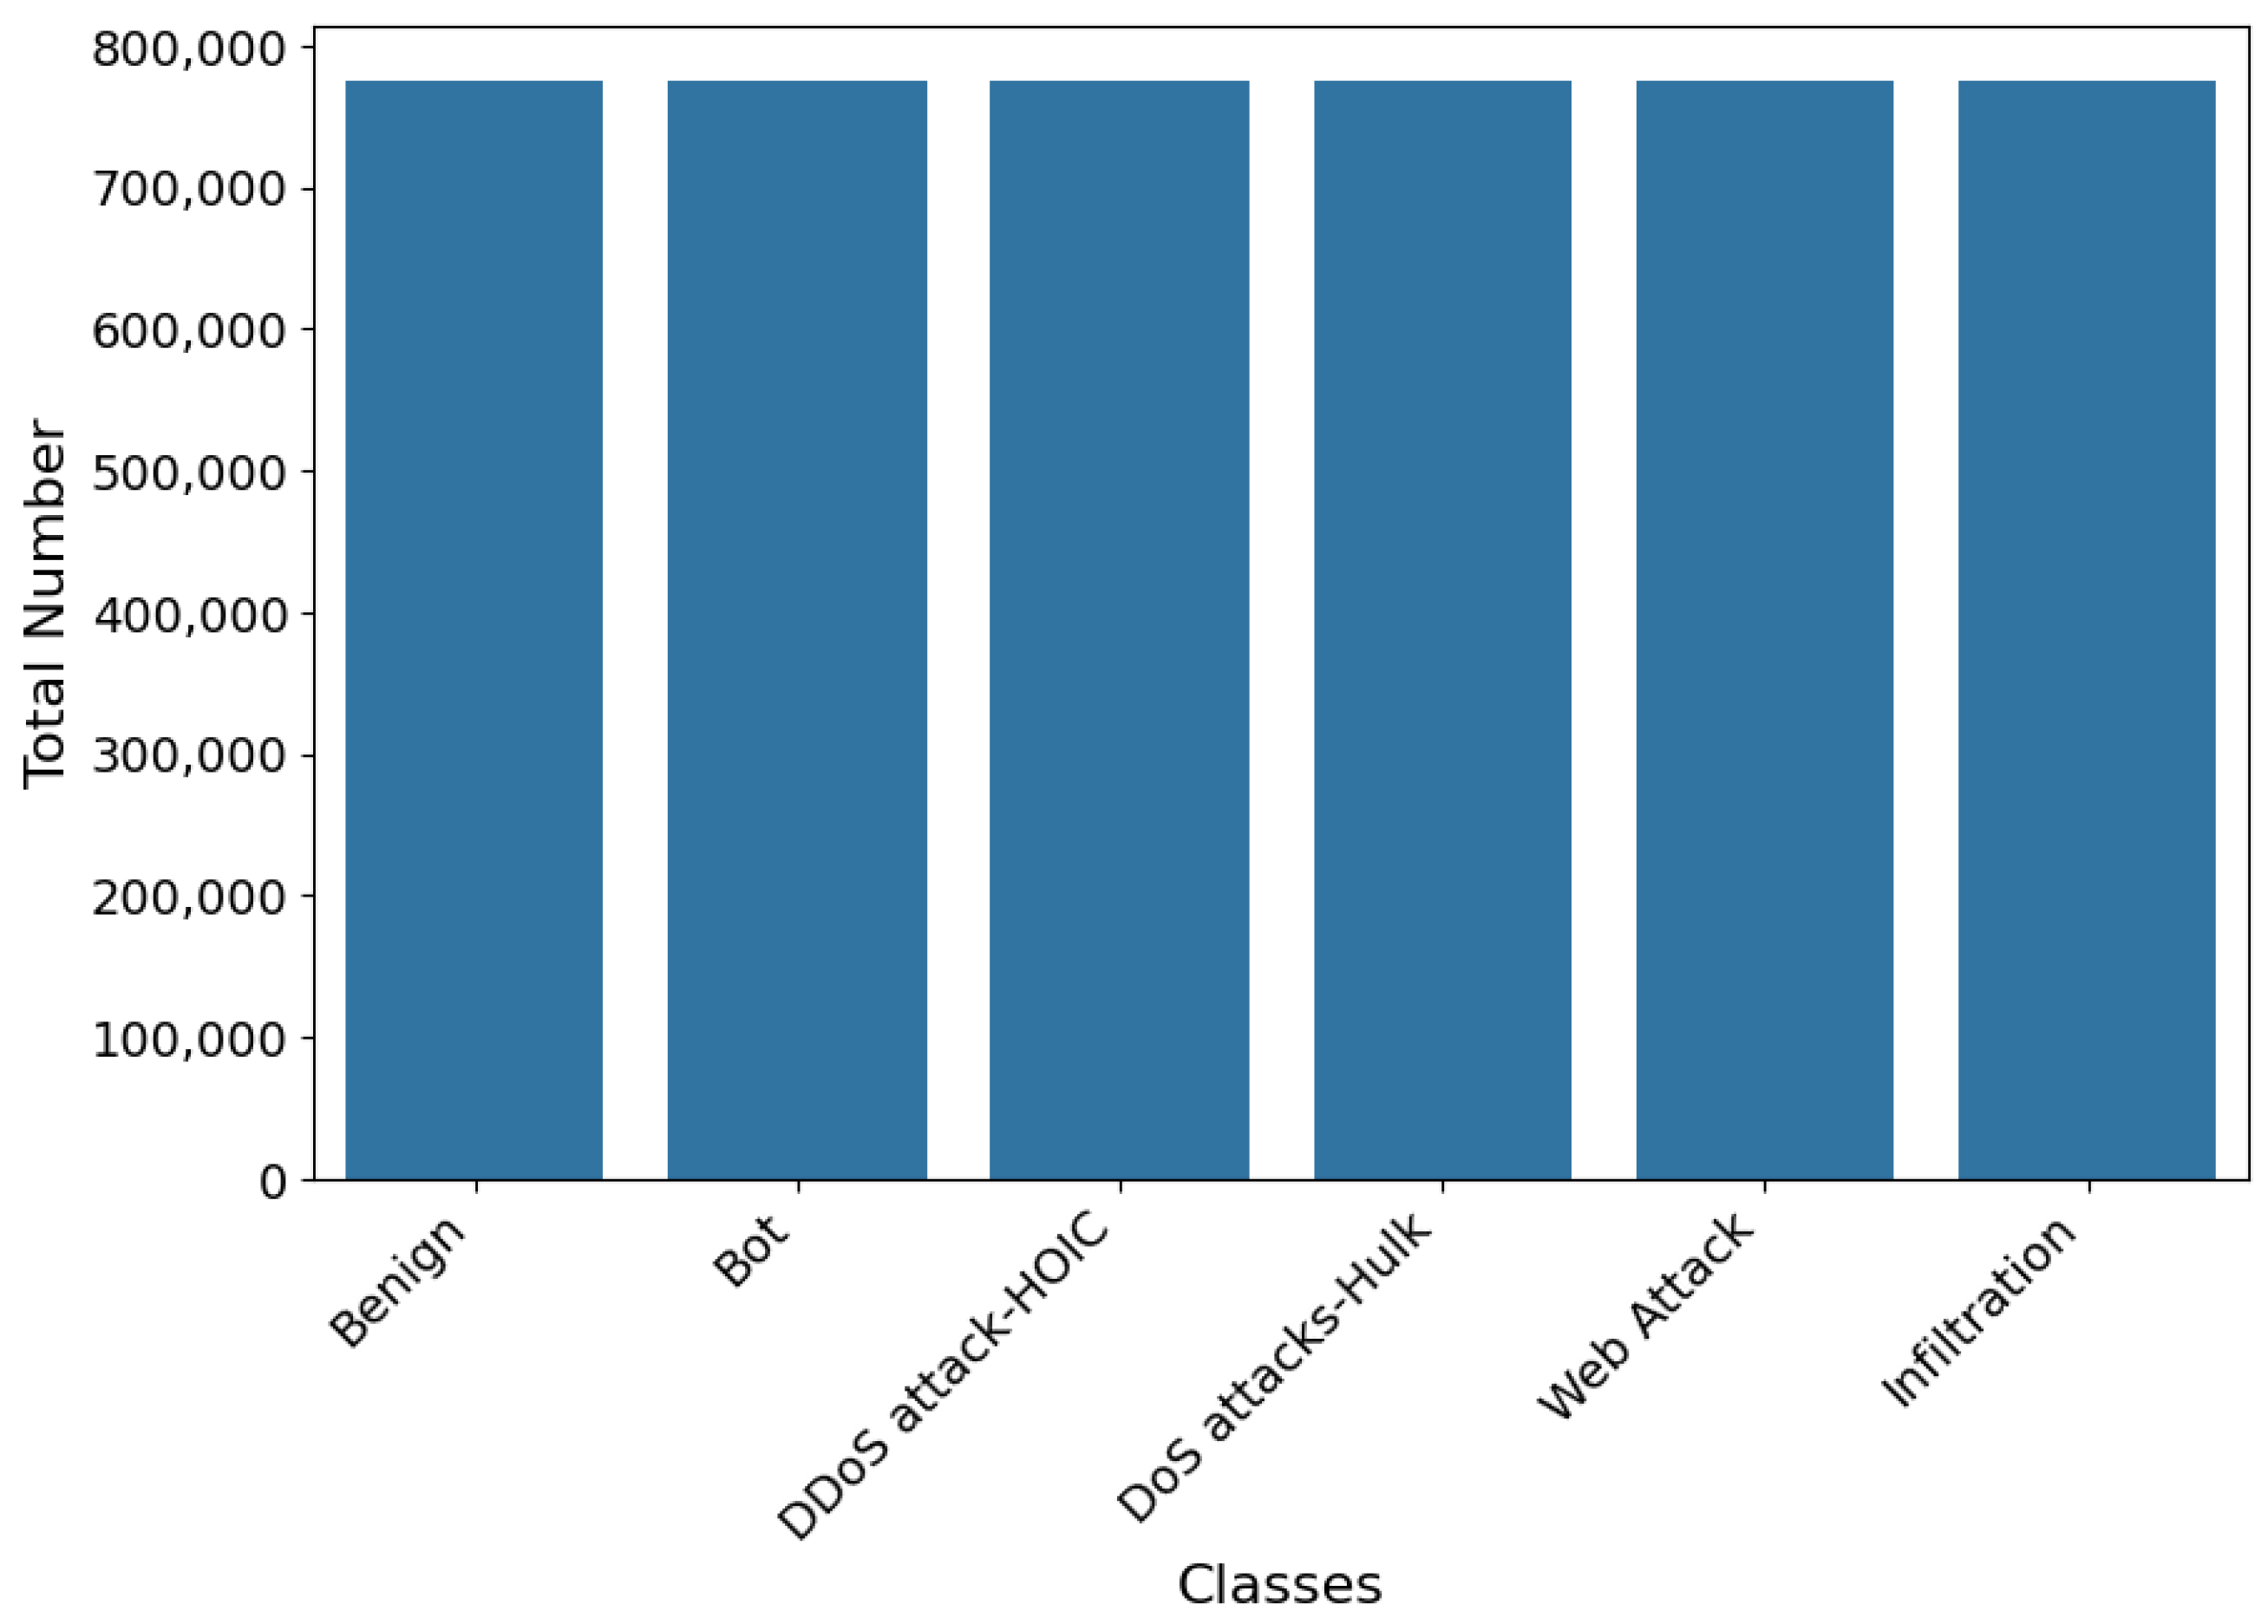
Figure 2 shows the class distributions for Data A. Eleven classes were merged to form a “Web Attack” class for both Data A and Data B, resulting in the number of classes narrowing down to six for both datasets. The datasets contain various attack classes and a benign class, but some classes have limited samples. To ensure equal representation of all classes, data balancing is performed using the synthetic minority oversampling technique (SMOTE) [
41]. SMOTE generates new synthetic samples from the minority class instead of duplicating existing samples. This ensures that the resulting model trained on the balanced data are not biased toward the majority class. The balanced Data A class distribution is shown in
Figure 3.
3.1.1. Outlier Elimination
Outlier elimination is crucial in network security research to ensure data analysis reliability and accuracy. This study, we utilize the interquartile range (IQR) method to identify and remove outliers from the dataset. Outliers are extreme observations deviating significantly from the data distribution, which can distort statistical analyses. The IQR method calculates the range between the first quartile (Q1) and the third quartile (Q3), with data points falling below Q1 − 1.5 × IQR or above Q3 + 1.5 × IQR considered outliers and excluded. By systematically comparing data points against the thresholds, outliers are eliminated iteratively. This results in a refined dataset representing the underlying data distribution, reducing bias and facilitating meaningful pattern extraction. Applying the IQR method improved analysis accuracy and reliability by focusing on the typical data range. Results of the before and after IQR implementation on Data A are shown in
Figure 4a, and
Figure 4b, respectively, revealing the presence of outliers in the initial images and their absence in the filtered images after IQR outlier removal.
Figure 4a shows the dataset with extreme variations in feature values, some reaching
. These high-magnitude outliers indicate severe skewness, which can distort model learning and lead to overfitting. Without filtering, certain features may dominate the training process, reducing the model’s ability to distinguish normal and attack traffic patterns effectively, while
Figure 4b demonstrates the dataset after IQR-based outlier removal, where extreme values have been mitigated. The feature distribution is now more balanced, reducing noise while preserving important patterns. This step prevents outliers from skewing the model, ensuring better generalization and improved classification accuracy when transforming network data into images for CNN-based analysis.
3.1.2. Normalization
Normalization plays a crucial role in our network security research to standardize the data for fair comparisons. We utilize three common normalization methods: min–max, standard scaler, and robust scaler. The standard scaler is mathematically represented as in Equation (
1):
where
is the normalized dataset,
X is the original dataset,
represents the mean, and
is the standard deviation.
The mathematical representation of min–max is presented in Equation (
2):
where
and
represents the minimum and maximum values, respectively.
Lastly, the robust scaler is represented mathematically in Equation (
3):
where median represents the median value.
After applying each method, the mean, std, and IQR of the normalized data for all datasets are recorded. These measures characterized the central tendency, spread, and robustness of the data distribution. To compare the methods’ performance, we calculated percentile ranks for the mean, std, and IQR of each method, providing a relative measure of how each method’s statistics compared within the dataset. The highest-performing method is determined by computing an average percentile rank, obtained by averaging the percentile ranks of the mean, std, and IQR for each method. The method with the highest average percentile rank consistently exhibited desirable statistical characteristics across multiple measures, indicating its superior performance in standardizing the data.
By selecting the highest-performing normalization method, we ensured reliable and standardized inputs for data analysis and subsequent modelling processes. This choice minimized bias and enabled fair comparisons, enhancing the robustness and integrity of the network security research outcomes. The selected method’s ability to consistently demonstrate desirable statistical properties contributed to the reliability and meaningfulness of our research findings, reinforcing the importance of employing appropriate normalization techniques in network security data analysis.
Table 1 and
Table 2 show values obtained by each normalization method used for Data A and B, respectively. In Data A, the highest-performing method is the min–max scaler, while the robust scaler performed better in Data B. Hence, min–max is used in Data A and robust scaler for Data B for normalization.
3.2. Proposed Hybrid Filter-Based Parameter Selection
Feature selection is a crucial step in data analysis for identifying relevant parameters for accurate analysis. However, existing methods often struggle to capture complex relationships among features and optimize parameter selection simultaneously. To address this challenge, we propose a hybrid filter-based feature selection method that leverages correlation analysis and a chi-squared evaluation. This subsection introduces the motivation and objectives of the hybrid method. The main aim is to obtain a list of optimal features from the given dataset which will then be used to train and evaluate the model in the next phase.
The hybrid feature selection method combines correlation analysis and a chi-squared evaluation to identify uncorrelated parameters and select the most discriminative features. It begins by calculating correlation coefficients between features and then determines uncorrelated parameters based on significance level and correlation thresholds using Pearson’s correlation coefficient (PCC) given in Equation (
4).
where
and
are the standard deviations of
X and
Y, respectively, and
is the covariance.
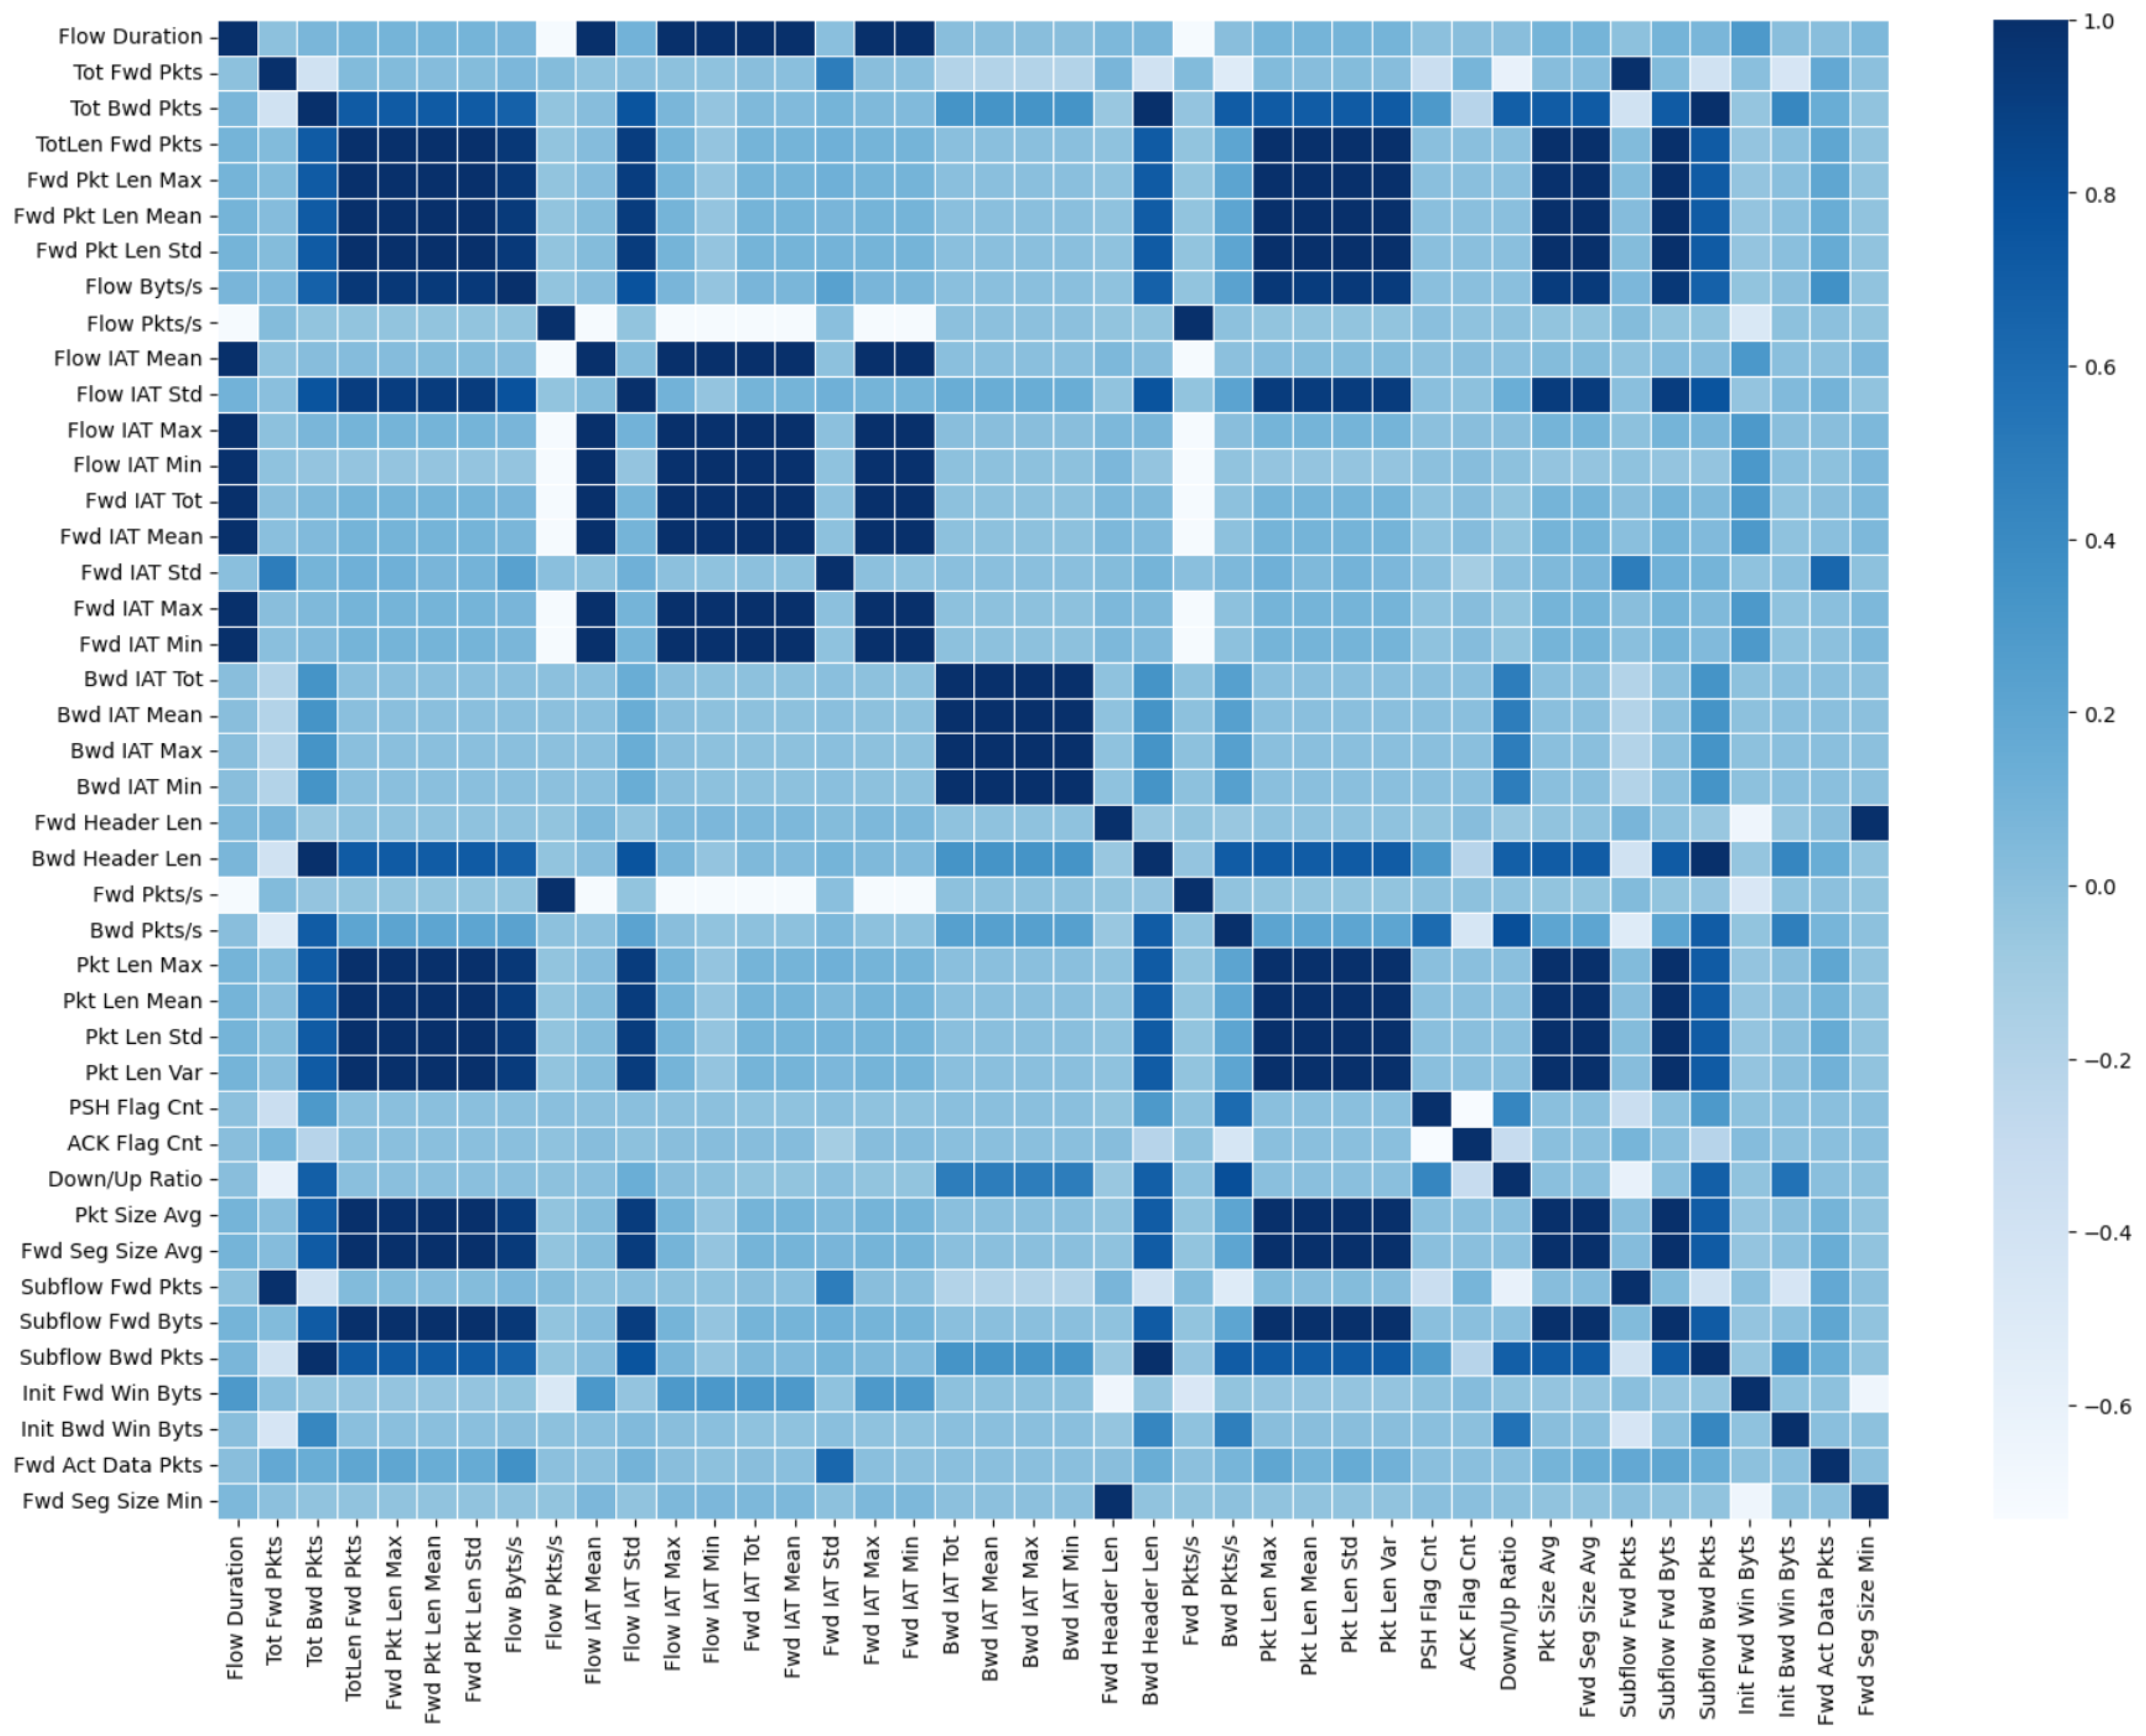
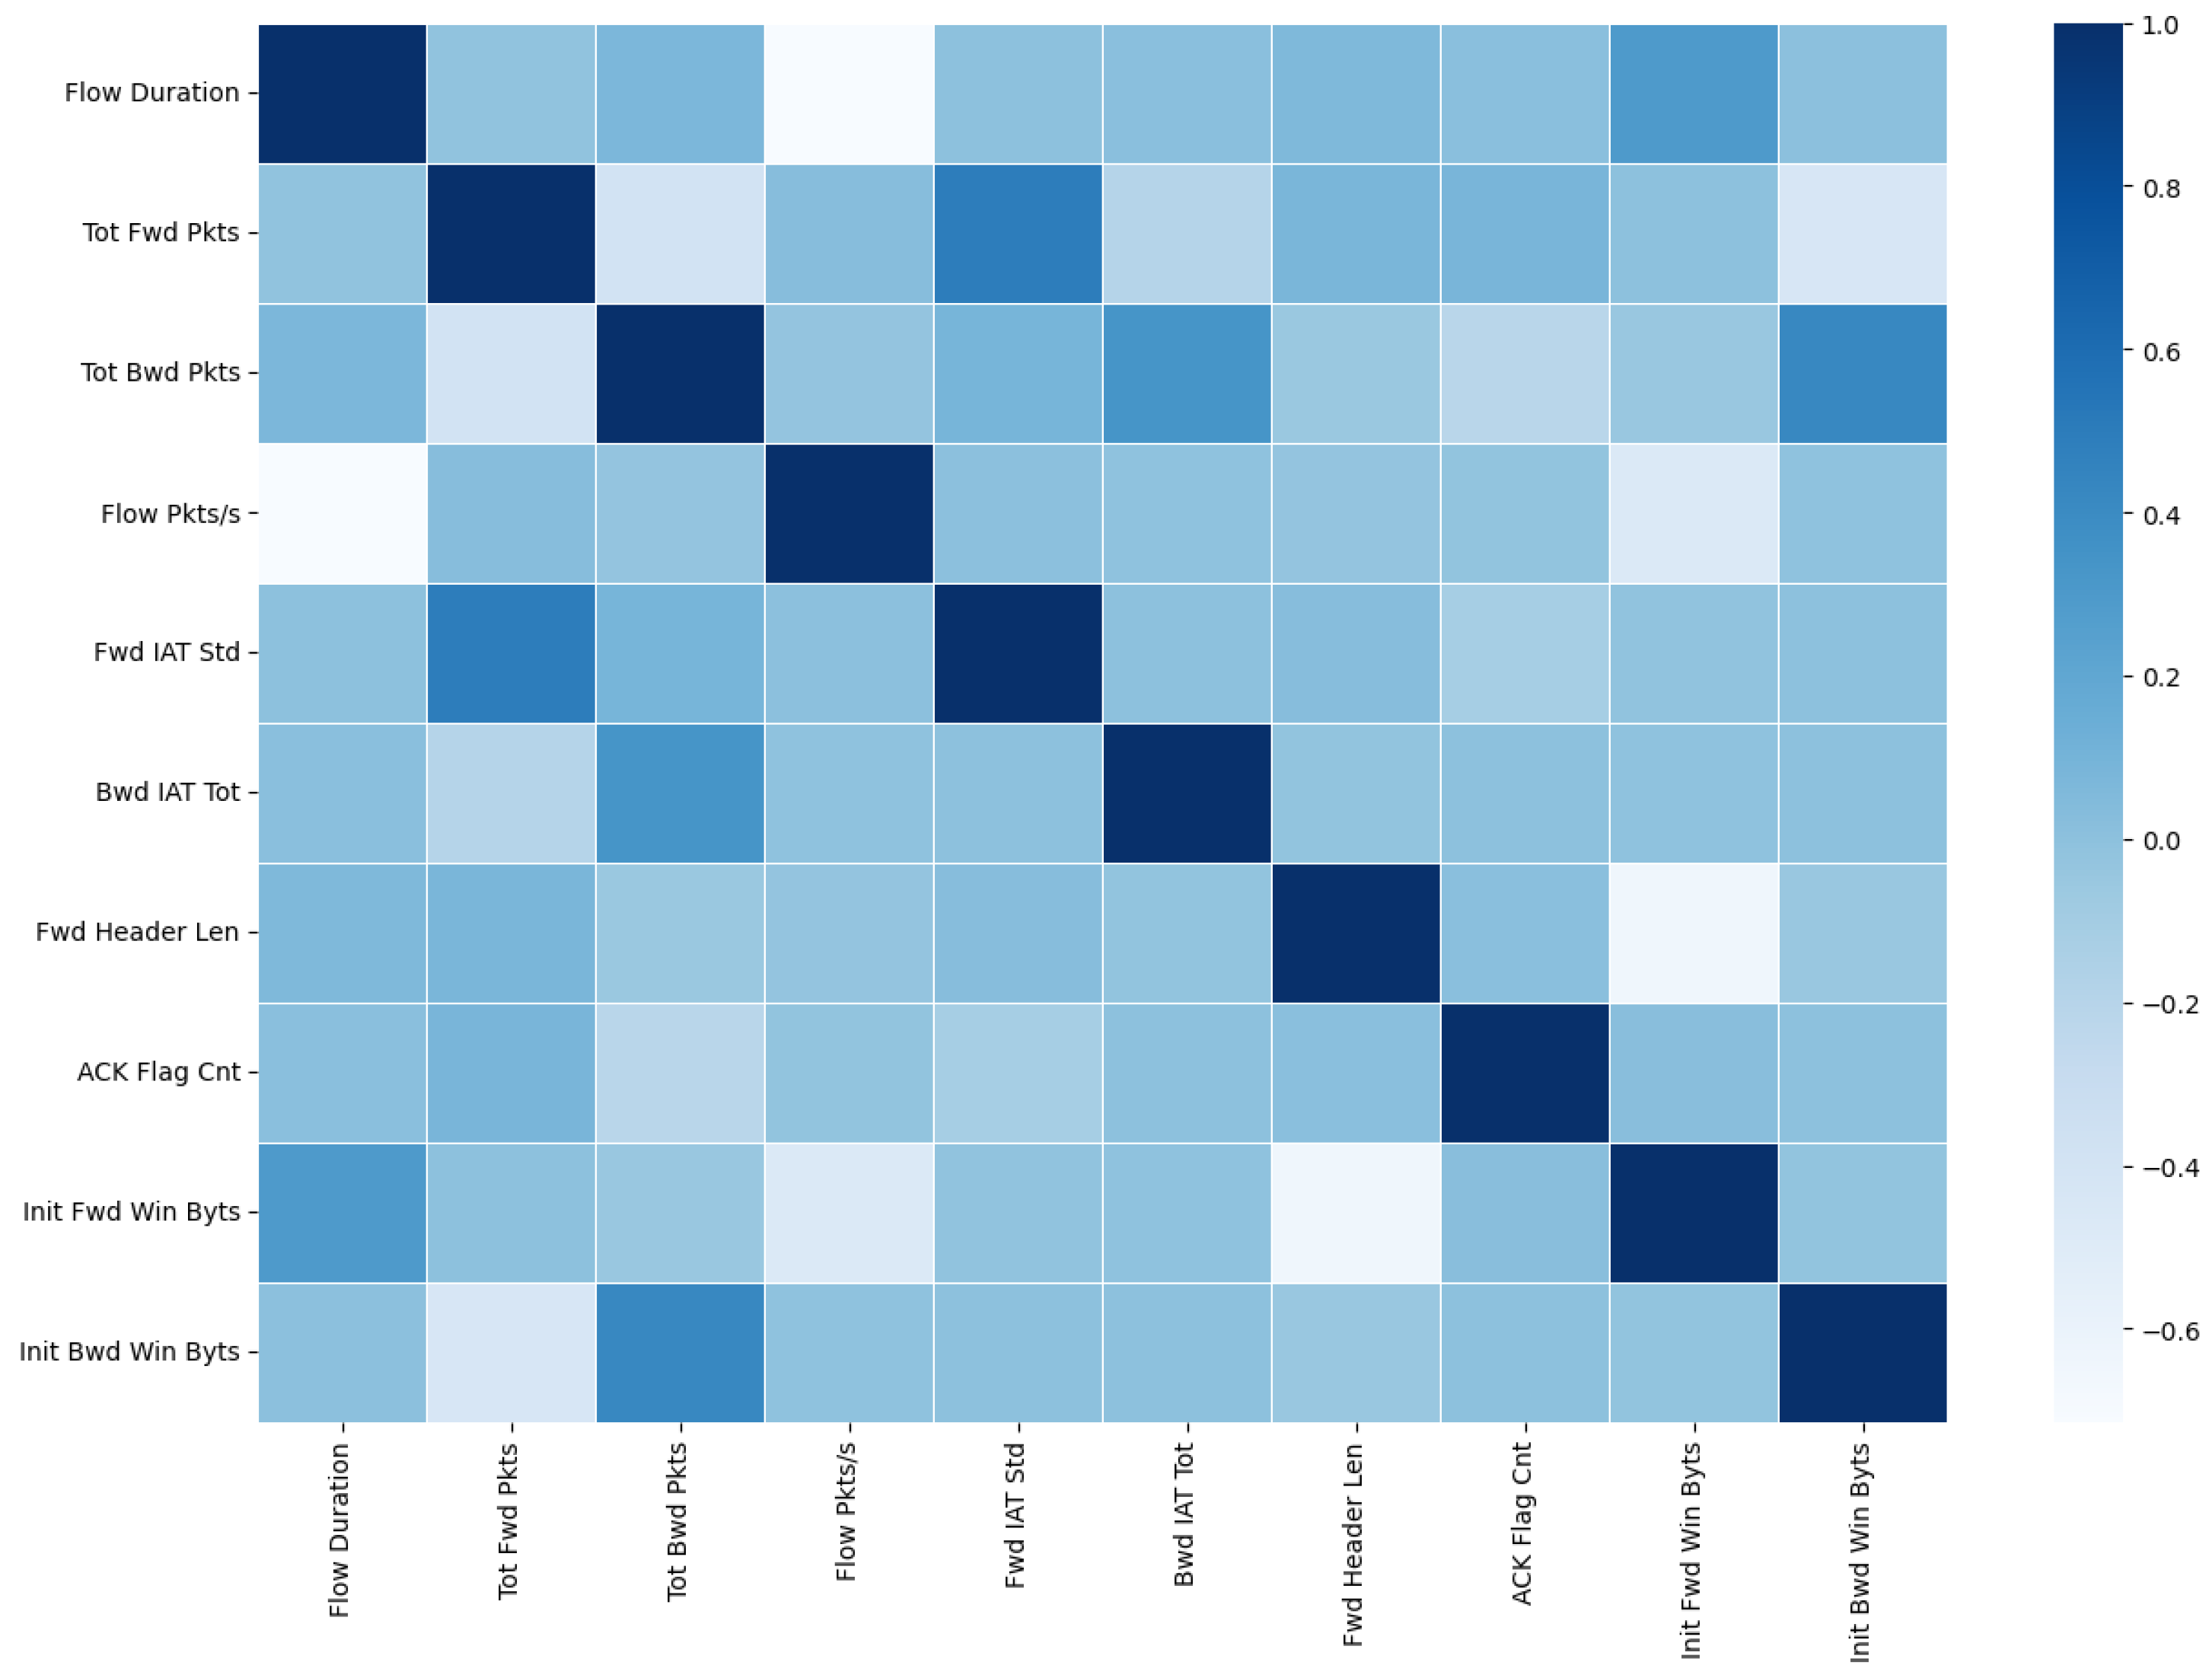
Figure 5 shows the correlation heatmap between features in Data A. The dark boxes represent highly correlated features that should be eliminated, while
Figure 6 shows the same Data A after highly correlated features were eliminated. On their own, correlation tests for parameter/feature selection are limited by instability issues, and their results are unreliable for industrial applications. To mitigate this factor, we employ a chi-squared evaluation to measure the discriminative power of the selected parameters.
Chi-squared is denoted mathematically as
where
c is the degree of freedom,
O is observed values, and
is the expected values. A high chi-squared value indicates that the feature is dependent on the class and is retained, while a lower chi-squared value indicates independence between the parameter and the class. By using chi-square, we aim to detect which features are highly dependent on the classes and which are not. Features that are class-independent contribute little or nothing to the model and are hence not needed for classification. In
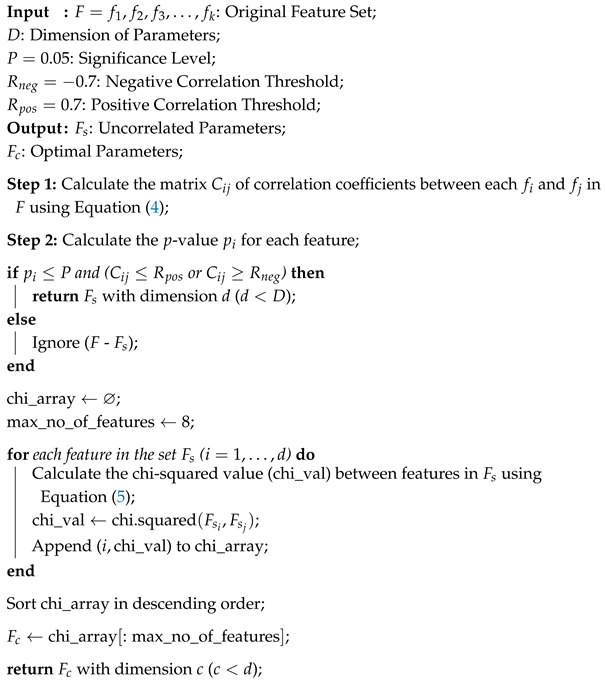
Figure 7, the result of applying this ranked-based parameter selection to Data A is shown. Some features contributed very little, while some have a higher level of contribution. The five highest-ranked features are selected, and these become the optimal features that would be used in training the model. This process is further explained in Algorithm 1.
The algorithm begins by calculating the correlation coefficients between each pair of features in the feature set
F using Equation (
4) and storing them in the correlation matrix
C. Additionally, it calculates the
p-value
for each feature. Next, the algorithm checks if a feature has a
p-value less than or equal to the significance level
P and is either negatively correlated (less than or equal to
) or positively correlated (greater than or equal to
) with another feature. If these conditions are met, the feature is considered uncorrelated and is added to the set of uncorrelated parameters
.
After identifying the uncorrelated parameters, the algorithm selects the most discriminative features from the set
. It calculates the chi-squared value between each pair of features in
using Equation (
5) and stores them in a sorted array called
. The top features with the highest chi-squared values are then selected and added to the set of optimal parameters
. Finally, the algorithm returns the sets
and
as the uncorrelated parameters and optimal parameters, respectively.
| Algorithm 1: Pseudo-code of the proposed hybrid parameter selection method. |
![Electronics 14 00726 i001]() |
3.3. Network Non-Image Data Transformation to Image Data
Converting non-image data to images has gained significant attention in various domains due to its potential benefits and advantages. One compelling reason to consider this conversion is the ability to leverage the power of deep learning and image analysis techniques. Deep learning models, such as CNNs, have shown exceptional capabilities in image recognition and pattern detection. By transforming non-image data into images, researchers and practitioners can tap into the vast array of well-established image processing tools and methodologies, thereby unlocking the potential to extract meaningful patterns and insights from complex datasets [
13]. Another key advantage of converting non-image data to images is enhanced visualization and interpretability. Traditional tabular representations often struggle to convey the intricate relationships and patterns within the data. By mapping the tabular information onto images, the human visual system can exploit its innate ability to perceive and understand visual patterns more effectively [
14]. Images offer a rich visual context that can provide intuitive insights into complex relationships, spatial distributions, and anomalies within the data. This visual representation facilitates a more comprehensive understanding of the underlying data structure, enabling researchers to make informed decisions, identify trends, and communicate findings more effectively.
Moreover, the transformation of network traffic data into images allows for the effective application of advanced image processing algorithms, such as the Gabor filter, which enhances discriminative features by capturing spatial and frequency patterns. This approach enables a more nuanced and robust analysis of attack patterns, addressing the limitations of traditional tabular and numerical data representations.
Phase 3 of the proposed IDS involves the transformation of the datasets into images suitable for a CNN model. To achieve this, DeepInsight [
19] is implemented and applied to both datasets. DeepInsight was built by designing a feature-to-image transformation pipeline that arranges non-image data into a structured 2D space based on feature similarity. It first projects features onto a 2D plane using dimensionality reduction techniques (e.g., t-SNE or PCA) to preserve relationships. Next, it maps feature values to pixel intensities, forming an image representation. Finally, the transformed data are fed into CNNs, leveraging their ability to extract spatial patterns, making DeepInsight effective for non-image data classification.
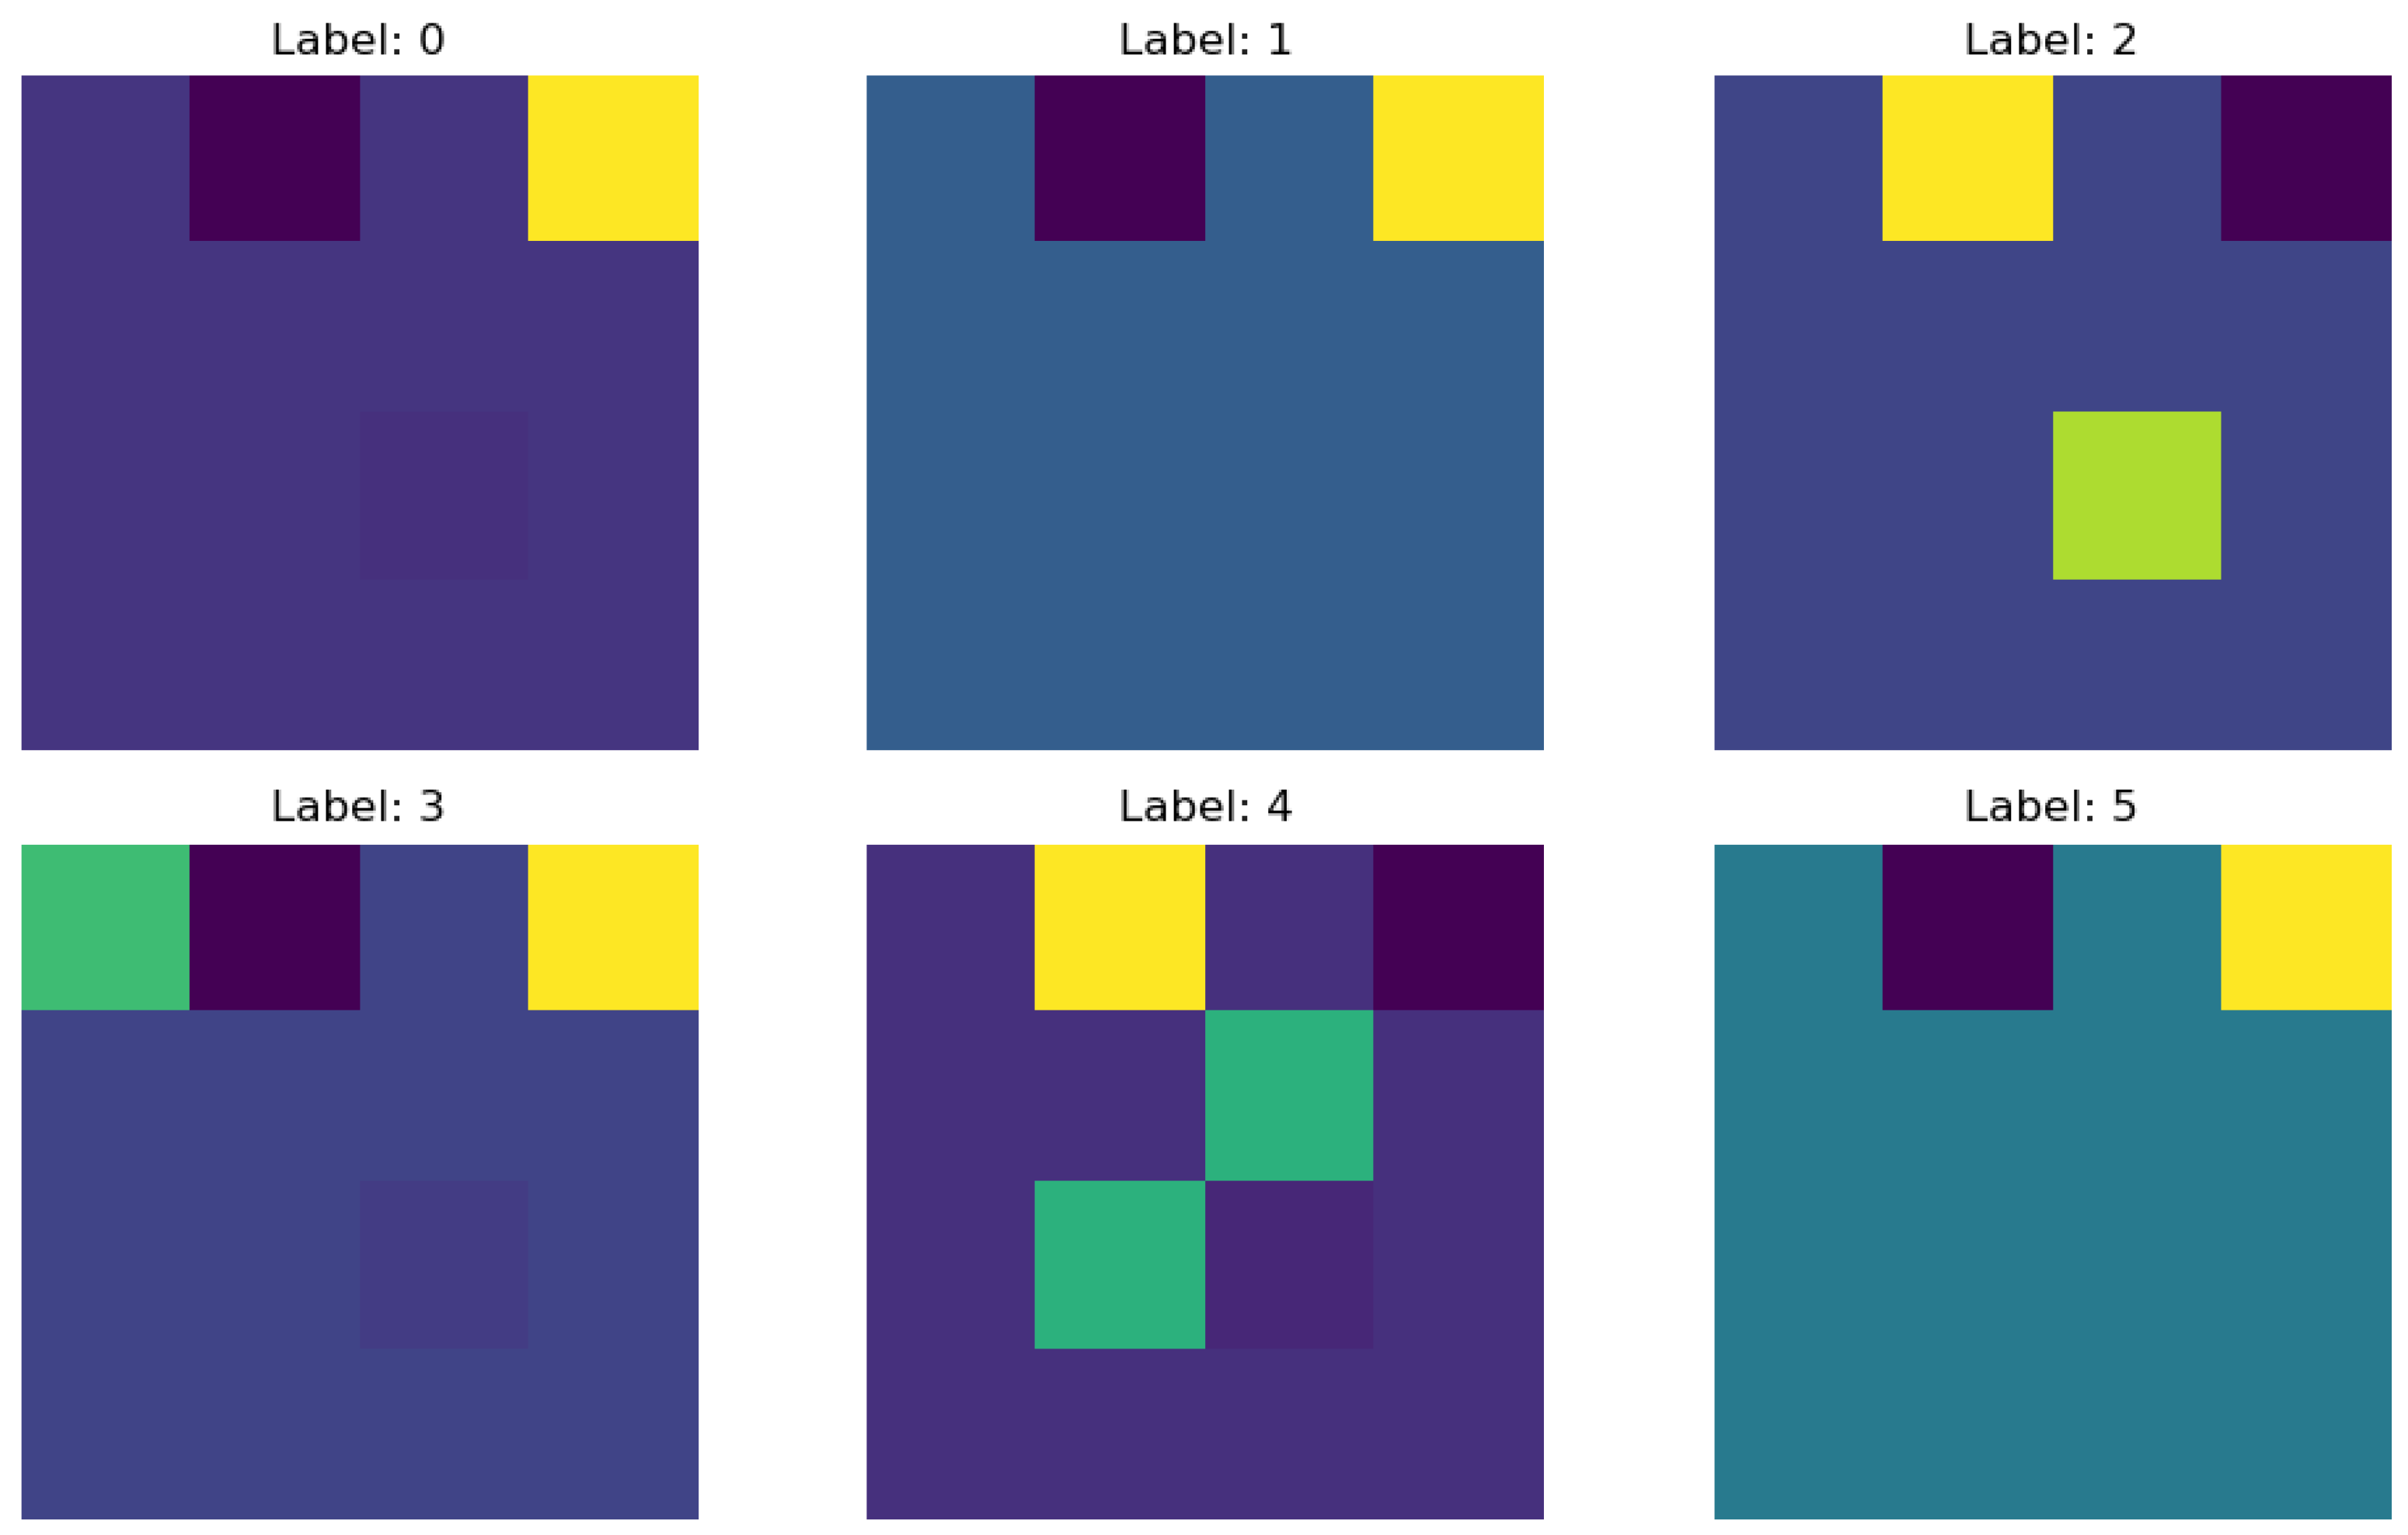
Figure 8 shows six samples (one from each class label) of the transformed Data A.
Gabor Filter
After the data have been transformed into image data from non-image data, the newly generated image data are further transformed using the Gabor filter. A Gabor filter is a linear filter commonly used in image processing tasks. The Gabor filter convolves with an input image to produce a filtered image where a certain frequency and orientation information is enhanced, while other information is suppressed. The parameters for the Gabor filter include frequency, orientation, spatial aspect ratio, and bandwidth. It can be represented mathematically as Equation (
6).
where
is the filter response at position
,
and
are coordinates of
, and
is the standard deviation of the Gaussian envelope, controlling the spatial extent of the filter.
determines the frequency response of the filter.
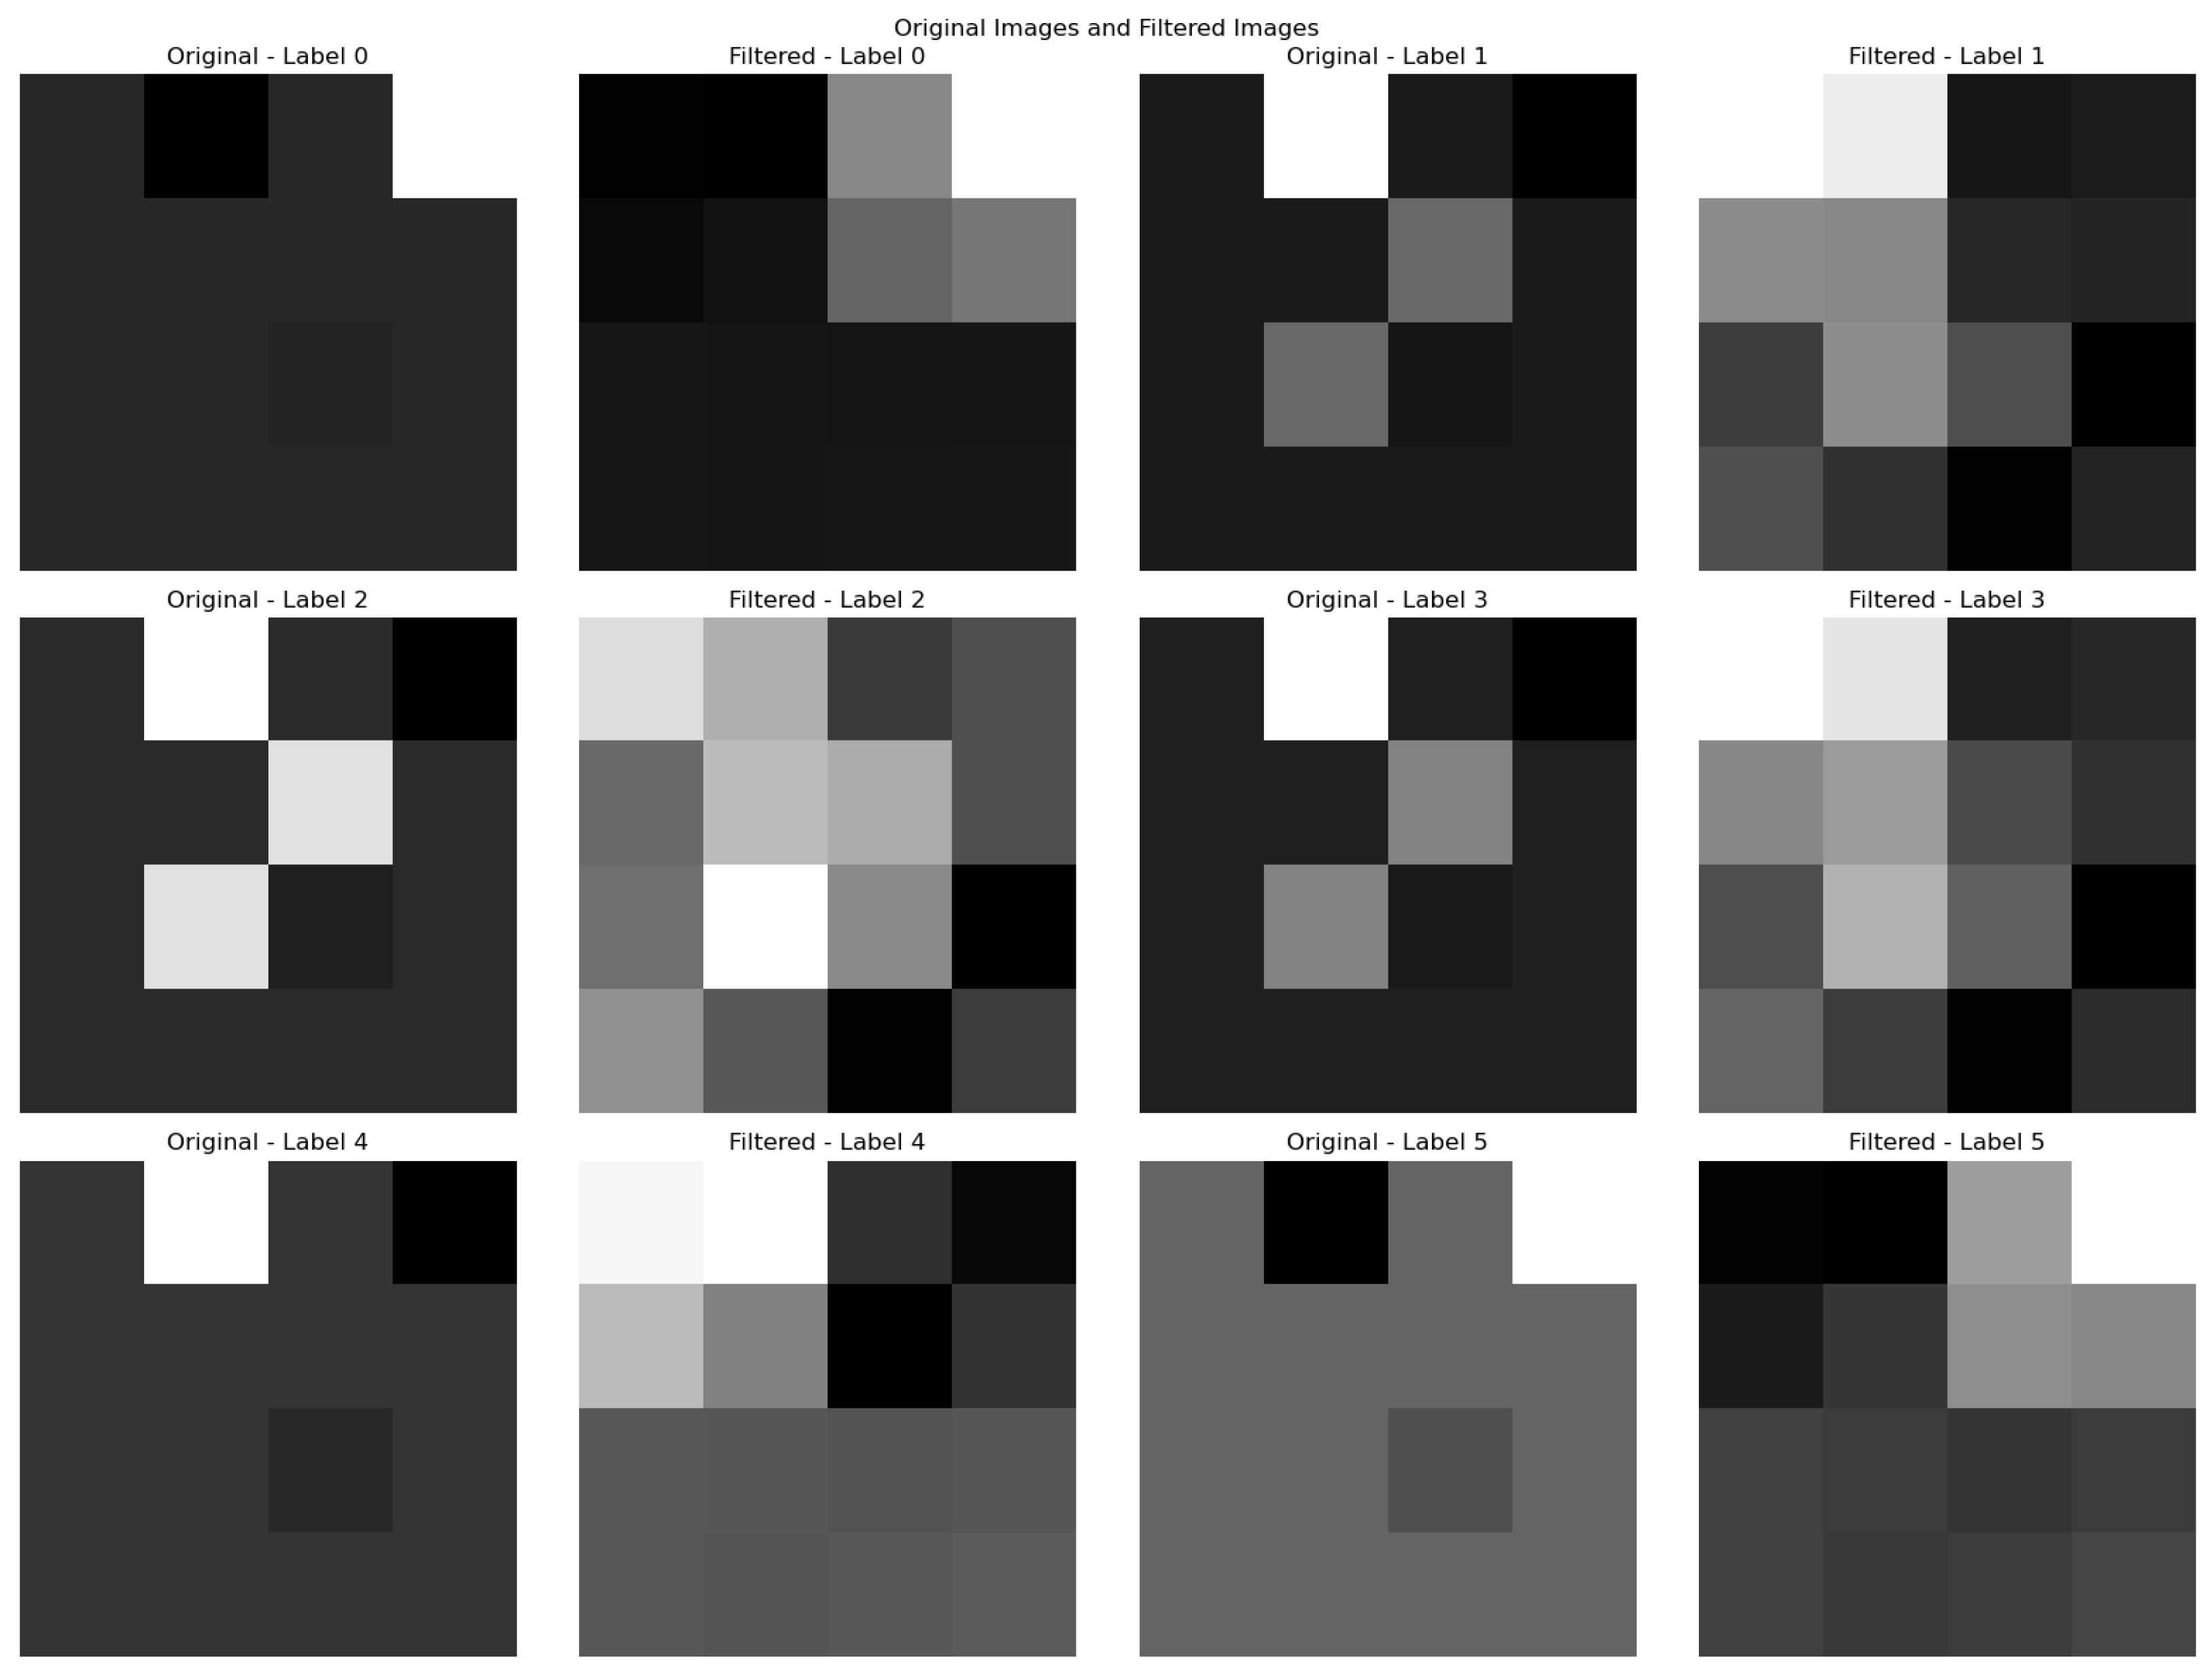
is the phase offset of the filter. In
Table 3, the parameters and their respective values used in this work are shown. The original image for one sample of each class label is displayed next to its filtered version for Data A in
Figure 9.
The Gabor filter enhances the interpretability of image-transformed network data by isolating critical patterns that correspond to intrusion characteristics. This step not only refines the feature set but also significantly reduces noise, ensuring that the CNN model focuses on the most relevant information during the training process.
3.4. Proposed Meta Classifier
The fourth and final phase of the proposed IDS is the classification phase, where a model is trained using the transformed data from phase 3. Ensemble learning is an all-encompassing term used for describing models that combines a number of classifiers or regressors to make a decision. It is the ML or DL way of implementing the wisdom of the crowd. The prevalent reason behind ensemble learning is the need to eliminate errors associated with stand-alone ML and DL models by combining multiple such models which will invariably lead to better prediction performance better than any single model [
42]. Ensemble learning has been shown to have a range of positive impacts on intrusion detection systems. They have improved classification accuracy and are more resilient to noisy data [
43].
This work proposes the use of an ensemble CNN model. The ensemble CNN model combines the predictions of multiple base CNN models to improve overall performance and enhance the accuracy of the IDS. Each base CNN model has its own unique architecture, hyperparameters, and feature representations, contributing to diverse perspectives and capturing different aspects of the data. The model consists of three base models and a meta-classifier. The first base CNN model (Model 1) is constructed with a 2D convolutional layer with 32 filters and a ReLU activation function. It is followed by a 2D max-pooling layer with a pool size of (2, 2) a dropout layer with a rate of 0.25, and an Adam optimizer. The output is then flattened to be compatible with subsequent layers. The second base CNN model (Model 2) has a similar architecture to Model 1 but utilizes a 2D convolutional layer with 64 filters. The third base CNN model (Model 3) employs a 2D convolutional layer with 128 filters and a ReLU activation function. It is followed by a 2D max-pooling layer with a pool size of (3, 3) a dropout layer with a rate of 0.2, and an Adamax optimizer. All models are compiled using the categorical_crossentropy loss function.
Table 4 provides a detailed overview of the parameters used in the models.
To leverage the predictive capabilities of these base models, they are combined using a meta-classifier that incorporates voting to aggregate predictions from individual CNN models. The voting aggregator is configured with the three base models (Model 1, Model 2, and Model 3) as its estimators. By using a hard-voting strategy, the final prediction is determined by the majority vote of the base models. By integrating multiple base CNN models within a meta-classifier, our approach aims to improve classification accuracy and robustness. This ensemble design allows us to leverage the complementary strengths of the individual models, enhancing the overall performance of the classification task.
4. Experimentation and Results Analysis
4.1. Setup
The proposed scheme was implemented on an Ubuntu server equipped with a Jupyter notebook environment. The system configuration included three NVIDIA GeForce RTX 3090 GPUs with CUDA version 12.1. For the transformation of non-image data into image data, DeepInsight [
19] was utilized. The Gabor filter, employed for image transformation, was implemented using the OpenCV cv2 library. To assess the effectiveness of the proposed framework, several evaluation metrics were employed, including accuracy, precision, F1 score, and recall. Additionally, the impact of the Gabor filter on the framework and the testing time was evaluated.
4.2. Dataset
This study utilizes three state-of-the-art datasets: CSE-CIC-IDS2018 [
38] (Data A), ISCX-IDS-2012 [
39] (Data B), and IoT-23 [
40] (Data C). These datasets were collected over multiple days and accurately represent real network traffic. Due to their differences, the processing techniques applied to each dataset vary slightly as detailed in
Section 3.1.
4.3. Baselines
The first base CNN model (Model 1) is constructed with a 2D convolutional layer with 32 filters and a ReLU activation function. It is followed by a 2D max-pooling layer with a pool size of (2, 2) a dropout layer with a rate of 0.25, and an Adam optimizer. The output is then flattened to be compatible with subsequent layers. The second base CNN model (Model 2) has a similar architecture to Model 1 but utilizes a 2D convolutional layer with 64 filters. The third base CNN model (Model 3) employs a 2D convolutional layer with 128 filters and a ReLU activation function. It is followed by a 2D max-pooling layer with a pool size of (3, 3) a dropout layer with a rate of 0.2, and an Adamax optimizer. All models are compiled using the categorical_crossentropy loss function. This paper makes use of KerasTuner to specify different hyperparameters, with the best-performing hyperparameters being retained.
Table 4 provides a detailed overview of the parameters used in the models.
To assess the effectiveness of the proposed hybrid filter-based parameter selection algorithm, we conducted experiments considering three different scenarios. In Scenario 1, the proposed algorithm was utilized for parameter selection. In Scenario 2, parameter selection was performed based solely on PCC without incorporating the chi-squared feature ranking. Lastly, Scenario 3 involved no parameter selection algorithm.
4.4. Evaluation Metrics
To evaluate the effectiveness of the proposed IDS, the following metrics were used:
Accuracy is the fraction of correctly classified traffic (including both normal and malicious) out of all traffic.
Recall measures the proportion of actual intrusions that the IDS successfully detects.
Precision measures the proportion of correctly identified intrusions out of all instances classified as intrusions.
F1 score is the harmonic mean of precision and recall, providing a single metric to balance between the two.
To evaluate the computational efficiency of the proposed IDS, the following metrics were used:
4.5. Results
The performance metrics of the base models and the proposed ensemble CNN are summarized in
Table 5,
Table 6 and
Table 7 for Data A, B, and C, respectively.
Table 5 shows the accuracy, F1 score, recall, and precision of the three base models (Base Model 1, Base Model 2, and Base Model 3) and the proposed scheme, while
Table 6 presents the corresponding metrics all models on Data A.
Among the base models, Base Model 3 achieved the highest accuracy of 94.81%, with an F1 score of 93.74%, recall of 95.29%, and precision of 92.93%. Base Model 2 and Base Model 1 also exhibited strong performance, with accuracies of 93.27% and 92.34%, respectively. The proposed ensemble CNN outperformed all base models, achieving an impressive accuracy of 98.12%, an F1 score of 98.05%, a recall of 98.19%, and a precision of 98.11% on Data A. These results demonstrate the effectiveness of the proposed classifier in improving classification performance compared to individual base models. The higher accuracy and balanced F1 score, recall, and precision of the meta-classifier validate its suitability for the task at hand.
The test times (TT) for different scenarios of Data A and B are provided in
Table 8. The test time is reported in seconds and represents the time taken by the models for testing. For Data A, the test time for Scenario 1 was 1.9 s, 4.2 s for Scenario, and 12 s for Scenario 3. On the other hand, for Data B, the test time for Scenario 1 was 2 s, 5 s for Scenario 2, and 10.1 s for Scenario 3. These results indicate that the test time varied across different scenarios. The longer test times observed in both Scenario 2 and 3 for both datasets can be attributed to the increased complexity and occurrence of redundant and highly correlated features of the data, resulting in more computation and processing time. It is important to consider these test times in practical applications where real-time or time-sensitive processing is required as is the case of IDSs. These insights into the test times provide valuable information for system design and optimization in terms of computational resources and efficiency.
The impact of the Gabor filter on the framework is studied and results are recorded in
Table 9. For Data A, the accuracy with the Gabor filter was 98.12%. Without the filter, it achieved an accuracy of 95.86%. Similarly, for Data B, the accuracy with the Gabor filter was 96.45%. Without the filter, it achieved an accuracy of 96.02%. These results demonstrate the impact of the Gabor filter on the classification performance of the model. The higher accuracy observed with the Gabor filter indicates its effectiveness in enhancing the discriminative features and improving the classification accuracy. The improvement in accuracy can be attributed to the filter’s ability to extract relevant spatial frequency information from the input data, which aids in better representation and discrimination of the classes. Although it is important to note that the use of the Gabor filter may introduce additional computational complexity due to the additional processing steps involved. However, the significant improvement in accuracy justifies its inclusion in the classification pipeline, particularly in scenarios where achieving higher accuracy is a priority. Moreover, this potential additional computational complexity is mitigated by the proposed parameter selection algorithm. The inclusion of image processing techniques, particularly the Gabor filter, significantly improves the IDS’s classification performance by enhancing feature representation, as evidenced by the accuracy improvements in
Table 9.
Finally, in
Table 10, the performance of our proposed scheme was compared to models from the literature [
28,
30,
32,
34]. Although [
28] slightly outperforms our model in all metrics, it comes at a significantly higher computational complexity, as reflected in the loner testing time of 7.1 s. In contrast, our proposed model achieves a strong balance between accuracy (98.12%) and computational efficiency (1.9 s testing time), demonstrating its practicality for real-time intrusion detection.
Despite employing image transformation techniques, which often introduce computational overhead, our approach successfully maintains a high detection performance while significantly reducing testing times compared to traditional deep learning-based IDS models. This result validates the efficiency of our proposed scheme, ensuring that IDSs remain both effective and scalable for IoT.
4.6. Limitations and Future Works
While the proposed IDS framework demonstrates significant improvements in intrusion detection for IoT environments, several limitations remain that warrant further investigation.
A key limitation of this study is the reliance on public datasets rather than real-world IoT network validations. Although benchmark datasets offer consistency, they may not fully represent the complexity and evolving threats in real IoT environments. Real-world testing is needed to evaluate adaptability and performance under dynamic conditions.
Additionally, this study evaluates computational efficiency using inference time. Metrics such as energy consumption, memory footprint, and latency are crucial for assessing feasibility in resource-constrained IoT devices. These metrics can be measured when deployed in an IoT environment, as mentioned above. Future work will incorporate these aspects to better understand deployment trade-offs and scalability.
5. Conclusions
This work presents a comprehensive four-phase architecture for detecting and classifying cyberattacks in IoTs. The four phases are data preprocessing, feature selection, image transformation, and ensemble classification. In the first phase, effective data preprocessing techniques are employed, including outlier removal and data normalization using the best-performing algorithm. This ensures that the data are prepared appropriately for subsequent analysis. The second phase focuses on mitigating the curse of dimensionality through a hybrid filter-based parameter selection approach. Redundant and highly correlated features were eliminated, and the remaining features were ranked based on their importance to the classifier. This resulted in improved detection performance with a reduced computational cost. In the third phase, the data were transformed into image representations, and the Gabor filter was applied to capture relevant shape information. This enabled the utilization of image processing techniques and enhanced the accuracy of the detection system. The final phase involved the implementation of an ensemble CNN model, comprising three distinct base models and a meta-classifier. The ensemble model combines the predictive powers of the base models, resulting in improved accuracy and robustness in attack detection and classification. Experimental results demonstrate the effectiveness of the proposed framework. The filter-based parameter selection approach significantly reduces computational costs while maintaining high accuracy. The meta-classifier outperforms the individual base models, highlighting the benefits of combining diverse perspectives in model training. Additionally, the application of the Gabor filter further improves the accuracy of the system. By leveraging salient data, incorporating a meta-classifier, and utilizing the Gabor filter, the proposed framework achieves a balance between computational efficiency and accurate attack detection. It provides a robust solution for intrusion detection in IoT environments, with potential applications in enhancing network security and protecting IoT devices from cyber threats.


 ,
, 


