Abstract
Emotion recognition, which includes stress analysis, is a critical research topic. In particular, emotion recognition using wearable applications that offer rapid feedback can significantly assist in emotion regulation. A key dataset for this purpose is the wearable stress and affect detection (WESAD) dataset, which is well-suited for wearable environments. This study aims to evaluate the accuracy and processing time of the proposed neural network using the WESAD dataset. However, data collected in wearable environments often have limitations in terms of their accuracy and channel count, making classification challenging. To address this issue, this study utilizes only wrist-measured blood volume pulse (BVP) data measured by photo-plethysmography (PPG) and electro-dermal activity (EDA) data, classifying them through a late fusion-based multimodal method. For accurate classification, the BVP data are preprocessed using the empirical mode decomposition (EMD) method, and a Siamese model is employed for learning on small datasets, with an additional structure of dense layers for detailed classification. The Siamese network generates a similarity score, which is then fed into a dense layer to classify multiple classes. Meta-classes are used to compute pairwise similarities, ultimately classifying the data into one of four emotional states: neutral, stress, amusement, and meditation. The proposed multitasking model simultaneously trains the Siamese network and multi-classifier, achieving an accuracy of 99.8% in classifying four emotion states in the WESAD dataset. Moreover, the model is designed to operate with minimal hardware resources, making it easy to implement using hardware accelerators. This study demonstrates the applicability of neural network-based wearable systems in the field of emotion recognition.
1. Introduction
Emotion recognition is a critical technology for understanding human emotional states and has significant applications in various fields, such as human–computer interaction (HCI), health monitoring, mental health management, and stress detection [1,2,3,4,5]. In particular, stress detection systems play an essential role in implementing adaptive systems that analyze the emotional states of users in real time and provide personalized services based on this analysis [6]. Emotion recognition involves understanding the internal state of a person through external signals, such as facial expressions, voice, and physiological signals [7,8,9]. Facial expressions are a key method of emotional expression, revealing feelings such as happiness, sadness, or anger through muscle movements. In addition, voice signals play a crucial role in conveying emotions, with changes in tone, speed, and intensity reflecting the emotional state of a person. Physiological signals illustrate the impact of emotions on the body, including variations in the heart rate, galvanic skin response (GSR), breathing patterns, and brainwave activity (EEG) [10,11,12,13]. For example, stress or anxiety can cause increased heart rate and heightened skin conductivity. By analyzing these physiological signals, emotion recognition systems can provide more precise analysis and prediction of the emotional state of a user.
Recently, research on emotion recognition based on physiological signals has gained significant attention owing to its non-invasive nature and ability to collect natural, real-time data from users [14]. Unlike methods that rely solely on facial expressions or voice, physiological signal-based approaches can capture subtle emotional changes, such as stress or anxiety, which may not be outwardly visible. These systems monitor the emotional states of users in real time, making them highly valuable in various fields, including stress management, mental health monitoring, and personalized emotional feedback.
The integration of emotion recognition technology with wearable devices further enhances their capabilities [15,16,17]. Wearable devices, such as smartwatches and fitness bands, can continuously collect a range of physiological signals, such as heart rate, electro-dermal activity (EDA), body temperature, and accelerometer data. This allows the continuous assessment of the emotional state of a user without disrupting daily activities. By combining different types of signals, wearable systems can provide more precise emotional analyses, enabling the detection of even minor mood changes and offering real-time, tailored feedback to users. For example, these devices can suggest relaxation techniques or adjust user settings based on detected stress levels, offering a more personalized user experience.
However, several challenges remain in emotion recognition. Emotional expression varies significantly among individuals, indicating that identical physiological signals can represent different emotions in different people [18,19]. Furthermore, when multiple physiological signals interact to convey an emotional state, relying on a single signal may be insufficient for an accurate emotion prediction [20]. This has led to a growing interest in using multimodal data that combine several types of signals to improve accuracy. Developing algorithms that effectively integrate the unique characteristics of each signal is crucial for achieving a better predictive performance in emotion recognition systems.
The wearable stress and affect detection (WESAD) dataset has emerged as a key resource for research in this field, providing comprehensive data for wearable-based emotion recognition [21]. The WESAD dataset includes a wide range of biometric signals collected during various emotional states, such as neutral, stress, amusement, and meditation. This serves as an experimental foundation for classifying emotional states using wearable technologies. By leveraging this dataset, researchers can develop models that can better classify and understand emotional states, contributing to advancements in adaptive and responsive emotion recognition systems.
Ultimately, these advancements suggest that emotion recognition technology has a significant potential to improve quality of life. By offering insights into the emotional well-being of users and providing timely and personalized support, these systems can help individuals manage their emotions more effectively and improve their overall mental health [22].
This study proposes a novel approach that combines a Siamese network with a late fusion-based multimodal method to enhance emotion recognition performance. The Siamese model is effective for feature extraction by learning the similarity between two inputs, which is crucial when combining multiple modalities, such as the physiological signals in the WESAD dataset [23,24]. The late fusion method combines the features independently extracted from each modality (signal type) to perform the final classification [25]. This approach is particularly beneficial when physiological signals interact to represent complex emotional states. By integrating Siamese networks with late fusion, this method enhances similarity learning across modalities, offering a significant advancement over traditional multimodal techniques that typically combine features at an earlier stage.
Furthermore, this study optimizes real-time processing by incorporating hardware accelerators (e.g., digital logic and field-programmable gate arrays (FPGAs)) with the proposed model. By utilizing the parallel processing power of hardware accelerators, the model inference time is significantly reduced, enabling real-time emotion recognition [26]. A key challenge in this optimization is balancing computational efficiency with hardware resource limitations, necessitating the use of lightweight neural networks.
In summary, this study aims to evaluate the extent to which the proposed model can improve emotion recognition performance based on the WESAD dataset and implement a real-time emotion recognition system through model inference using hardware accelerators. Section 2 presents the physiological signals of the WESAD dataset used for the implementation of the real-time emotion recognition system and the preprocessing methods; Section 3 describes the proposed neural network; Section 4 discusses the performance of the hardware accelerator using the proposed network; and Section 5 discusses the additional requirements for achieving real-time emotion recognition and provides the conclusions.
2. Signal Acquisition
2.1. WESAD Dataset
The WESAD dataset is a prominent public dataset designed to detect stress and emotional states, and encompasses various physiological signal data collected using wearable devices. This dataset is widely utilized in research focused on emotion recognition and stress detection, and provides valuable resources for analyzing human stress and emotional states through experimental data based on wearable devices. The WESAD dataset was published in 2018 and includes multimodal physiological signal data collected from 15 healthy participants [21]. The experiments were conducted over a single day, during which each participant recorded diverse physiological data across four emotional states: neutral, stress, amusement, and meditation. These emotional states were labeled as follows: 1 indicates a neutral state with no significant emotional changes, 2 represents a stress state caused by stressors, 3 denotes amusement triggered by enjoyable stimuli, and 4 signifies a calm and focused meditation state, often associated with relaxation. Although the WESAD dataset is an important resource for emotion recognition in wearable environments, its small sample size and data collection on a single day make it difficult to reflect environmental variables from real-world scenarios. Future research on additional datasets is needed to ensure robustness. Data were collected using various wearable devices, and serve as an essential foundational resource for research on stress recognition and emotional state classification.
The WESAD dataset utilized two wearable devices to record physiological signals. RespiBAN, from PLUX Biosignals, Lisbon, Portugal, is a wearable device worn on the chest that measures various physiological signals, including heart rate, skin temperature, electrocardiogram (ECG), EDA, electromyography (EMG), three-channel accelerometer, and respiration. Empatica E4, from Empatica Inc., Boston, MA, USA, is worn on the wrist and measures skin temperature, EDA, wrist-measured blood volume pulse (BVP) measured by a photo-plethysmography (PPG) sensor and a three-channel accelerometer. In this study, for user convenience, the signal measurements were based solely on the wrist. Only the results from the Empatica E4 were used, focusing on BVP and EDA among the measured signals for emotion recognition. Based on this, a late-fusion-based multimodal method was applied because these two signals are obtained from hardware with a simple structure and are commonly used physiological signals.
In this case, the labels were sampled at 700 Hz, BVP at 64 Hz, and EDA at 4 Hz. Therefore, it was necessary to synchronize the data acquisition times for these signals. A sliding window of 30 s was used as the reference, resulting in 1920 data points for the BVP and 120 data points for the EDA. BVP is measured from PPG data, while EDA is measured in micro-Siemens (µS). Within this range, the most frequent label in the window was assigned as the representative label. Labels 0, 5, 6, and 7 were excluded from the analysis as they were not used. The sliding window was applied with a step size of 15 s, allowing for partial overlap between windows, and through this process, a total of 3000 smaller datasets were reconstructed from the data of 15 participants.
2.2. Signal Preprocessing
The BVP and EDA signals obtained through the aforementioned process were subjected to normalization because the magnitude of variability was critical for the analysis. This normalization process involved adjusting the mean of the input features to zero with a standard deviation of one. By achieving a more uniform data distribution, this procedure mitigated the risk of certain features disproportionately influencing weight updates during model training. Figure 1 shows the representative signals for BVP and EDA after normalization. In this case, the label was 1, which indicates a neutral state.
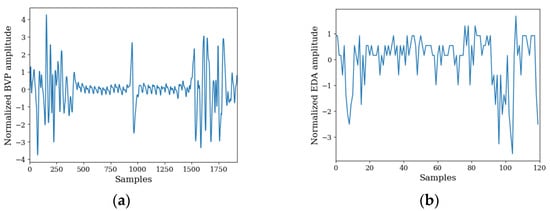
Figure 1.
Normalized signals of (a) BVP and (b) EDA.
Subsequently, given that BVP is characterized by high variability in its time series data, additional preprocessing steps were implemented to improve the accuracy of the learning process. For signals exhibiting significant fluctuations, such as BVP, time-frequency domain analysis is frequently utilized in neural network applications, as it serves as an effective approach for feature vector extraction. Notably, two prominent techniques in this context are the discrete wavelet transform (DWT) and the empirical mode decomposition (EMD) [27]. Various validation studies have suggested that the EMD method exhibits a slightly greater efficiency than the DWT, particularly for signals characterized by significant fluctuations. In this study, the DWT method showed an accuracy approximately 1% lower than the EMD method.
EMD decomposes signals into various frequency components, making it suitable for the analysis of nonlinear and nonstationary signals. A key feature of this method is its ability to separate complex signals into several intrinsic mode functions (IMFs) while preserving the unique characteristics of the data. The advantages of EMD include its effectiveness in analyzing signal characteristics across a range of frequencies, robustness against noise, and suitability for real-time processing. The procedure generally involves the following steps: First, the local maxima and minima of the signal are identified, from which high-frequency IMFs are extracted. Subsequently, these IMFs are subtracted from the original signal, and the remaining signal is defined as the residual. This process is then repeated on the residual, ultimately leading to the decomposition of the original signal into various IMFs.
Utilizing this approach, the EMD method was applied to the BVP signal, resulting in its decomposition of the BVP signal into two IMFs, along with the extraction of a residual signal. Figure 2 illustrates the results of applying the EMD method to the BVP signal with the signal sourced from Figure 1a.
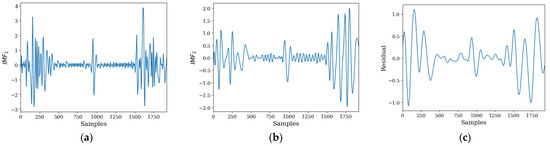
Figure 2.
BVP signal analysis. (a) IMF1, (b) IMF2, and (c) residual signal.
The BVP signal was transformed into three channels through EMD, whereas the EDA signal was provided as a single-channel input to the neural network. The proposed neural network is based on a Siamese model that performs computations on the input using the same network, thereby enabling the calculation of the Euclidean distance between feature vectors. The Siamese model is advantageous in maintaining accuracy even with limited training data and in effectively distinguishing between feature vectors.
A key feature of this study is the use of a Siamese model to determine the similarity across four emotion recognition states, with the aim of training the Siamese network to maximize the Euclidean distances between the four emotional states. Through this process, the proposed model was extended to the classification of the final four emotion recognition classes. This was achieved through multi-task learning, necessitating additional processing of the dataset [28]. Specifically, for the BVP and EDA datasets processed simultaneously, labels corresponding to the four classes were compared; if they were identical, the Siamese model assigned class 1, and in other cases, class 0. In this manner, each unique class information was retained, while the newly assigned class was labeled as “Siamese_labels”.
For the proposed neural network, the inputs for the Siamese model were always provided in pairs. This setup allowed the calculation of distances that vary according to emotional states, which were then mapped to the final emotion recognition classes. Additionally, all labels were transformed using one-hot encoding for use as either the four emotion state class labels or the two “Siamese_labels” (with different cases represented as [0,1] and identical cases as [0,1]). Notably, the distribution of the “Siamese_labels” was imbalanced, with approximately 70% for different cases and 30% for identical cases, posing challenges for achieving perfect learning. Consequently, multi-task learning was structured to concurrently train the objective functions of “Siamese_labels” and each emotion recognition class.
3. Proposed Network
3.1. Siamese Network
The structure of the Siamese model was optimized to utilize minimal hardware resources, considering the requirements of hardware accelerators. This optimization was achieved by minimizing the number of filters and kernel size using the Keras tuner 1.3.5, thereby reducing the computational load. Based on this approach, the Siamese models for both the BVP and EDA were individually optimized. The Keras tuner is a powerful library designed to automate the hyperparameter tuning process for Keras models, enabling efficient optimization of model performance by systematically searching for the best combination of hyperparameters.
Both networks shared the same parameters for constructing the Siamese model. Given that the BVP has relatively abundant time-series data, two convolutional layers were employed. By contrast, because EDA has fewer time-series data, the EMD method was not applied, and raw time-series data were used instead, employing only one convolutional layer. Batch normalization was applied following the convolutional layers, and a rectified linear unit (ReLU) activation function was used. The use of batch normalization helped to maintain a consistent input distribution across layers, stabilizing the model training, and accelerating the learning process, ultimately contributing to improved model robustness.
Next, a max-pooling one-dimensional (1D) layer was added to reduce the data size, followed by a dropout layer. The dropout mechanism prevented overfitting by deactivating a portion of the neurons, thereby enhancing the generalization performance of the model. The vectors computed in this manner were used to calculate the Euclidean distances. In the case of the Siamese model, sharing the same weights reduced the amount of data required for training, allowing it to perform well even with small datasets. This approach is particularly effective for learning high-dimensional feature vectors from data that appear similar but have subtle differences, thereby facilitating the comparison of complex patterns between inputs.
The calculated Euclidean distances were used as inputs to the long short-term memory (LSTM) layer to improve accuracy [29]. LSTM allows for selective memory and deletion of information. Through the input, output, and forget gates, it can selectively control which information to remember and discard. This helps filter out unnecessary information, retaining only important data to enhance model performance. In addition, it can be effectively applied to various sequence-based data, such as time-series analysis. After processing the BVP and EDA data, they were combined using a late fusion-based multimodal method after passing through the Siamese model and LSTM layer. In the case of the LSTM layer, a key hyperparameter is the number of hidden units. This determines the dimensionality of the hidden state vector in the LSTM cell. With fewer hidden units, faster training is possible, and overfitting can be prevented. Increasing the number of hidden units improves accuracy but increases memory usage. To maintain accuracy while reducing hardware resource usage, the number of hidden units was optimized to 14.
In multimodal approaches, various forms of data are combined to perform learning and prediction tasks. For example, different modalities, such as text and images, can be integrated. Two common techniques for combining data are early and late fusion. Early fusion combines data from each modality at the beginning of the learning process to create a single input. This method allows for the early reflection of interactions between modalities, which can lead to the extraction of more complex features. However, as the number of modalities increases, the size of the combined data increases, complicating the learning process and increasing the computational costs. In addition, there is a risk of losing the independent characteristics of each modality. To mitigate these issues, this study employed a late fusion approach in which the data from each modality were processed separately and then combined in the final stage. This allowed for a simpler model structure. Late fusion requires a combination of results computed by the Siamese network and LSTM layer. The late fusion-based multimodal method allows for independent processing of each modality, preserving its unique features and enabling a simpler model structure, which can lead to an improved overall performance and reduced computational complexity. This simpler model structure aids in the implementation of hardware accelerators. Additionally, a hybrid fusion method exists, in which some data are combined initially, whereas the remaining modalities are integrated later.
In this case, the LSTM layer can maintain the same output size, allowing for a simple combination using an addition layer. Alternatively, a concatenation layer could be used for data integration. However, in this case, combining the input tensors would result in an output tensor that is larger by the sum of the input tensors, significantly increasing the memory usage. In addition, the concatenation layer can decrease the efficiency of parallel processing when multiple tensors are combined, leading to longer processing times and greater consumption of hardware resources. When combining input tensors, the data of each tensor must be copied and stored in memory, further increasing resource usage. The hardware resource consumption increases sharply as the size of the tensors being combined increases. In this study, the addition layer was selected to efficiently combine the dimensions with respect to the hardware resources, even if it decreased the accuracy. Ultimately, two dense layers with a sigmoid activation function were employed to determine the final similarity judgment, thereby establishing the “Siamese_labels”. Figure 3 illustrates the structure of the proposed Siamese network based on BVP and EDA input signals. In this case, an input size of (1920, 3) represents a pair of BVP signals and an input size of (120, 1) represents a pair of EDA signals. Each pair was fed into a Siamese network, which had a structure that shared the same weight values. Additionally, all neural networks were implemented using the Keras framework.
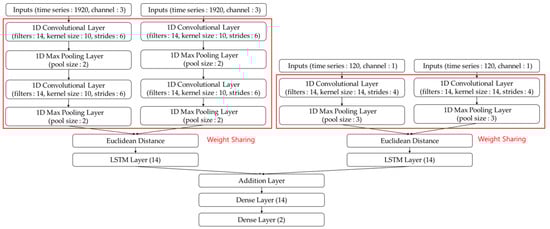
Figure 3.
Structure of the proposed Siamese network based on BVP and EDA inputs.
3.2. Emotion Recognition
Using the proposed Siamese network, the similarity between the labels of BVP and EDA was established. Similarity is defined such that if the labels are the same across four classes, class 1 is assigned, while class 0 is assigned if the labels differ (“Siamese_labels”). To achieve this classification, the Siamese network was trained to maximize the distance between classes. This study aimed to reflect this vector space to determine actual emotion recognition classes. Essentially, for a single input consisting of the BVP and EDA, the feature extraction results calculated by the Siamese network were combined to classify the four emotional states: neutral, stress, amusement, and meditation. In essence, this approach fully utilized the learning outcomes of the Siamese network.
In this case, feature vectors were utilized before calculating the Euclidean distances. The BVP data had a size of (12, 14), whereas the EDA data had a size of (9, 14). To combine these vectors, three methods can be employed: concatenation layer, dense layer, and 1D zero-padding technique. The concatenation layer directly merges the data, allowing for a simple application even when the data shapes differ. However, this approach significantly increases the use of hardware resources and memory, rendering it unsuitable for implementation in hardware accelerators. The method of using a dense layer involves applying a dense layer with the same output size to both datasets and aligning their dimensions before utilizing an addition layer for combination. However, this approach increases the number of parameters in the dense layer, thereby increasing the use of hardware resources.
In this study, the 1D zero-padding technique was applied to the smaller EDA dataset, even at the cost of reduced accuracy, prior to using the addition layer. One-dimensionalzero-padding artificially increases the input size by adding zeros to both ends of the data, allowing for simpler maintenance of the input dimensions. This adjustment resulted in both the BVP and EDA data having a size of (12, 14). The 1D zero-padding technique can be implemented with minimal hardware resource usage, which makes it suitable for implementation in hardware accelerators. In this scenario, the results of BVP and EDA from one of the input pairs processed by the Siamese network were combined using an addition layer, and a late fusion approach was applied. The combined data were then flattened and provided as inputs to a single dense layer that classified the four emotion categories. In this case, the Softmax function was employed as the activation function to favor the classification. Consequently, emotion recognition was conducted for one of the input pairs, while simultaneously recognizing emotions for the other pair. In this case, the output corresponded to four emotional states: neutral, stress, amusement, and meditation. Figure 4 illustrates the structure of the neural networks used for emotion recognition of a single data pair. In this case, the red box section utilized the structure and parameters of the Siamese model without modifications.
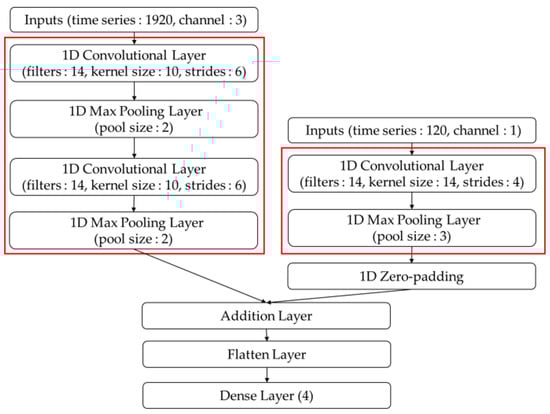
Figure 4.
Structure of the proposed neural networks for emotion recognition.
3.3. Multi-Task Learning Process
The entire network was trained using a multi-task approach, meaning that both the “Siamese_labels” and the emotion recognition labels were learned simultaneously. For the overall network, the total number of parameters was 7794, with 7626 of them being trained, indicating a relatively small amount of training data. This reduction was a result of optimizing the convolutional layers and other components.
For the “Siamese_labels”, the loss is defined using binary cross-entropy, and the Adam optimization method was applied. The emotion recognition classes consisted of four emotional states: neutral, stress, amusement, and meditation. In this case, categorical cross-entropy was specified as the loss function, and the Adam optimizer was used. By simultaneously training the Siamese model and the emotion recognition model through multi-task learning, important information, and features can be complementary and reinforced between the two tasks. This is particularly advantageous in environments with limited training data, where the learning of one task can contribute to improving the performance of the other task. For multi-task learning, the loss functions of the Siamese model and the emotion recognition model were combined, with a weight of 1 assigned to the Siamese model’s loss and a weight of 2 to the emotion recognition model’s loss. This weighting strategy ensures that both learning processes are efficiently optimized simultaneously. The test and validation datasets were structured such that the validation data comprised 15% of the total data, allowing for an assessment of the generalization capability of the model. The accuracy of the “Siamese_labels”, as well as the labels for the first and second pairs of BVP and EDA data, was designated as the target matrix.
The classification results for emotion recognition are shown in Figure 5. The accuracy is represented in the form of a confusion matrix. The confusion matrix visually represents the prediction results of the model along the x- and y-axes. The x-axis indicates the classes predicted by the model, and the y-axis represents the actual classes, with all classes listed along each axis. Each cell displays the number of observations for a combination of the actual and predicted classes. This matrix allows for the evaluation of the performance of the model on an individual class basis, providing foundational data to calculate the accuracy, recall, precision, and F1-score, and to identify and improve the performance degradation in specific classes. From Figure 5, it is evident that the class with the least training data was class 3, which corresponded to the amusement state. Additionally, cases, where recognition was poor, were evident, particularly when the actual emotional state was amusement. However, the model predicted this as meditation. This can be attributed to the limited amount of training data for the amusement class and the similarities between the two states.
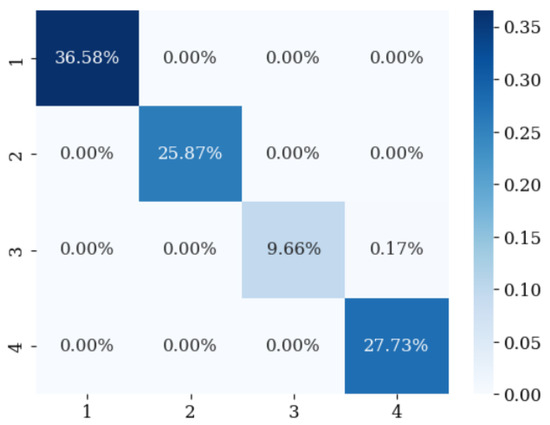
Figure 5.
Confusion matrix for emotion recognition.
In this case, the accuracy of emotion recognition was 99.916%, with a recall of 99.833%, precision of 99.833%, and an F1-score of 99.833%. This indicates that recognition of the four emotional states was achieved with high accuracy. However, for the “Siamese_labels”, the accuracy was 96.874%, the recall was 96.967%, precision was 92.582%, and the F1-score was 94.723%. Data imbalance may have influenced these results, as well as the classification limitations of the Siamese model for the four emotional states. In the case of “Siamese_labels”, classification appeared to be somewhat approximated; however, to improve accuracy, the model learned to maximize the Euclidean distance based on each emotional state. This approach, while the Siamese network achieved relatively low accuracy, enabled the emotion recognition algorithm to attain sufficient accuracy, thereby enhancing the performance of individual emotion recognition algorithms and ultimately improving the overall emotion recognition accuracy. Furthermore, it demonstrated effective performance on validation data, ensuring generalization capabilities. Figure 6 shows the confusion matrix for the “Siamese_labels” for reference.
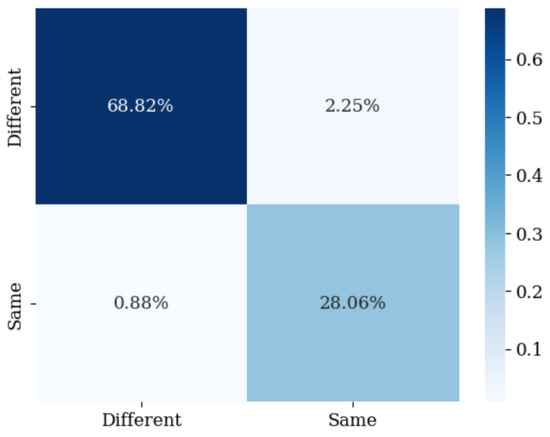
Figure 6.
Confusion matrix for the “Siamese_labels”.
For software-based computing, the inference time was measured. The proposed neural network architecture was designed with hardware accelerators to utilize minimal hardware resources. Consequently, the inference time for software-based computing allowed real-time operations. When a high-performance Intel Core i7-7700HQ CPU was used, it took approximately 1.8 ms to process a single data point.
The results of this study reveal a substantial enhancement in emotion recognition performance compared to prior research utilizing the WESAD dataset. A comparative analysis with existing studies is presented in Table 1 [30,31,32,33]. The comparison results are difficult to directly assess due to differences in preprocessing methods and the data used. However, it is evident that the proposed model demonstrates superior performance. The convolutional neural network (CNN) is a deep learning model for image recognition. The support vector machine (SVM) utilizes linear kernel for classification, while the extreme gradient boosting (XGBoost) method employs gradient boosting trees for model optimization. The binary classification refers to the distinction between unstressed and stressed conditions, while the multiclass classification, as discussed in this study, refers to the classification of multiple emotion states or categories. This improvement can be attributed to several factors, including meticulous data preprocessing and the application of a Siamese model that effectively distinguished emotional recognition states using Euclidean distance metrics. Furthermore, the iterative refinement of the neural network architecture through retraining plays a critical role. The simultaneous learning of Siamese labels and emotion recognition labels within a multi-task framework is also posited to contribute significantly to the observed increase in accuracy.

Table 1.
Comparison of model accuracy for emotion recognition with the WESAD dataset.
This approach is useful in cases where emotion recognition through facial expressions is difficult, such as in Parkinson’s disease patients. However, in the case of Parkinson’s patients, emotion recognition through physiological signals may be challenging due to motor and non-motor symptoms, and further analysis on this issue needs to be conducted [34,35]. Additionally, an analysis of accuracy reduction in situations where data is obtained in noisy environments is also necessary.
4. Hardware Accelerator
This study considered the application of hardware accelerators in the network design phase for emotion recognition. A simplified Siamese network architecture was employed, with careful attention paid to maximizing the reuse of hardware resources. In addition, layers requiring substantial hardware resources were systematically excluded. In the case of the convolutional layers, the number of filters, kernel size, and stride were optimized to enable their configuration with minimal hardware resources. Furthermore, the use of concatenation layers was restricted to further optimize the network structure.
Initially, an FPGA was considered for the hardware accelerator. However, it can be easily adapted into an integrated circuit (IC) suitable for future wearable devices [36]. Digital logic designs can be broadly categorized into two types. The first approach involves a hardware description language (HDL) in which the designer explicitly defines the behavior of the system using languages such as Verilog HDL or VHDL [37]. The design is then implemented at the register-transfer level (RTL) and synthesized into gate-level circuits. Following this, the design undergoes placement and routing processes to be physically realized as hardware. The second approach leverages high-level synthesis (HLS), in which the designer writes algorithms in high-level languages such as C, C++, or SystemC [38]. These algorithms are then automatically converted into RTL designs using HLS tools, which are subsequently synthesized into hardware description languages such as Verilog HDL or VHDL. HLS enables the efficient conversion of complex algorithms into hardware, reducing the design time and complexity, following which synthesis and optimization steps similar to those in the HDL-based design are applied to achieve the final hardware implementation. In this study, the process of modeling each block of the proposed neural network was modeled using HLS and then converted into Verilog HDL.
For hardware implementation, fixed-point arithmetic was deemed appropriate, and the “ap_fixed<33,8>” format was utilized to ensure maximum accuracy during hardware deployment. Using this approach, the accuracy, recall, precision, and F1-score obtained were identical to those achieved using the software. Specifically, the accuracy of emotion recognition was 99.916%, with a recall of 99.833%, a precision of 99.833%, and an F1-score of 99.833%. The fixed-point number syntax is defined as “ap_fixed<9,4>”, where the total number of bits is represented by “9”, and the integer part, including the sign bit, is represented by “4”. Through additional optimization processes, the bit usage can be further reduced. To reduce hardware usage, an algorithm that reuses hardware with the same functionality was employed, along with a method to prevent a decrease in operating speed.
To verify the hardware resource usage and validate the operation of the hardware accelerator, implementation was performed on the “xcku035-fbva676-3-e” FPGA chipset. Figure 7 shows the hardware utilization. While improving accuracy often requires more complex models, such as deeper neural networks or higher computational resources, this can significantly increase hardware complexity and power consumption.
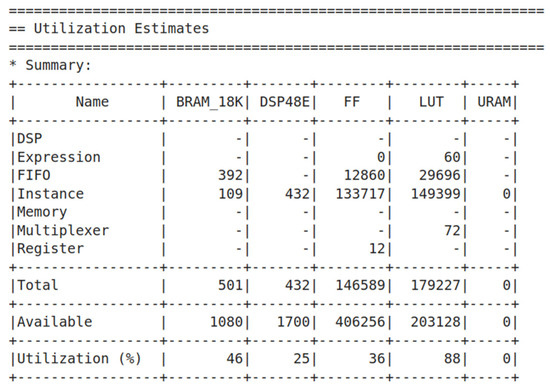
Figure 7.
Hardware utilization for the “xcku03-fbva676-3-e” chipset.
In terms of the hardware resources, 35.4% of the flip-flops (F/F) were used to implement the four dense layers. This was because the F/Fs were essential for storing the weights and intermediate calculation results of each neuron in the dense layers. The computational process of the dense layers was structured to improve the overall processing speed through pipelining using F/Fs, which allowed storage of the results at each stage and passed them to the next stage. Consequently, a large number of F/Fs were required. The next hardware block with significant resource usage was the LSTM. The high hardware resource consumption of the LSTM network is due to its complex structure, which processes information through several gates, such as the input, output, and forget gates. These gates require additional computation and memory, which leads to increased resource consumption. Furthermore, because LSTM must store past state information, it requires more memory space, and the numerous computations performed at each time step require substantial computational resources. In addition, the sequential nature of sequence data limits parallel processing, resulting in slower computation and further resource consumption. For the LSTM, 27.9% of the F/Fs and 26.6% of the look-up tables (LUTs) were used. In the case of CNNs, because of their smaller design size and thinner layers, hardware resource usage is relatively low. Finally, regarding the use of block random access memory (BRAM), the majority of the resources (approximately 78%) were utilized to store intermediate results related to hardware reuse, whereas only approximately 22% were used to store weights.
Regarding the computation time, the use of pipelining and hardware reuse techniques to reduce hardware resources leads to a slight increase in the processing time. Most delays occurred in the convolutional layer because the computations in this layer were partially performed sequentially. Consequently, the inference time through the hardware accelerator was approximately 2.17 ms, which was slightly slower than the software computation result of 1.8 ms. However, inference computation using the hardware accelerator offers several advantages. Compared to traditional CPUs, hardware accelerators are more power-efficient and consume less power for the same task, thus reducing costs and providing environmental benefits. Additionally, although software computation typically relies on high-performance CPUs, the hardware accelerator performs the same computations on lower-performance hardware. The time required for data transmission to the server is an important consideration. Using a hardware accelerator, inference can be performed immediately without the need to transmit data to the server, resulting in faster processing and a reduction in the overall response time.
Finally, the resources required for implementing a hardware accelerator in an IC were interpreted. Based on the FPGA utilization information, the resources in the IC were interpreted using the following process. One LUT was converted into four two-input NAND gates (maximum of six) [39]. One digital signal processor (DSP) was converted into 100 two-input NAND gates (maximum of 200). One F/F was converted into two, two-input NAND gates. Based on this, 179,227 LUTs are equivalent to 716,908 two-input NAND gates, 432 DSPs to 43,200 two-input NAND gates, and 146,589 F/Fs to 293,178 two-input NAND gates. In total, 1,053,286 two-input NAND gates were implemented. For the 18 Kb BRAM, 501 units were used, and because the proposed network had only 7794 learned weights, the BRAM usage for this purpose was minimal. Instead, to reduce hardware resource usage, most of the BRAM was used to store intermediate results. Approximately 9 Mb (approximately 1 MB) of memory was required. Assuming that one two-input NAND gate is used to store one bit, 9,000,000 two-input NAND gates would be required.
Currently, the structure was designed to match FPGA utilization, which resulted in the high BRAM usage mentioned above. However, during the optimization process for IC, efforts are required to reduce hardware reuse to decrease memory size. Tools such as “Yosys” can be used for NAND gate estimation, but to separate the memory components, the direct conversion method was used as described above [40].
The proposed neural network architecture corresponds to that of a large-scale neural network. Small-scale neural networks consist of 1–2 layers, with 5–10 nodes per layer, requiring approximately 100–1000 two-input NAND gates. These networks typically require 1–10 KB of memory, offer fast inference speeds, and are suitable for resource-constrained environments. Medium-scale neural networks are composed of 3–5 layers, with 20–50 nodes per layer, and require approximately 1000–10,000 two-input NAND gates. These networks require between 10 KB and 1 MB of memory for complex pattern recognition and high accuracy, making them suitable for general applications. Large-scale neural networks consist of six or more layers, with over 100 nodes per layer, requiring hundreds of thousands to millions of two-input NAND gates, that is, between 100,000 and 1,000,000 or more. They may require tens of MB of memory and typically demand > 100 MB of memory [41].
5. Conclusions and Discussion
In conclusion, this study proposed an efficient neural network-based classification model for stress analysis and emotion recognition in wearable environments by utilizing the WESAD dataset. Specifically, BVP and EDA data measured from the wrist were combined using a late fusion multimodal method, and a multi-class classification technique was employed using a Siamese network and parallel learning structure, achieving high classification performance even in data-limited environments. The proposed model, which uses minimal hardware resources, is capable of real-time emotion recognition, demonstrating its potential for enhancing the practicality of wearable devices. The model achieved an accuracy of 99.916%, recall of 99.833%, precision of 99.833%, and an F1-score of 99.833%, all with only 7794 parameters. The implementation was conducted on the “xcku5p-ffva676-3-e” FPGA chipset, achieving an inference time of 2.17 ms. Furthermore, excluding BRAM, the model can be implemented on an IC with approximately 1,053,286 two-input NAND gates.
Emotion recognition, particularly stress analysis, has garnered significant attention because it enables real-time monitoring of user states through wearable devices and provides immediate feedback. This study demonstrated that the late fusion approach, which combines physiological signals, such as BVP and EDA, effectively addresses data incompleteness. In addition, similarity score-based learning through a Siamese network allows for efficient classification even with limited data.
However, data collection in a wearable environment presents several challenges. In particular, the limited number of channels and noise in the measured signals can affect classification accuracy. To address these issues, it is essential to integrate multiple sensor signals and develop advanced preprocessing techniques. Moreover, although the proposed model demonstrated feasibility for real-time applications, personalized learning that accounts for individual differences among users may be required for practical deployment.
Future research should focus on expanding the sensor coverage and developing more refined adaptive emotion recognition systems through personalized data learning. Such advancements will not only enhance the practicality of real-time stress management and emotional regulation feedback systems but also have the potential to be widely applied across various wearable applications.
Funding
This study was supported by a research fund from Chosun University (2024).
Data Availability Statement
The data supporting the findings of this study are available in reference [21].
Conflicts of Interest
The author declares no conflicts of interest.
References
- Dzedzickis, A.; Kaklauskas, A.; Bucinskas, V. Human emotion recognition: Review of sensors and methods. Sensors 2020, 20, 592. [Google Scholar] [CrossRef]
- Zamkah, A.; Hui, T.; Andrews, S.; Dey, N.; Shi, F.; Sherratt, R.S. Identification of suitable biomarkers for stress and emotion detection for future personal affective wearable sensors. Biosensors 2020, 10, 40. [Google Scholar] [CrossRef] [PubMed]
- Mukherjee, N.; Mukhopadhyay, S.; Gupta, R. Real-time mental stress detection technique using neural networks towards a wearable health monitor. Meas. Sci. Technol. 2022, 33, 044003. [Google Scholar] [CrossRef]
- Greene, S.; Thapliyal, H.; Caban-Holt, A. A survey of affective computing for stress detection: Evaluating technologies in stress detection for better health. IEEE Consum. Electron. Mag. 2016, 5, 44–56. [Google Scholar] [CrossRef]
- Dávila-Montero, S.; Dana-Lê, J.A.; Bente, G.; Hall, A.T.; Mason, A.J. Review and challenges of technologies for real-time human behavior monitoring. IEEE Trans. Biomed. Circuits Syst. 2021, 15, 2–28. [Google Scholar] [CrossRef] [PubMed]
- Giannakakis, G.; Grigoriadis, D.; Giannakaki, K.; Simantiraki, O.; Roniotis, A.; Tsiknakis, M. Review on psychological stress detection using biosignals. IEEE Trans. Affect. Comput. 2019, 13, 440–460. [Google Scholar] [CrossRef]
- Tarnowski, P.; Kołodziej, M.; Majkowski, A.; Rak, R.J. Emotion recognition using facial expressions. Procedia Comput. Sci. 2017, 108, 1175–1184. [Google Scholar] [CrossRef]
- Lim, Y.; Ng, K.W.; Naveen, P.; Haw, S.C. Emotion recognition by facial expression and voice: Review and analysis. J. Inform. Web Eng. 2022, 1, 45–54. [Google Scholar] [CrossRef]
- Shu, L.; Xie, J.; Yang, M.; Li, Z.; Li, Z.; Liao, D.; Xu, X.; Yang, X. A review of emotion recognition using physiological signals. Sensors 2018, 18, 2074. [Google Scholar] [CrossRef] [PubMed]
- Siddiqui, H.U.R.; Shahzad, H.F.; Saleem, A.A.; Khan Khakwani, A.B.; Rustam, F.; Lee, E.; Ashraf, I.; Dudley, S. Respiration based non-invasive approach for emotion recognition using impulse radio ultra wide band radar and machine learning. Sensors 2021, 21, 8336. [Google Scholar] [CrossRef]
- Valderas, M.T.; Bolea, J.; Laguna, P.; Vallverdú, M.; Bailón, R. Human emotion recognition using heart rate variability analysis with spectral bands based on respiration. In Proceedings of the 2015 37th Annual International Conference of the IEEE Engineering in Medicine and Biology Society (EMBC), Milan, Italy, 25–29 August 2015; pp. 6134–6137. [Google Scholar]
- Jenke, R.; Peer, A.; Buss, M. Feature extraction and selection for emotion recognition from EEG. IEEE Trans. Affect. Comput. 2014, 5, 327–339. [Google Scholar] [CrossRef]
- Goshvarpour, A.; Abbasi, A.; Goshvarpour, A. An accurate emotion recognition system using ECG and GSR signals and matching pursuit method. Biomed. J. 2017, 40, 355–368. [Google Scholar] [CrossRef]
- Egger, M.; Ley, M.; Hanke, S. Emotion recognition from physiological signal analysis: A review. Electron. Notes Theor. Comput. Sci. 2019, 343, 35–55. [Google Scholar] [CrossRef]
- Wang, Z.; Yu, Z.; Zhao, B.; Guo, B.; Chen, C.; Yu, Z. Emotionsense: An adaptive emotion recognition system based on wearable smart devices. ACM Trans. Comput. Healthc. 2020, 1, 1–17. [Google Scholar] [CrossRef]
- Wijasena, H.Z.; Ferdiana, R.; Wibirama, S. A survey of emotion recognition using physiological signal in wearable devices. In Proceedings of the 2021 International Conference on Artificial Intelligence and Mechatronics Systems (AIMS), Bandung, Indonesia, 28–30 April 2021; pp. 1–6. [Google Scholar]
- Wetcho, S.; Na-Songkhla, J. An investigation of pre-service teachers using mobile and wearable devices for emotion recognition and social sharing of emotion to support emotion regulation in mCSCL environments. Contemp. Educ. Technol. 2022, 14, ep359. [Google Scholar]
- Lin, W.; Li, C. Review of studies on emotion recognition and judgment based on physiological signals. Appl. Sci. 2023, 13, 2573. [Google Scholar] [CrossRef]
- Ali, M.; Al Machot, F.; Haj Mosa, A.; Jdeed, M.; Al Machot, E.; Kyamakya, K. A globally generalized emotion recognition system involving different physiological signals. Sensors 2018, 18, 1905. [Google Scholar] [CrossRef] [PubMed]
- Ayata, D.; Yaslan, Y.; Kamasak, M.E. Emotion recognition from multimodal physiological signals for emotion aware healthcare systems. J. Med. Biol. Eng. 2020, 40, 149–157. [Google Scholar] [CrossRef]
- Schmidt, P.; Reiss, A.; Duerichen, R.; Marberger, C.; Van Laerhoven, K. Introducing WESAD, a multimodal dataset for wearable stress and affect detection. In Proceedings of the 20th ACM International Conference on Multimodal Interaction, Boulder, CO, USA, 16–20 October 2018; pp. 400–408. [Google Scholar]
- Fei, Z.; Yang, E.; Li, D.D.U.; Butler, S.; Ijomah, W.; Li, X.; Zhou, H. Deep convolution network based emotion analysis towards mental health care. Neurocomputing 2020, 388, 212–227. [Google Scholar] [CrossRef]
- Choi, H.S. Simple Siamese Model with Long Short-Term Memory for User Authentication with Field-Programmable Gate Arrays. Electronics 2024, 13, 2584. [Google Scholar] [CrossRef]
- Choi, H.S. Siamese Neural Network for User Authentication in Field-Programmable Gate Arrays (FPGAs) for Wearable Applications. Electronics 2023, 12, 4030. [Google Scholar] [CrossRef]
- Lin, J.; Pan, S.; Lee, C.S.; Oviatt, S. An explainable deep fusion network for affect recognition using physiological signals. In Proceedings of the 28th ACM International Conference on Information and Knowledge Management, Beijing, China, 3–7 November 2019; pp. 2069–2072. [Google Scholar]
- Choi, H.S. Electromyogram (EMG) signal classification based on light-weight neural network with FPGAs for wearable application. Electronics 2023, 12, 1398. [Google Scholar] [CrossRef]
- Yücelbaş, C.; Yücelbaş, Ş.; Özşen, S.; Tezel, G.; Küççüktürk, S.; Yosunkaya, Ş. Automatic detection of sleep spindles with the use of STFT, EMD and DWT methods. Neural Comput. Appl. 2018, 29, 17–33. [Google Scholar] [CrossRef]
- Zhang, Y.; Yang, Q. A survey on multi-task learning. IEEE Trans. Knowl. Data Eng. 2021, 34, 5586–5609. [Google Scholar] [CrossRef]
- Awais, M.; Raza, M.; Singh, N.; Bashir, K.; Manzoor, U.; Islam, S.U.; Rodrigues, J.J. LSTM-based emotion detection using physiological signals: IoT framework for healthcare and distance learning in COVID-19. IEEE Internet Things J. 2020, 8, 16863–16871. [Google Scholar] [CrossRef]
- Ghosh, S.; Kim, S.; Ijaz, M.F.; Singh, P.K.; Mahmud, M. Classification of mental stress from wearable physiological sensors using image-encoding-based deep neural network. Biosensors 2022, 12, 1153. [Google Scholar] [CrossRef] [PubMed]
- Singh, G.; Phukan, O.C.; Kumar, R. Stress recognition with multi-modal sensing using bootstrapped ensemble deep learning model. Expert Syst. 2023, 40, e13239. [Google Scholar] [CrossRef]
- Liapis, A.; Faliagka, E.; Antonopoulos, C.P.; Keramidas, G.; Voros, N. Advancing stress detection methodology with deep learning techniques targeting UX evaluation in AAL scenarios: Applying embeddings for categorical variables. Electronics 2021, 10, 1550. [Google Scholar] [CrossRef]
- Vos, G.; Trinh, K.; Sarnyai, Z.; Azghadi, M.R. Ensemble machine learning model trained on a new synthesized dataset generalizes well for stress prediction using wearable devices. J. Biomed. Inform. 2023, 148, 104556. [Google Scholar] [CrossRef]
- Argaud, S.; Vérin, M.; Sauleau, P.; Grandjean, D. Facial emotion recognition in Parkinson’s disease: A review and new hypotheses. Mov. Disord. 2018, 33, 554–567. [Google Scholar] [CrossRef]
- Chiang, K.W.; Tan, C.H.; Hong, W.P.; Yu, R.L. Disgust-specific impairment of facial emotion recognition in Parkinson’s disease patients with mild cognitive impairment. Soc. Cogn. Affect. Neurosci. 2024, 19, nsae073. [Google Scholar] [CrossRef]
- Seng, K.P.; Lee, P.J.; Ang, L.M. Embedded intelligence on FPGA: Survey, applications and challenges. Electronics 2021, 10, 895. [Google Scholar] [CrossRef]
- Parmar, R.; Janveja, M.; Pidanic, J.; Trivedi, G. Design of DNN-based low-power VLSI architecture to classify atrial fibrillation for wearable devices. IEEE Trans. Very Large Scale Integr. (VLSI) Syst. 2023, 31, 320–330. [Google Scholar] [CrossRef]
- Aarrestad, T.; Loncar, V.; Ghielmetti, N.; Pierini, M.; Summers, S.; Ngadiuba, J.; Petersson, C.; Linander, H.; Iiyama, Y.; Guglielmo, G.D.; et al. Fast convolutional neural networks on FPGAs with hls4ml. Mach. Learn. Sci. Technol. 2021, 2, 045015. [Google Scholar] [CrossRef]
- Sudhanya, P.; Rani, S.J.V.; Lavanya, M.C. Design of Logic Blocks for Efficient Architecture of FPGA. In Proceedings of the 2019 IEEE 1st International Conference on Energy, Systems and Information Processing (ICESIP), Chennai, India, 4–6 July 2019; pp. 1–5. [Google Scholar]
- Xie, L.; Cai, H.; Wang, C.; Yang, J. Towards an automated design flow for memristor based VLSI circuits. Integration 2020, 70, 21–31. [Google Scholar] [CrossRef]
- Yang, S.; Deng, B.; Wang, J.; Li, H.; Lu, M.; Che, Y.; Wei, X.; Loparo, K.A. Scalable digital neuromorphic architecture for large-scale biophysically meaningful neural network with multi-compartment neurons. IEEE Trans. Neural Netw. Learn. Syst. 2019, 31, 148–162. [Google Scholar] [CrossRef] [PubMed]
Disclaimer/Publisher’s Note: The statements, opinions and data contained in all publications are solely those of the individual author(s) and contributor(s) and not of MDPI and/or the editor(s). MDPI and/or the editor(s) disclaim responsibility for any injury to people or property resulting from any ideas, methods, instructions or products referred to in the content. |
© 2025 by the author. Licensee MDPI, Basel, Switzerland. This article is an open access article distributed under the terms and conditions of the Creative Commons Attribution (CC BY) license (https://creativecommons.org/licenses/by/4.0/).