1. Introduction
In recent years, various application systems of sound information processing technology have been proposed [
1,
2,
3,
4], such as speech dialogue recognition, detection of animal activity sounds, and detection of drone flight sounds. Many systems like these use acoustic event detection and sound source localization in the front end. Therefore, if we can expand the observation space for acoustic event detection and sound source localization, it is expected that many of these applied systems can be applied to more sites than are currently available. In general, acoustic event detection often refers to detecting the time when the event occurred. However, acoustic event detection also involves detecting the spatial coordinates of the acoustic event that occurred. In other words, it is important to simultaneously detect the time of occurrence of an acoustic event and estimate the location of the sound source.
There are several methods to achieve acoustic event detection and sound source localization. The main ones are methods using distributed microphones, methods using a microphone array, and methods using distributed microphone arrays. When using distributed microphones, acoustic event detection and sound source localization can be achieved simultaneously over a wide range of observation spaces, but the spatial resolution of sound source localization is low, and information that indicates only that an acoustic event was detected near the placed microphone is obtained. Therefore, ambiguity remains in spatial information. Although the method using a microphone array can realize sound source detection and sound source localization with high accuracy, it has the problem that the observation space is narrow and it is not possible to construct a system that targets a wide observation space. To solve these problems, methods using distributed microphone arrays can cover a wide space and also realize sound source localization with relatively high resolution. This method estimates the sound source arrival direction from two microphone arrays and localizes the sound source based on triangulation, but it is difficult to improve the estimation accuracy due to the limited accuracy of triangulation. We propose a new method for acoustic event detection and sound source localization using a distributed microphone array.
We describe a method for simultaneously detecting multiple acoustic events scattered within a space from the observed signals by distributing multiple microphone arrays and estimating their source positions. Microphone array technology is a technology that groups multiple microphone elements and uses them as one virtual microphone. This is a method that allows you to control the directivity of a virtual microphone using software control. The observation space targeted by our method is a wide area that is several tens of meters or more in each axis. Our method is an elemental technology for a system that analyzes and visualizes dialogue activities by distributing multiple microphone arrays on the ceiling of a large hall. The reason for installing the microphone array on the ceiling is to prevent it from affecting the propagation of sounds emitted during dialogue activities. Many such systems have been proposed in the last few decades [
5,
6,
7,
8], but the problem is that they do not cover a sufficient area.
Figure 1 shows the microphone array arrangement in the system. The orange circle marks in the figure represent the microphone array. The microphone array is arranged in a triangular repeating structure on the ceiling. We propose a solution to the problem of detecting the presence or absence of people’s speech and estimating the location of speech from multichannel audio signals observed with these microphone arrays. If this problem can be solved, it will be possible to estimate which conversation group a speaker belongs to based on the proximity of the speaker’s utterance position.
The area of people’s activities, i.e., the observation space, is divided into a repeating pattern of equilateral triangles with sides of 1.5 m, and microphone arrays are placed at the vertices of these equilateral triangles. As the idea of dividing the observation space is used in the field of sound source tracking to reduce the amount of calculation [
9], we also use the idea. We show the evaluation results using acoustic event detection and sound source localization when two speakers simultaneously talk with each other inside a regular hexagon formed by six equilateral triangles around one microphone array position.
A large number of microphones are required to collect the acoustic events in such a wide observation space, to detect the events, and to localize their source position. The reason is that the distance range captured by a single microphone is limited. It is possible to capture acoustic events occurring within the observation space by distributing many microphones. However, the problem is that the system scale becomes too large as the number of microphones increases. The wiring length might be longer to distribute the microphones over a wide area. The longer the wiring between the microphone and the analog-to-digital converter, the more noise is picked up on the route. Connecting many microphones requires analog-to-digital converters with a large number of channels, which increases system complexity and installation costs. Furthermore, typical acoustic event detection and sound source localization methods are based on the assumption that observations are captured by multichannel synchronized recording. Due to the limitation of the number of channels that can be implemented as a synchronous recording device, it is difficult to distribute a sufficient number of microphones over the wide observation space. The reason why our proposed method can handle a wide observation space is that it employs an architecture that can separate the microphone array part that directly handles the observed sound and the part that actually estimates the sound source position.
In this article, we review related works first. Then, we describe the baseline method in
Section 3. In
Section 4, we describe the conventional method, which is an improved version of the baseline method. Then, we propose a new method for acoustic event detection and sound source localization based on spatial energy distribution in
Section 5. In
Section 6, we show the evaluation results of acoustic event detection accuracy and sound source localization error for the conventional method and the proposed method. We describe the case of one sound source and the case of two sound sources. We discuss our method in
Section 7. Finally, we conclude this article.
2. Literature Review
In applications such as the one targeted by this research, there is a problem in that the number of microphones used for observation exceeds the number that can be achieved in synchronization. This problem becomes more serious as the observation space becomes wider. In this section, we introduce conventional research that uses a wide area as the observation space and conventional research that uses a narrow area as the observation space.
To attack this problem, several methods [
1,
2,
3,
4] have been proposed that use multiple microphone arrays to detect acoustic events occurring in a wide observation space and to localize sound sources. These studies deal with acoustic event detection and sound source localization problems over a wide observation space, such as outdoors. These methods do not require synchronized recording between multiple microphone arrays. These methods estimate the direction of arrival of the sound source [
10,
11,
12,
13,
14,
15] independently for each microphone array, and by collecting the information, the position of the sound source can be estimated based on the principle of triangulation. This feature increases the flexibility of the microphone array arrangement.
Sumitani, et al. [
1] and Gabriel, et al. [
2] attempted to detect acoustic events of bird calls. They installed two microphone arrays at two positions, used each microphone array to estimate the direction of the sound source, and then estimated the bird’s position using the principle of triangulation. The authors also proposed a method [
3] for estimating the position of a quadcopter based on the principle of triangulation after estimating the arrival direction of a sound source from two positions using a stereo microphone. However, these methods have the problem that they only consider cases where there is one sound source in the observation space. The larger the observation space, the greater the number of acoustic events that occur there. And the greater the possibility that they might occur simultaneously, so the applicable scope of these conventional studies might be limited.
In contrast, many studies have been conducted on methods for detecting acoustic events and localizing sound sources that occur in a narrow space. It is not so hard to detect multiple acoustic events and localize multiple sound sources, when the observation space is narrow. One of the authors [
16] also developed simultaneous localization of multiple sound sources, simultaneous sound source separation, and speech recognition in a narrow space of about 2 m radius using an 8-channel microphone array. This method, which implements three-speaker simultaneous speech recognition on the humanoid robot HRP-2, is implemented using multichannel signal processing with synchronous recording using a single 8-channel microphone array (you can see a demonstration [
17] in Japanese). Multichannel signal processing with synchronous recording can utilize phase information between channels, so it can achieve high sound source localization and sound source separation capabilities in an overdetermined environment (i.e., an environment where the number of microphone elements on a microphone array is more than the number of existing sound sources in the observation space). However, systems that assume synchronous recording have the problem that even if it is desired to increase the number of microphone elements to cover a wide range of observation space, it is not easy to increase the number of microphone elements due to hardware constraints.
In this article, we propose a method that can detect multiple acoustic events simultaneously over a wide observation space and estimate the positions of their detected sound sources. The proposed method divides the observation space into small areas and observes the sound source while switching the microphone array responsible for observation for each divided area. This method does not require time synchronization between microphone arrays, so it has the feature that it can be easily distributedly arranged over a wide observation space.
Baseline methods based on triangulation can also be applied to observe divided small areas using multiple microphone arrays. In this article, we first describe an extension of the baseline method based on triangulation to apply it to multiple sound sources, and consider this method as a conventional method based on triangulation. The conventional method consists of a combination of localization and sound source detection using triangulation from three directions. The proposed method is based on the local maximum position of the spatial energy distribution.
The conventional method and baseline method are based on a two-step estimation framework of direction estimation and sound source position estimation. The disadvantage of the method is that two different criteria are applied in two-step estimation before determining an estimated position, which, in principle, accumulates estimation errors and increases the average localization error. In addition, some kind of processing is required to select the sound source that is considered to be the true sound source and remove spurious sound sources after estimating the sound source position. As such processing causes deterioration of the criterion for estimation, the accuracy of the sound source detection decreases.
The proposed method directly estimates the sound source position using a single criterion, without relying on the two-step framework that is problematic with triangulation-based methods. Our proposed method estimates the spatial energy distribution inside the observation space and finds the local maximum positions of the distribution as the sound source position. Our method treats the local maximum position as the sound source position. Since the local maximum value corresponds to the sound source being detected, detection and sound source localization can be achieved simultaneously and using a single criterion. We show the effectiveness of our method by comparing the cumulative distribution of localization errors and the detected number of fake sound sources between a baseline method, conventional method, and the proposed method.
3. Triangulation-Based Method (Baseline Method)
Baseline sound source localization, as typified by Sumitani et al. [
1], Gabriel et al. [
2], Yamamoto et al. [
4], and Takahashi et al. [
3], estimates the sound source position based on the principle of triangulation from the sound observed by two microphone arrays. Given the sound source direction estimated by two microphone arrays, the intersection of two straight lines extending from the microphone array position to the sound source direction can be estimated as the sound source position. Sound source detection is performed using energy threshold processing. For threshold processing, there is a method that uses the energy of a sound source emphasis waveform obtained by beamforming [
18,
19] with one microphone array toward the estimated sound source position. There is also a method that uses the energy of the audio waveform collected by an element. Any microphone array can be triangulated as long as there are two microphone arrays. In the remainder of this text, we use an example of a 4ch microphone array as a specific system configuration.
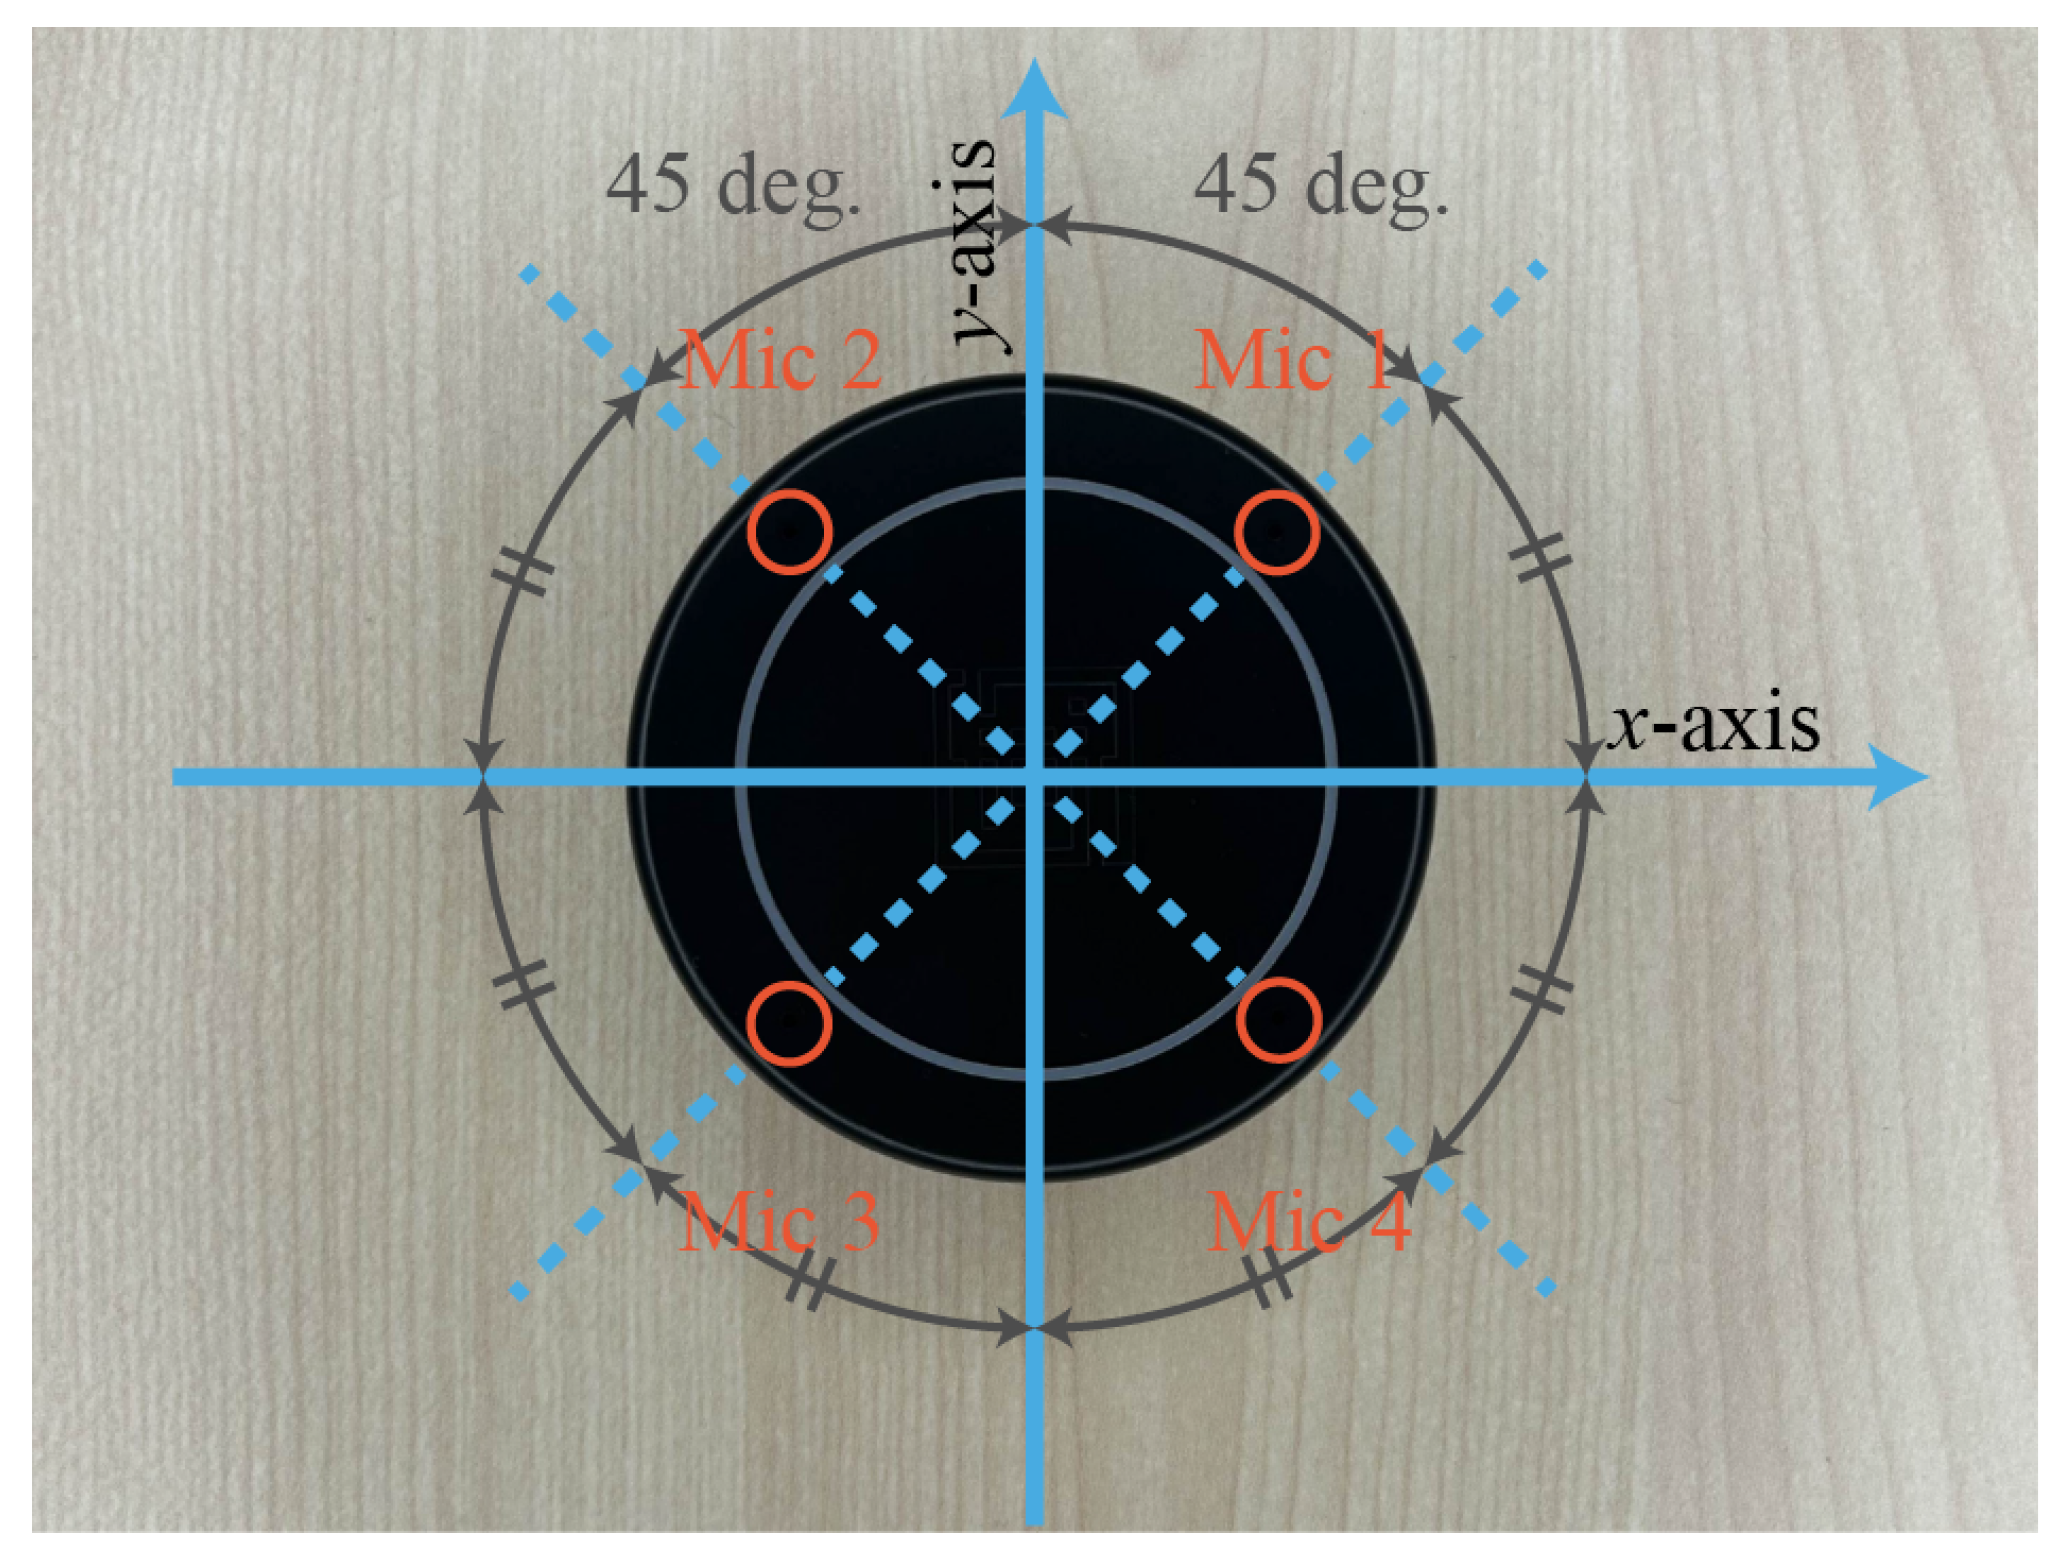
In this work, we use a 4-channel circular microphone array with a diameter of 65 mm, as shown in
Figure 2. Microphone elements are mounted at the positions indicated by the four orange circles in
Figure 2. The four elements are arranged at equal angular intervals on the same circumference.
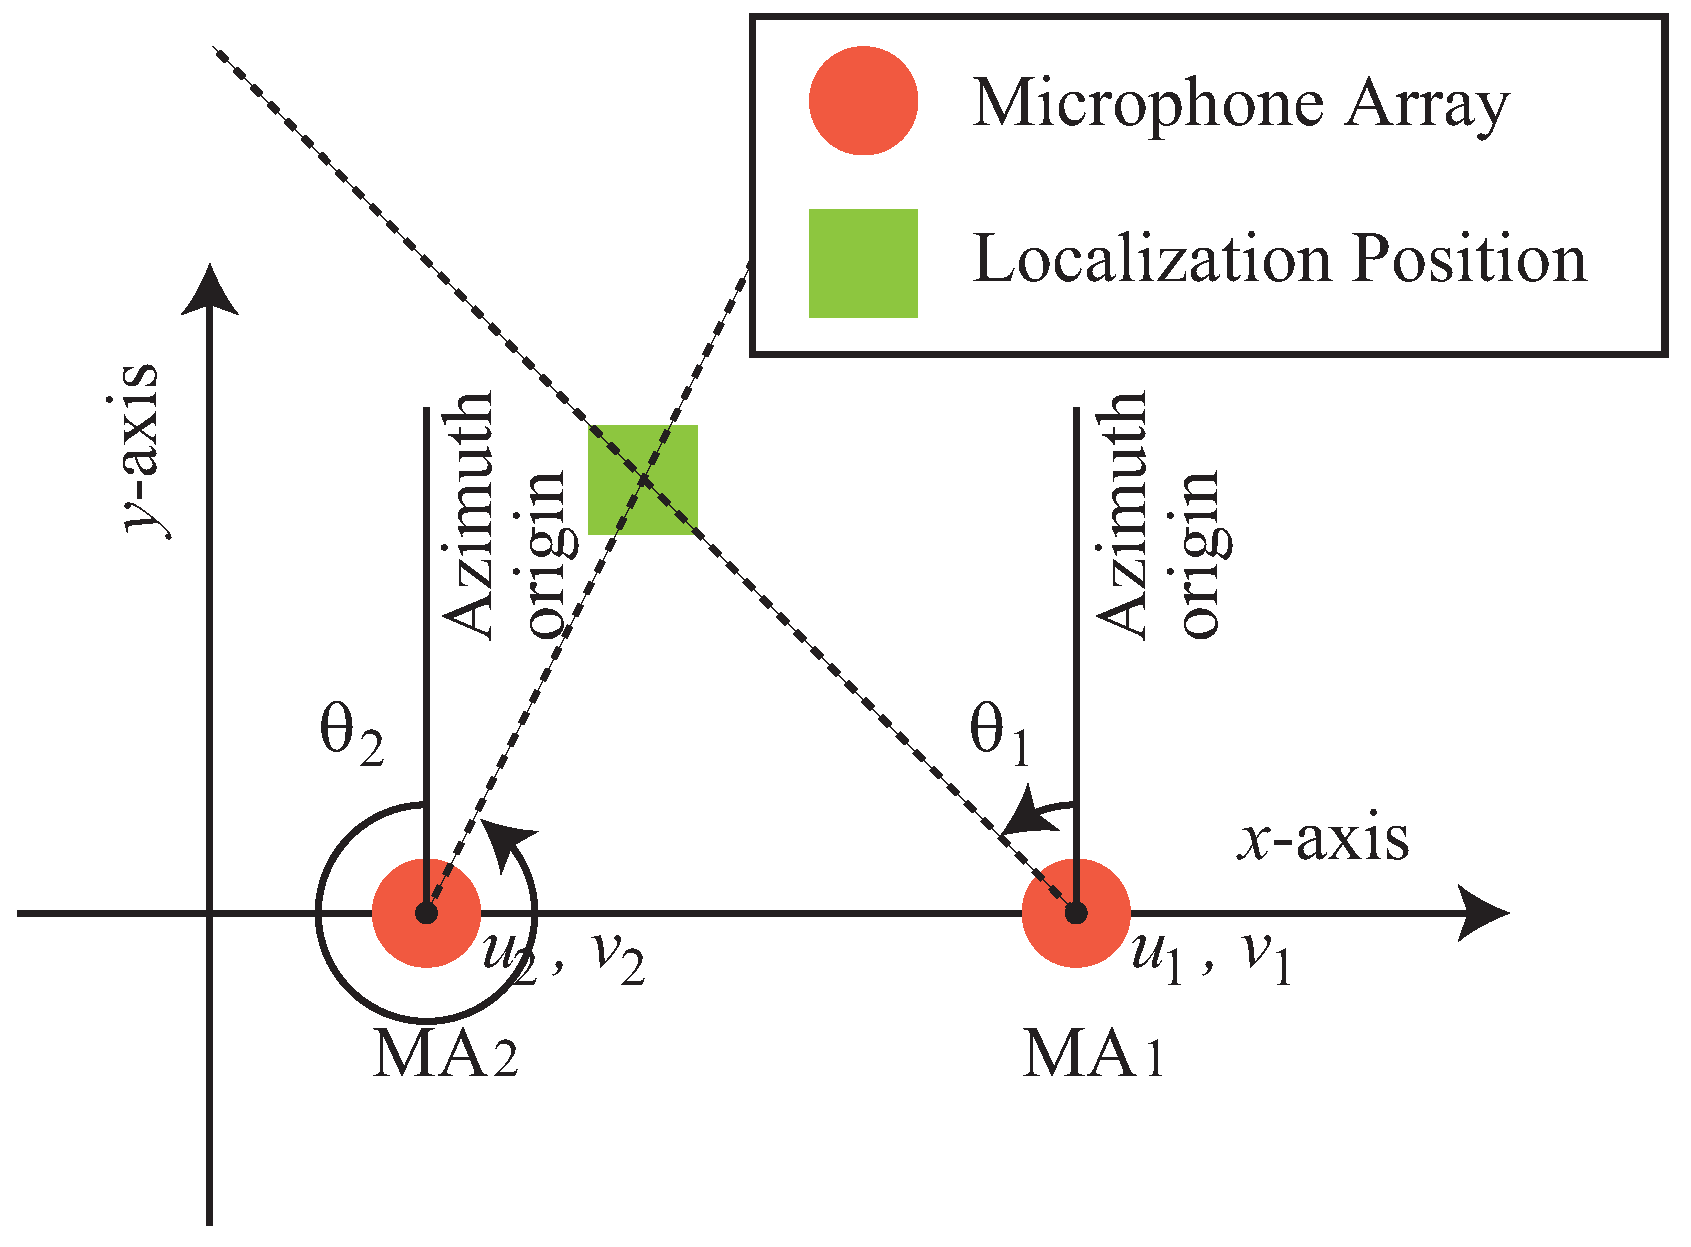
Two microphone arrays are required to localize the sound source based on the principle of triangulation. We represent the coordinates of the two 4-channel microphone arrays,
and
as
and
. In addition, we show the sound source directions estimated by these microphone arrays are
and
.
Figure 3 shows an overview of the localization of one sound source by triangulation with
and
. The two orange circle marks show microphone arrays and the yellow green rectangle mark shows the localization position of a sound source. The yellow green rectangle mark is placed at the intersection of dotted lines from two microphone arrays. These two lines show the sound source direction estimated by the microphone array. The origin of the azimuth, which represents the sound source direction, is the positive direction of the y-axis in
Figure 3. Also, the positive direction of the angle is counterclockwise.
Algorithms such as generalized cross-correlation with phase transform (GCC-PHAT) [
10], multiple signal classification (MUSIC) [
11], and steered response power (SRP) [
12] can be used for sound source direction estimation. Some methods, such as GCC-PHAT, cannot estimate multiple sound sources simultaneously. MUSIC and SRP can simultaneously estimate the directions of multiple sound sources. However, compared to SRP, MUSIC is unsuitable for our objective, which uses a large number of microphone arrays, because it consumes a large amount of computational resources. SRP collects sound by beamforming in several predetermined directions, and estimates the direction of the sound source based on the relationship between the direction and the collected sound energy. This method uses the direction of the local maximum value in the directional distribution of energy as the direction of the sound source. In the case of multiple sound sources, multiple local maxima appear.
Figure 4 shows an example of four local maxima appearing when two sound sources are observed by SRP based on the minimum variance distortionless response (MVDR) [
18,
19]. The horizontal axis shows the direction of beamforming. The vertical axis shows the output sound level of beamforming. A high output level can be obtained if the direction of the beamforming is close to the direction of the sound source. The steering step is 1 degree. Two sound sources are placed at 110 degrees and 172 degrees. Two local maxima appear at the directions corresponding to the true sound sources but the other two local maxima appear at 266 degrees and 355 degrees. Since the local maximum value of the true sound source often has a higher value, it is compatible with threshold processing to remove extra local maximum values. In this way, the direction of the sound source corresponds to the local maximum level obtained by scanning the observation space using beamforming.
4. Improved Version of Triangulation-Based Method (Conventional Method)
The sound source can be estimated based on triangulation when at least two microphone arrays are available. Since we distribute a large number of microphone arrays, it seems possible to improve the accuracy of acoustic event detection and sound source localization by triangulating with several microphone arrays. If the sound source is inside a triangle formed by three microphone arrays, stable localization is possible by triangulating with a pair of three-microphone arrays. Since sound source direction estimation involves errors, the sound source positions estimated by the three pairs of microphone arrays rarely match completely. An additional method is required to integrate these three estimation results.
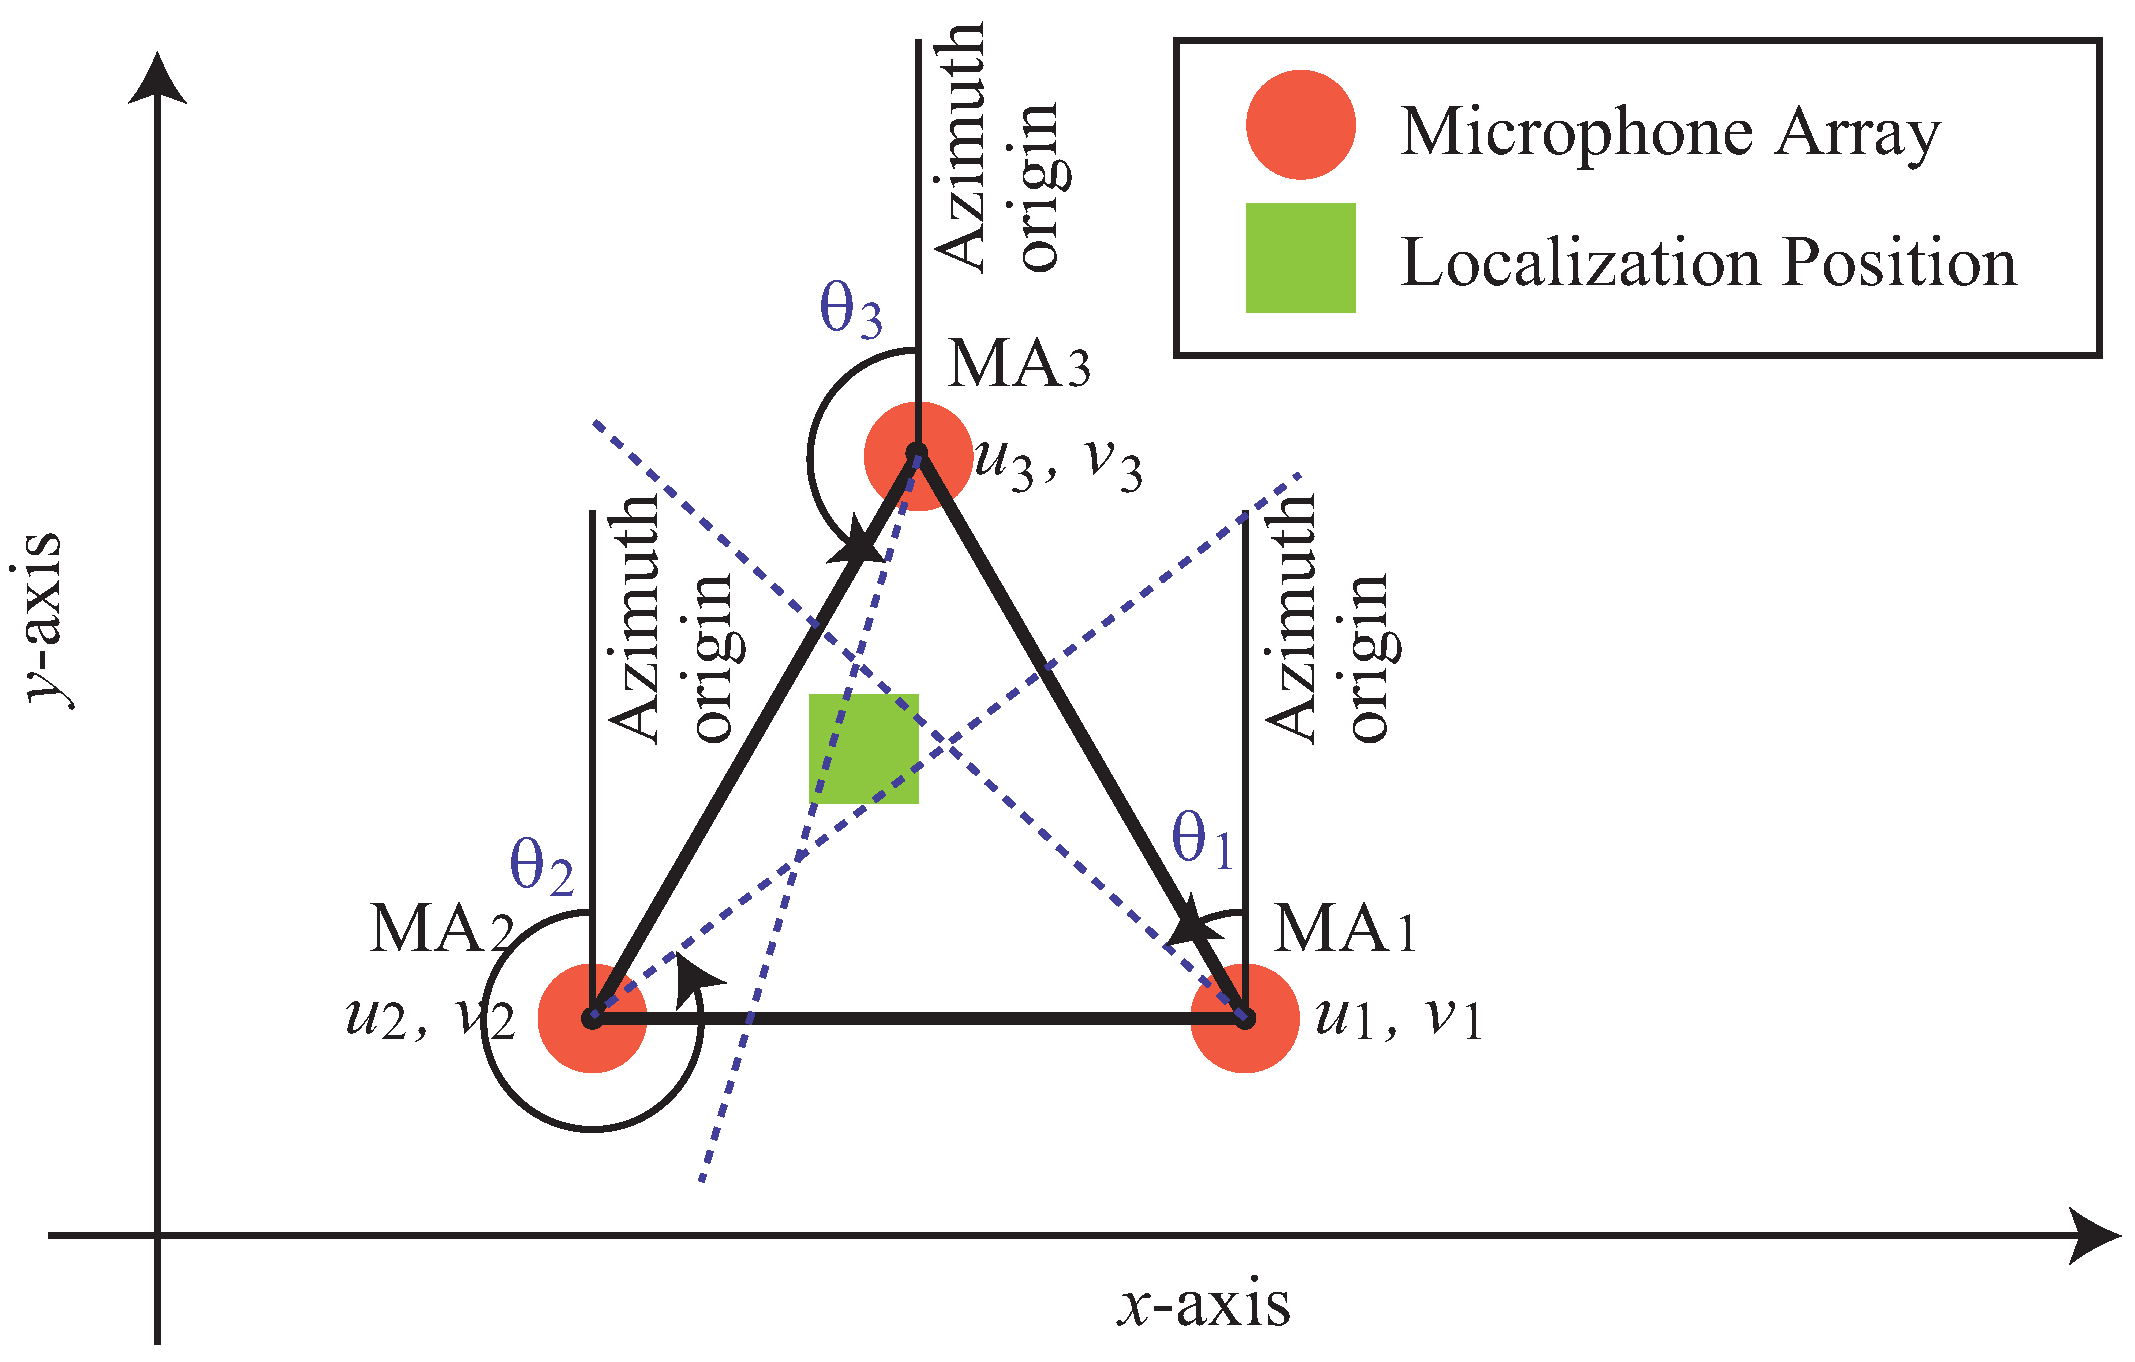
To integrate the three estimated positions, we focus on a triangle formed with the three positions as vertices. The estimation results can be integrated by setting the center of gravity of this triangle as the new estimated position. This method can be easily extended to simultaneous localization of multiple sound sources. By selecting one straight line from each microphone array and selecting a triangle whose area is smaller than a threshold () from among the triangles formed by these three straight lines, it is possible to determine the presence or absence of a sound source. We consider this method as a traditional method for triangulation-based acoustic event detection and sound source localization, and a competitor to our method proposed in this article. We call this method the conventional method.
We explain the details of the conventional method for one sound source. The three 4-channel microphone arrays (
,
) are placed at the vertices of an equilateral triangle area. In addition, we represent the sound source direction estimated by the
mth microphone array
as
.
Figure 5 shows an overview of localization of one sound source by triangulation with
,
, and
. The orange circle marks show microphone arrays and the yellow green rectangle mark shows the localization position of a sound source. The yellow green rectangle mark is placed at the center of gravity of the triangle formed by the intersections of the three dotted lines corresponding to the sound source directions estimated by the three microphone arrays. The origin of the azimuth, which represents the sound source direction, is the positive direction of the y-axis in
Figure 5. Also, the positive direction of the angle is counterclockwise.
Next, we describe the details of the conventional method for two sound sources. In the case of one sound source, only one triangle can be formed from the estimated sound source direction, but in the case of two or more sound sources, multiple triangles can be formed from the estimated sound source directions. Therefore, we need to select appropriate triangles from multiple combinations.
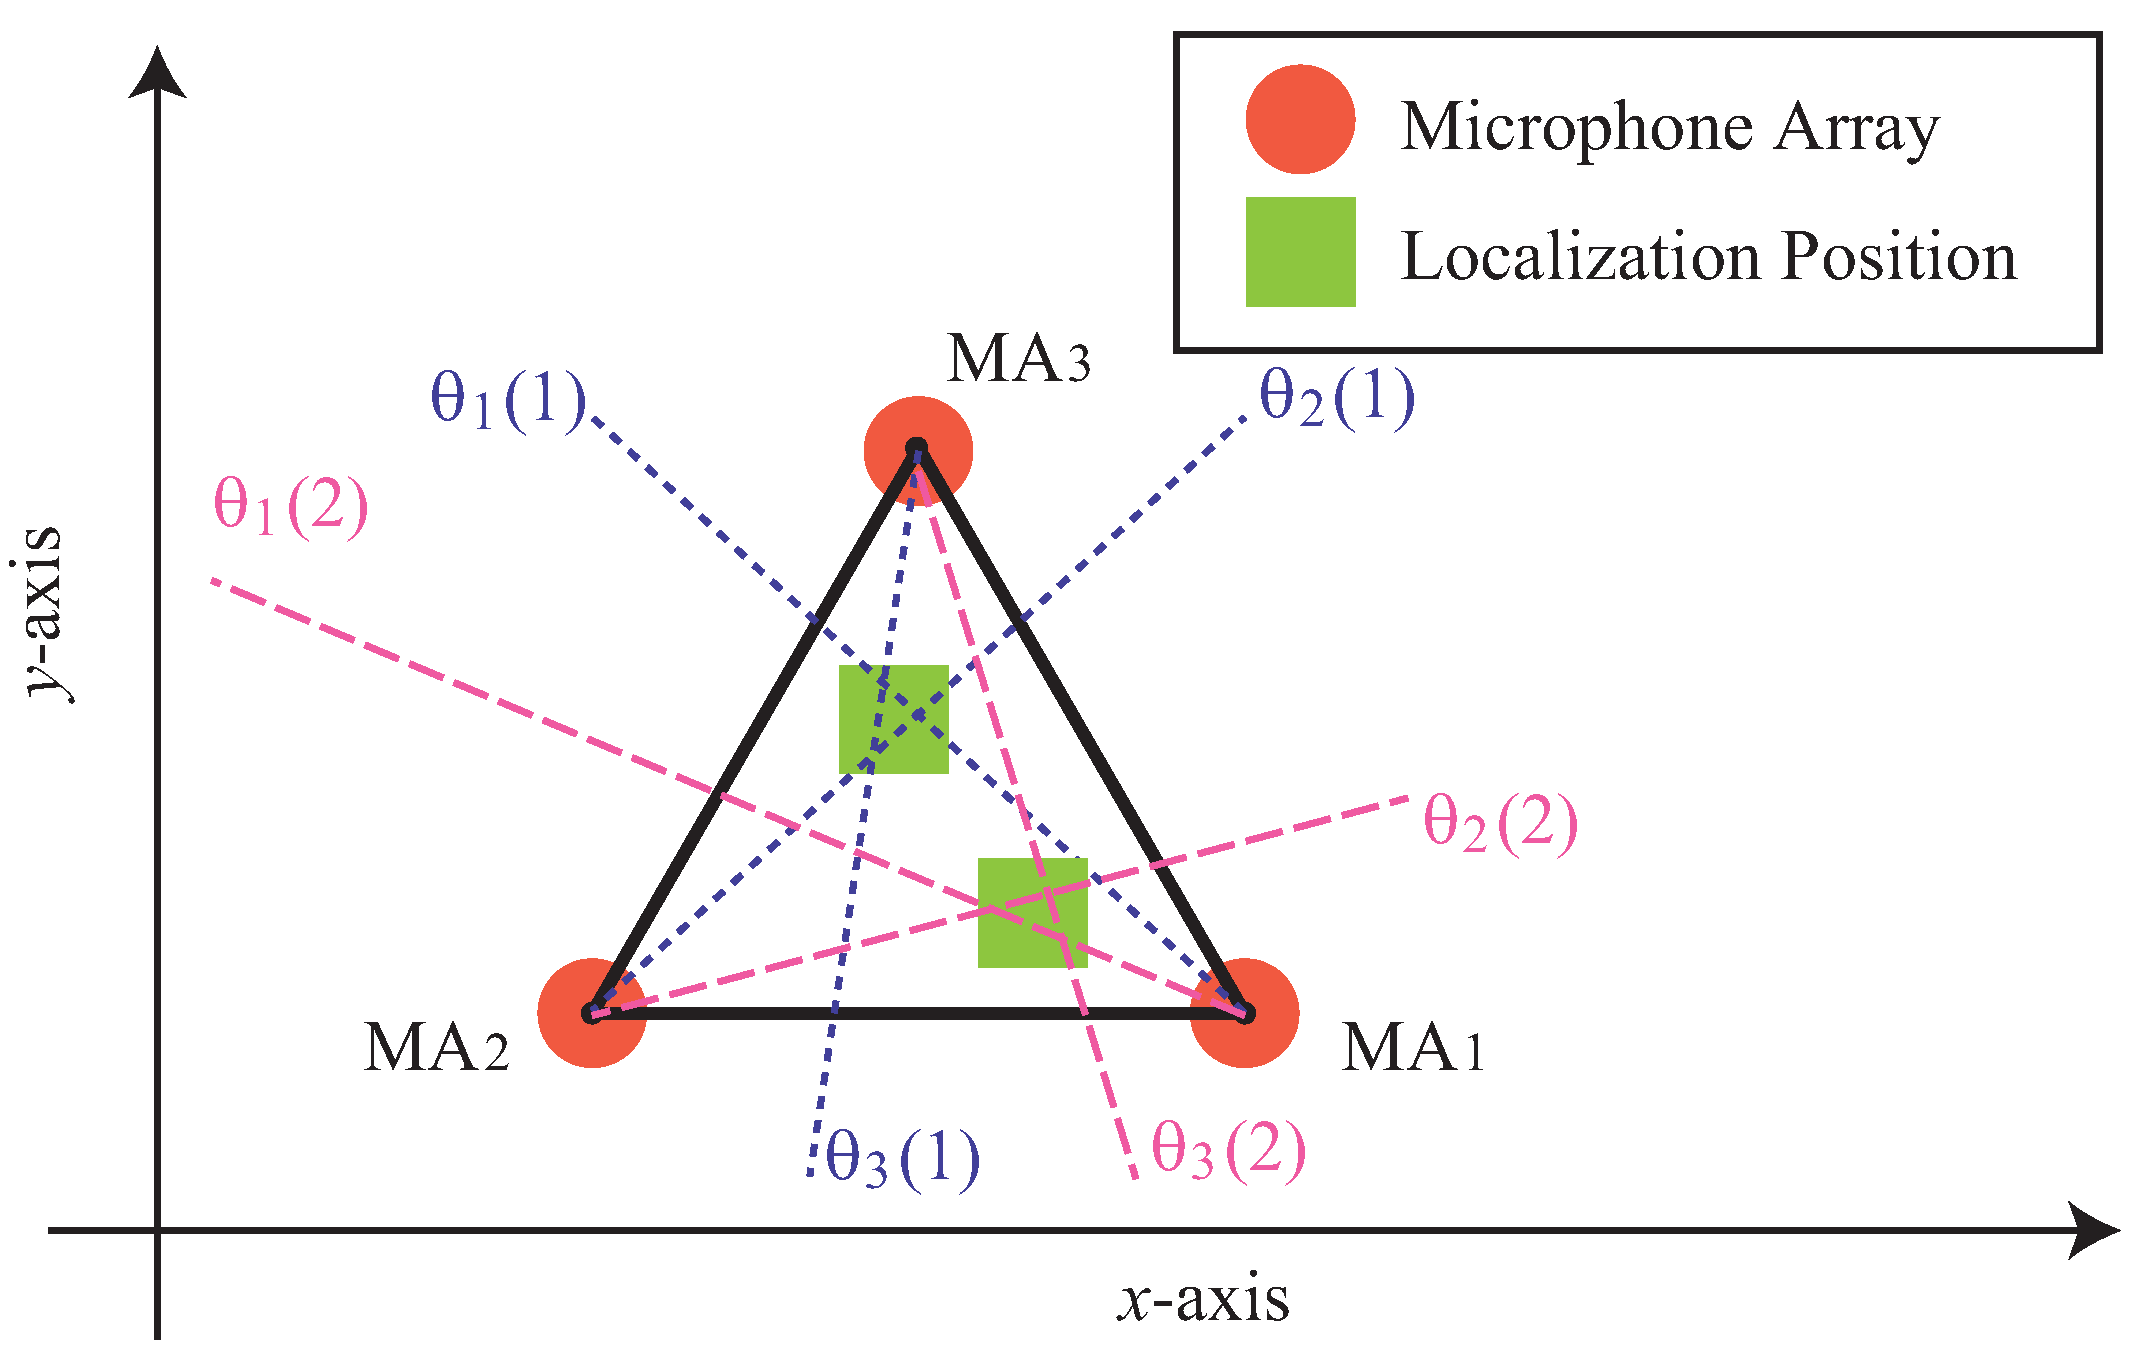
Figure 6 shows an overview of localization of two sound sources by triangulation with
,
, and
. We represent the set of sound source direction candidates estimated by the
mth microphone array
as
.
is the number of sound source direction candidates detected by the
mth microphone array
.
Figure 6 shows an example of
,
,
,
,
,
. The orange circle marks show microphone arrays and the yellow green rectangle mark shows the localization position of a sound source. The yellow green rectangle mark is placed at the center of gravity of the triangle formed by the intersections of the three dotted lines corresponding to the sound source directions estimated by the three microphone arrays. The origin of the azimuth, which represents the sound source direction, is the positive direction of the y-axis in
Figure 6. Also, the positive direction of the angle is counterclockwise. To avoid making this diagram too complicated, we have omitted the azimuth origin and curved arrows representing the angle of the sound source direction that was shown in
Figure 5. In the example, two sound source directions are estimated from each microphone. Six straight lines can be drawn according to the estimated directions. We localize the sound source by finding a combination that can form two triangles and minimize the sum of their triangle areas.
5. Spatial Energy Distribution-Based Method (Proposed Method)
The method described in the previous section has a problem in that it uses a two-step estimation framework with different criteria, which limits the performance of acoustic event detection and sound source localization. In this section, we describe a proposed method that uses a single criterion to detect acoustic events and localize sound sources without relying on two-step estimation, which is a problem with triangulation-based methods.
The proposed method calculates the energy distribution in the observation space and uses the energy distribution to detect acoustic events and localize sound sources. This method assumes that an acoustic event occurs at the local maximum positions of the energy distribution, and estimates these positions as the sound source positions. Since the distributed microphone array is sparsely arranged in the observation space, it is not possible to directly measure any point in the observation space. Therefore, the problem to be solved by this method is formulated as the problem of estimating the energy distribution from the observed signals obtained from a distributed microphone array. The proposed method can be applied to one or more microphone arrays, but from the perspective of the application shown in
Figure 1, we describe the procedure for estimating the spatial energy distribution using seven microphone arrays as an example.
We describe the logical processing scheme of the proposed method. If we can determine the spatial energy distribution in the observation space, we can know where the sound source is located in the observation space. This is because an acoustic event occurs from a certain position, and the acoustic energy is diffused and attenuated from there, so the problem of sound source localization boils down to the problem of finding the local maximum positions for a given distribution. We focused on dividing the observation space into small areas and finding the energy of each area. To obtain the energy distribution, we discretize the observation space. Although the spatial distribution is discrete, sound source localization can be achieved by making sufficiently fine divisions and checking which divided region has the maximum energy. Instead of directly measuring the energy of the divided small area, we propose a method for estimating its energy as the sum of the energy beam formed by several microphone arrays near the small area. This method consists of the following five steps:
- Step 1:
Perform the following procedure using all microphone arrays (for m = 0, 1, 2, 3, 4, 5, 6)
For all reference points (), calculate the energy of the output sound beamformed to the reference point by the microphone array .
- Step 2:
Determine the contribution weights of microphone arrays for the energy estimation of reference point .
- Step 3:
Calculate the estimated energy
of reference point
by
- Step 4:
Find the local maximum points of regarding .
- Step 5:
Output the local maximum point found in the step 4 as the position where the acoustic event occurred.
The microphone array is written as
,
, and the position of
on the
-plane is written as
.
where
R = 1.5 m.
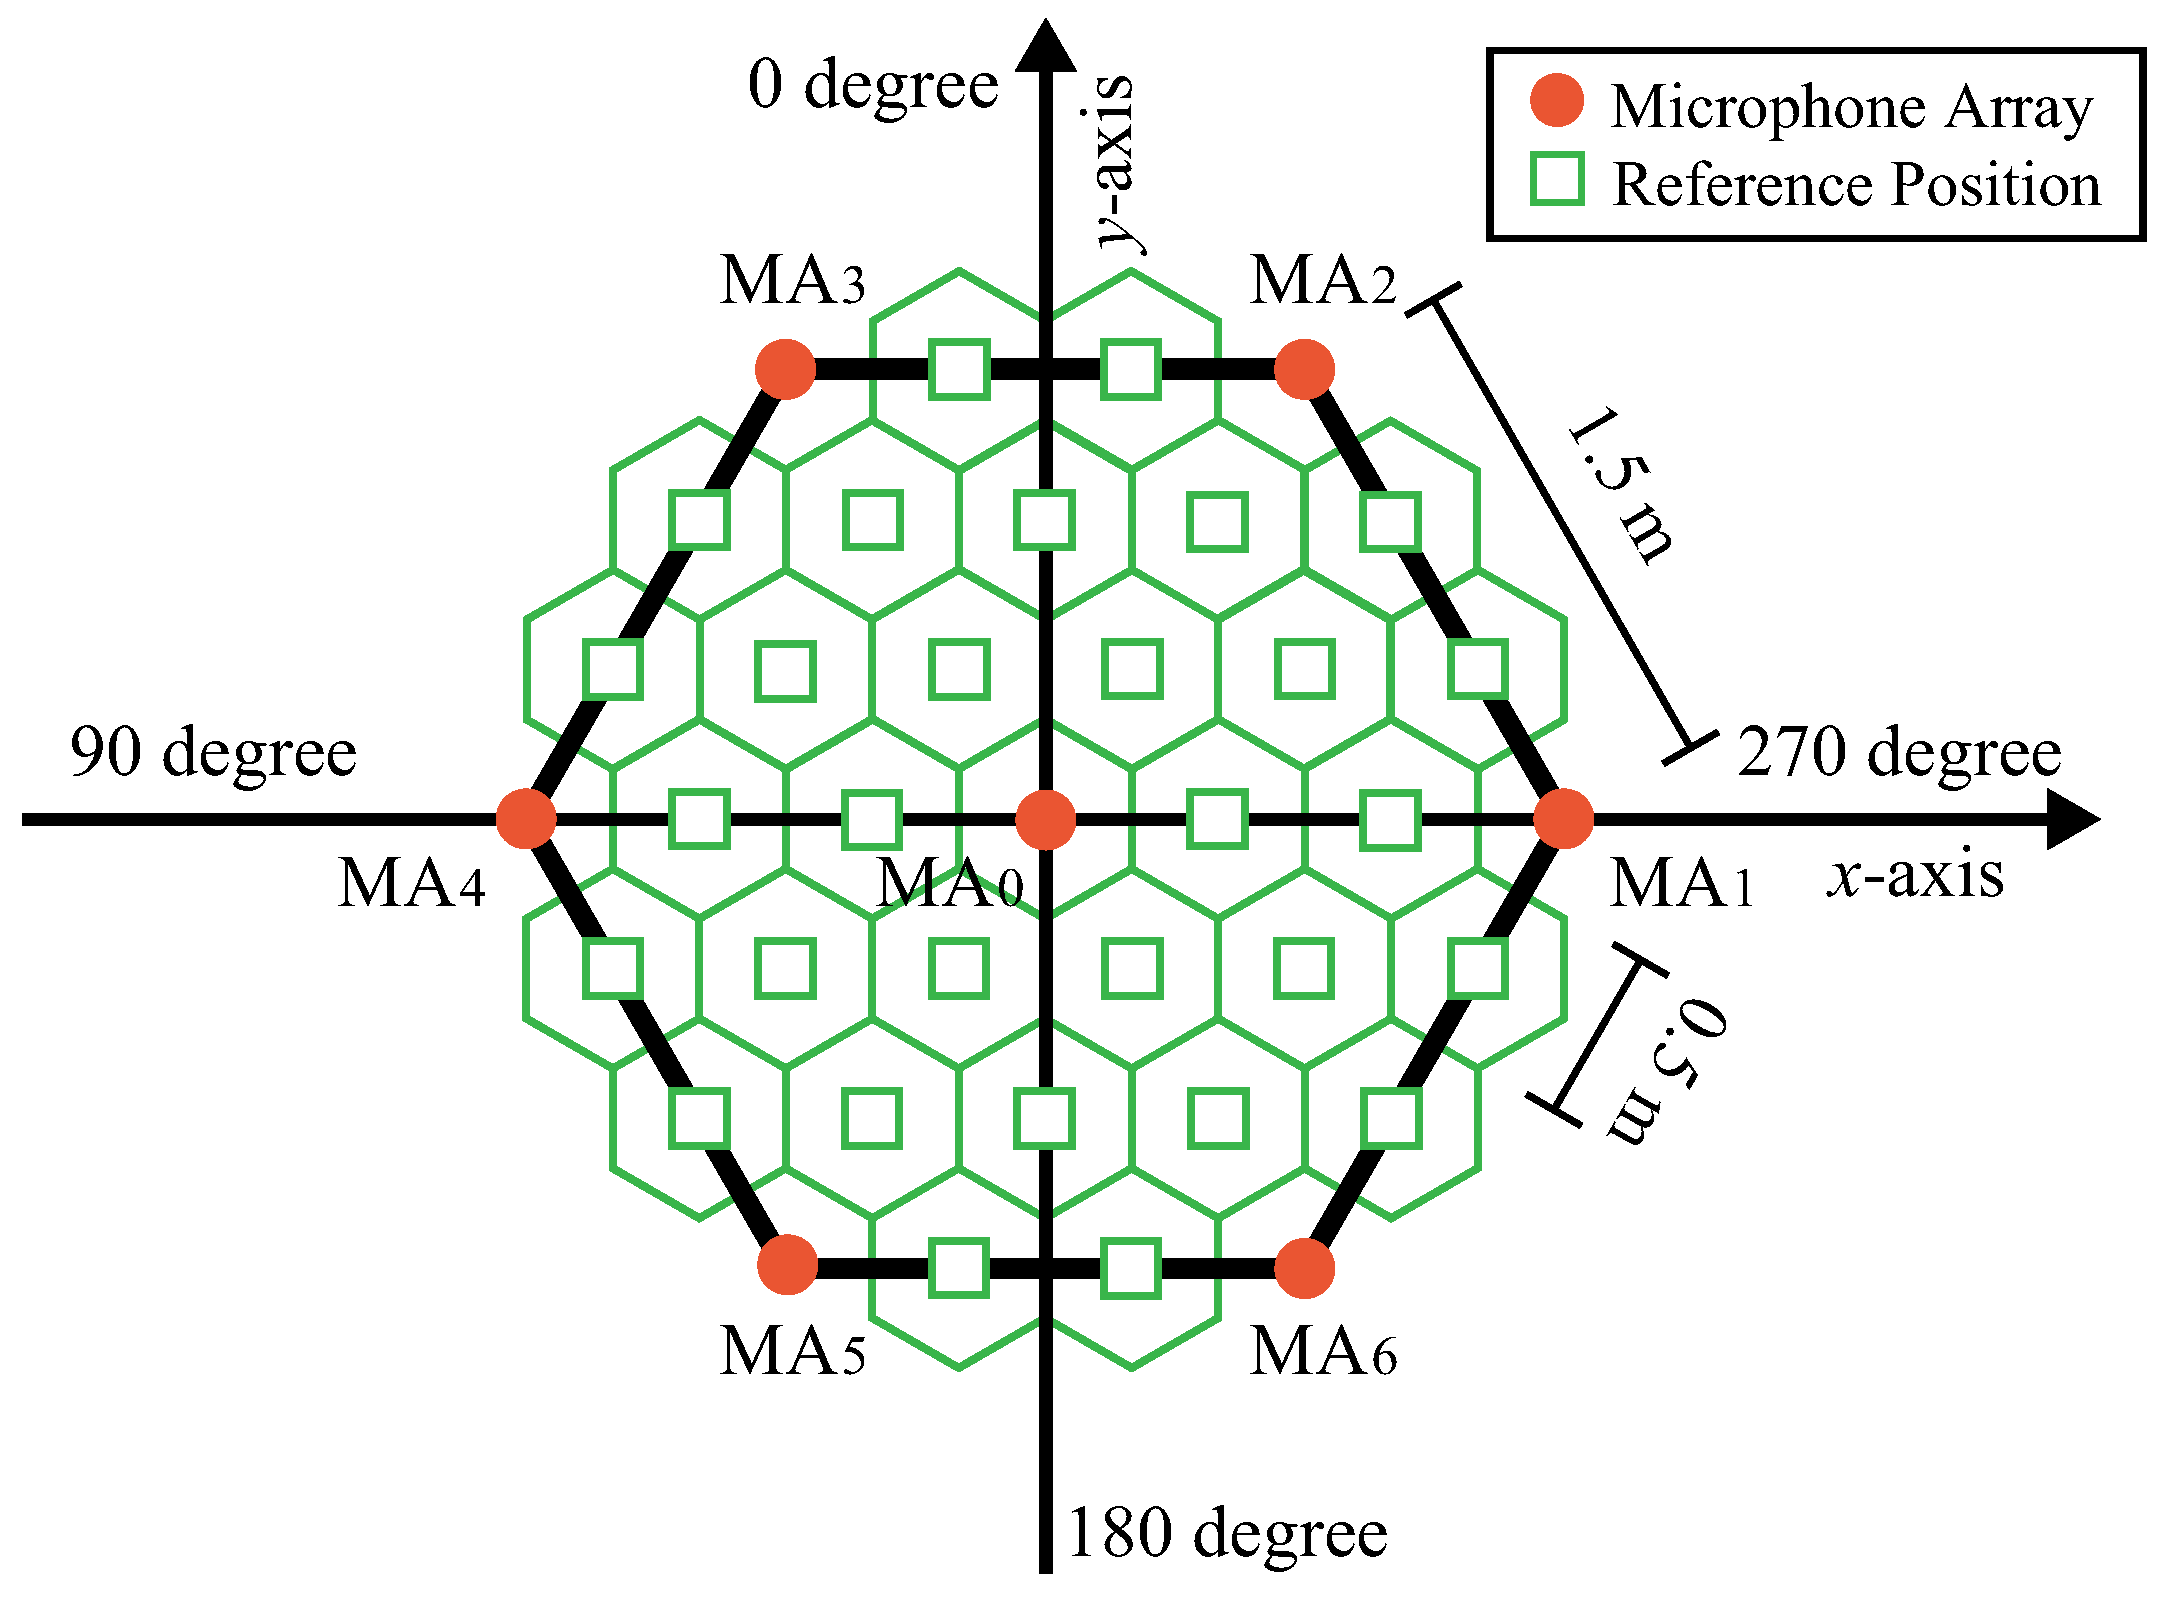
Figure 7 shows the arrangement of the microphone array and the position where the energy is estimated to assess the spatial energy distribution. Since it is not possible to estimate the energy distribution in a continuous space, the positions at which the energy is estimated are discretized into 37 positions. The energy distribution in this space is represented using 30 positions, excluding the 7 positions where the microphone array is placed. We call these 30 positions reference positions (
). The orange circle marks show microphone arrays, and the green square marks show reference positions. A regular hexagon is made by connecting the
. The inside of this regular hexagon is the observation space.
If the energy of each reference position can be estimated, the energy distribution in the observation space can be estimated. The method for estimating the energy of each reference position is described later.
Figure 8 shows an example of the spatial distribution of energy estimated from 30 reference positions. The energy distribution inside the regular hexagon in
Figure 7 is represented by grayscale shading. The closer the color is to black, the higher the energy, and the closer it is to white, the lower the energy. The small regular hexagonal area with a red frame in
Figure 8 shows the two positions of the local maximum values.
In this method, the spatial resolution of sound source localization is determined by how densely the reference positions are placed inside a regular hexagon. In this study, we considered the area occupied by each adult when determining the distance between adjacent reference positions. The two talkers are assumed to be at least 0.5 m apart. Therefore, the reference position is the point that divides the regular hexagonal area into equilateral triangular areas with each side of 0.5 m, as shown in
Figure 7.
We describe how to estimate the energy of each reference position. The estimated energy
of the reference position
is defined as the following equation:
where
is the beamforming direction from the microphone array
to the reference position
, and
represents the amount of energy contribution of position
obtained by
.
has the meaning of weight, and is
. Also,
is the average energy per sample of the beamforming output waveform
when the beam is directed in the
direction by
, where
t is the time index and
T is the sample length of the observed signal. In our experiment, the minimum variance distortionless response (MVDR) [
18,
19] is used for beamforming. A bandpass filter (1600 Hz–2500 Hz) is applied to the output waveform of beamforming by MVDR. This is because beamforming has low spatial resolution in the low-frequency range, and the effect of spatial aliasing is large in the high-frequency range.
We describe the MVDR filter. We represent the four channel observed signal at time
t as
, where
T is a vector transpose. And the frame length is
N and the frame shift length is
S. The observed signal is represented in the frequency domain at
f-frame as
Then, the MVDR filter coefficient
with its beam toward
for frequency bin
k is defined as
where
is the steering vector of a micropohne array,
, and
H is a Hermitian transpose. Since we cannot obtain this expected value, we introduce the following approximation:
where
L is empirically determined. In our experiment
. The output signal of the MVDR filter with beam direction
is given as
There are implementation variations in the proposed method depending on how the weight
is given. Since Yang et al. [
21] succeeded in improving the accuracy of multiple sound source localization based on a Bayesian framework with time-delay of arrival (TDOA) by focusing on microphone arrays close to the sound source, we also propose weighting that preferentially uses microphones close to the sound source. For example, when estimating
from three microphone arrays near the sound source, set
to 1 for
m of the three microphone array numbers near
, and set
to 0 for the others. We propose a generalized method. We formulate the method of estimating
from
p microphone arrays in the neighborhood of
as the
p-Neighbor method as follows:
where a set
is the set of the top
p-elements from the index sequence when the Euclidean distances
s between
and
are sorted in ascending order after computing the Euclidean distance
for
.
The Neighbor method selects microphone array numbers that have a weight of 1.0 based on their proximity to the reference position
. Çakmak et al. [
22] showed that selecting the microphone pair near the sound source leads to improved estimation accuracy as a method for selecting the optimal microphone pair for TDOA estimation from 23 synchronous microphones distributed in a conference room. We thought that this method could also be used to select between asynchronous microphone arrays. This selection method is suitable when the sound source is an omnidirectional sound source, such as a point source. However, sound sources are not always omnidirectional. For example, the radiation characteristics of human speech are known to be non-directional in the low-frequency range, but directional in the high-frequency range [
23]. Since talkers and loudspeakers are directional sound sources, if microphone arrays are selected based on their proximity to the reference position
, there is a risk of inappropriately selecting a microphone array located in a low radiational direction. When such a microphone array is selected, the value of
is small to begin with, and its contribution to
is small regardless of the weight
. We believe that it is easier to estimate the shape of the spatial energy distribution if microphone arrays with small contributions are not selected.
We also propose a method to estimate
from the top
p microphone arrays that are sorted in descending order of
. This method preferentially selects microphone arrays that observe higher energy when beamformed to
. We call this method the
p-Energy method and formulate it as follows:
where a set
is the set of the top
p-elements from the index sequence when the observed energy
s beamforming toward
is sorted in descending order after computing the beamforming energy
for
.
Threshold processing can be applied to the p-Neighbor method and p-Energy method. When takes a local maximum value inside a regular hexagon and , we estimate that the sound source is placed at position . However, the determination of the threshold is often empirical. When the threshold is 0, the number of false detections of acoustic events is maximum. Increasing the threshold can reduce the number of false detections. However, at the same time, the number of positive detections also decreases. Furthermore, acoustic events, that could not be detected when the threshold is 0, are still not detected even if the threshold is changed. To newly detect such acoustic events, improving the estimation accuracy of spatial energy distribution is necessary.
6. Experiment
We evaluate the number of acoustic event detections and sound source localization errors by each method in this section. First, we describe an evaluation experiment in which a single directional sound exists. Then, we describe an evaluation experiment in which two directional sound sources exist.
The performance of acoustic event detection is generally evaluated by the number of correctly detected acoustic events in the evaluation dataset and the number of incorrectly detected acoustic events when no acoustic events exist. In addition, sound source localization performance is generally evaluated based on the distance difference between the estimated sound source position and the true sound source position in the evaluation dataset. It is not appropriate to directly apply these evaluation methods to a method that simultaneously evaluates acoustic event detection and sound source localization, so they are often used in combination for evaluation. Once the acoustic event detection process is performed, the sound source position of the detected sound source is estimated, and if the distance difference between the estimated position and the true sound source position is less than or equal to a certain value (), the acoustic event is considered to have been detected correctly. In other cases, it is considered not to have been detected. It is commonly evaluated by the correct rate based on the number of acoustic events for the evaluation dataset. However, this evaluation has a problem in that it focuses on the performance of acoustic event detection. The problem is that the only evaluation indicator is that the localization error of the detected sound source is less than . Furthermore, is determined empirically. Therefore, we evaluate the number of correctly detected acoustic events for all . By extending the representation without changing the evaluation criteria from the common criteria, we can visualize the impact on the correct detection rate caused by increasing the acceptable localization error () to increase the number of correctly detected acoustic events. The specific visualization procedure is to find the localization errors of all detected acoustic events and the cumulative distribution of these localization errors. Next, the cumulative distribution is plotted with the horizontal axis representing the error and the vertical axis representing the cumulative number of correctly detected acoustic events within the given localization error. The horizontal axis represents the acceptable localization error . In the following evaluation, the upper limit of the vertical axis is the number of acoustic events included in the evaluation dataset; so, the upper, middle, and lower ends of the vertical axis correspond to the correct detection rate of , , and , respectively.
6.1. Localization Experiment for One Sound Source
Figure 9 shows the arrangement of the microphone arrays and the positions of the evaluation sound source. The orange circle marks show microphone arrays and the blue rectangle marks (23 positions) show sound source positions for evaluation. At the sound source position, a loudspeaker is installed facing each direction of
and 315 degrees, and we evaluate 184 conditions (
).
The sound reproduced from the sound source at these positions was localized using the four-channel signal observed by the microphone array. Instead of evaluating the sound produced by actually reproducing the sound source signal from a loudspeaker at each position, we evaluated the sound obtained by convolving the sound source signal with the impulse response of each condition. The phonetically balanced sentences uttered by one male and one female from Japanese Newspaper Article Sentences (JNAS) [
24] were used as the sound source signals, where the different sentences were used between a male and a female. These impulse responses were measured in advance from each position to each microphone array (i.e., these filenames are ‘bm001a01.hs.raw’ and ‘bf001i01.hs.raw’). A time-stretched pulse (TSP) [
25] signal with a sample length of 16,384 was used to measure the impulse response. To measure the impulse response, we applied time synchronization processing 16 times to improve the signal-to-noise ratio (SNR). The Seeed Studio ReSpeaker USB Mic Array v2.0 (ReSpeaker) [
20] was used for AD/DA conversion. Playback was performed through powered speakers (Genelec 8020DPM-1) connected to the stereo output of the ReSpeaker via an unbalanced-to-balanced converter (TASCAM LA-80MK2). The recording was performed using the ReSpeaker’s onboard MEMS 4-channel microphone synchronized with the playback. The TSP playback was performed only on the left channel. The sampling rate for recording and playback was 16,000 Hz, and the number of quantization bits was
.
Figure 10 shows the situation during TSP recording.
As shown in the system overview in
Figure 1, the microphone array was installed near the ceiling during system operation. To avoid deterioration of the sound source localization accuracy due to reflection from the ceiling, the microphone array was installed at a distance of about 0.5 m from the ceiling surface. The height of the ceiling of room 15806 was 2.5 m; so, assuming that the height of the lips of a person standing in the room is 1.5 m, the suitable height for the microphone array is 2.0 m from the floor. We considered the floor as the ceiling and measured the impulse response by placing a microphone array at a height of 0.5 m and a loudspeaker at a height of 1.0 m from the floor.
The impulse response was measured at Osaka Sangyo University, Building 15, Laboratory 806 (Room number 15806).
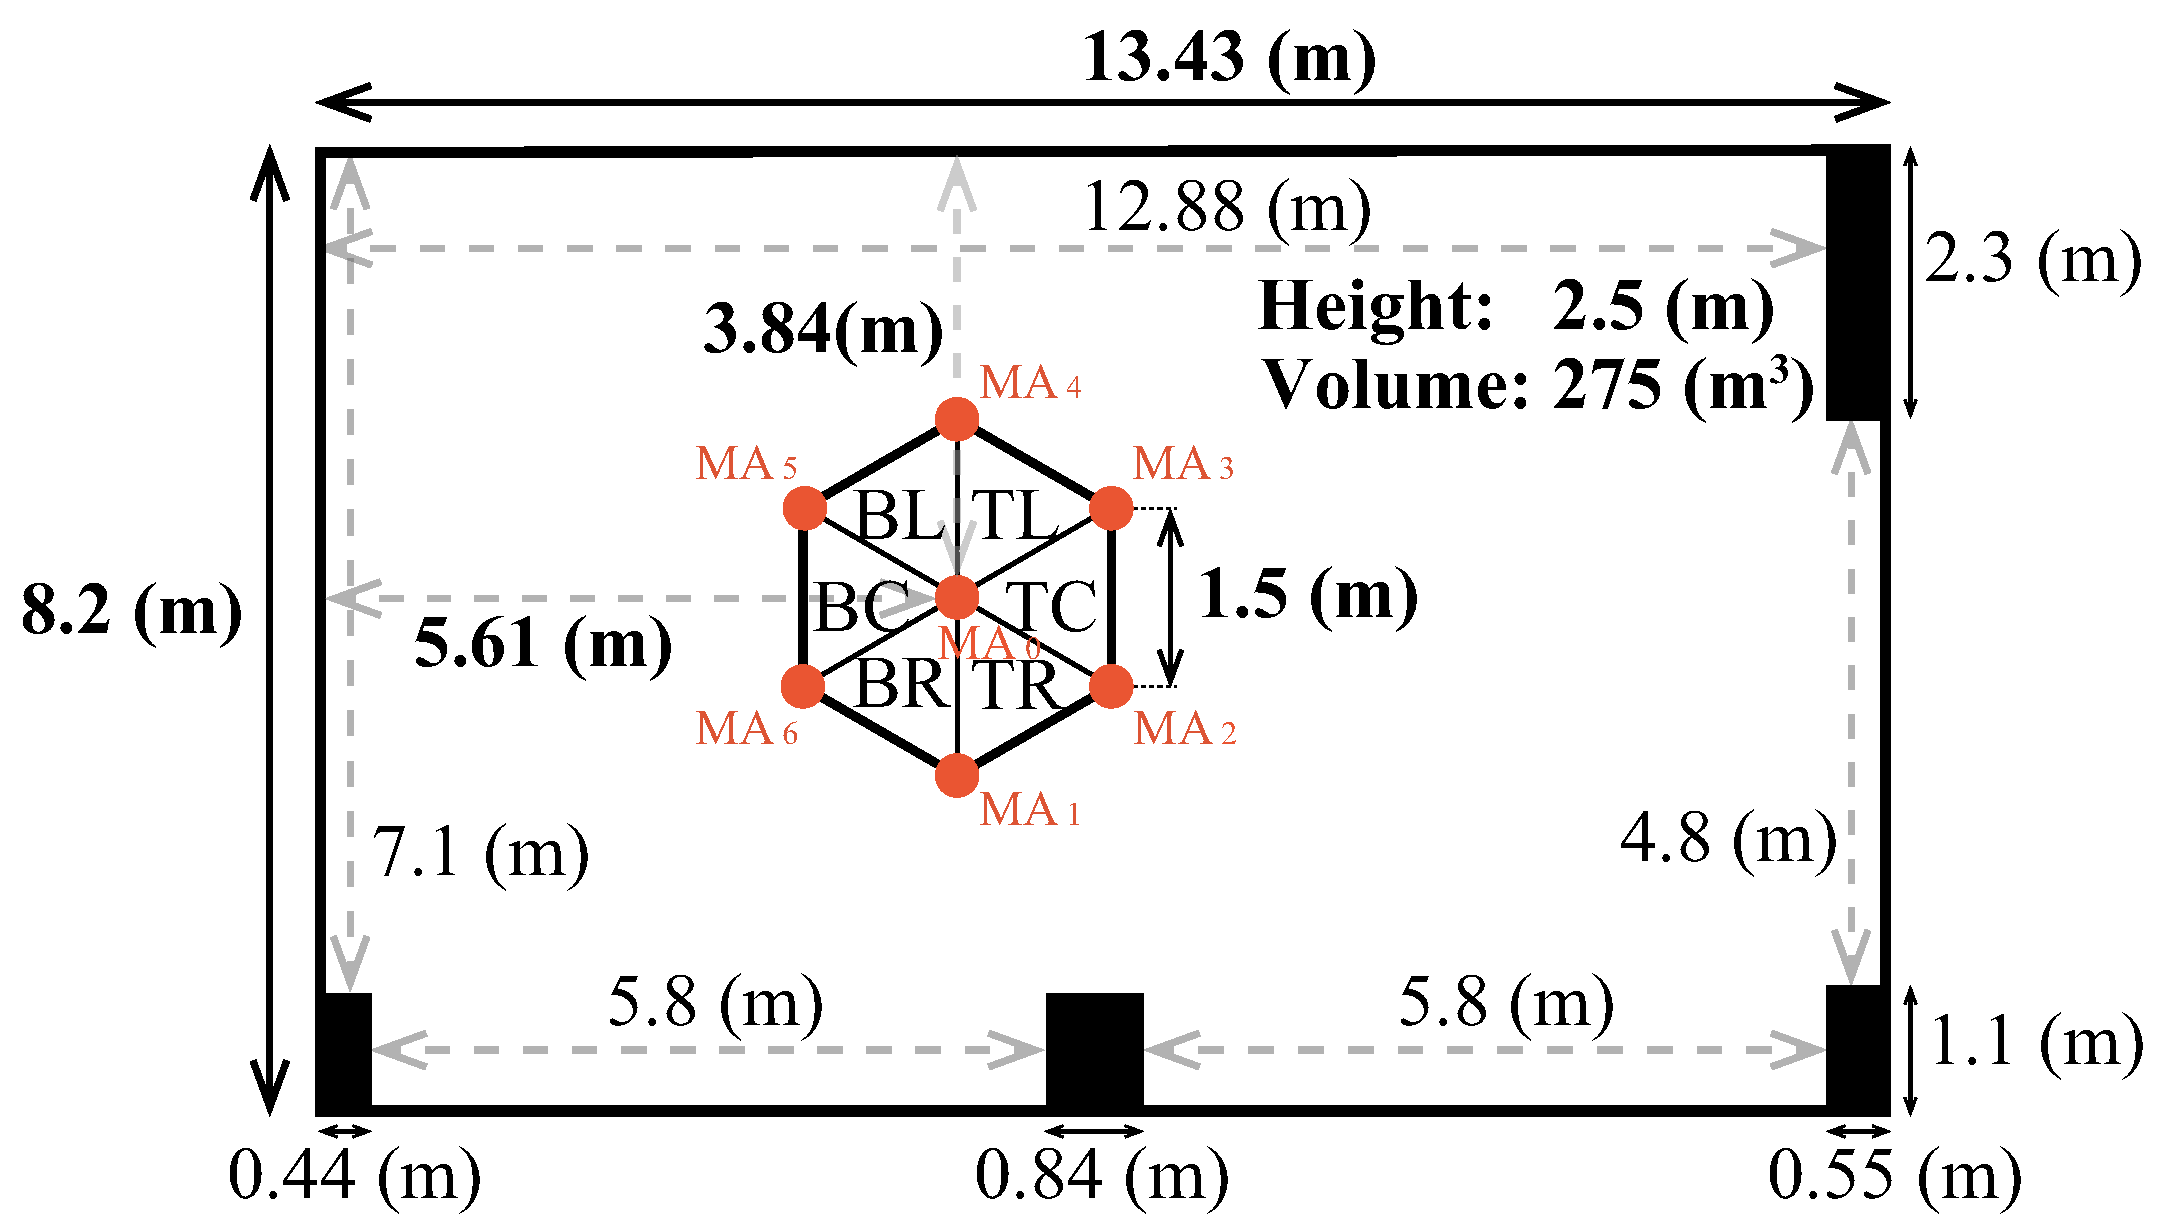
Figure 11 shows the regular hexagonal area containing the measurement positions in the room superimposed on the bird’s eye view of 15806. The background noise level in room 15806 was approximately
, and the reverberation time was approximately
. The output level of the speech signal for evaluation was adjusted to be equivalent to
to 70 dB, which is the average Japanese conversation level.
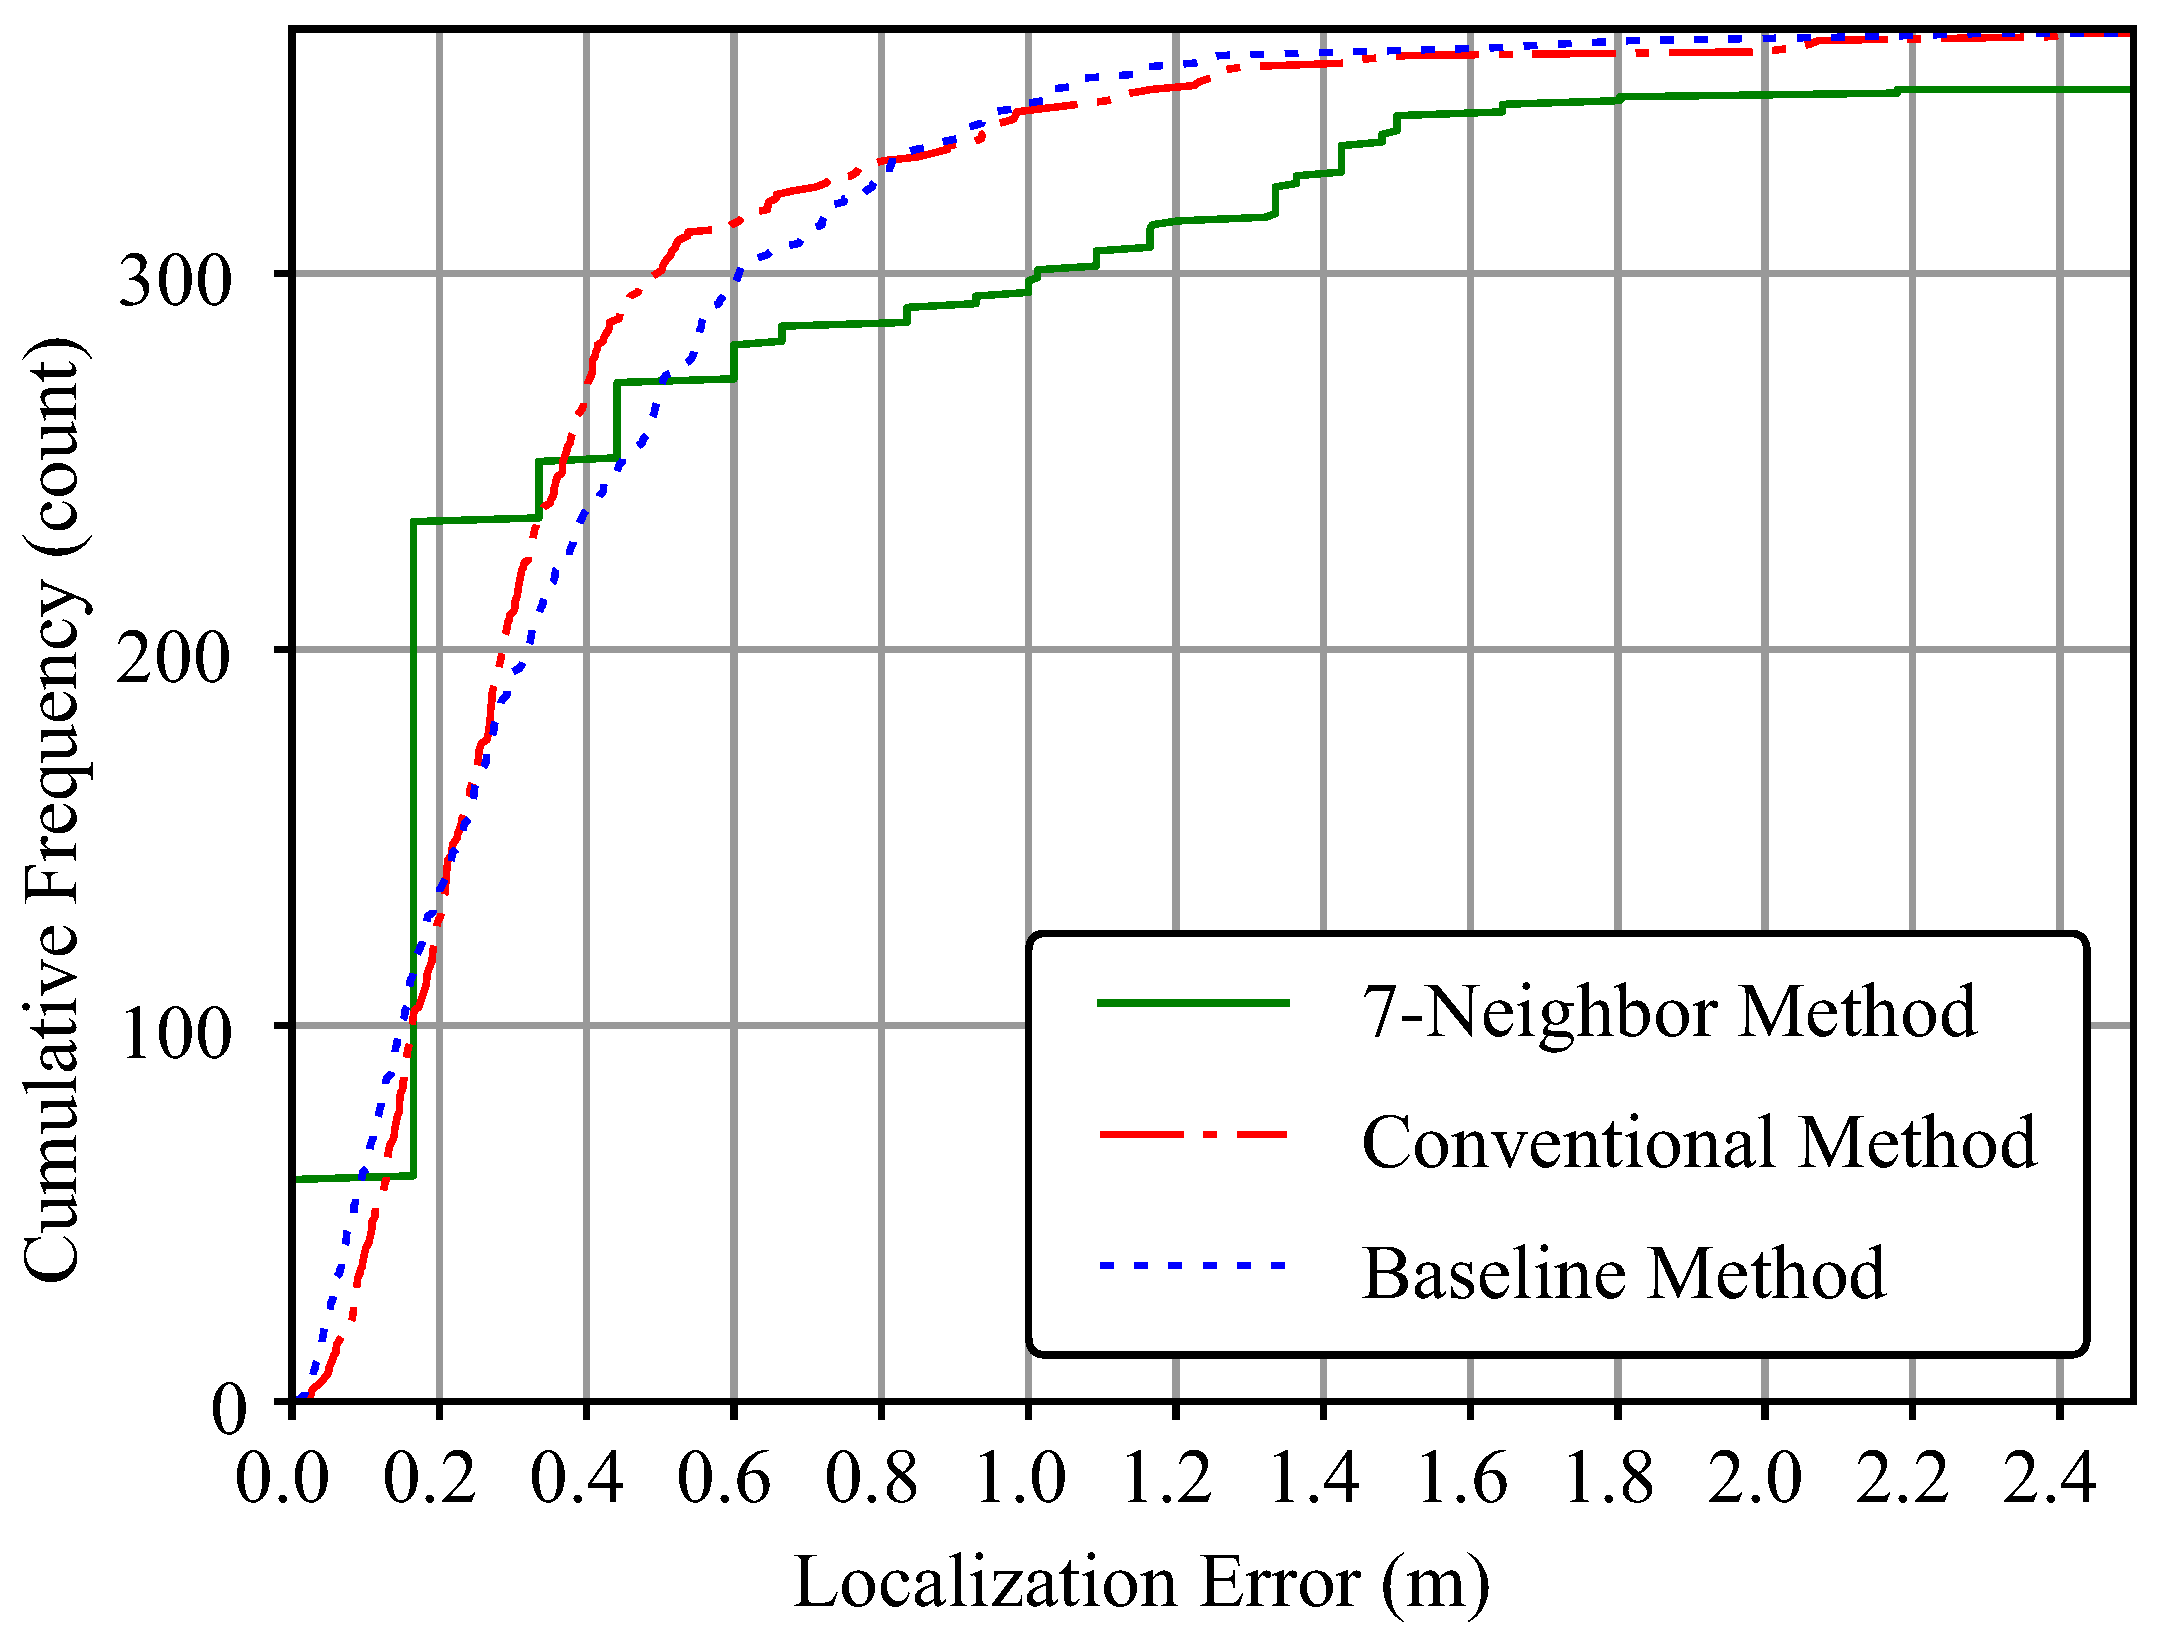
Figure 12 shows the cumulative distribution of localization errors obtained from the sound source localization results for the evaluation dataset. As the horizontal axis is considered an acceptable error in sound source localization, the vertical axis corresponds to the number of acoustic events that could be localized within the acceptable error. Since the total number of acoustic events evaluated is 368 (=
), dividing the value on the vertical axis by 368 can be regarded as the acoustic event detection rate.
The cumulative error distribution of the proposed method has a stepped graph shape. This is because the proposed method localizes based on processing that discretizes the observation space. This is also because the positions output as estimation results are also discretized. If the reference positions are arranged more densely, the result will be a finer step-like pattern than this. Although the number of acoustic events detected over 0.5 m is slightly lower than that of the baseline method and the conventional method, a similar trend appears.
This graph shows that the baseline method detects more acoustic events than the conventional method when the acceptable error is between 0.0 m and 0.2 m and over 0.8 m. However, in the vicinity of a practically important acceptable error of 0.5 m, the conventional method (under the condition: threshold and setting the centroid of the triangle with the smallest area as the estimated position) detects more acoustic events. It can be confirmed that these methods have roughly equivalent performance. Therefore, as a representative sound source localization method based on triangulation, we choose the conventional method, which can be applied to two sound sources, instead of the baseline method, which can only be applied to one sound source.
6.2. Localization Experiment for Two Sound Sources
In this subsection, we compare the conventional method and the proposed methods based on the spatial energy distribution (
p-Neighbor method and
p-Energy method). We placed two directional sound sources within a hexagon and conducted an experiment to compare the performance of acoustic event detection and sound source localization. Two sound source signals were generated in the same way as in the previous section, using one phonetically balanced sentence from one male and one female in JNAS [
24]. Then, the evaluation sound was generated by mixing the two sound source signals. In this experiment, two sound sources existed at the same time; so, the first sound source was male speech and the second sound source was female speech.
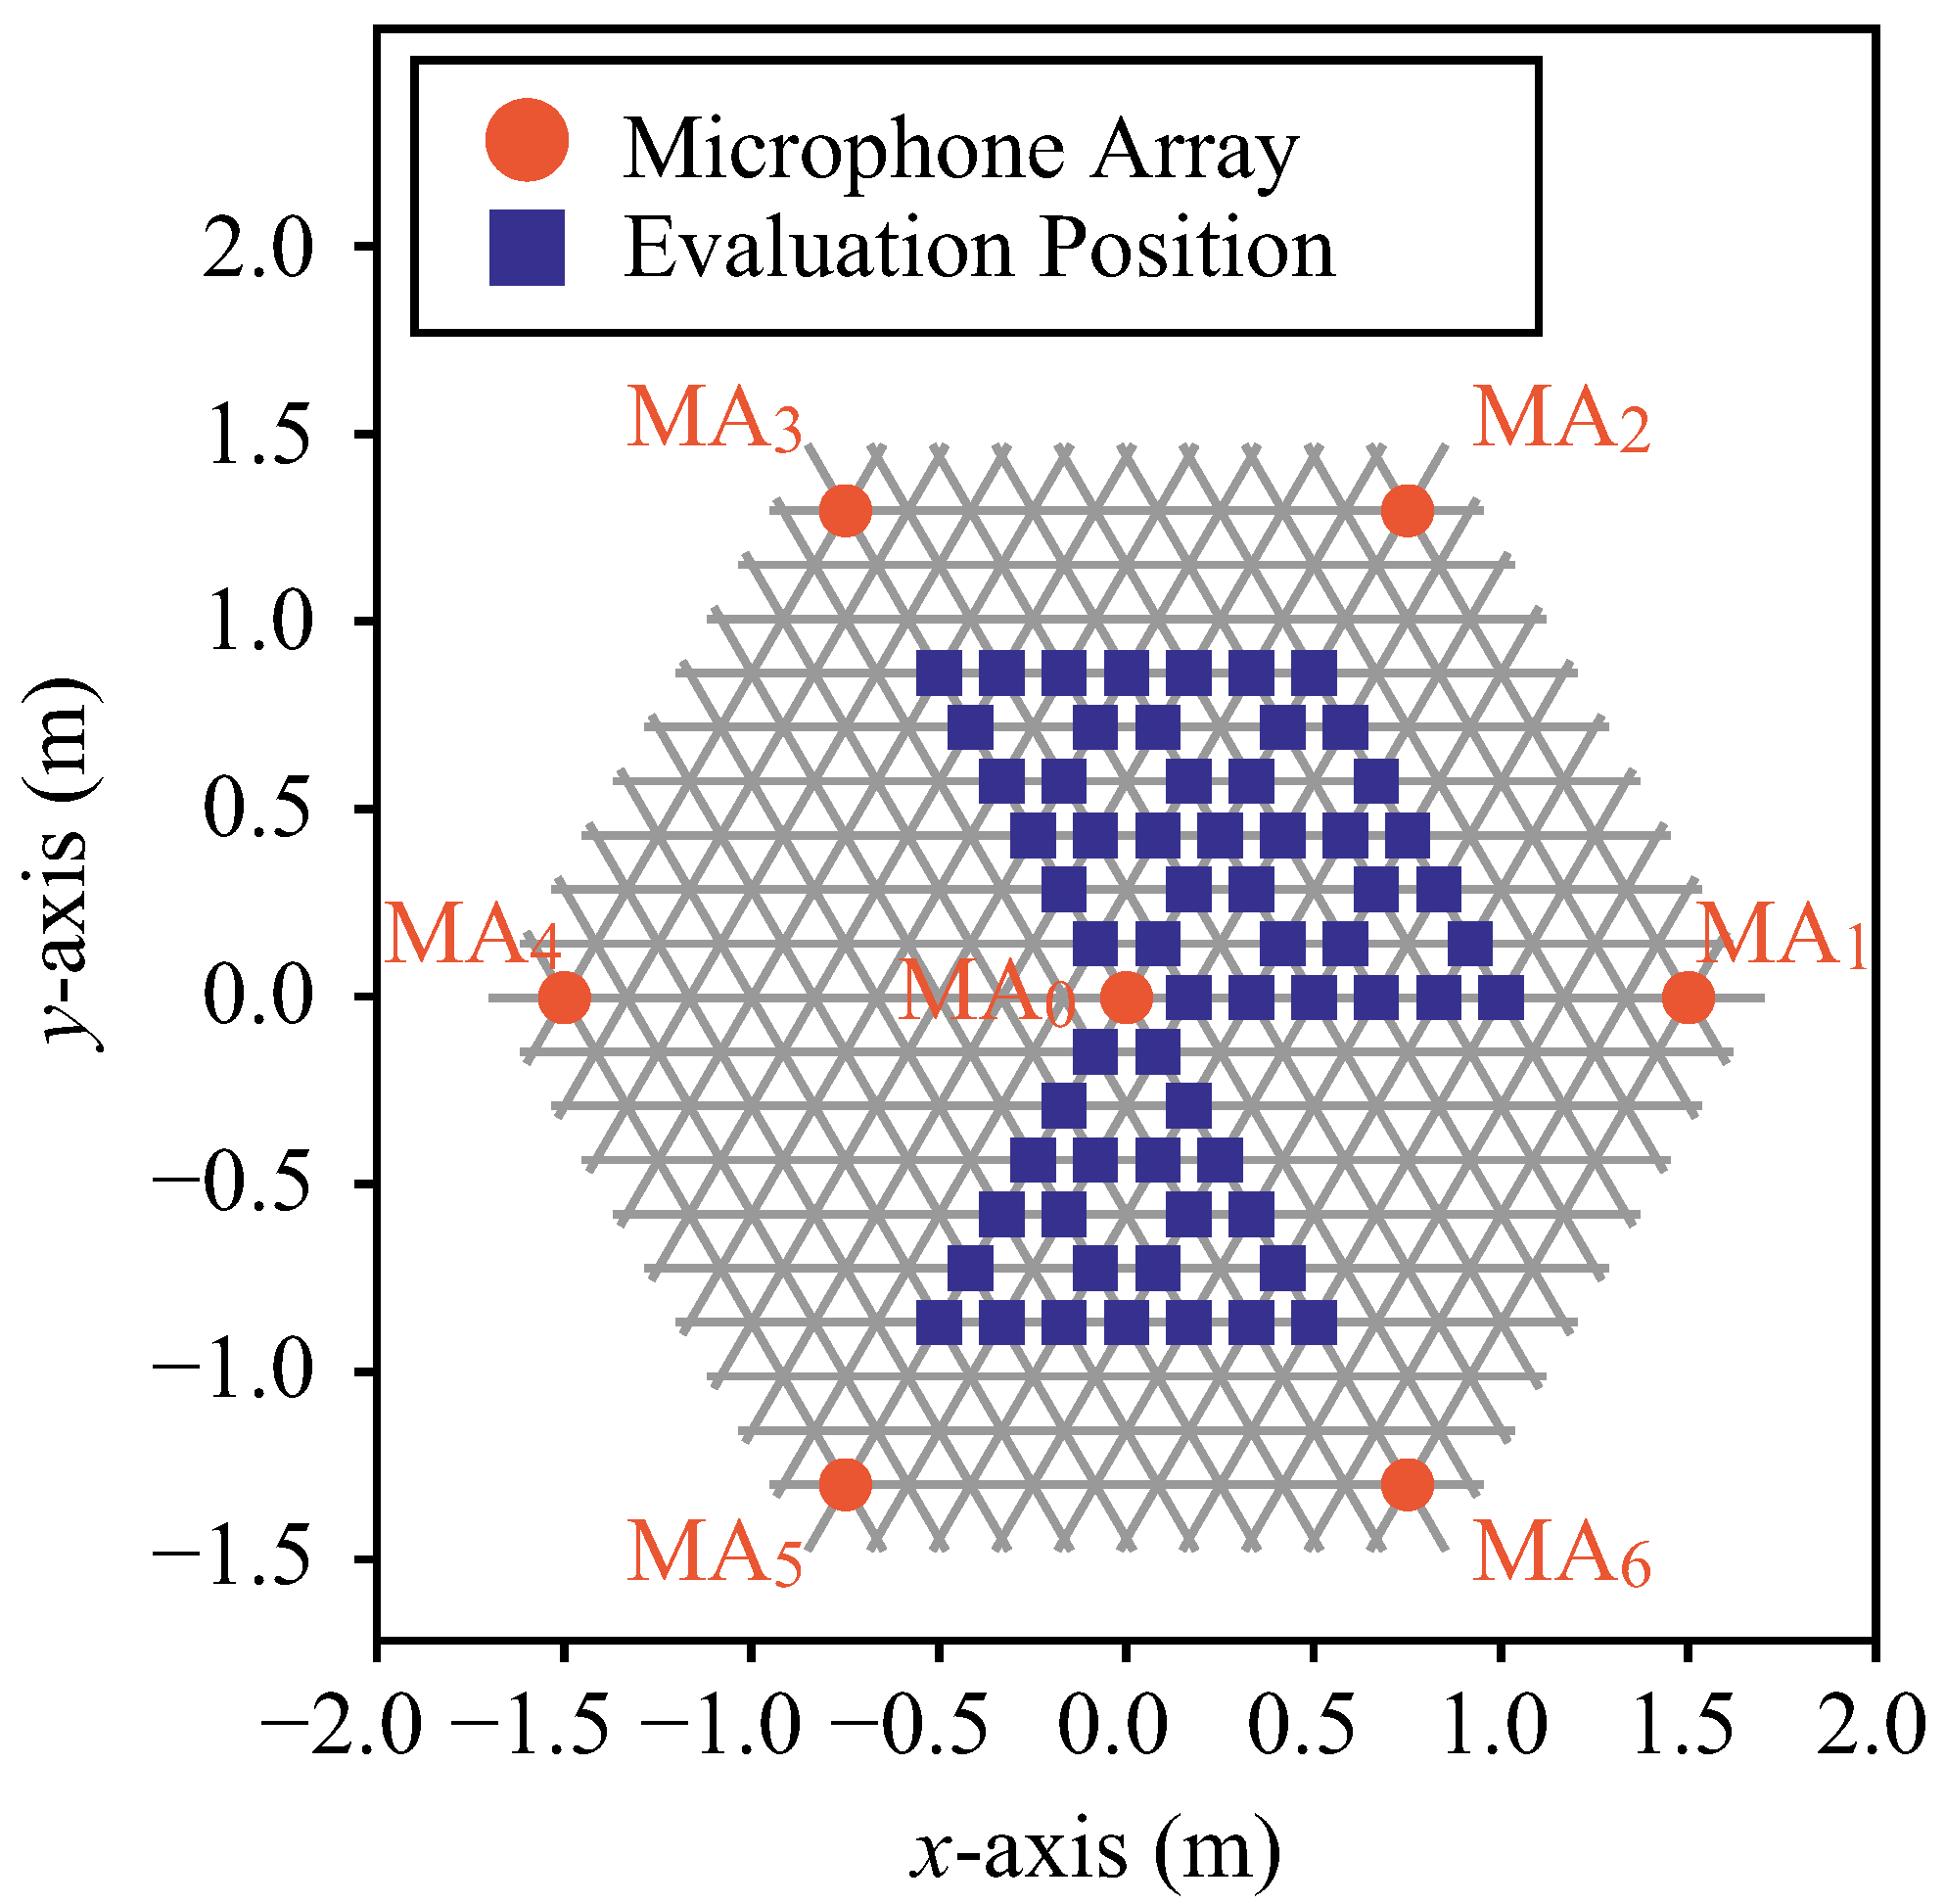
Figure 13 shows the arrangement of the microphone array and the position of the evaluation sound source. The orange circle marks show the microphone arrays and the blue rectangle marks (63 positions) show the sound source positions for evaluation. These positions are called evaluation positions. The evaluation position is on the trisection point between the reference position and the adjacent reference position, and the reference position itself is also an evaluation position. The sound source signals for evaluation at these positions were created from the measured impulse responses as in
Section 6.1.
We explain a variation in which two sound sources are placed. First, we divide a regular hexagon into six regular triangles. Then, we call each area Top Left (TL), Top Center (TC), Top Right (TR), Bottom Left (BL), Bottom Center (BC), and Bottom Right (BR), as shown in
Figure 10 and
Figure 11. We can select one area for arranging each sound source from TL, TC, TR, BL, BC, and BR. There are
combinations of arranging two sound sources in these six divided areas, but if we exclude geometrically similar combinations, there are four. We perform evaluation under comprehensive evaluation conditions by selecting two sound source positions from the pairs TC-TC, TC-TR, TR-BC, and TC-BC. However, candidates for sound source placement are limited to the positions marked by a blue rectangle inside of the TC, TR, and BC areas. The combinations where the distance between the two sound sources is not more than 0.5 m are excluded. For evaluation, we select three orientations of the loudspeaker among eight orientations, i.e.,
, and 315 degrees, at each sound source position. The selection method is the closest orientation toward the origin of the coordinate
from the sound source position and the two orientations adjacent to the closest orientation. There are 22,104 total evaluation conditions. Since there are two sound sources in one evaluation condition, the number of detections is 44,208 when all acoustic events are detected.
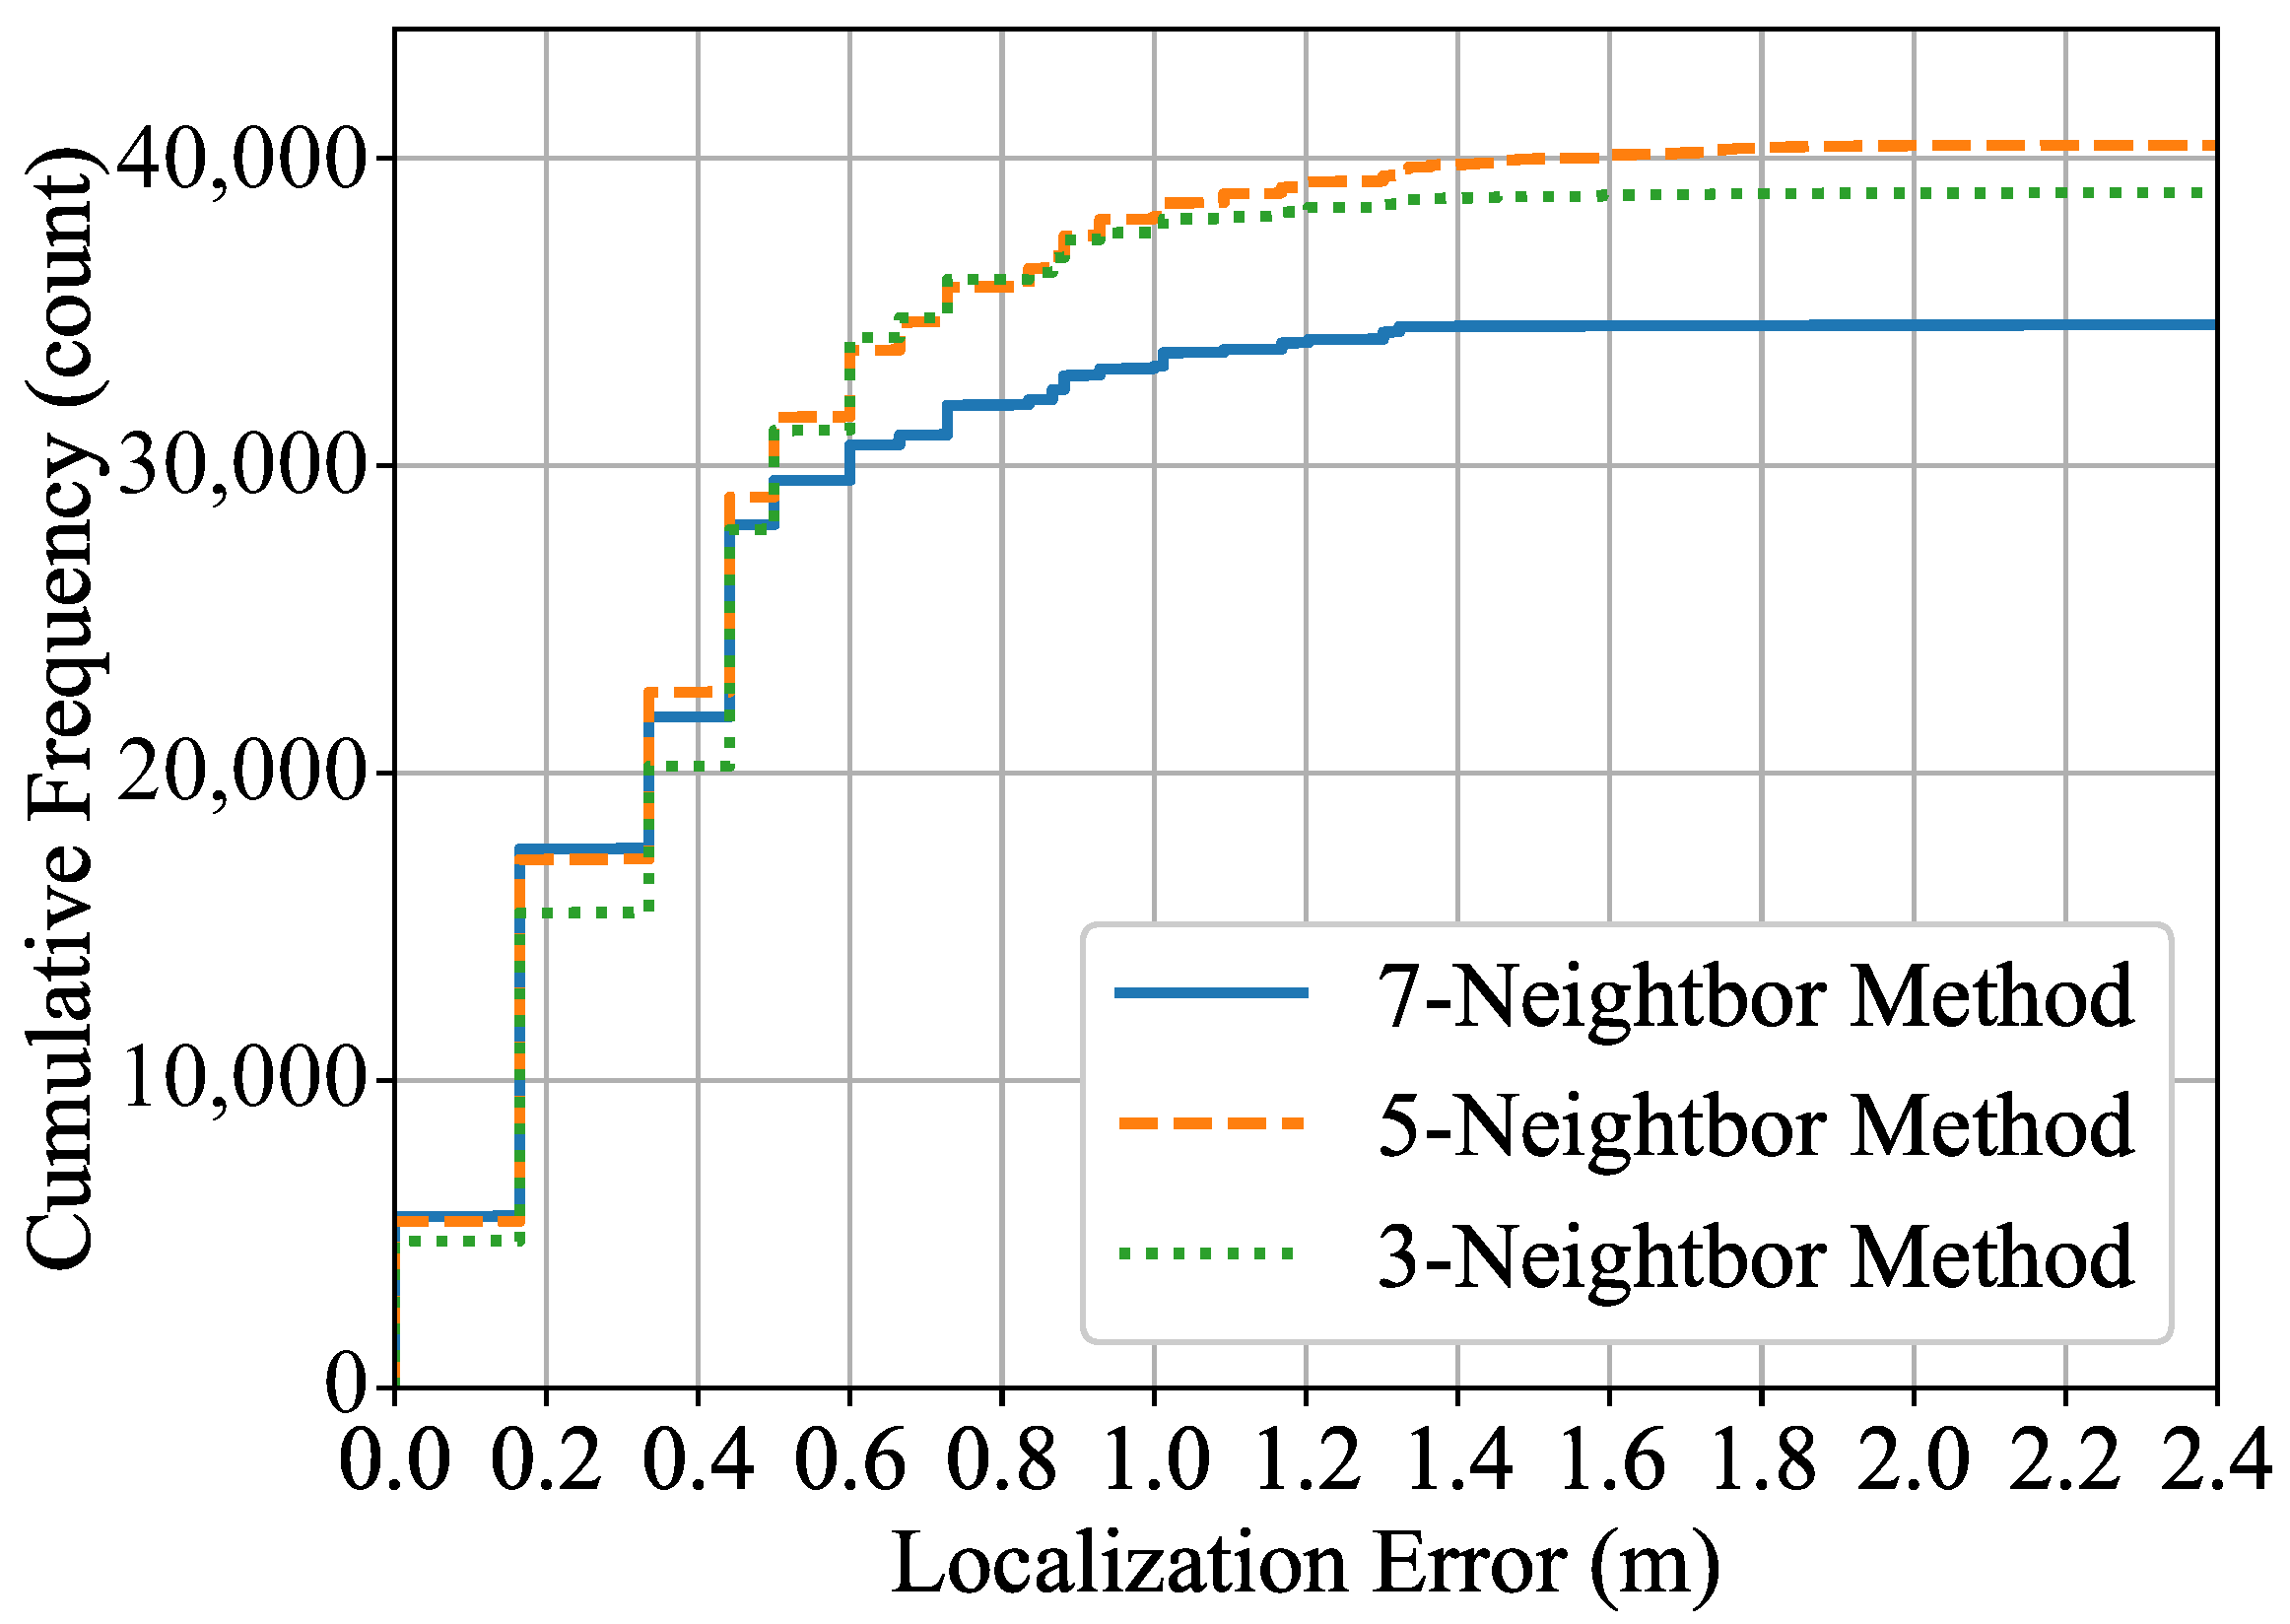
Figure 14 shows the results of the
p-Neighbor method for
. We can see how the cumulative distribution of localization errors changes depending on the number of microphone arrays used to estimate spatial energy. When the acceptable error is less than 0.5 m, the number of detected acoustic events tends to increase as
p increases from 3 to 7. In contrast, it can be seen that
is suitable over 0.5 m, especially over 1.0 m. It can also be seen that the number of detections of
saturates rapidly over 0.5 m.
Figure 15 shows the results of the
p-Energy method for
. We can see how the cumulative distribution of the localization errors changes depending on the number of microphone arrays used to estimate the spatial energy. When the acceptable error is less than 0.5 m, the number of detected acoustic events tends to increase as
p increases from 3 to 7. In contrast, it can be seen that
is suitable over 0.5 m, especially over 1.0 m. It can also be seen that the number of detections of
saturates rapidly over 0.5 m.
From
Figure 14 and
Figure 15, we confirm that
or
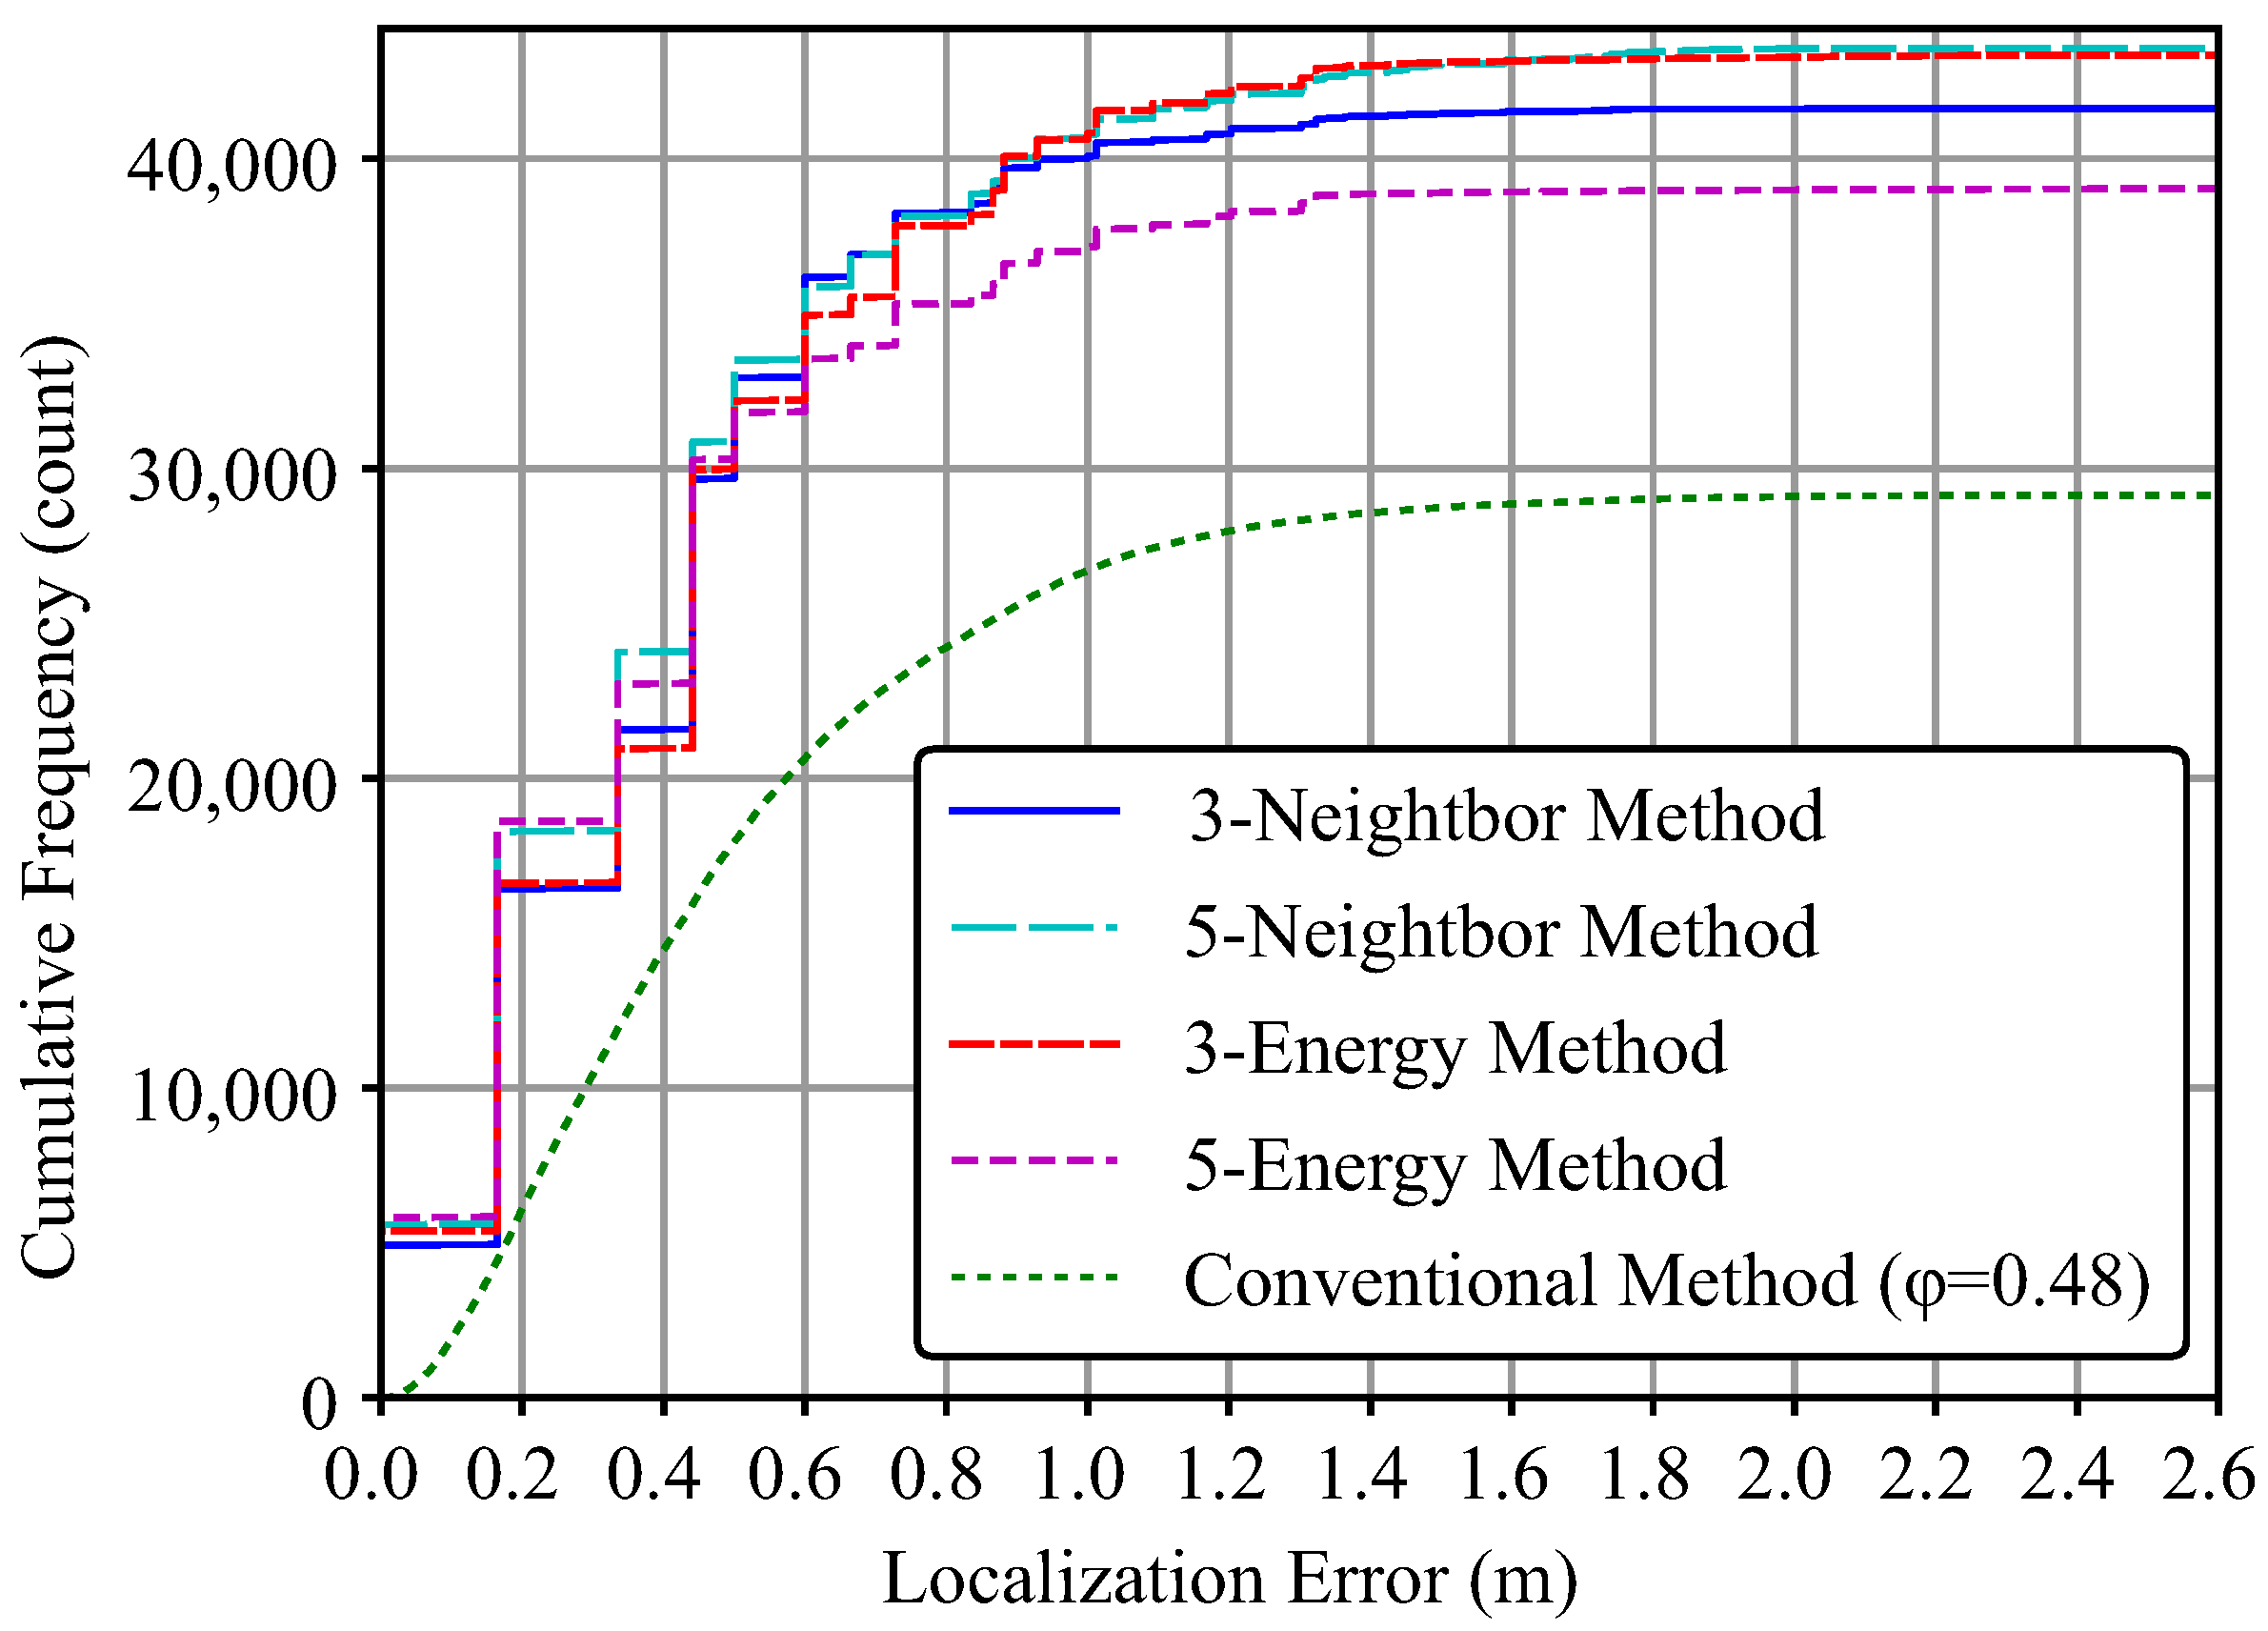
provides a well-balanced performance for both proposed methods. Finally, we compare the conventional method, 3-Neighbor method, 5-Neighbor method, 3-Energy method, and the 5-Energy method. The threshold value of the conventional method is compared with the previously optimized value of
.
Figure 16 shows the results. It can be confirmed that for any given acceptable error, the proposed method has a higher ability to detect acoustic events than the conventional method. In particular, the 5-Neighbor method consistently ranks high in the number of acoustic event detections for all acceptable errors. There is no difference between the Neighbor method and the Energy method under the same
p condition of less than 0.5 m. At a distance of 1.0 m or more, there is a difference in the trends, and the number of detected acoustic events is about the same for the 5-Neighbor method and the 3-Energy method.
7. Discussion
In this article, we proposed a method for detecting acoustic events that occur in a wide space and estimating the location of the sound source. By detecting acoustic events and localizing sound sources in a wide space, it becomes possible to know the spatial distribution of the speaker positions. Since speakers who are spatially close to each other belong to the same dialogue group, each speaker within the observation space can be divided into dialogue groups using a point cloud clustering algorithm, such as the k-means algorithm. Although we described acoustic event detection and sound source localization for each sentence, it is possible to detect where a particular speaker conversed at each time and in which dialogue group by frame-by-frame-based processing acoustic event detection and sound source localization in units of several milliseconds to several seconds. In addition, it is possible to find out who speaks the most and at what point in time the speaker’s utterances are leading their topic, which can be applied to facilitation support technology. Since it is possible to estimate this kind of information, it is expected that it will be applied to understanding complex dialogue activities in which multiple dialogues are occurring simultaneously. Since the proposed method does not involve speech recognition, it has the advantage of being applicable to applications that require protection of the privacy of utterances. Examples of multiple dialogues occurring at the same time include lecture halls where group work is conducted, panel discussions, and poster session halls. A method that covers a wide observation space, such as the one proposed in this article, is indispensable to realize such applications. We showed that an asynchronous distributed microphone array architecture is a promising method to detect acoustic events and localize sound sources in a wide observation space.
In this article, we evaluated a method that uses a wide space as the observation space by cutting out a part of that space into a regular hexagon and assuming that it does not interfere with sound sources in adjacent hexagons. In the future, we believe that evaluations that take into account interference with adjacent areas will be necessary. Furthermore, in this evaluation, sound sources were detected on a per-utterance basis. To monitor dialogue activity in the temporal direction, it is necessary to detect acoustic events and localize sound sources on a segment-by-segment basis of every few milliseconds to several seconds. In this case, it is difficult to evaluate each elemental technology individually (e.g., acoustic event detection, sound source localization, target clustering, head-orientation estimation [
26,
27], etc.) as we have to solve the multiple target tracking problem [
28,
29].
Our evaluation was conducted in a room simulating a real environment at a sufficient distance from the wall. Therefore, in order to understand the basic properties of the algorithm, it is also considered necessary to evaluate it in a soundproof room or an anechoic room.

