1. Introduction
The increasing diversification of electrical appliances among urban residents has significantly enhanced their quality of life. However, there remains a notable lack of awareness regarding electrical safety. Electric arcs, often caused by unauthorized electrical connections, aging infrastructure, or damaged wiring, pose serious threats to residential electrical safety. These arcs can produce extremely high temperatures exceeding 5000 °C [
1,
2], significantly increasing the risk of electrical fires. Unfortunately, conventional protection devices are insufficient for effectively detecting electric arcs [
3]. To address this critical issue, the International Electrotechnical Commission (IEC) has introduced Arc Fault Detection Devices (AFDDs), which have been implemented in Europe, China, and other countries [
4]. Moreover, solid-state circuit breakers are an advanced technology for grid protection, designed to eliminate arcing. Unlike traditional mechanical circuit breakers, which rely on physical contacts, solid-state circuit breakers utilize semiconductor devices (such as transistors and diodes) to switch circuits, enabling rapid and reliable disconnection. Ongoing research in this field has significantly enhanced electrical safety [
5,
6].
According to statistics from the China Electrical Equipment Industry Association, the adoption rate of AFDDs in China remains relatively low, raising significant safety concerns regarding AC arc faults. To address these issues, researchers have explored various arc fault features for detecting such faults. These features include current sag, current spectrum, voltage gradient, high-frequency components of the current gradient, capacitive current, zero-crossing cutoff characteristics, and electromagnetic radiation.
Arc fault detection has been approached using various methods. In [
7], current sag is analyzed, and the correlation between normal and fault frequency bands is leveraged to identify arc occurrences. While this method rigorously establishes a current sag model, it remains highly susceptible to interference from inductive devices. A different approach in [
8] extracts arc characteristics from current spectra and employs a sparse representation algorithm for detection. It also introduces an online adjustment method for the regular order p, making it adaptable to various devices. However, when circuit power is excessively high and the line is nearly conductive, the algorithm may fail.
Magnetohydrodynamics is explored in [
9] to enhance arc modeling, leading to a simplified approach for calculating arc voltage gradients and accurately estimating voltage gradients in low-voltage short arcs. Yet, aliasing effects caused by electrical devices are not considered. In [
10], a Rogowski coil di/dt sensor is used to capture high-frequency arc characteristics, as high-frequency sampling preserves more arc-specific features. However, relying solely on threshold-based detection may lead to false positives.
Information entropy is utilized in [
11] to reconstruct signal sequences and determine the characteristic frequency bands of arc current signals, effectively extracting arc features. Despite this, no specific detection methodology is provided. A security framework proposed in [
12] detects arcs based on their zero-crossing characteristics, incorporating arc fault circuit interrupters (AFCIs) to enhance grid safety. Electromagnetic radiation is leveraged in [
13,
14] to distinguish arc signals from non-arc signals, followed by log-spectral distance classification and online monitoring on an embedded platform. Nonetheless, performance may degrade under complex conditions.
While these methods can reflect the occurrence of arc faults to some extent, the proliferation of nonlinear components and harmonic distortions caused by the increasing variety of user-side electrical appliances and the widespread application of power electronic devices complicate the distinction between arc and normal states. In such overlapping scenarios, feature aliasing among different load types often leads to unwanted tripping or missed detections. Furthermore, continuous combustion caused by excessive current remains particularly challenging to detect effectively.
To address this challenge, it is essential to develop a model capable of accurate arc fault identification. Recent studies have explored the application of artificial intelligence (AI) in arc detection. For instance, support vector machines (SVMs), classical AI models, have been applied to arc fault detection in photovoltaic DC systems [
15]. This method utilizes the Hurst exponent to mitigate interference from power electronics noise and applies Empirical Mode Decomposition (EMD) to automatically extract the oscillatory frequencies of arc currents. This approach eliminates the need for prior knowledge of interference frequency ranges, which is typically required by traditional filters or wavelet transforms. However, in low-voltage AC scenarios, the characteristics of user electrical equipment often interfere with arc detection. Additionally, convolutional neural networks (CNNs) have been utilized to detect arc faults, achieving high detection accuracy. The TDV-CNN arc detection model proposed in [
16] employs a time domain visualization method to extract deep features, achieving high-precision arc detection. However, it only considers faults in a single electrical device and does not account for the simultaneous operation of multiple devices. In [
17], an adaptive convolutional network is introduced, leveraging generative adversarial networks to enhance carbonization path data, thereby improving model robustness. Yet, research on other fault types in AC scenarios remains limited. A new parallel deep convolutional neural network based on AlexNet is presented in [
18], demonstrating superior detection performance and stability compared to the traditional AlexNet architecture. However, the model’s large size makes deployment on Arc Fault Detection Devices (AFDDs) challenging. Long short-term memory (LSTM) neural networks, known for their sensitivity to time-series data, have also been employed for arc fault detection [
19,
20], offering a promising direction for research on low-voltage arc fault detection. LSTM significantly enhances arc fault detection accuracy due to its strong capability in learning temporal features. However, it has notable drawbacks, including a high demand for fault samples during training and substantial computational resource consumption. Moreover, researchers have proposed a sequential neural network model with three hidden layers, yielding outstanding performance [
21]. Similarly, their high computational requirements and significant memory demands pose challenges for deployment on industrial AFDD chips. A recent study introduced a hybrid time and frequency analysis combined with a fully connected (FC) neural network (HTFNN)-based algorithm for arc detection [
22]. This algorithm employs a simple neural network to detect series faults in low-voltage AC systems, training a separate network for each fault type. It effectively addresses the issue of feature overlap from different devices. While the algorithm has certain advantages in terms of size compared to other networks, it still requires a significant amount of computational resources.
Table 1 summarizes the state-of-the-art studies on the characteristics of different arc detection models.
To address the aforementioned challenges, this study proposes an efficient arc detection method tailored for complex scenarios. The primary contributions of this work are summarized as follows:
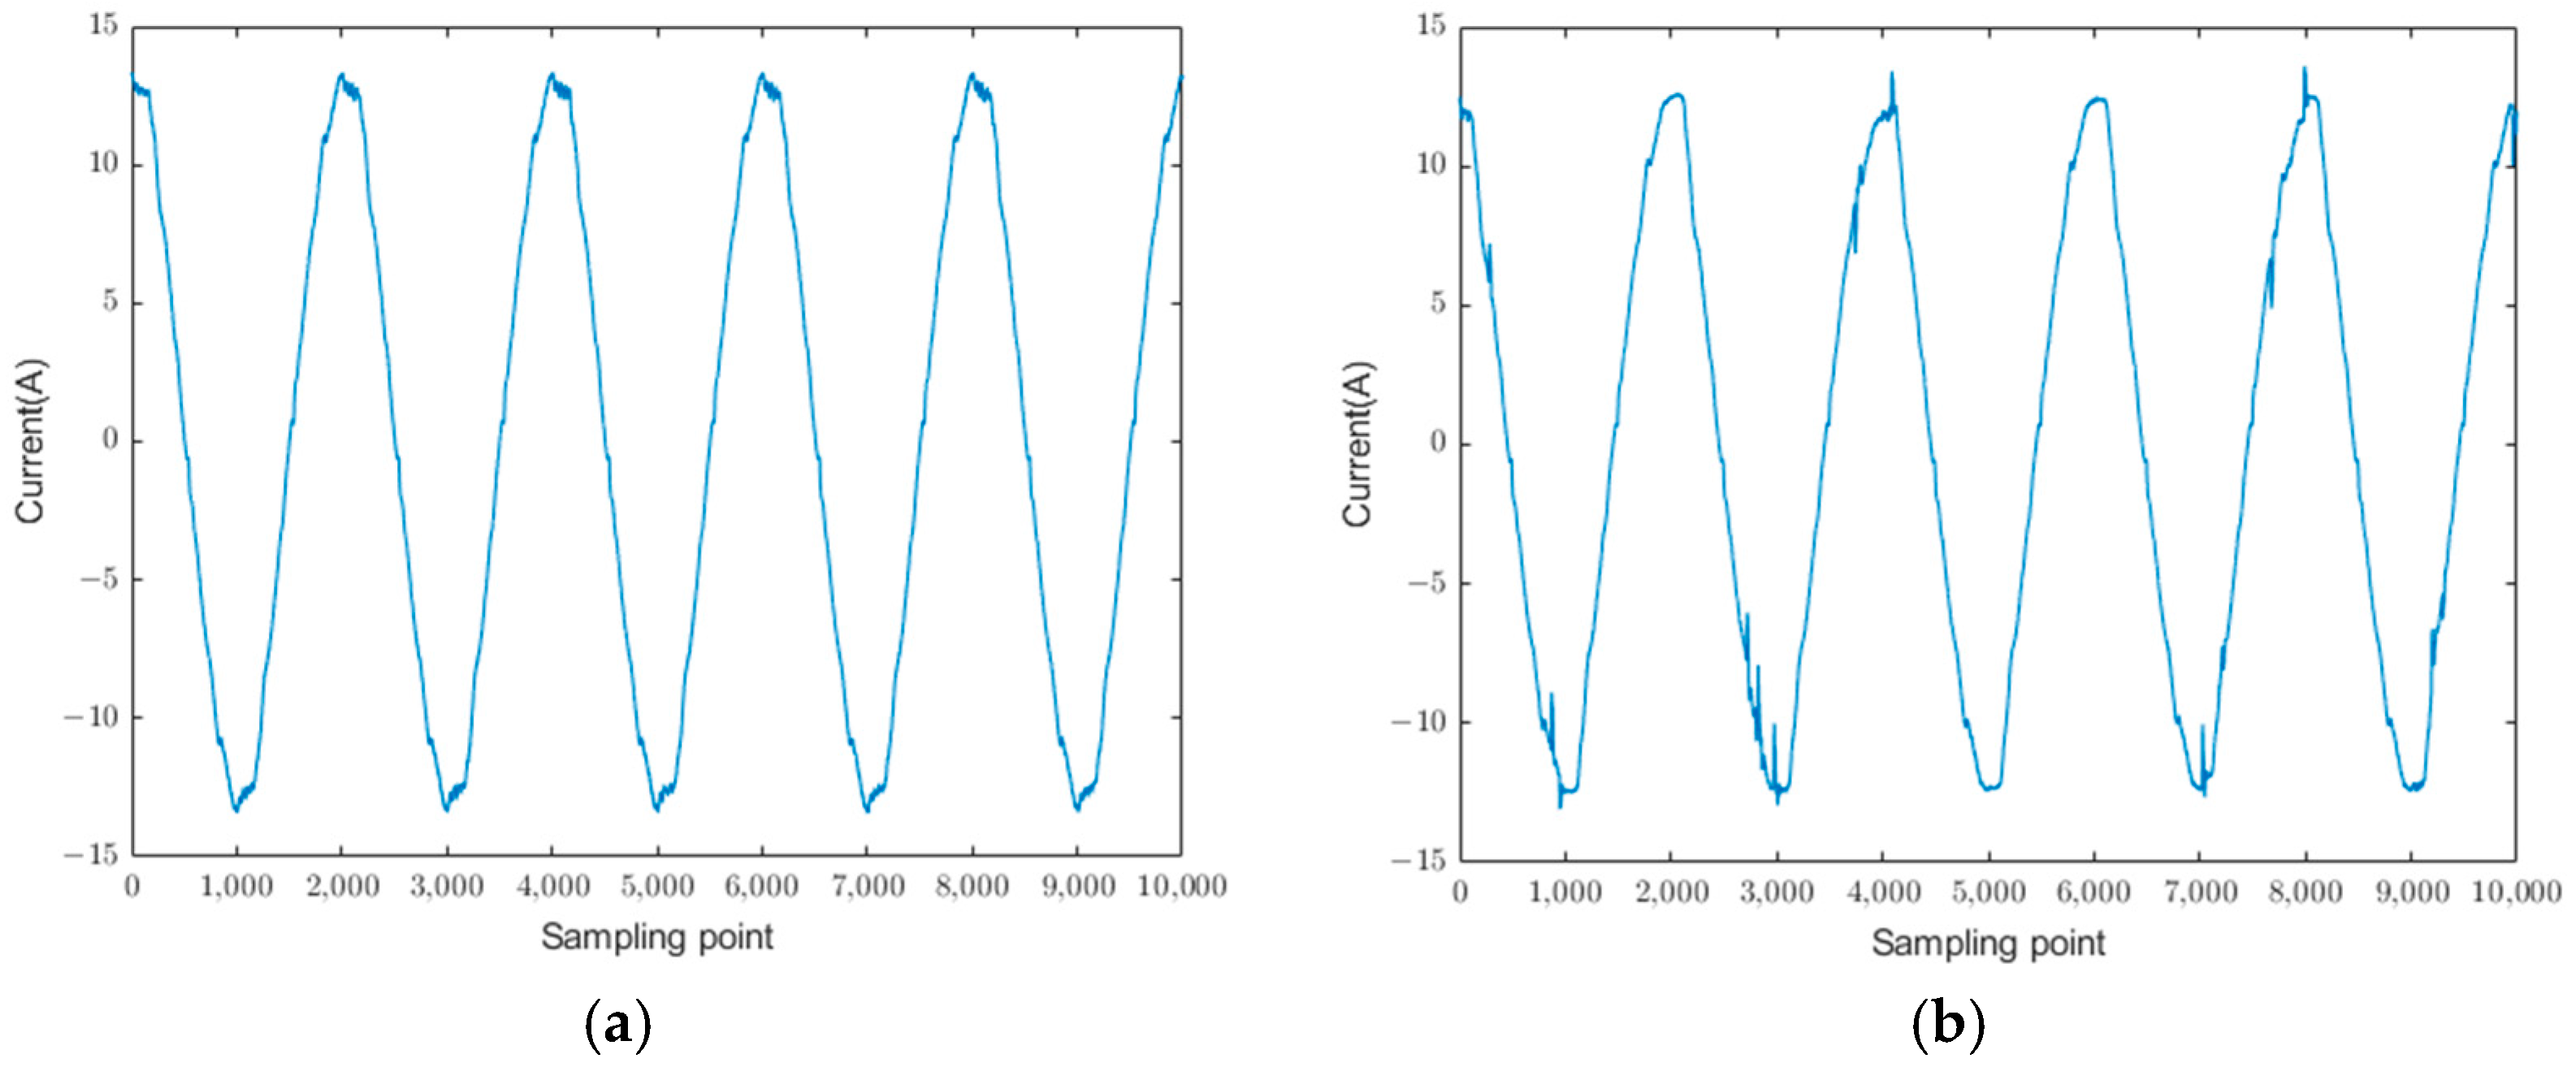
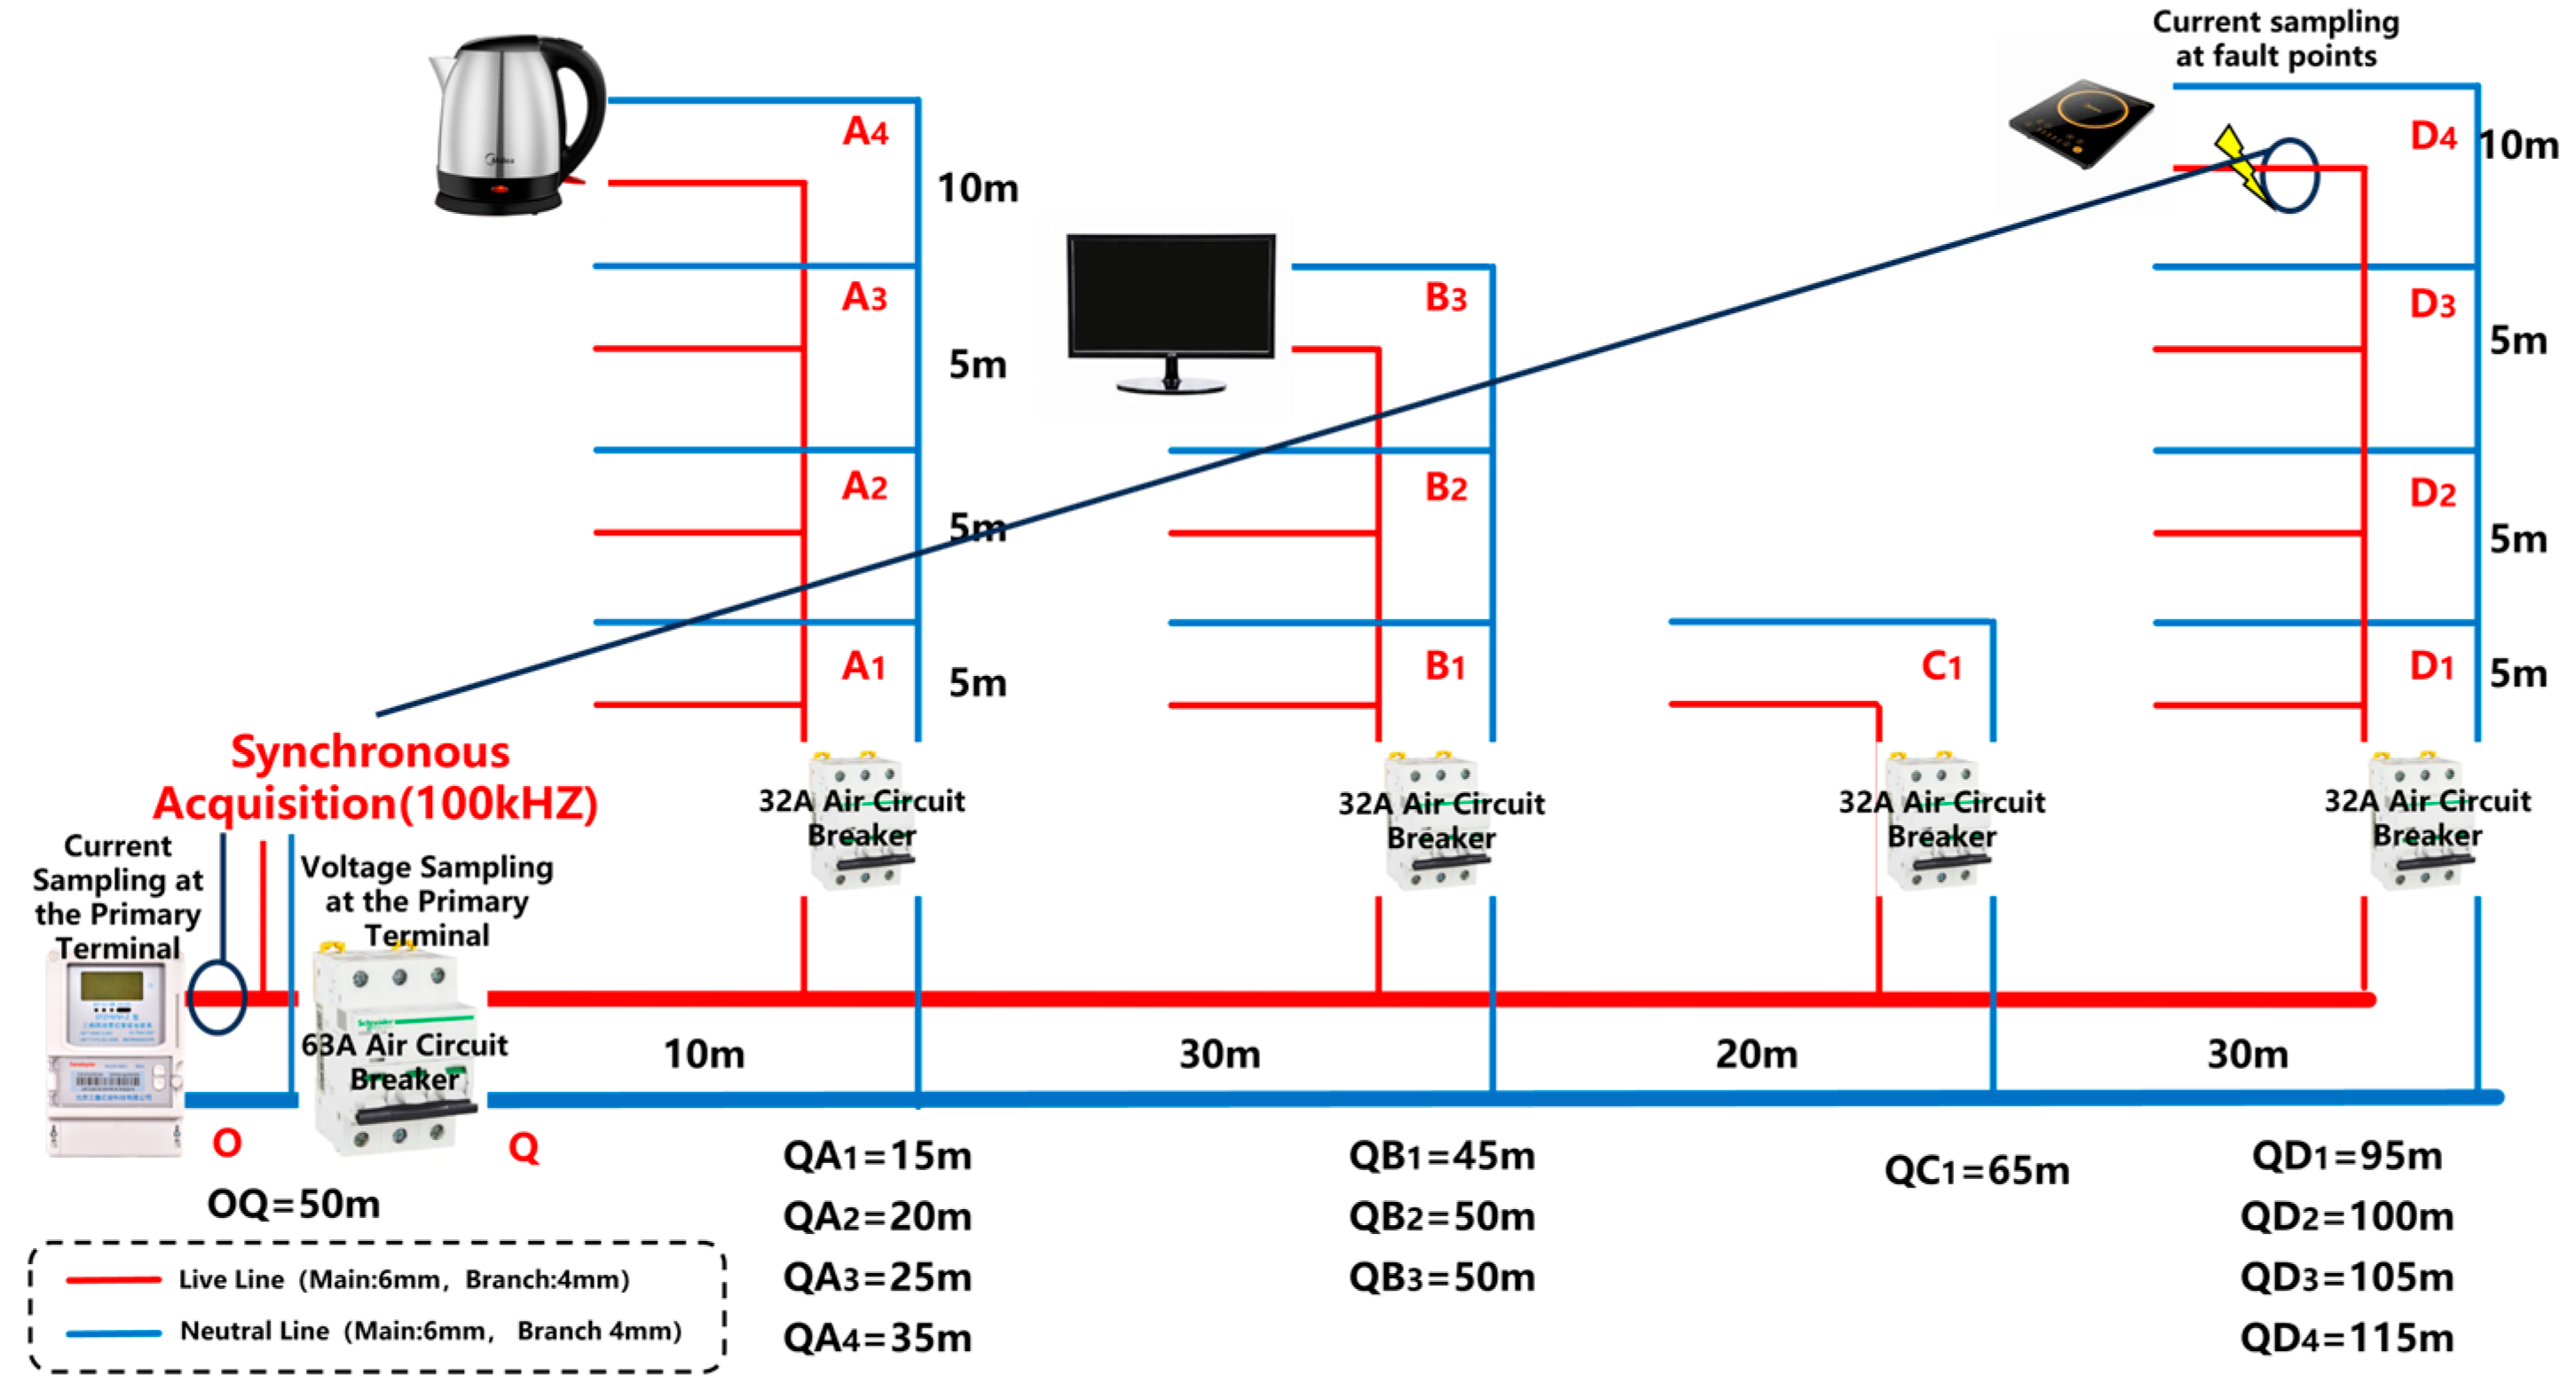
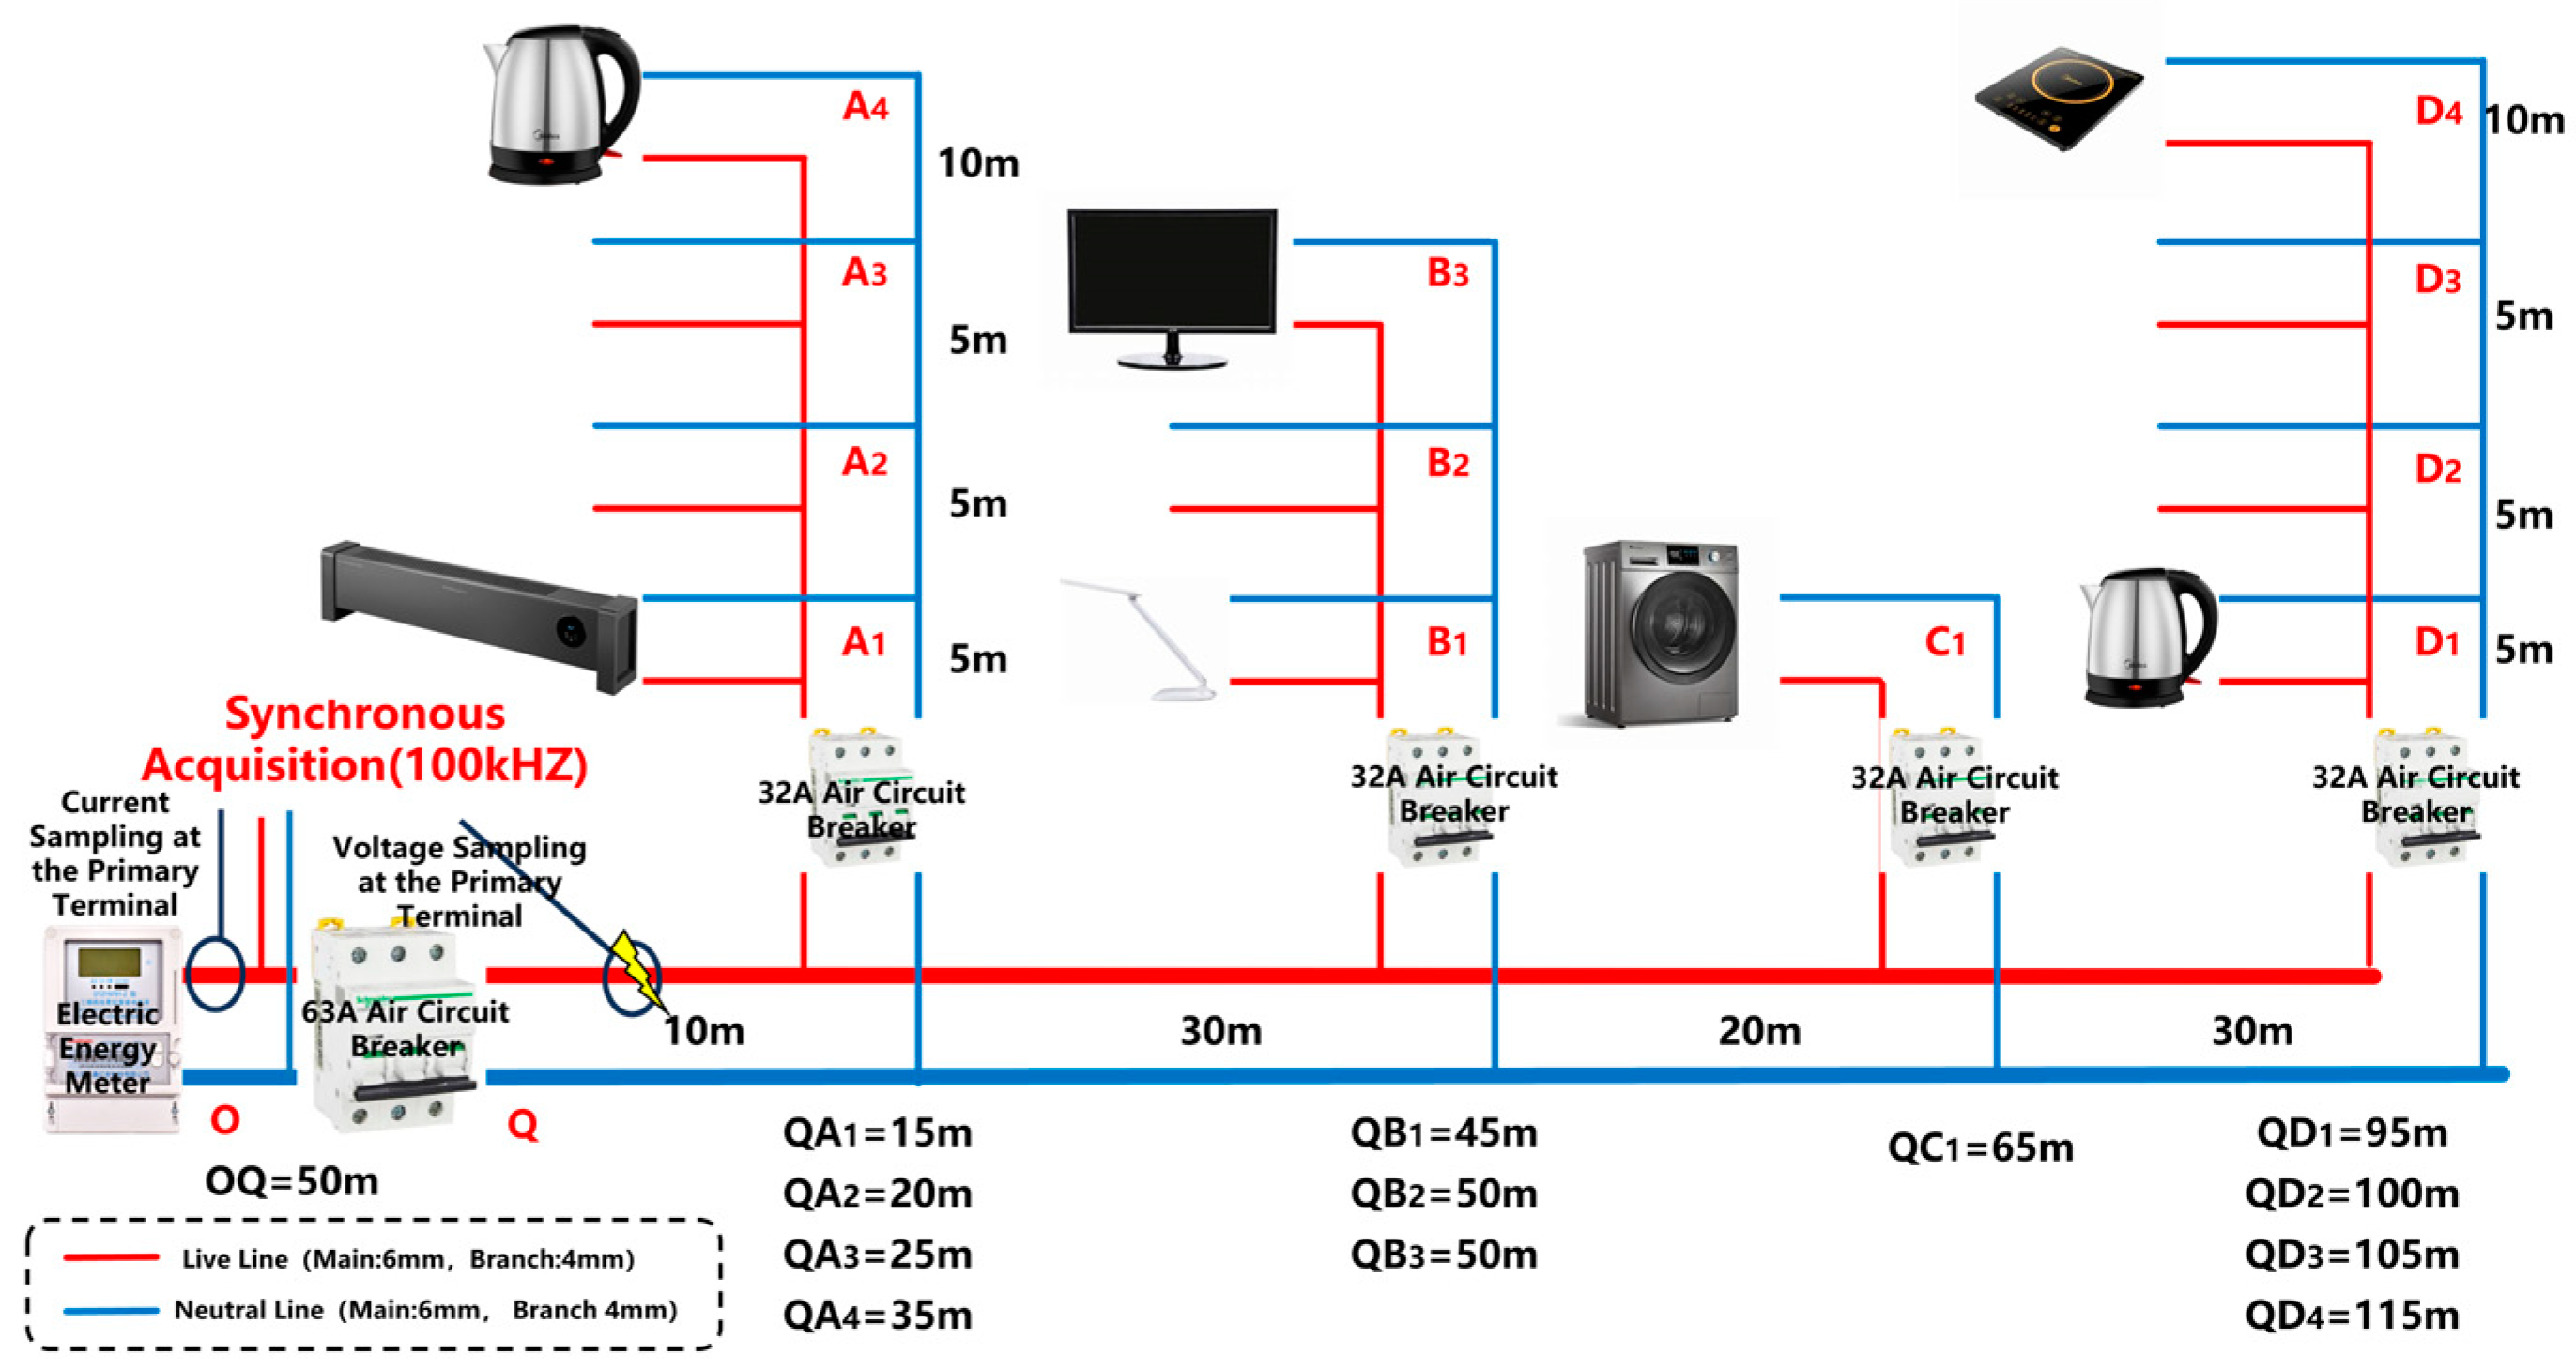
A true-to-scale low-voltage series arc fault laboratory was established to simulate arc fault scenarios involving various devices, including induction cookers, displays, kettles, heaters, table lamps, rice cookers, and washing machines. This study examined the transmission phenomena and attenuation characteristics of arc fault features over long-distance (165 m) power lines. Comparative analyses were conducted between normal operating conditions and arc fault scenarios across different device types to comprehensively understand the characteristics of arc faults.
This study introduced an AHA multi-risk factor framework, comprising the abnormal distribution, harmonic energy, and abnormal pulse risk factors. By leveraging distribution characteristics, harmonic amplitude energy, and abnormal pulse features, the framework effectively extracts arc fault features while accounting for equipment operation, signal coupling, and signal superposition, ensuring robust and accurate detection.
To enhance detection performance and balance the influence of different risk factors, a Knowledge Entropy (KE) weighting allocation method was developed. This innovative approach integrates expert knowledge and information entropy to effectively estimate the relative importance of the proposed risk factors, thereby optimizing the model’s performance.
Extensive experiments were conducted under three scenarios: single-appliance arc faults, arc faults with appliance aliasing, and arc faults on public branch circuits. The results demonstrate that the proposed AHA-KE model not only achieves exceptional arc fault detection accuracy but also offers significant advantages in computational efficiency, making it suitable for practical deployment.
The subsequent sections of this study are organized as follows:
Section 2 explores the propagation characteristics of arcs in power lines, focusing on their energy properties and time–frequency domain attenuation behaviors.
Section 3 introduces the arc fault detection model developed using the AHA-KE methodology.
Section 4 details the experimental setup and provides a comparative analysis of the experimental results. Finally,
Section 5 summarizes the key findings and contributions of this research.
3. Arc Detection Method Considering Multiple Risk Factors
3.1. Current Abnormal Distribution Factor
The Maximum Mean Discrepancy (MMD) is a statistical method used to quantify the difference between two probability distributions [
29]. For current signals within a specific frequency band, these signals can be represented as data distributions. Although arc pulses exhibit significant periodicity across different cycles, real-world conditions during each electrode breakdown are unlikely to be identical. Consequently, evaluating abnormalities in the distribution of current signals between adjacent sequences can help assess arc risks. The calculation method for the abnormal distribution difference factor is expressed as follows:
In this equation, represents the characteristic distribution of the filtered current sequence within the current cycle, represents the characteristic distribution of the sequence from the previous cycle, and and are the mathematical expectations within the cycle sequences.
The value of is positively correlated with the degree of difference between two adjacent frequency bands. When the degree of difference exceeds a predefined threshold, it is considered that there may be a risk of arc occurrence in the circuit.
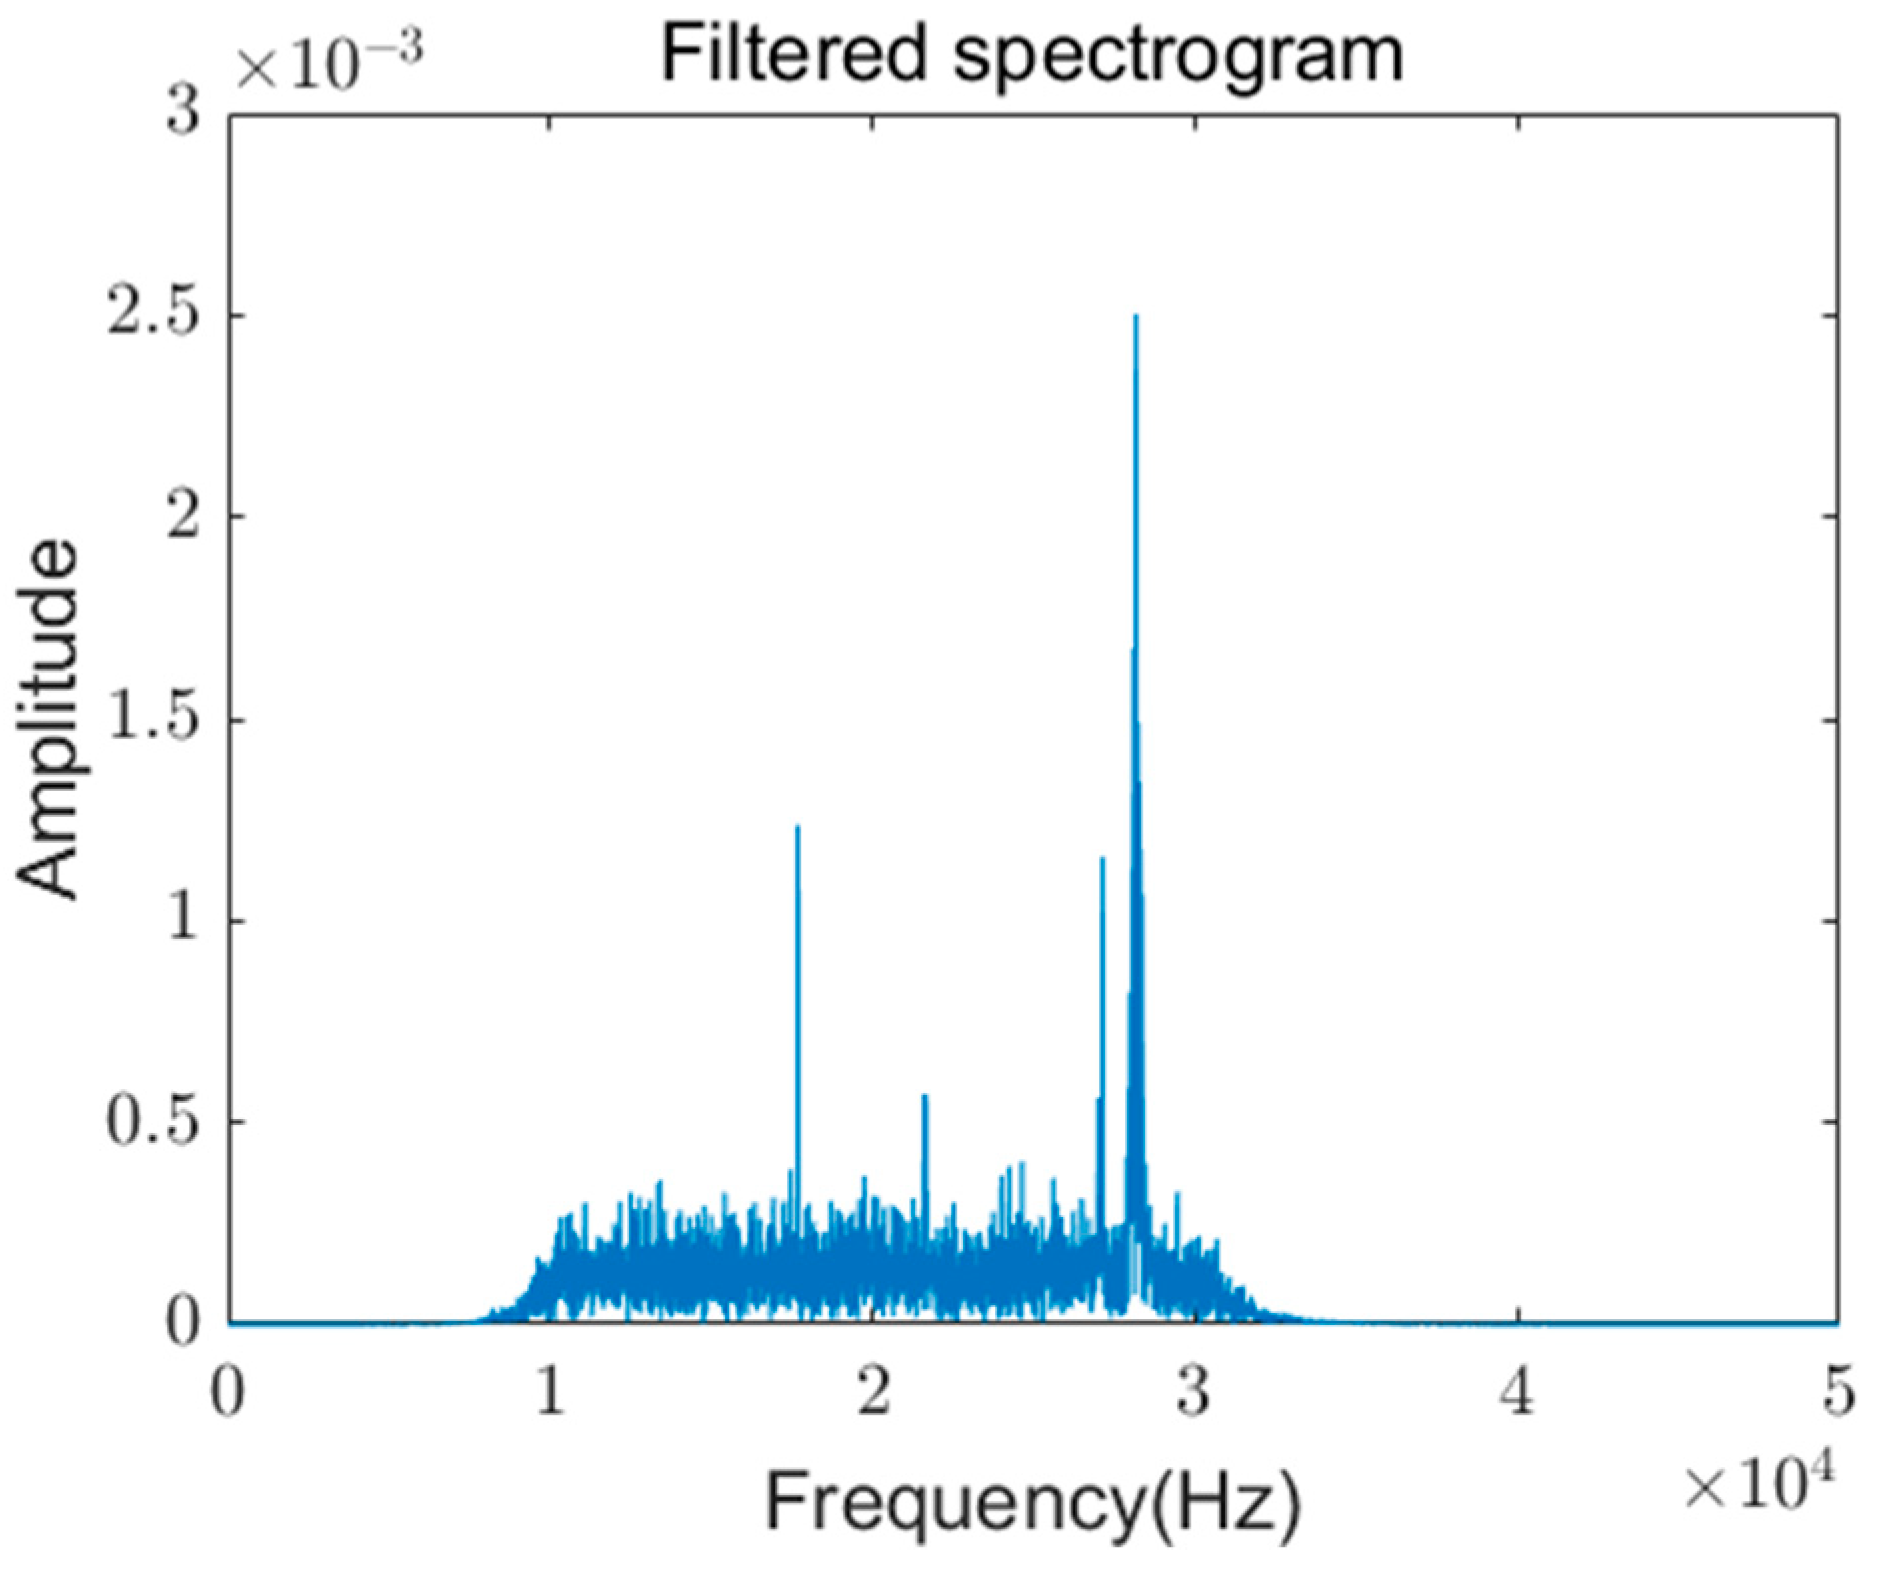
3.2. Harmonic Amplitude Energy Factor
Harmonic energy is commonly used to describe the energy distribution of various harmonic components within a signal or system. The periodic signal
of urban residential users can be expressed as a Fourier series:
Here,
represents the amplitude of the
-th harmonic,
is the angular frequency of the fundamental frequency,
, and
denotes the phase angle of the
-th harmonic. Substituting the Fourier series representation of
into the energy formula, for discrete signals
, the harmonic energy can be calculated using the discrete Fourier transform (DFT), defined as follows:
The total harmonic energy is then expressed as the following:
For specific electrical loads, the oscillation region during arc current generation contains fault characteristic frequency bands. The harmonic energy within the fault frequency band is selected as the fault characteristic parameter. Over a period of five cycles, the total harmonic energy is defined as
, where
represents the
frequency component of the DFT, and
represents the number of sampling points per cycle. The harmonic amplitude energy evaluation index is given by the following:
Here, represents the cycle sequence index. When , it is considered indicative of a higher risk of arc generation in the circuit.
3.3. Pulse Risk Factor
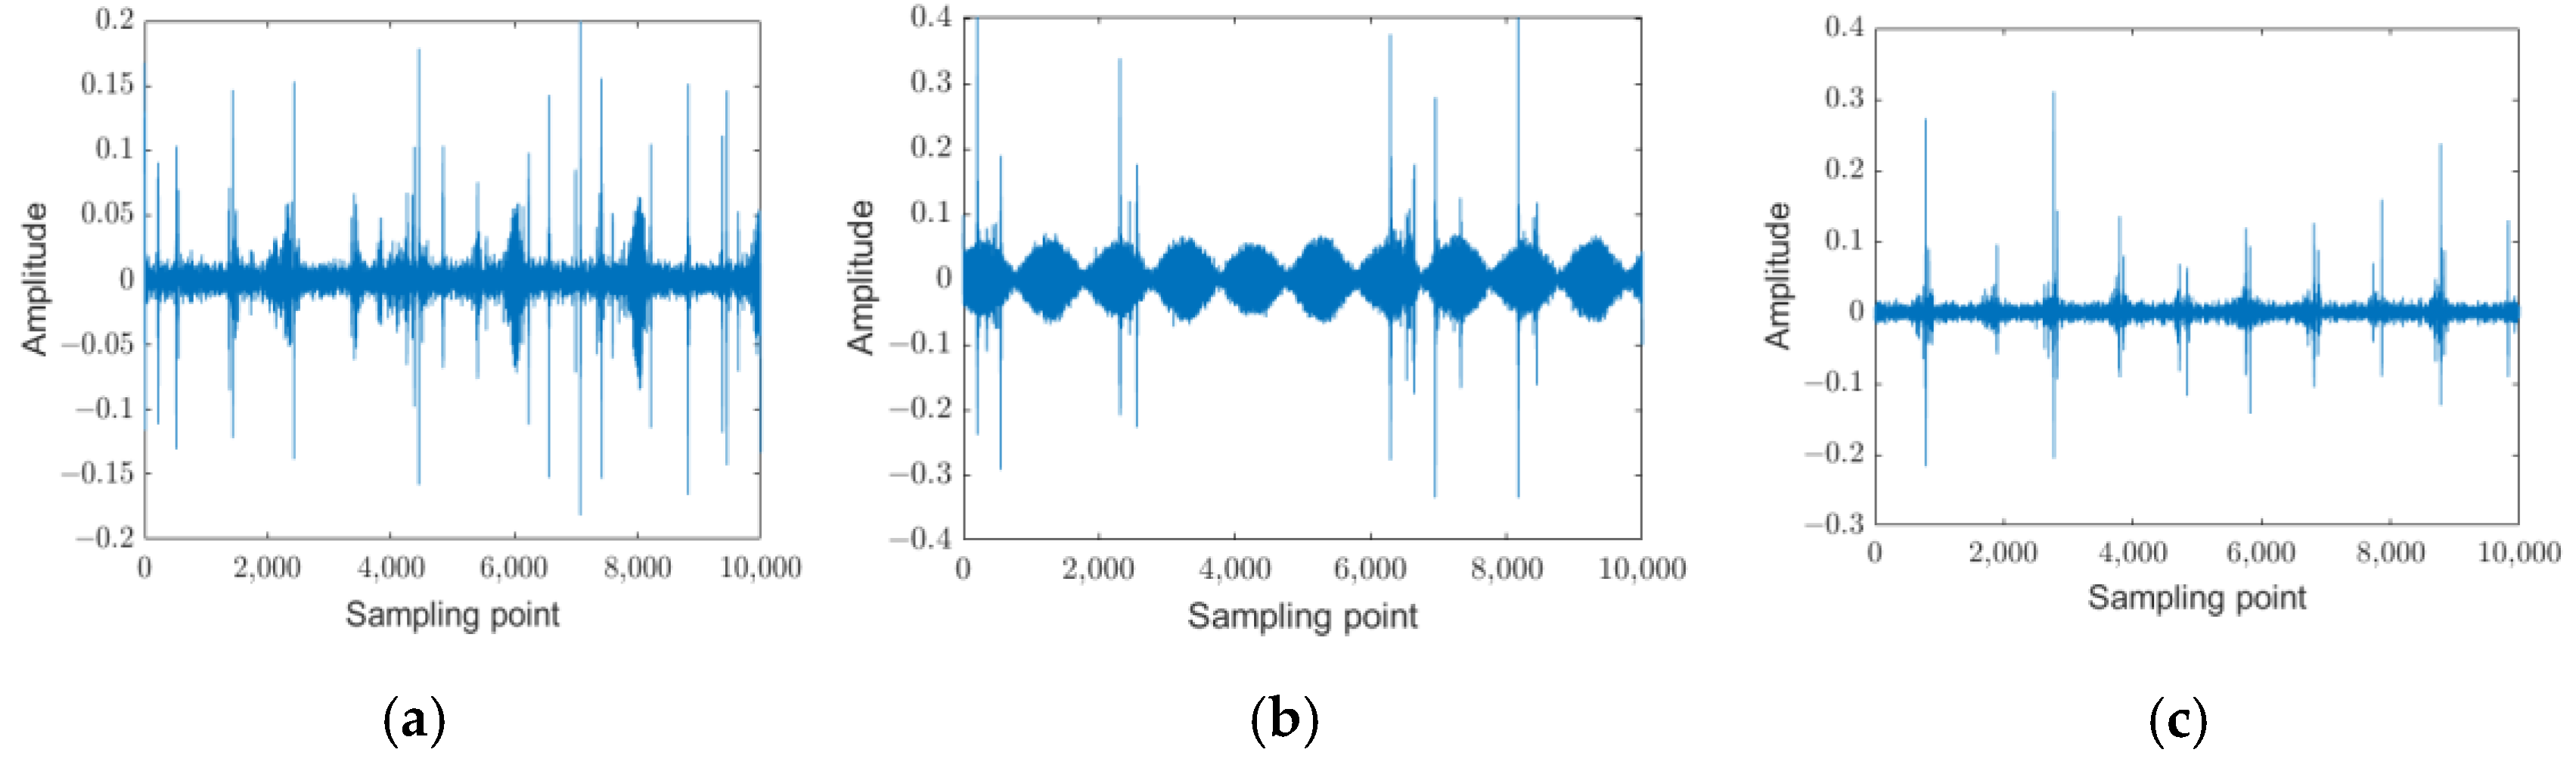
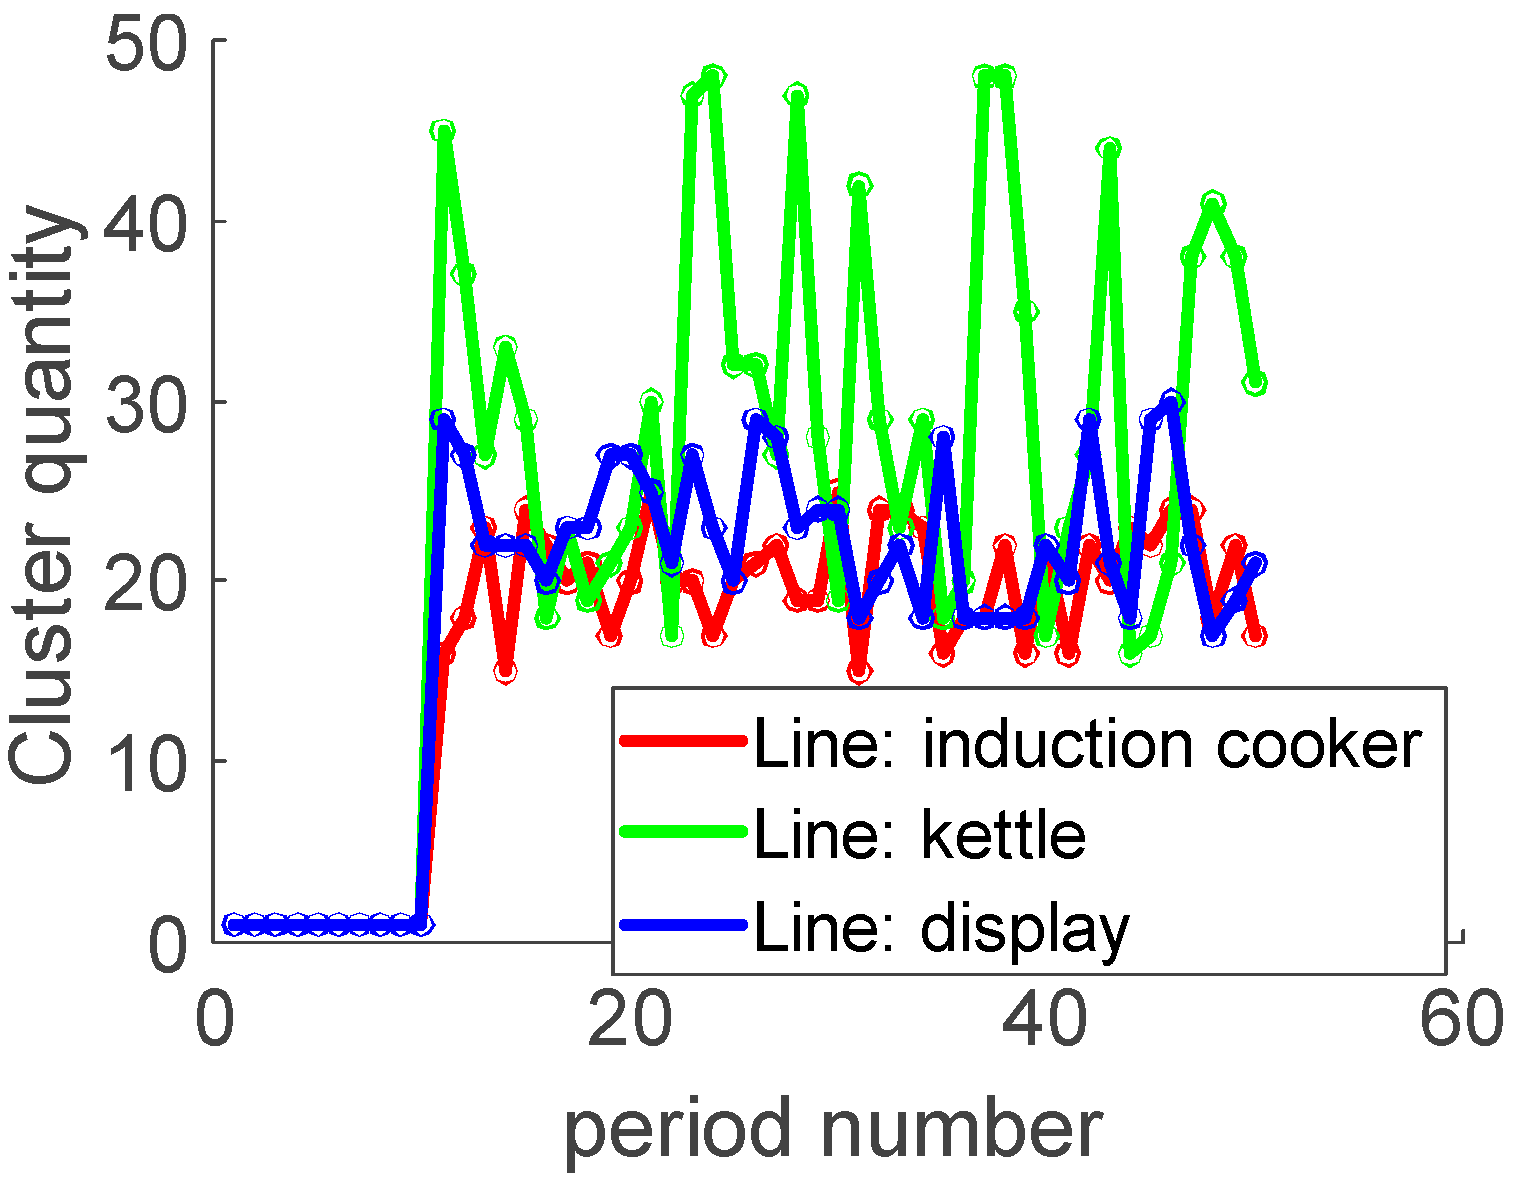
Under normal operating conditions, the amplitude of background noise in equipment typically remains within a relatively narrow range. However, abnormal pulses that emerge following the occurrence of arc faults serve as key indicators for fault detection. To identify these pulses, a density-based clustering method is proposed to isolate abnormal pulses and extract frequency band features, leveraging the characteristic distribution of background noise under normal conditions.
The Density-Based Spatial Clustering of Applications with Noise (DBSCAN) algorithm, which operates based on the concept of density, is employed for this purpose [
30]. The core principle of DBSCAN involves defining clusters through distance measurements and density thresholds. For a given dataset
, the algorithm identifies clusters within a region centered on point
with a radius of
.
Here, represents the neighborhood of point , encompassing all points whose distance to does not exceed . The density at point is then evaluated, and is classified as a core point if holds true, and here, represents the minimum density threshold.
After defining the density of the neighborhood, it is essential to describe the relationships among different points in dataset . To achieve this, the DBSCAN algorithm introduces the concepts of density reachability and density connectivity. Density reachability is defined as the existence of a path composed solely of core points that connects point to point where the path is denoted as . Density connectivity, on the other hand, refers to non-core points within the neighborhood that can be connected through a common core point.
Each time a new core point is identified, a cluster is formed from that point, and the cluster count is incremented by one. Points not included in any cluster are labeled as noise points, recorded as a separate cluster. Once all points are processed, the algorithm outputs the total number of clusters
and the total number of noise points
. Within a specified frequency band,
is used to evaluate the distribution of pulse points within that band:
is positively correlated with the number of pulse points within the frequency band. A higher number of pulses generated by the arc results in a larger value, effectively quantifying the activity level within the band.
3.4. Knowledge Entropy-Based Weight Allocation
Different factors often exhibit variations in dimensions and influence scopes, making direct comparison susceptible to the "dominance effect," which can result in the neglect of other factors. To address this issue, designing a rigorous weighting framework is essential for the accurate evaluation of each factor. Subjective weighting, which assigns weights to multiple indicators based on expert judgment or experience, is commonly used to account for the relative importance of each factor.
From the perspective of variation trends among factors, the degree of variation for abnormal pulse risk factors is greater than that of abnormal harmonic amplitude energy factors and abnormal current distribution difference factors. Accordingly, the contribution weights can be estimated as based on their level of importance. However, this estimation relies solely on experience and subjective judgment, which may lead to imprecise weight allocation. Therefore, it is crucial to determine the specific contributions of each indicator and establish corresponding weight coefficients through a more systematic and objective approach.
The entropy weight method is derived from the concept of information entropy in information theory, first proposed by Shannon [
31]. Assuming that the probability of an unknown event occurring is
, its total information content is
. Information entropy represents the mathematical expectation of the information content. Let
denote the normalized factors, and
represent a matrix of
:
If
represents the proportion of the
-th sample in the
-th indicator, denoted as
,
, then the information entropy
is as follows:
where
represents the number of samples, and
typically falls within the range
, for
,
. After computing the information entropy using the formula above, the weight of each indicator,
, can be determined. M is the last cycle of the arc fault sequence. The entropy-weighted score,
, can then be computed using the following formula.
To effectively integrate the characteristics of objective data and subjective judgment, the weights derived from the entropy weight method and the expert judgment method are combined in equal proportions, with each method assigned a weight of 50%. The final weight is determined using a weighted average approach. This integration enables the construction of a comprehensive multi-dimensional arc risk factor identification model, whose calculation formula is expressed as follows:
Finally, based on the sensitivity analysis of different risk factors, we obtained the specific weights of each risk factor, as shown in
Figure 2. Among the risk factors, the weight of the abnormal pulse risk factor is the largest, followed by that of the harmonic energy and, lastly, that of the abnormal distribution.
5. Conclusions
This paper introduces AHA-KE, a robust method for detecting arc faults in complex environments. By leveraging the current anomaly distribution factor, harmonic amplitude energy factor, and pulse risk factor, alongside a unique weight allocation model, AHA-KE enhances feature extraction and detection accuracy. The experimental results demonstrate its effectiveness across diverse scenarios, including single-appliance faults, fault superposition, and public branch faults, with consistent performance and rapid detection within 100ms. The model’s ability to maintain high accuracy under complex conditions, such as noise coupling and high-power loads, validates its potential for practical deployment in urban residential electrical systems. Considering the three scenarios, the method proposed in this paper can detect faults within 0.14 s after the occurrence of the arc, with an average latency of 0.134 s. Considering the impact of severe EMI environments on the model is a good suggestion, as there are many EMI environments in industrial sites. However, the model proposed in this paper focuses on household appliances in low-voltage AC scenarios, where severe EMI environments are rarely encountered. In future research on arc monitoring for industrial equipment, we will pay particular attention to the impact of EMI on model performance. Future work will focus on refining feature extraction methods, enhancing algorithm robustness, and adapting to evolving grid conditions, ensuring improved safety and reliability in electrical systems.


