Article

Load Rejection Overvoltage Suppression and Parameter Design Method of UHV AC Transmission Line

1
State Grid Hubei Electric Power Research Institute, Wuhan 430077, China
2
College of Electrical Engineering and Control Science, Nanjing Tech University, Nanjing 211816, China
*
Author to whom correspondence should be addressed.
Electronics 2025, 14(3), 619; https://doi.org/10.3390/electronics14030619
Submission received: 12 January 2025 / Revised: 25 January 2025 / Accepted: 31 January 2025 / Published: 5 February 2025
(This article belongs to the Special Issue Advanced Online Monitoring and Fault Diagnosis of Power Equipment)

Abstract

:
UHV (ultra-high voltage) by instant AC transmission system is accompanied by huge reactive power transmission. When the load drops sharply, it is easy to produce serious power frequency overvoltage, which is also defined as load rejection overvoltage. This paper makes an in-depth analysis from the perspective of voltage increase caused by instantaneous load unloading, and obtains the causes and key influencing factors of load rejection overvoltage. Taking the UHV AC transmission line of a practical project as an example, the suppression effect of the suppression strategy represented by the installation of opening resistance and shunt reactor on the load rejection overvoltage is analyzed. The simulation results show that the above method has an obvious inhibitory effect on load rejection overvoltage. Based on the optimal suppression principle, the optional interval range of the opening resistance and shunt reactor parameters are designed.

1. Introduction

UHV AC transmission lines have the characteristics of high transmission capacity and low energy consumption [1]. It can effectively solve the problems of low transmission capacity [2], high energy consumption, and corridor space shortage of traditional ultra-high voltage transmission lines [3]. UHV transmission technology has significant economic and environmental benefits in long-distance large-scale power transmission and ultra-high voltage power grid interconnection [4].
The characteristics of the UHV AC transmission system are its huge transmission capacity and long transmission distance. At the same time, it is accompanied by a huge reactive power transmission and power distribution problem [5]. The distance from the energy base to the load center is more than 1000 km, which aggravates the electromagnetic transient and overvoltage problems [6,7]. The specific performance is that the capacitance effect is extremely strong, which causes the power frequency overvoltage of the no-load line. In particular, the sudden unloading of load on the line causes serious power frequency overvoltage [8]. If the corresponding countermeasures are not taken, it will undoubtedly have a significant impact on the safe operation of the line. Therefore, it is urgent to study the overvoltage suppression measures of UHV AC transmission lines [9].
In the study of the overvoltage suppression strategy of UHV AC transmission lines, Reference [6] conducted a comprehensive simulation study on the influencing factors of load rejection overvoltage of long-distance UHV transmission lines. Reference [10] simulates the series and shunt reactor compensation, but the voltage level is low. Reference [7] studied the fault characteristics of UHV transmission lines with series capacitor compensation and parallel reactance compensation, which provided a theoretical basis for further overvoltage phenomenon analysis. References [11,12,13] proposed the idea of using a high-voltage shunt reactor for reactive power compensation to limit power frequency load rejection overvoltage. Based on the use of high-voltage shunt reactors, Reference [14] proposed the idea of using metal oxide arresters, circuit breaker shunt resistors, and other measures to limit power frequency/switching overvoltage, and formed a power frequency/switching overvoltage suppression strategy. Reference [15] used the PSCAD/EMTDC platform to construct an integrated single-line and double-line simulation line model for simulation, and concluded that the shunt reactor is installed at the head and end of the line at the same time, and the overvoltage can be suppressed to the ideal level. The above literature has studied the mechanism of UHV load rejection overvoltage and the installation position of the shunt reactor, but has not analyzed the mechanism of switching resistance and shunt reactor to suppress overvoltage in detail, and has not designed the corresponding parameters.
Therefore, this paper aims at the power frequency overvoltage problem of UHV AC transmission lines. Taking the load rejection overvoltage as an example, its generation mechanism is analyzed. The suppression mechanism of switching resistance and shunt reactor on load rejection overvoltage is explored. Based on PSCAD/EMTDC simulation software (Version 4.6.2, Manitoba HVDC Research Centre, Winnipeg, Manitoba, Canada, 2017), taking an actual UHV AC transmission line as an example, a simulation model of a double-circuit long line on the same tower is built. The simulation results show that the opening resistance and shunt reactor have an obvious suppression effect on the load rejection overvoltage, and the optional interval range of the opening resistance and shunt reactor parameters is designed based on the optimal suppression effect.

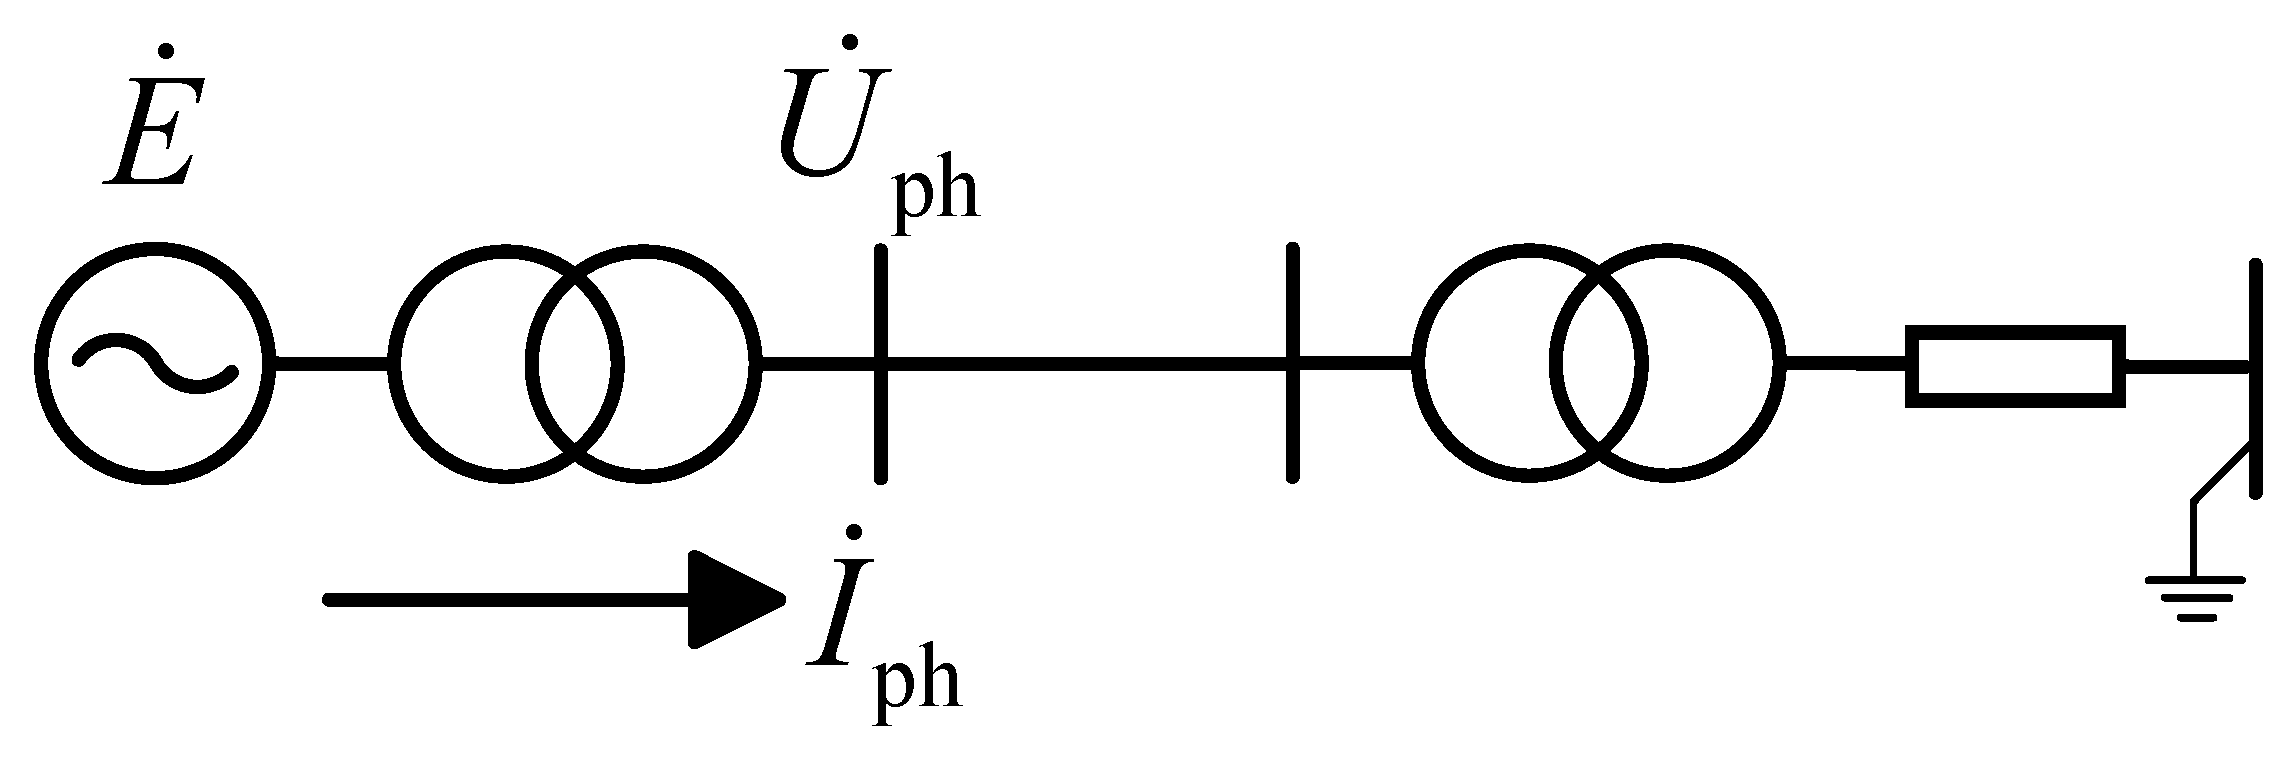
2. Mechanism of Load-Shedding Overvoltage

During the heavy load operation of UHV AC transmission lines, if the circuit breaker at the end of the line is disconnected due to unexpected conditions, a large number of loads are evacuated instantaneously. At this time, the electromagnetic potential of the generator will be higher than the bus voltage. Due to the maintenance of the excitation current, the magnetic flux cannot change immediately. This makes the electromagnetic potential of the generator maintain a high level in a short time, which in turn leads to an increase in line voltage. There is a physical delay in the speed control system and braking equipment of the prime mover. This mechanical equipment, due to its quality and inertia, cannot immediately adjust the running speed when the load is suddenly reduced. Therefore, the voltage and frequency will continue to grow in a short time, further aggravating the power frequency overvoltage [16,17].
The AC transmission line model is shown in Figure 1, and the load-shedding transient electromotive force is shown in Figure 2. When the system is in normal operation, the bus voltage is U ˙ p h , the head current is I ˙ p h , the power factor is cos φ , and the active power P and reactive power Q transmitted on the line are as follows:
P = 3 U ph I ph cos φ Q = 3 U ph I ph sin φ
The electromotive force of the generator is as follows:
E ˙ = j X S I ˙ ph + U ˙ ph E = U ph + I ph X S sin φ 2 + I ph X S cos φ 2
In the case of heavy load, X S is the internal reactance. Its electromotive force E ˙ is greater than the bus voltage U ˙ ph . After the circuit breaker trips and removes the heavy load, the generator still maintains the original electromotive force because the flux linkage cannot mutate. The transient no-load electromotive force E ˙ d = E ˙ can be obtained, so it can be deduced that
E d U ph = U ph + I ph X S sin φ U ph 2 + I ph X S cos φ U ph 2   = 1 + 3 U ph I ph X S Z C sin φ 3 U 2 ph Z C 2 + 3 U ph I ph cos φ 3 U 2 ph Z C 2   = 1 + Q P n X S Z C 2 + P P n X S Z C 2
In the formula, the total impedance Z C is the rated active power P n . In a general system, the capacity of a power transformer and generator is equal, denoted as S ( kVA ) . The internal reactance X S is changed into the unit value X S * based on S , and then
{ X S * = X S S 3 U p h 2 X S Z c = X S * P n S
E d U p h = 1 + Q S X S * 2 + P S X S * 2   = ( 1 + X S * sin φ ) 2 + ( X S * cos φ ) 2
Among them, active power P = S cos φ , and reactive power Q = S sin φ .
It can be seen from Equation (5) that the ratio of bus voltage to transient voltage is related to power factor and internal reactance. Considering the real operating parameters of the system, if the power factor cos φ = 0.85 at this time, the system’s internal resistance per unit value X s * = 0.3 . Substituting into Equation (5), the ratio of transient voltage to bus terminal voltage is 1.186. Since the transient voltage at this time is the same as the voltage under heavy load, E = 1.186 U ph is satisfied.
When the line cuts off the load, the line at this time is called the no-load long line. Considering the capacity rise effect, the length parameter and the active power P transmitted in the early stage of the line should be introduced to calculate the voltage at the end. Assuming that the transmission power of the line before load shedding is P + j Q , the transient potential at the moment of load shedding is as follows [18]:
E d = U 2 cos α l [ m Q + ( 1 X S Z c tan α l ) ] 2 + ( m P ) 2
In the formula m = X S Z C + tan   α ι , U 2 is the terminal voltage of the line; Z c is the characteristic impedance of the line; α is the phase coefficient; X S is the power supply leakage reactance; and l is the length from the beginning of the transmission line. According to Formula (6), it can be seen that under the premise of fixed transmission line and generator parameters, the transient potential of the generator will be affected by the previous transmission power at the moment of discarding the load. When the power transmission reaches its peak, the sudden loss of load will cause a higher transient potential, which may aggravate the problem of power frequency overvoltage.

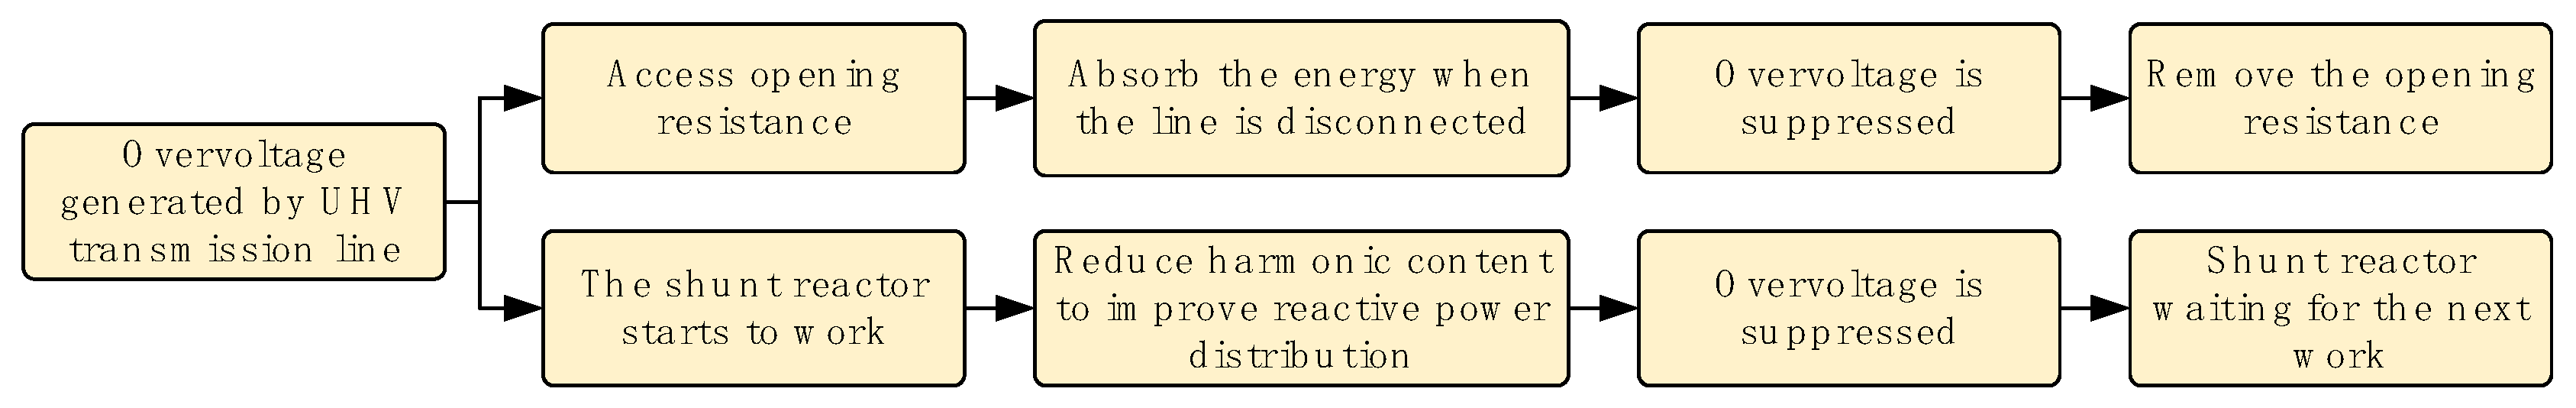
3. Load Rejection Overvoltage Suppression Method

This paper mainly studies the suppression of overvoltage by opening resistance and shunt reactor. The principle flow chart is shown in Figure 3.

3.1. Analysis of the Influence of Opening Resistance on Overvoltage

The application of opening resistance in a power system has an important influence on suppressing overvoltage. When the circuit breaker is switched off, the current in the circuit will be suddenly interrupted, resulting in a higher overvoltage at both ends of the circuit breaker. This overvoltage will not only cause damage to the circuit breaker itself, but also may have a negative impact on the surrounding electrical equipment. In order to effectively suppress this overvoltage, the opening resistor is usually connected to the opening circuit of the circuit breaker.
The function of the opening resistance is mainly to reduce the peak value of the overvoltage by absorbing the energy generated when the circuit is interrupted. When the circuit breaker opens, the current passes through the opening resistance, and the resistance consumes part of the energy, so that the current gradually decreases, thereby avoiding the overvoltage caused by the sudden change in the current. In addition, the opening resistor can also improve the arc extinguishing conditions of the circuit breaker and improve the opening performance of the circuit breaker [19].
Specifically, the resistance and power capacity of the opening resistor need to be selected according to the parameters and requirements of the actual circuit. If the resistance value is too small, the energy consumed by the resistance will be insufficient, and the overvoltage cannot be effectively suppressed. If the resistance is too large, it will cause the resistance to consume too much energy during normal operation and increase the loss of the system. Therefore, the reasonable design of the parameters of the opening resistor is the key to ensuring its effective suppression of overvoltage [20]. The installation principle diagram of the actual resistance of the circuit breaker is shown in Figure 4. After selecting the appropriate opening resistance, the switching time of the opening resistance is often less than 0.5 s. And, in the UHV line, the opening resistance will not be switched repeatedly for a period of time. Therefore, the power consumed on the opening resistor is negligible. In terms of economic benefits, the installation cost of the opening resistor is far less than the cost after the fault shutdown [21].

3.2. Analysis of the Influence of Reactor Compensation Degree on Overvoltage

The influence of reactor compensation degree K B on system overvoltage is an important research topic. The reactor is mainly used for reactive power compensation in the power system to improve the power factor and stability of the system. The compensation degree can be expressed as follows:
K B = Q B Q C
Among them, Q B refers to the reactive power provided by the reactor, and Q C refers to the total reactive power of the system. By reasonably selecting the compensation degree of the reactor, the overvoltage level of the control system can be effectively controlled.
First of all, the appropriate reactor compensation can reduce the harmonic content in the system. Harmonics can cause voltage waveform distortion, which in turn causes overvoltage. By reasonably configuring the compensation degree of the reactor, the generation and propagation of harmonics can be effectively suppressed, thereby reducing the risk of overvoltage [22].
Secondly, the adjustment of reactor compensation can improve the voltage stability of the system. When the system load changes, the appropriate compensation degree can quickly adjust the reactive power, keep the voltage within a reasonable range, and avoid the overvoltage caused by excessive voltage fluctuation. The relationship between K and K B ( K is the ratio of the first terminal voltage U 1 to the terminal voltage U 2 after compensation by the reactor) can be obtained by further exploration:
K = [ K B ( 1 cos θ ) + Q * sin θ + cos θ ] 2 + ( P * sin θ ) 2
In the formula, P * and Q * are the unit values of the active power and reactive power of the load, respectively. The base value is the active power of the UHV transmission line. The power angle of the terminal voltage U 2 is θ [19].
In addition, the reasonable selection of reactor compensation degree can also improve the transient stability of the system [3]. An appropriate compensation degree can quickly provide or absorb reactive power, shorten the voltage recovery time, and reduce the duration of overvoltage. However, if the reactor compensation degree is too high or too low, it will have a negative impact on the system. Excessive compensation may lead to excess reactive power in the system, cause voltage to rise, and even produce a resonance phenomenon, which further aggravates overvoltage. On the contrary, too low a compensation degree cannot effectively suppress overvoltage, and may even lead to system voltage instability.
Therefore, the reasonable selection of the compensation degree of the reactor is of great significance to the overvoltage of the control system. Through accurate calculation and simulation, combined with the actual operation of the system, the best compensation degree can be selected to effectively ensure the safe and stable operation of the power system [23]. The installation principle diagram of the actual resistance of the shunt reactor is shown in Figure 5. After selecting the appropriate opening resistance, the shunt reactor is mainly used for reactive power compensation. In theory, it will not consume active power, which is negligible. In terms of economic benefits, the installation cost of the shunt reactor is far less than the cost after the fault shutdown [24].

4. Simulation Analysis

4.1. Establishment of Simulation Model

Taking the XJ1 double-circuit line as an example, the 1000 kV XJ1 double-circuit line model is the same, and the double-circuit section model is 8 × JL/G1A-630/45. The basic parameters of the 1000 kV XJ1 double-circuit line are shown in Table 1. The main transformer parameters of 1000 kV UHV Xiaoxiang station and Ganjiang station are shown in Table 2. The equivalent power supply internal impedance of 500 kV DG, LY, XC, LC, JX, YF, and 1000 kV JG special nodes is shown in Table 3.
The simulation model is established by PSCAD/EMTDC. PSCAD/EMTDC is a powerful power system simulation software that combines an intuitive graphical user interface (PSCAD) and an electromagnetic transient simulation program (EMTDC). It is widely used to simulate various dynamic behaviors of power systems, providing a rich component library and efficient solution algorithms to help engineers conduct accurate analysis and design. Compared with the Bergeron model of conventional double-circuit lines, the model in this paper considers the coupling and commutation between lines. The tower double-circuit line model built in this paper, including a series of factors such as wire material, number of strands, split wire situation, wire sag situation, soil resistivity, and so on, is considered. The simulation effect is closer to the actual situation. The schematic diagram of the near-area power grid of the 1000 kV XJ1 double-circuit line is shown in Figure 6.
The primary side of the high-voltage GJ station and the high-voltage XJ1 station in the line are equivalent to the power supply model. The rated voltage of the line is 1050 kV and the total length is 341.0054 km. The transmission line is commutated 7 times and 8 monitoring points are placed. The location of the measuring points in the line is shown in Table 4.
A high-voltage circuit breaker is installed at the secondary side access bus of the GJ UHV substation and XJ2 UHV substation. Each switch is equipped with synchronous closing and opening resistors. The circuit breaker is controlled by the time control element, and the opening and closing operations are performed according to the set time.
In the double-circuit line of the XJ1 section, shunt reactors are installed on the GJ side and XX side of each circuit, respectively. In this paper, a grounding strategy is adopted to compensate by connecting a small reactor at the neutral point. In the model, the compensation capacity and compensation degree are changed by setting the parameters of high reactance and neutral point small reactance. The reactor parameters under different compensation degrees are summarized in Table 5.

4.2. Simulation Results Under Different Influencing Factors

This study focuses on the analysis of the overvoltage conditions of 1000 kV UHV transmission lines after load shedding. The model adjusts the breaking resistance of the high-voltage circuit breaker to explore the differential influence of different breaking resistance values on the load rejection overvoltage, and changes the parameters of the reactor to investigate the influence of reactors with different compensation degrees on the load rejection overvoltage.

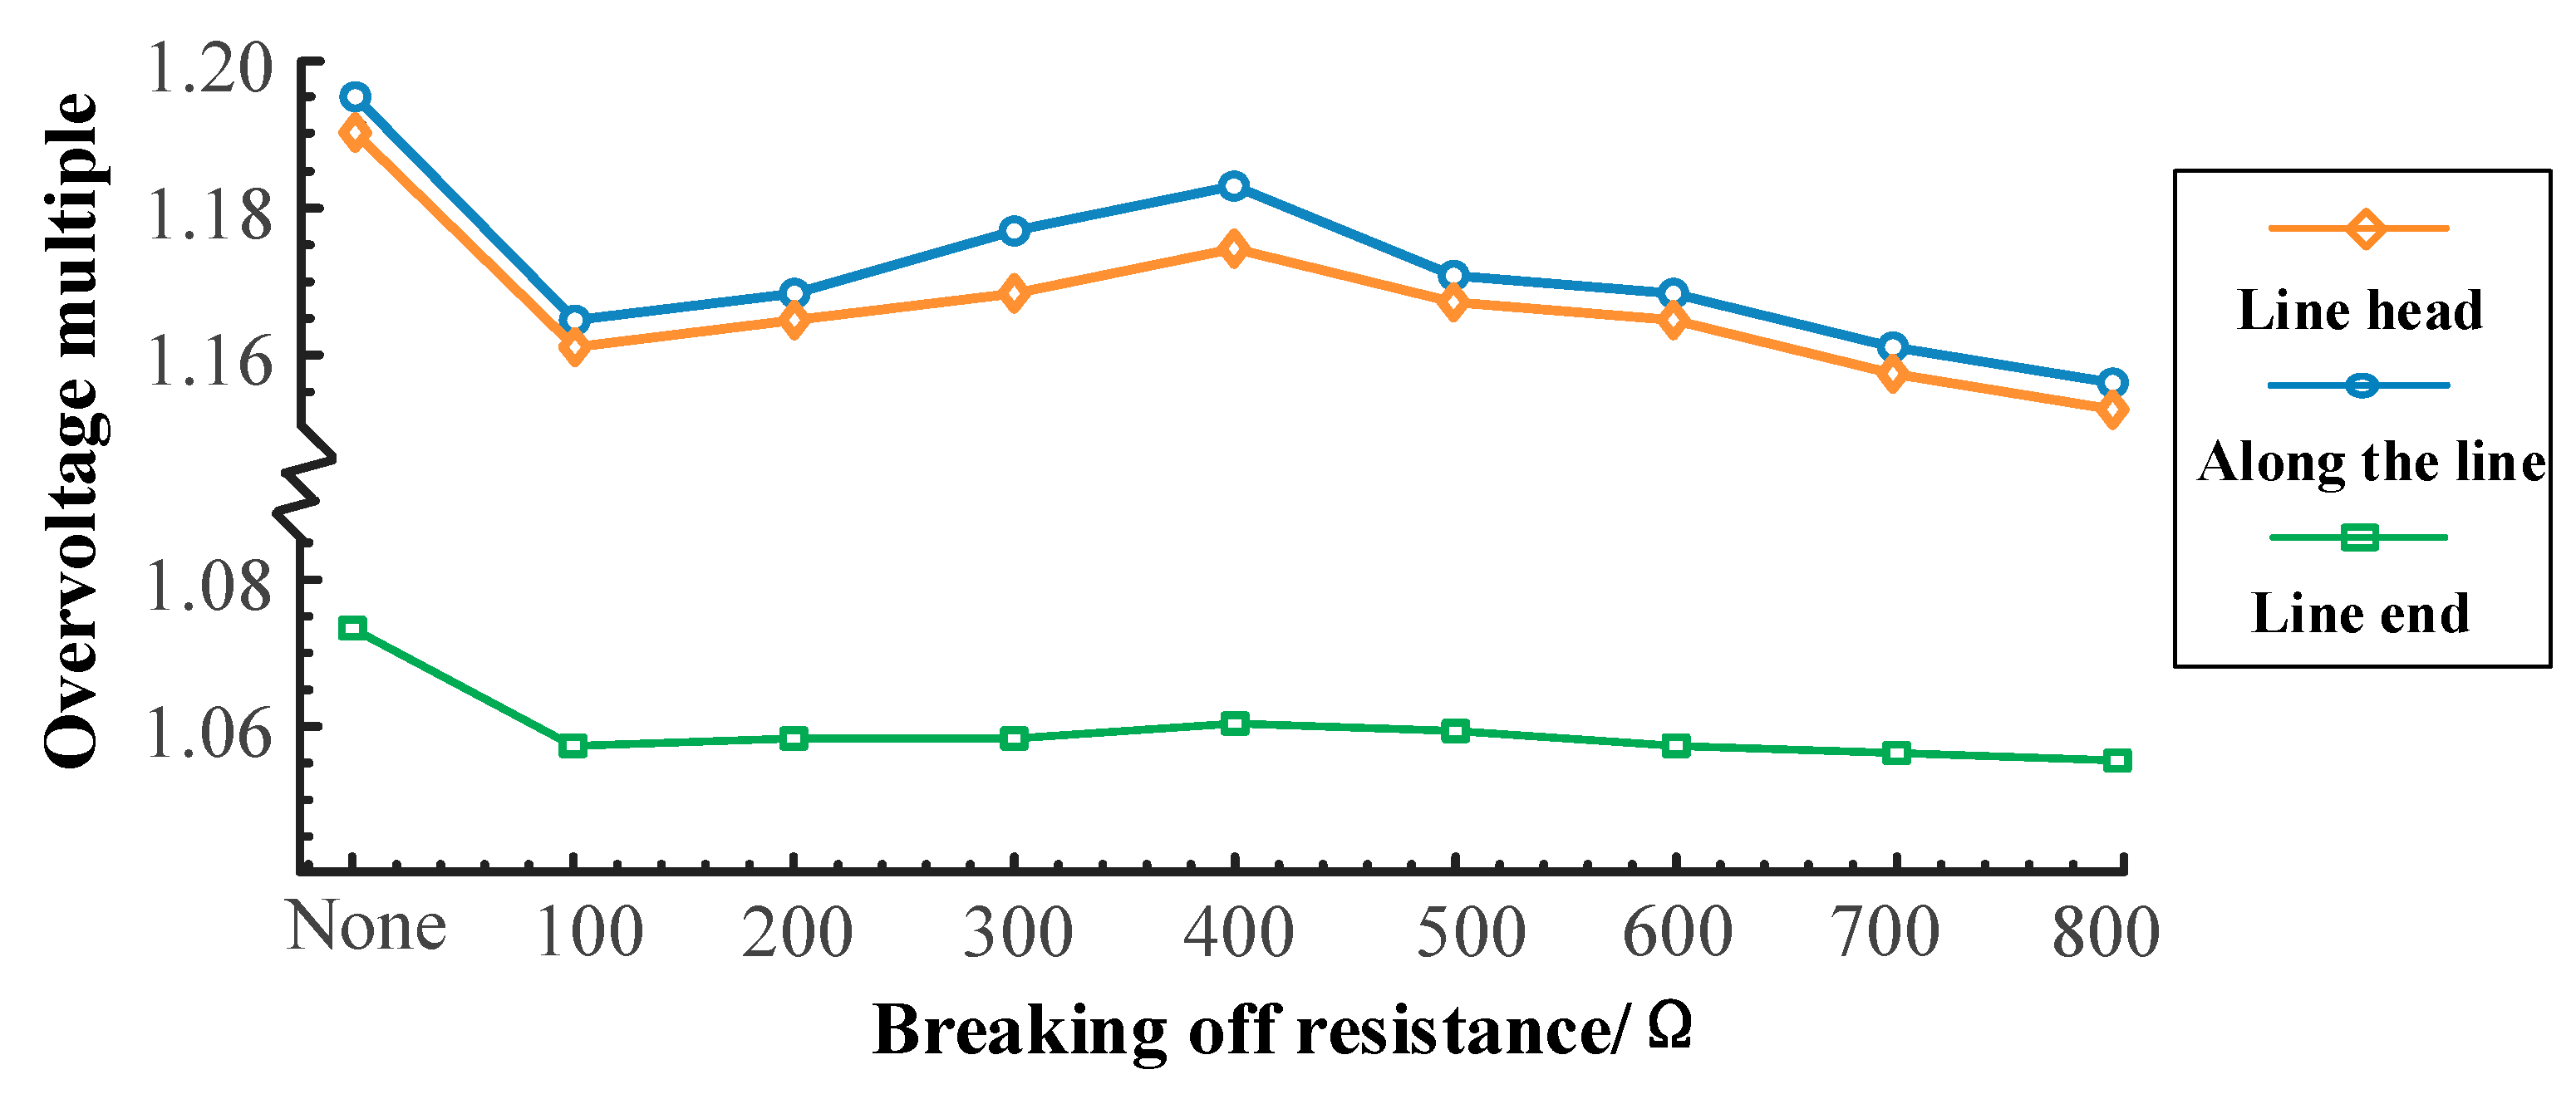
4.2.1. Subsubsection Simulation of the Influence of Opening Resistance on Overvoltage

In order to explore the influence mechanism of the opening resistance on the sudden unloading overvoltage, simulation experiments in various scenarios were carried out. With the increase in resistance, the overvoltage suppression effect of 0~100 Ω opening resistance becomes better. Too small an opening resistance is of limited help to the system, so an opening resistance greater than 100 Ω is studied. The suppression effect of 600 Ω is similar to that of 100 Ω. Although increasing the transition resistance value can obtain a better suppression effect, considering the actual parameters and cost, it is considered that the suppression effect of the opening resistance in 600 Ω~800 Ω can meet the engineering needs.
These tests cover nine operating conditions without opening resistance and with opening resistance set to 100 Ω to 800 Ω. In these simulations, the shunt reactors that are not at the starting and ending points of the line are specifically selected. This is to highlight the unique effects under different resistance values and facilitate comparative analysis. At the same time, in order to ensure the accuracy of the simulation results, all the relevant variables remain unchanged. After three repeated simulations, the average value of the maximum value is taken for statistics. The overvoltage along the line refers to the same as the maximum overvoltage value along the line. The simulation statistics are shown in Table 6, and the statistical diagram is shown in Figure 7.
When the load-shedding operation is carried out without installing the opening resistance, the line will have a large overvoltage. After installing the breaking resistance, the observed overvoltage phenomenon is significantly weakened. The simulation data show that the peak value of overvoltage is closely related to the resistance of breaking resistance. When the resistance value is 0~100 Ω, the overvoltage degree of the line will decrease with the increase in the opening resistance. When the resistance value is 100 Ω~400 Ω, the overvoltage degree of the line will increase with the increase in the opening resistance. There is a minimum point near 100 Ω. Once the resistance value exceeds 400 Ω, the overvoltage level will gradually decrease with the increase in resistance. The overvoltage level at 600 Ω is similar to that at 100 Ω. Therefore, the resistance value that can effectively suppress overvoltage in engineering should be set to 100 Ω or 600 Ω~800 Ω.

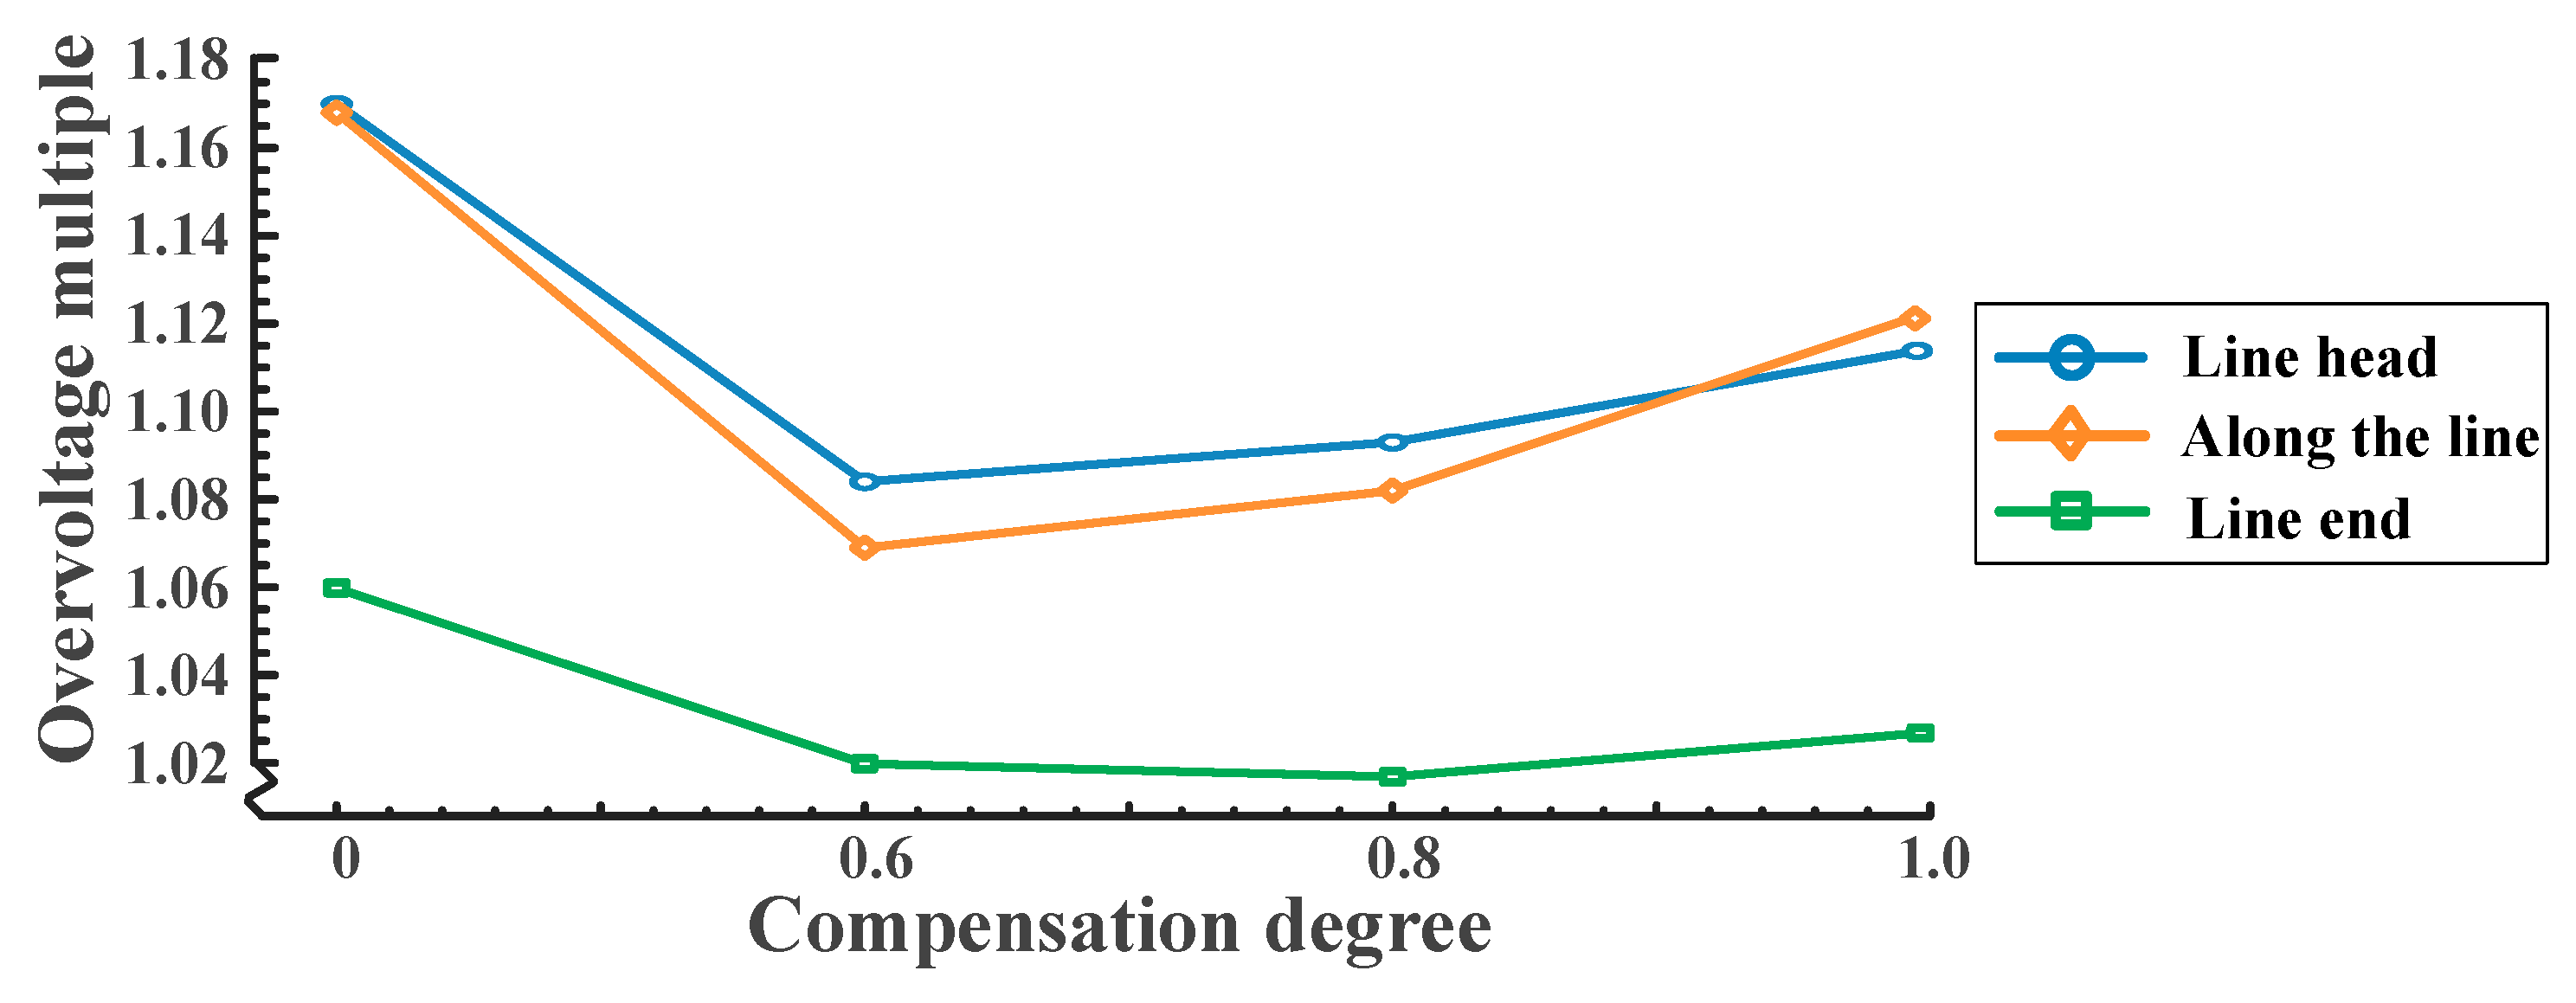
4.2.2. The Influence of Reactor Compensation Degree on Overvoltage

In order to explore the influence of reactor compensation degree on load rejection overvoltage, a series of detailed simulation tests were carried out in this paper. Too low or too high a compensation will not effectively suppress overvoltage, and may even cause system voltage instability. In this paper, representative nodes are selected for discussion. Figure 7 represents the overall trend that the overvoltage level changes with the change in compensation degree. When the compensation degree is 0~0.6, the overall overvoltage suppression effect gets better and better. The overvoltage suppression effect is the best in the range of 0.6~0.8. When the compensation degree is above 0.8, the compensation effect is weakened. Therefore, this paper mainly discusses the compensation degrees 0, 0.6, 0.8, and 1.0.
Four cases of no compensation and compensation degrees of 0.6, 0.8, and 1.0 were set up, respectively. In the experiment, the transmission power was set to 1000 MW, and the opening resistance was set to 600 Ω. The compensation degree of the reactor was changed. After three repeated simulations under each compensation degree, the average value of the maximum value was taken for statistics.
When the line is not compensated, the peak overvoltage at the head of the line can be obtained by simulation to be 1.170 p.u. The maximum overvoltage along the line (located at measuring point 2) is 1.168 p.u. The peak value of overvoltage at the end of the line is 1.058 p.u. When the line compensation degree is 0.6, the simulation results show that the peak overvoltage at the head of the line is 1.084 p.u. The maximum overvoltage along the line (located at measuring point 2) is 1.069 p.u. The peak overvoltage at the end of the line is 1.018 p.u. When the line compensation degree is 0.8, the peak overvoltage at the head end of the line can be obtained by simulation to be 1.093 p.u. The maximum overvoltage along the line (located at measuring point 2) is 1.082 p.u. The peak value of overvoltage at the end of the line is 1.015 p.u. When the line compensation degree is 1.0, the peak overvoltage at the head end of the line can be obtained by simulation to be 1.114 p.u. The maximum overvoltage along the line (located at measuring point 2) is 1.122 p.u. The peak value of overvoltage at the end of the line is 1.025 p.u.
The above simulation results are summarized in Table 7, and the data are plotted to obtain Figure 8.
According to the data analysis obtained from the experiment, the sudden loss of load on the line will lead to the occurrence of overvoltage. Among all the observation points, the overvoltage at the beginning of the line is the highest, reaching a peak of 1.170 p.u. The position of measuring point 2 along the line is immediately followed, and the recorded overvoltage peak reaches 1.168 p.u. The overvoltage at the farthest end of the line is obviously small, and the maximum is only 1.058 p.u. These measured values are within the safety limits, ensuring the stability of the system. The study also reveals the role of shunt reactors in suppressing overvoltage. After the reactor is compensated, the overvoltage level is significantly lower than the uncompensated state. It can be further inferred from the simulation data that the optimal compensation ratio range is 0.6~0.8.

4.2.3. Combination of Two Suppression Methods

As mentioned above, the opening resistor and the shunt reactor have a good effect on suppressing overvoltage. If the two methods are combined to suppress, better suppression results can be obtained. The 600 Ω opening resistance with a good suppression effect and the shunt reactor with a compensation degree of 0.6 were selected to suppress the overvoltage at the same time. Compared with the 600 Ω opening resistance or the shunt reactor with a compensation degree of 0.6 alone, the results are shown in Table 8.
From the table, it can be seen that the mixed suppression method of the two methods, whether at the head end, along the line, or at the end of the line, is better. This method provides a new idea for the suppression of overvoltage.

5. Conclusions

In this paper, the generation mechanism of load-shedding overvoltage in a UHV AC transmission system is discussed. The key factors and suppression measures of load rejection overvoltage in a UHV AC transmission system are studied and determined by constructing a simulation model. The following conclusions are drawn:
(1)
UHV AC transmission system is accompanied by huge reactive power. When the load drops sharply, it is easy to produce serious power frequency overvoltage. Setting appropriate opening resistance value and reactor compensation degree can suppress overvoltage. The two methods can be used at the same time to obtain a better suppression effect.
(2)
The setting value of the opening resistance of the circuit breaker has a significant effect on the overvoltage suppression level. When the opening resistance is 100 Ω, the load rejection overvoltage level is at the minimum value. When the opening resistance is greater than 400 Ω, the load rejection overvoltage level decreases slowly with the increase in resistance. In the project, the use of 100 Ω or 600 Ω~800 Ω opening resistor can effectively reduce the overvoltage phenomenon.
(3)
The compensation degree of the reactor has a significant effect on the overvoltage suppression level. When the compensation degree is in the range of 0.6~0.8, the line load rejection overvoltage suppression effect is the best.
Restricted by actual conditions, real experimental test results are lacking in this paper. In the future, experiments will be carried out in cooperation with the Grid Corporation to verify the rationality of the proposed scheme.

Author Contributions

Conceptualization, G.S.; data curation, G.S. and W.M.; formal analysis, D.X. and H.L.; funding acquisition, Y.D. and R.C.; investigation, Y.D.; methodology, G.S. and Y.W.; resources, G.S. and R.C.; software, W.M. and D.X.; supervision, H.L.; writing—original draft, Y.W.; writing—review and editing, Y.W. and Y.D. All authors have read and agreed to the published version of the manuscript.

Funding

This research was funded by the National Natural Science Foundation of China, grant number 51877084. The funder is Yixing Ding.

Data Availability Statement

Data are contained within the article.

Conflicts of Interest

Authors Guanqun Sun, Wang Ma, Dian Xu, Haiguang Liu and Rusi Chen were employed by the company State Grid Hubei Electric Power Research Institute, Wuhan, China. The remaining authors declare that the research was conducted in the absence of any commercial or financial relationships that could be construed as a potential conflict of interest.

References

  1. Sun, C.W.; Min, J.L. Dynamic trends and regional differences of economic effects of ultra-high-voltage transmission projects. Energy Econ. 2024, 138, 107871. [Google Scholar] [CrossRef]
  2. Fan, X.; Zhang, Y.H.; Su, L.N.; Liu, H.Y.; Cui, R.; Wei, Y.Z. Research on Short Circuit Current Control in Multi-infeed DC Receiving Power Grid. AC/DC Oper. 2018, 46, 61–67. [Google Scholar]
  3. Gan, F.; Wu, J.; Wang, K.; Zhao, Y.; Zhu, X.D. Research on the social benefit evaluation method of UHV power grid. Power Syst. Prot. Control 2016, 44, 12–17. [Google Scholar]
  4. Sun, K.; Yi, Q.; Dong, C.W.; Zhou, H. Research on Power Frequency Over-Voltage in UHV AC Transmission Lines. Power Syst. Technol. 2010, 34, 30–35. [Google Scholar]
  5. Xie, D.; Lin, C.X.; Deng, Q.L.; Lin, H.J.; Cai, C.S.; Thomas, B.; Ge, X.L. Simple Vector Calculation and Constraint-Based Fault-Tolerant Control for a Single-Phase CHBMC. IEEE Trans. Power Electron. 2025, 40, 2028–2041. [Google Scholar] [CrossRef]
  6. Huang, J.; Wang, G.; Li, H.F.; Han, F.X. Study on simulation of fundamental frequency overvoltage for UHV AC transmission lines. Relay 2007, 35, 32–39. [Google Scholar]
  7. Chen, S.M.; Xu, W.; He, J.L. Research on Power Frequency Transient Overvoltage in 1000kV UHV AC Transmission Line. Power Syst. Technol. 2005, 29, 1–5. [Google Scholar]
  8. Chai, X.Z.; Zeng, R.; Liang, X.D.; Sun, J.H.; Hao, J.J. Design and Planning Method for Series-compensated Power Transmission System Considering Power-frequency Overvoltage and Transient Stability. High Volt. Eng. 2015, 41, 3407–3413. [Google Scholar]
  9. Liu, Q.H.; Yu, J.W.; Chen, H.; Qin, Y. Studies on series compensation of UHV transmission line. In Proceedings of the 2010 International Conference on Power System Technology, Hangzhou, China, 24–28 October 2010. [Google Scholar]
  10. Amreiz, H.; Janbey, A.; Darwish, M. Emulation of Series and Shunt Reactor Compensation. In Proceedings of the 2020 55th International Universities Power Engineering Conference (UPEC), Turin, Italy, 1–4 September 2020. [Google Scholar]
  11. Su, X.L. Analysis of power frequency overvoltage of UHV AC transmission line and its suppression. Electron. Test 2016, 23, 140. [Google Scholar]
  12. Wang, X.T.; Xiang, Z.T.; Ban, L.G.; Zhang, Y.Y.; Han, B. Secondary Arc Current in 1000 kV Double-Circuit Long-Distance AC Transmission Lines on the Same Tower Under Heavy Power Flow and Its Restrictive Measures. Power Syst. Technol. 2013, 37, 3001–3006. [Google Scholar]
  13. Zhang, W. Analysis of Tripping Position Anomaly of Ultra-high Voltage Line Overvoltage Protection Circuit Breaker. Electr. Eng. 2024, 9, 168–169+173. [Google Scholar]
  14. Du, B.X.; Zhang, Y.P.; Tian, M.X.; Dong, H.Y.; Zhao, Y.K. Research on Compensation Degree of UHV Controllable Shunt Reactor. High Volt. Appar. 2010, 46, 5–8+11. [Google Scholar]
  15. Rui, Z.K. Study on the Mechanism of Generating Frequency Overvoltage of UHV Transmission Line and Its Suppression Measures. Master’s Thesis, Shandong University of Science and Technology, Qingdao, China, 2017. Volume 6. [Google Scholar]
  16. Chen, L.; Liu, H.J.; Wu, M.; Wei, D.L.; Niu, M. Study on Compensation for Secondary Arc Current on UHV Double-Circuit Lines. In Proceedings of the 2011 Asia-Pacific Power and Energy Engineering Conference, Wuhan, China, 25–28 March 2011. [Google Scholar]
  17. Xu, L.Y.; Zhang, Y.X.; Xue, S.M. Overvoltage superposition and protection caused by load shedding of UHV transmission lines. Electr. Power 2011, 44, 6–10. [Google Scholar]
  18. Yin, Z.F. Power Frequency Overvoltage Suppression of UHV AC Transmission Line. Shandong Electr. Power 2014, 41, 24–28. [Google Scholar]
  19. Meng, F.T.; He, B.N.; Liu, H.; Wu, S.; Liu, Y.; Dai, W.H.; Wang, S.; Dong, Y.C. TRV Suppression Measures of Controllable Hybrid Reactive Power Compensation Lines. South. Power Syst. Technol. 2024, 18, 1–11. [Google Scholar]
  20. Sun, S. Summary of Research on Overvoltage Characteristics and Suppression Technology of Power Cable Operation. J. New Ind. 2019, 9, 28–31. [Google Scholar]
  21. Li, Y.; Zhou, H.; Shen, Y.; Sun, K. Comparative Study on Measures to Limit Load-Rejection Opening Overvoltage of Long-Distance and Large-Capacity UHVAC Transmission Lines. Grid Technol. 2013, 37, 3564–3570. [Google Scholar]
  22. Kong, C.R.; Zhan, X.W.; Wen, H.P.; Zhou, H.; Li, W.J.; Peng, C.Z. Resonance Analysis and Counter measure Research of 10kV Shunt Capacitor. Mach. Electron. 2024, 42, 3–7. [Google Scholar]
  23. Zhao, Y.S. The Research on Over-Voltage and Restrain Strategy for UHV Transmission Line. Master’s Thesis, Southwest Jiaotong University, Chengdu, China, 2009. Volume 6. [Google Scholar]
  24. Zhang, B.H.; Xi, Z.Y.; Hu, W.H.; Cui, D.W.; Chen, C.W. Application and Significance of 500 kV Dry-Type Shunt Reactor Technologyin Brazil. Int. Stand. 2024, z1, 49–55. [Google Scholar] [CrossRef]
Figure 1. Schematic diagram of AC system.
Electronics 14 00619 g001
Figure 2. Load-shedding transient electromotive force.
Electronics 14 00619 g002
Figure 3. Flow chart of overvoltage suppression principle.
Electronics 14 00619 g003
Figure 4. Installation diagram of closing/opening resistance.
Electronics 14 00619 g004
Figure 5. The schematic diagram of the installation of the reactor at the head and end of the line.
Electronics 14 00619 g005
Figure 6. Schematic diagram of the 1000 kV XJ1 double circuit near the area power grid.
Electronics 14 00619 g006
Figure 7. The influence of opening resistance on the maximum overvoltage.
Electronics 14 00619 g007
Figure 8. The influence of reactor compensation degree on system overvoltage.
Electronics 14 00619 g008
Table 1. Per-unit value of power frequency parameters of 1000 kV line.
Line NameLength (km)Per Unit Quantity (Un = 1050 kV, S = 100 MVA)
R1X1B1R0X0B0
XJ1 Line I340.840.0002720.00805317.1175840.0046620.02273210.152498
XJ1 Line II341.170.0002720.00804317.1343580.0046880.02271410.162446
Table 2. Main transformer parameters of 1000 kV UHV station.
Transformer NameCapacity (MVA)Per Unit Quantity (Ub = 1050 kV, Sb = 3000 MVA)
X1-2X1-3X2-3PFePCu
XX1#30000.17990.61340.39950.0001480.0012
XX2#30000.17950.62070.39990.0001480.0012
GJ1#30000.17990.61920.40010.0001650.0012
GJ2#30000.18000.62070.39960.0001650.0012
Table 3. Related node equivalent internal impedance of power supply.
Nodal PointResistance (Ω)Reactance (H)
500 kV DG0.5940.045
500 kV LY0.3160.026
500 kV XC0.3860.027
500 kV LC0.6580.041
500 kV JX0.7780.038
500 kV YF0.9030.053
1000 kV JM0.3940.035
Table 4. A list of the location of measuring points in the line.
Three-Phase Measuring PointE1FE2FE3FE4FE5FE6FE7FE8F
Single-phase Measuring pointE1A
E1B
E1C
E2A
E2B
E2C
E3A
E3B
E3C
E4A
E4B
E4C
E5A
E5B
E5C
E6A
E6B
E6C
E7A
E7B
E7C
E8A
E8B
E8C
Location063.917152.002170.585202.058258.691296.613341.005
TypeHeadCommutationCommutationMidpointSplit placeMerge placeCommutationEnd
Table 5. Reactor parameter setting.
High Reactance L1 (H)Low Reactance L2 (H)Compensation DegreeCompensation Capacity (Mvar)
0000
3.9941.28040.6540
5.3251.77130.8720
6.6562.14131.0900
Table 6. Line overvoltage under different opening resistors (unit: p.u.).
Opening ResistanceNone100 Ω200 Ω300 Ω400 Ω500 Ω600 Ω700 Ω800 Ω
Head1.1931.1681.1711.1781.1831.1731.1711.1651.161
Along the line1.1891.1661.1631.1711.1761.1701.1681.1621.158
End1.0681.0521.0531.0531.0551.0541.0521.0511.050
Table 7. Influence of reactor compensation degree on line voltage (unit: p.u.).
ReactorLine HeadAlong the LineLine End
No compensation1.1701.1681.058
Compensation degree 0.61.0841.0691.018
Compensation degree 0.81.0931.0821.015
Compensation degree 1.01.1141.1221.025
Table 8. Comparison of three methods of suppressing overvoltage (unit: p.u.).
TypeOpening Resistance (600 Ω) and Reactor (Compensation Degree 0.6)Opening Resistance (600 Ω)Reactor (Compensation Degree 0.6)
Position
Line head1.0471.1711.084
Along the line1.0571.1681.069
Line end1.0141.0521.018
Disclaimer/Publisher’s Note: The statements, opinions and data contained in all publications are solely those of the individual author(s) and contributor(s) and not of MDPI and/or the editor(s). MDPI and/or the editor(s) disclaim responsibility for any injury to people or property resulting from any ideas, methods, instructions or products referred to in the content.

