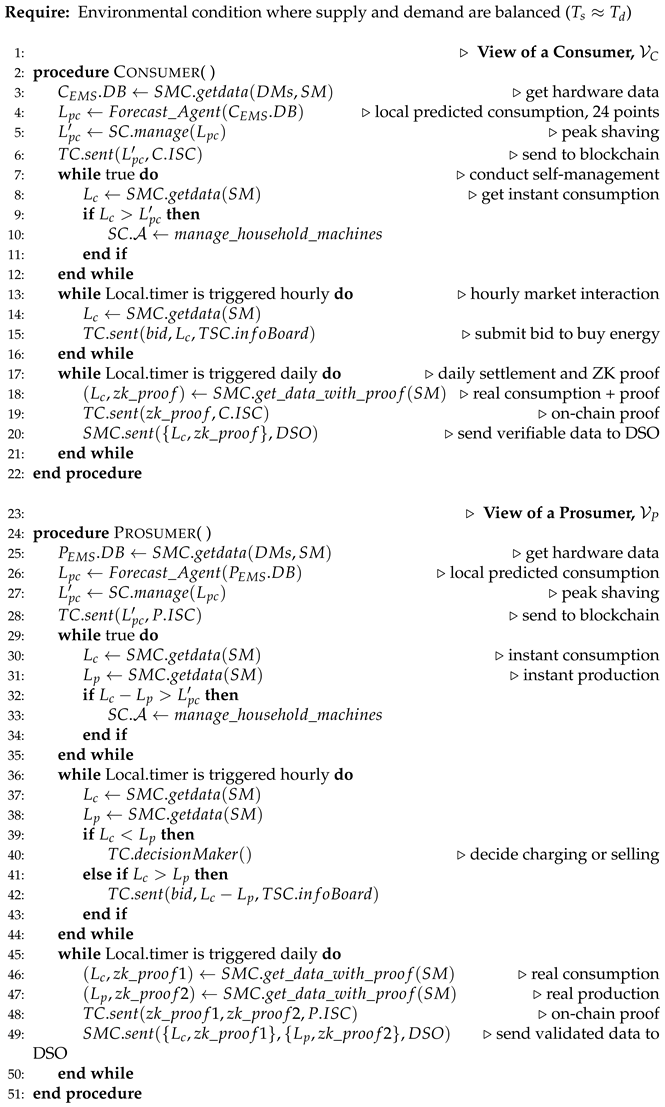
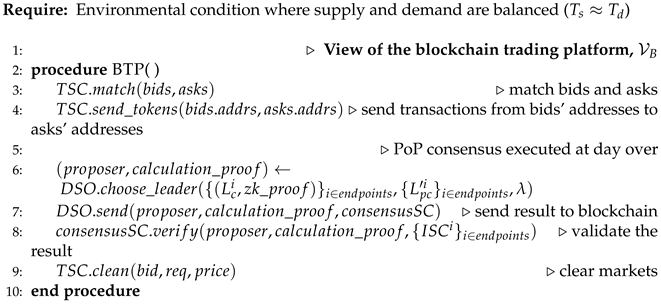
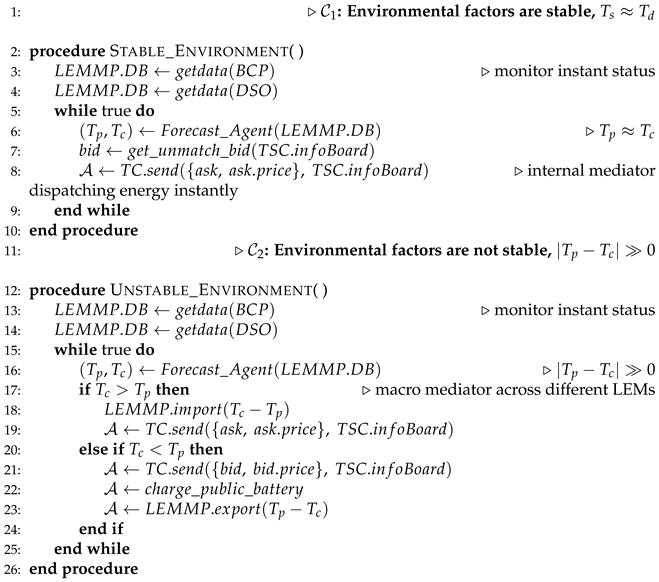
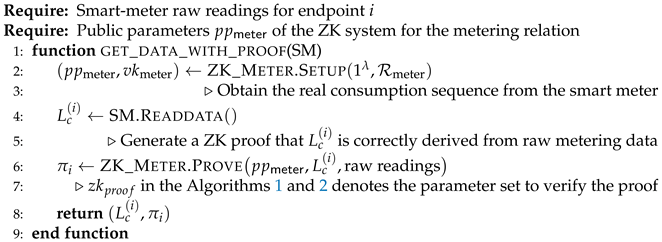
In this section, we implement a microgrid-scale prototype consisting of 16 grid endpoints, based on the design proposed in
Section 3.2. To enhance the realism of the simulation, the endpoints include 5 consumers with heterogeneous energy consumption capacities, 10 prosumers with varying generation capacities and one national grid endpoint that jointly represents the roles of the LPD and the DSO. The selected market assets comprise the household asset of each grid endpoint, of which prosumers employ solar panels as their primary generation units, supplemented by batteries and smart meters. The energy trading market is collectively owned and maintained by all grid endpoints, with the optimization objectives defined in
Section 3.1. In the implementation, we configure 16 grid endpoint threads, each encapsulating the EMS logic associated with its designated role (consumer, prosumer, or LPD/DSO). We design a main thread to coordinate all endpoint threads and simulate the overall system workflow. To avoid excessive computational load on individual execution threads, we only store essential data in smart contracts without letting it execute complex calculation logic, thereby avoiding the resource exhaustion and high gas costs that would otherwise arise from running smart contracts at each endpoint. All on-chain functionalities are implemented on a private Ethereum blockchain [
38]. Next, we analyze the proposed trading infrastructure from two perspectives, the EMS and the on-chain level, in terms of their contribution and optimization effects on grid stability. The EMS perspective illustrates the local view of an individual grid endpoint, while the on-chain perspective evaluates the interaction processes among all grid endpoints.
5.1. EMS Perspective: Local Contribution for Grid Stability
In
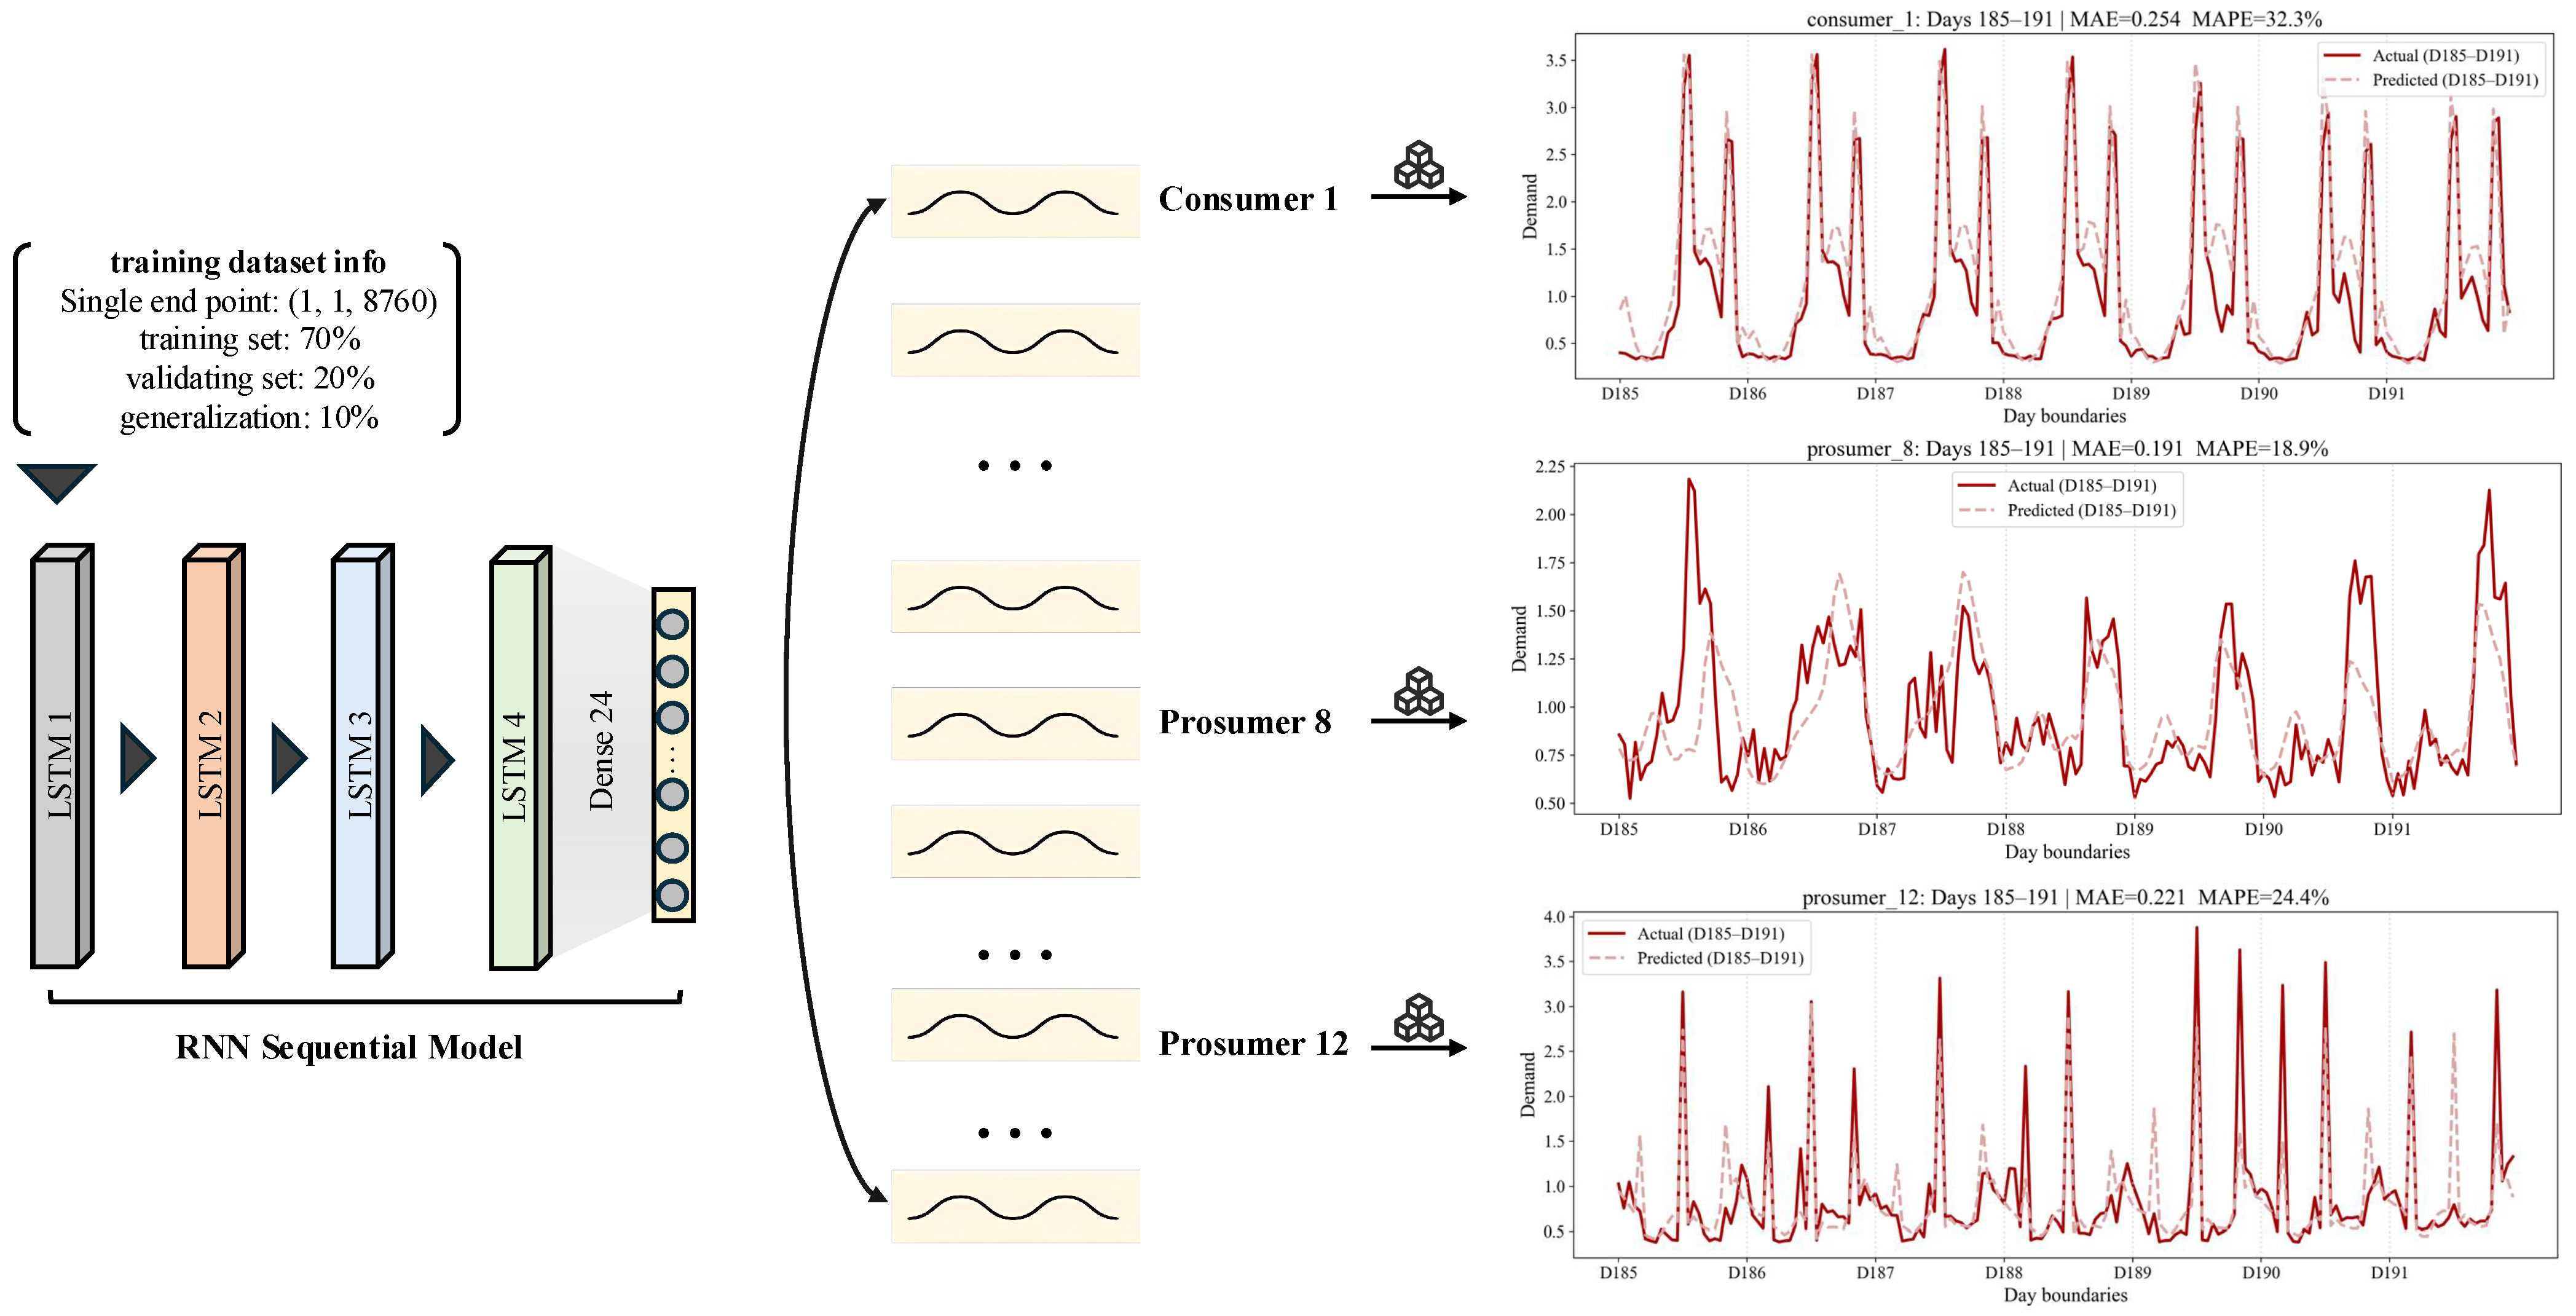
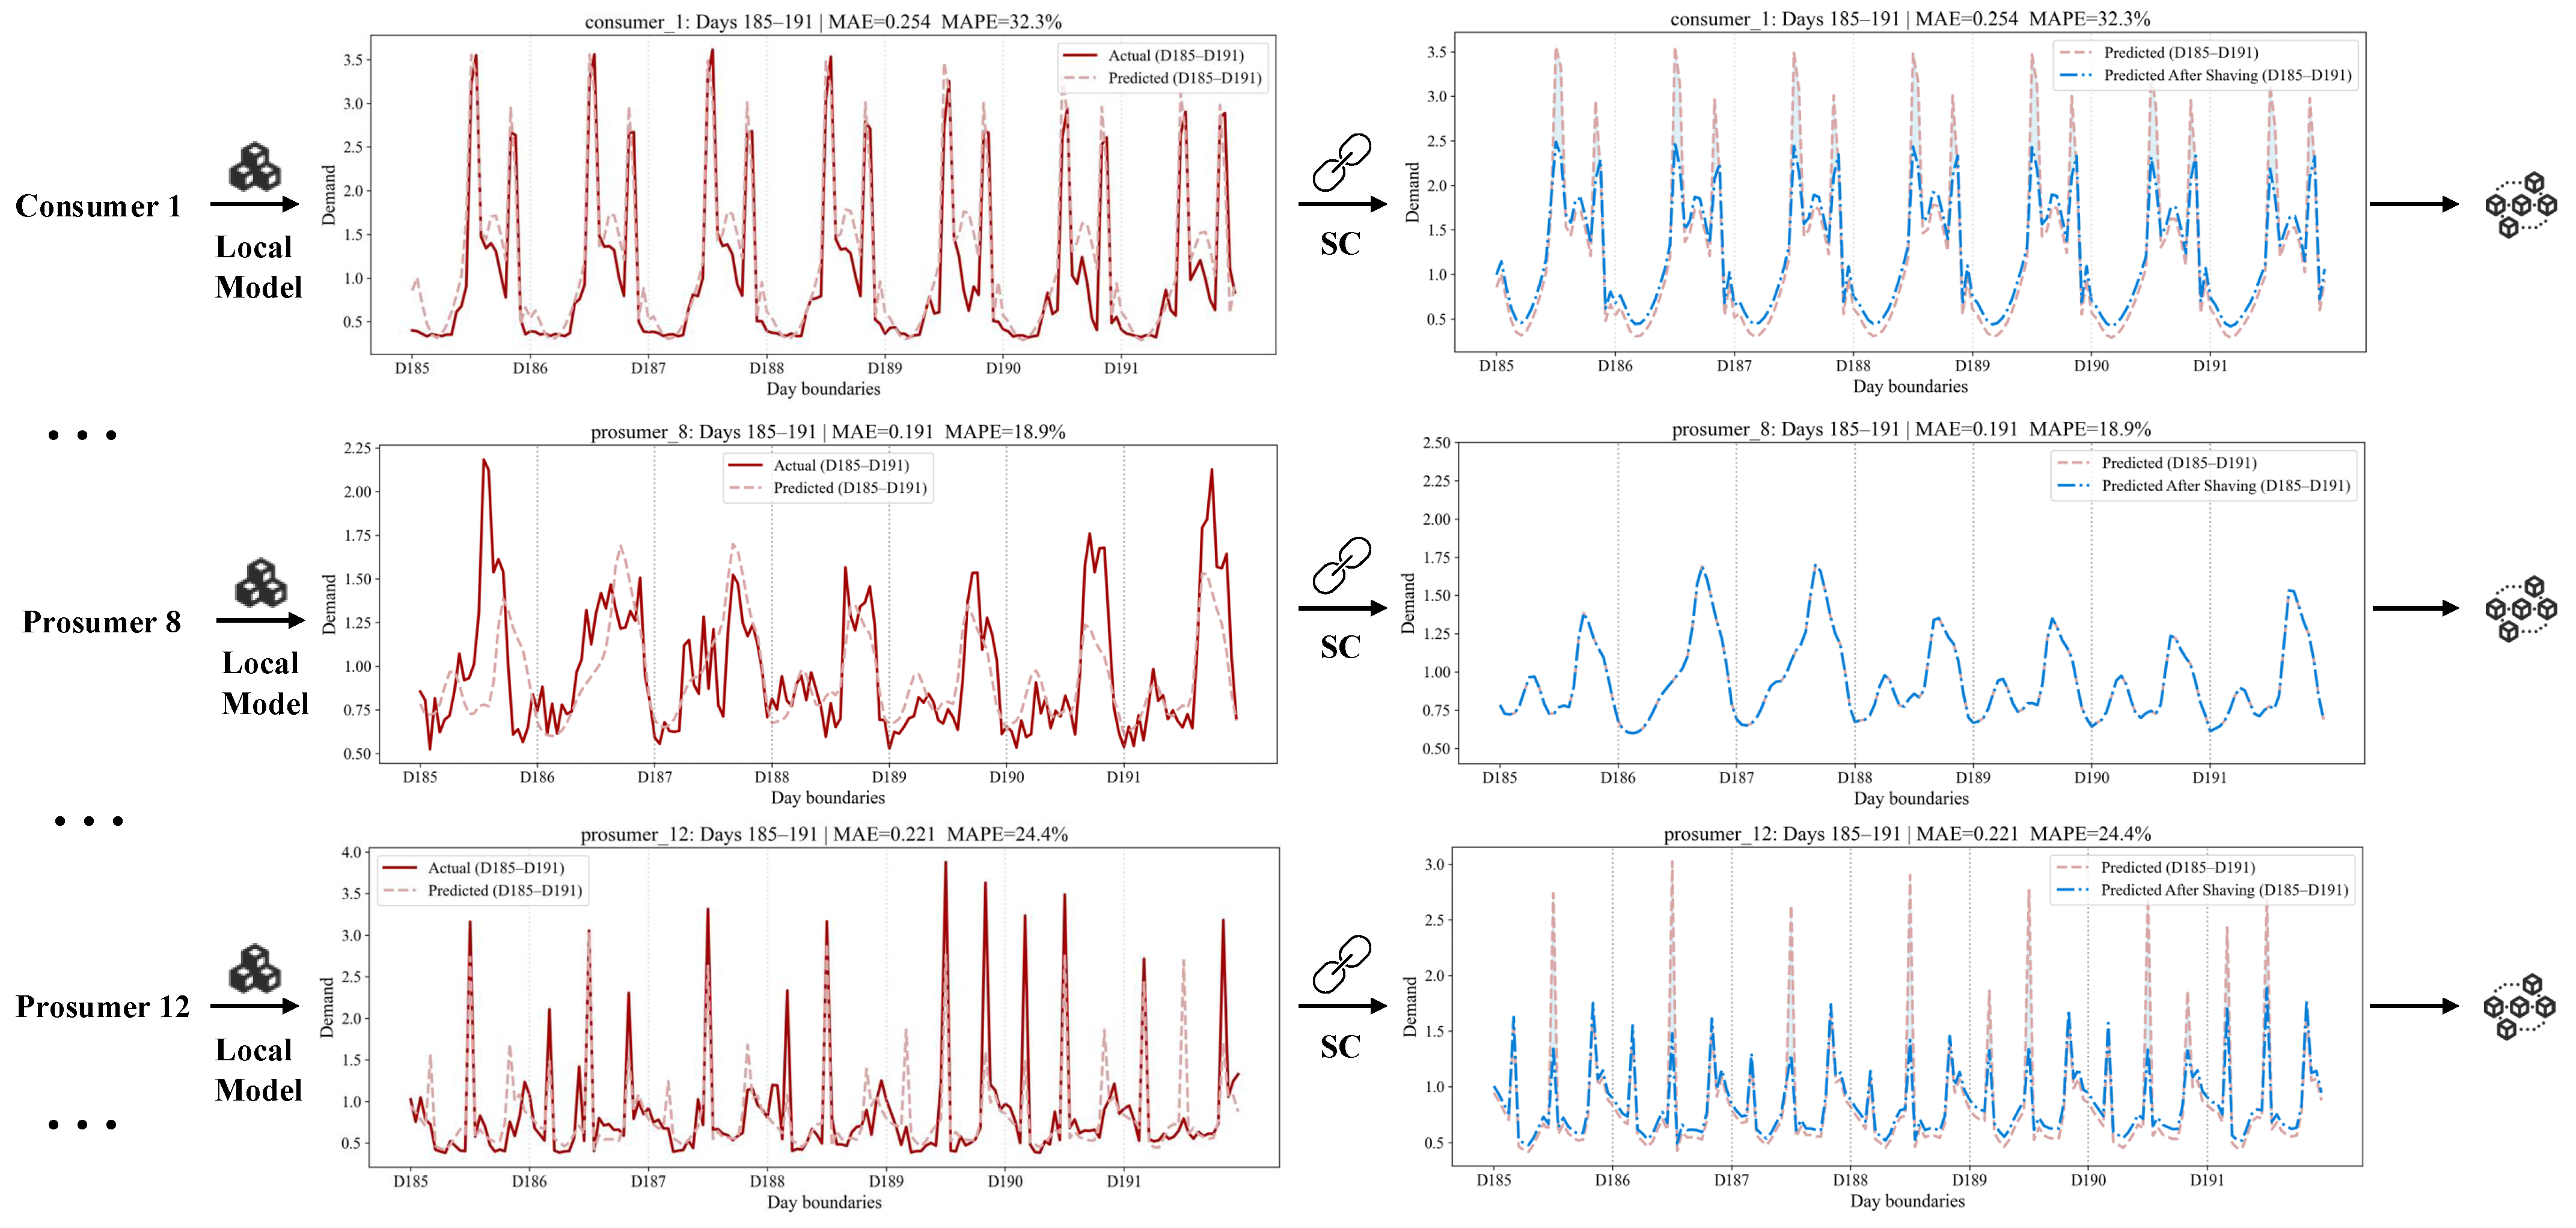
Section 3.2, we describe the detailed workflow of the EMS deployed at each grid endpoint and explain how self-management is achieved through blockchain-based incentive mechanisms. The EMS logic consists primarily of a forecasting component, an SC component, and a TC component. To improve prediction accuracy under noisy data while minimizing thread overhead, we implement a lightweight predictive model based on a deep recurrent neural network with Long Short-Term Memory (LSTM) units to forecast the 24-h electricity consumption of the following day. The model consists of four stacked LSTM layers, each with 50 hidden units, as shown in the
Figure 4 (left part). To mitigate overfitting, we apply a dropout rate of 0.2 after the first LSTM layer. A fully connected dense layer maps the learned temporal representations to the predicted consumption values. Each EMS thread first reads one year of simulation data to train its local model, which is subsequently adopted as part of the forecasting component. We split one year of load and generation traces per endpoint into 80% training and 20% validation, and train for 50 epochs with a batch size of 32 and a learning rate of
. The model consists of only four LSTM layers with 50 hidden units and a dropout rate of 0.2, which is a compact architecture suitable for embedded environments. Despite its small size, the model converges efficiently: the final training loss reaches approximately
on average, while the validation loss stabilizes around
on average, indicating good generalization performance. As shown in
Figure 4 (right part), we evaluate the locally trained models for each endpoint. The light red dashed lines represent the predicted 24-h load profiles generated by the predictive model, while the dark red solid lines indicate the actual consumption data for the corresponding day. The model achieves reliable feature extraction, maintaining a mean absolute percentage error (MAPE) in the range of 10–35% across daily forecasts.
To mitigate voltage fluctuations in the power grid, we adopt a rule-based peak shaving mechanism within the SC component to enforce the self-management objectives of each endpoint. Specifically, based on the data output of the forecasting component, the SC component identifies two typical peak demand windows in each daily load curve, corresponding to 11:00–13:00 and 17:00–21:00. During these intervals, if the consumption of a single hour exceeds 10% of the total daily demand [
39], the forecasted demand values are proportionally reduced by a shaving factor
. The curtailed energy is then redistributed uniformly across the remaining non-peak hours, thereby alleviating load peaks while preserving the total daily consumption. This mechanism avoids a degradation of prediction accuracy while ensuring sufficient energy availability for endpoint production activities. The adjusted forecasted values are subsequently output to the blockchain as the endpoint’s prediction for the following day. The peak-shaving optimization effect of the SC component on the forecasted values is illustrated in the
Figure 5. As shown in the right part, the red dashed line represents the 24-h electricity consumption generated by the forecasting component, while the blue dashed line denotes the optimized 24-h forecasted values produced by the SC component and submitted to the blockchain’s corresponding ISC smart contracts. For endpoints with highly uneven consumption distributions, such as consumer 1 and prosumer 12 in the
Figure 5, the SC component effectively redistributes consumption during rush hours. This adjustment establishes a self-management goal that contributes to grid voltage stability and reduces power fluctuations at the endpoints.
5.2. On-Chain Perspective: Global Interaction and Grid Stability
In the last section, we describe the detailed dataflow and workflow of each grid endpoint equipped with an EMS. Once the daily timer is triggered, the TC component of each EMS submits the optimized forecasted data for the following day to the blockchain. At the start of the next day, all grid endpoints adjust their behavior according to their actual consumption patterns in order to increase their probability of being elected as the next day’s block proposer (or leader) and to participate in energy trading. At each EMS endpoint, we configure 11 household devices that can be controlled and adjusted through the SC component to enable self-management of grid endpoints, including television, heat pump, lamps, dishwasher, washing machine, microwave, oven, electric water heater, vacuum cleaner, laptop, and tumble dryer.
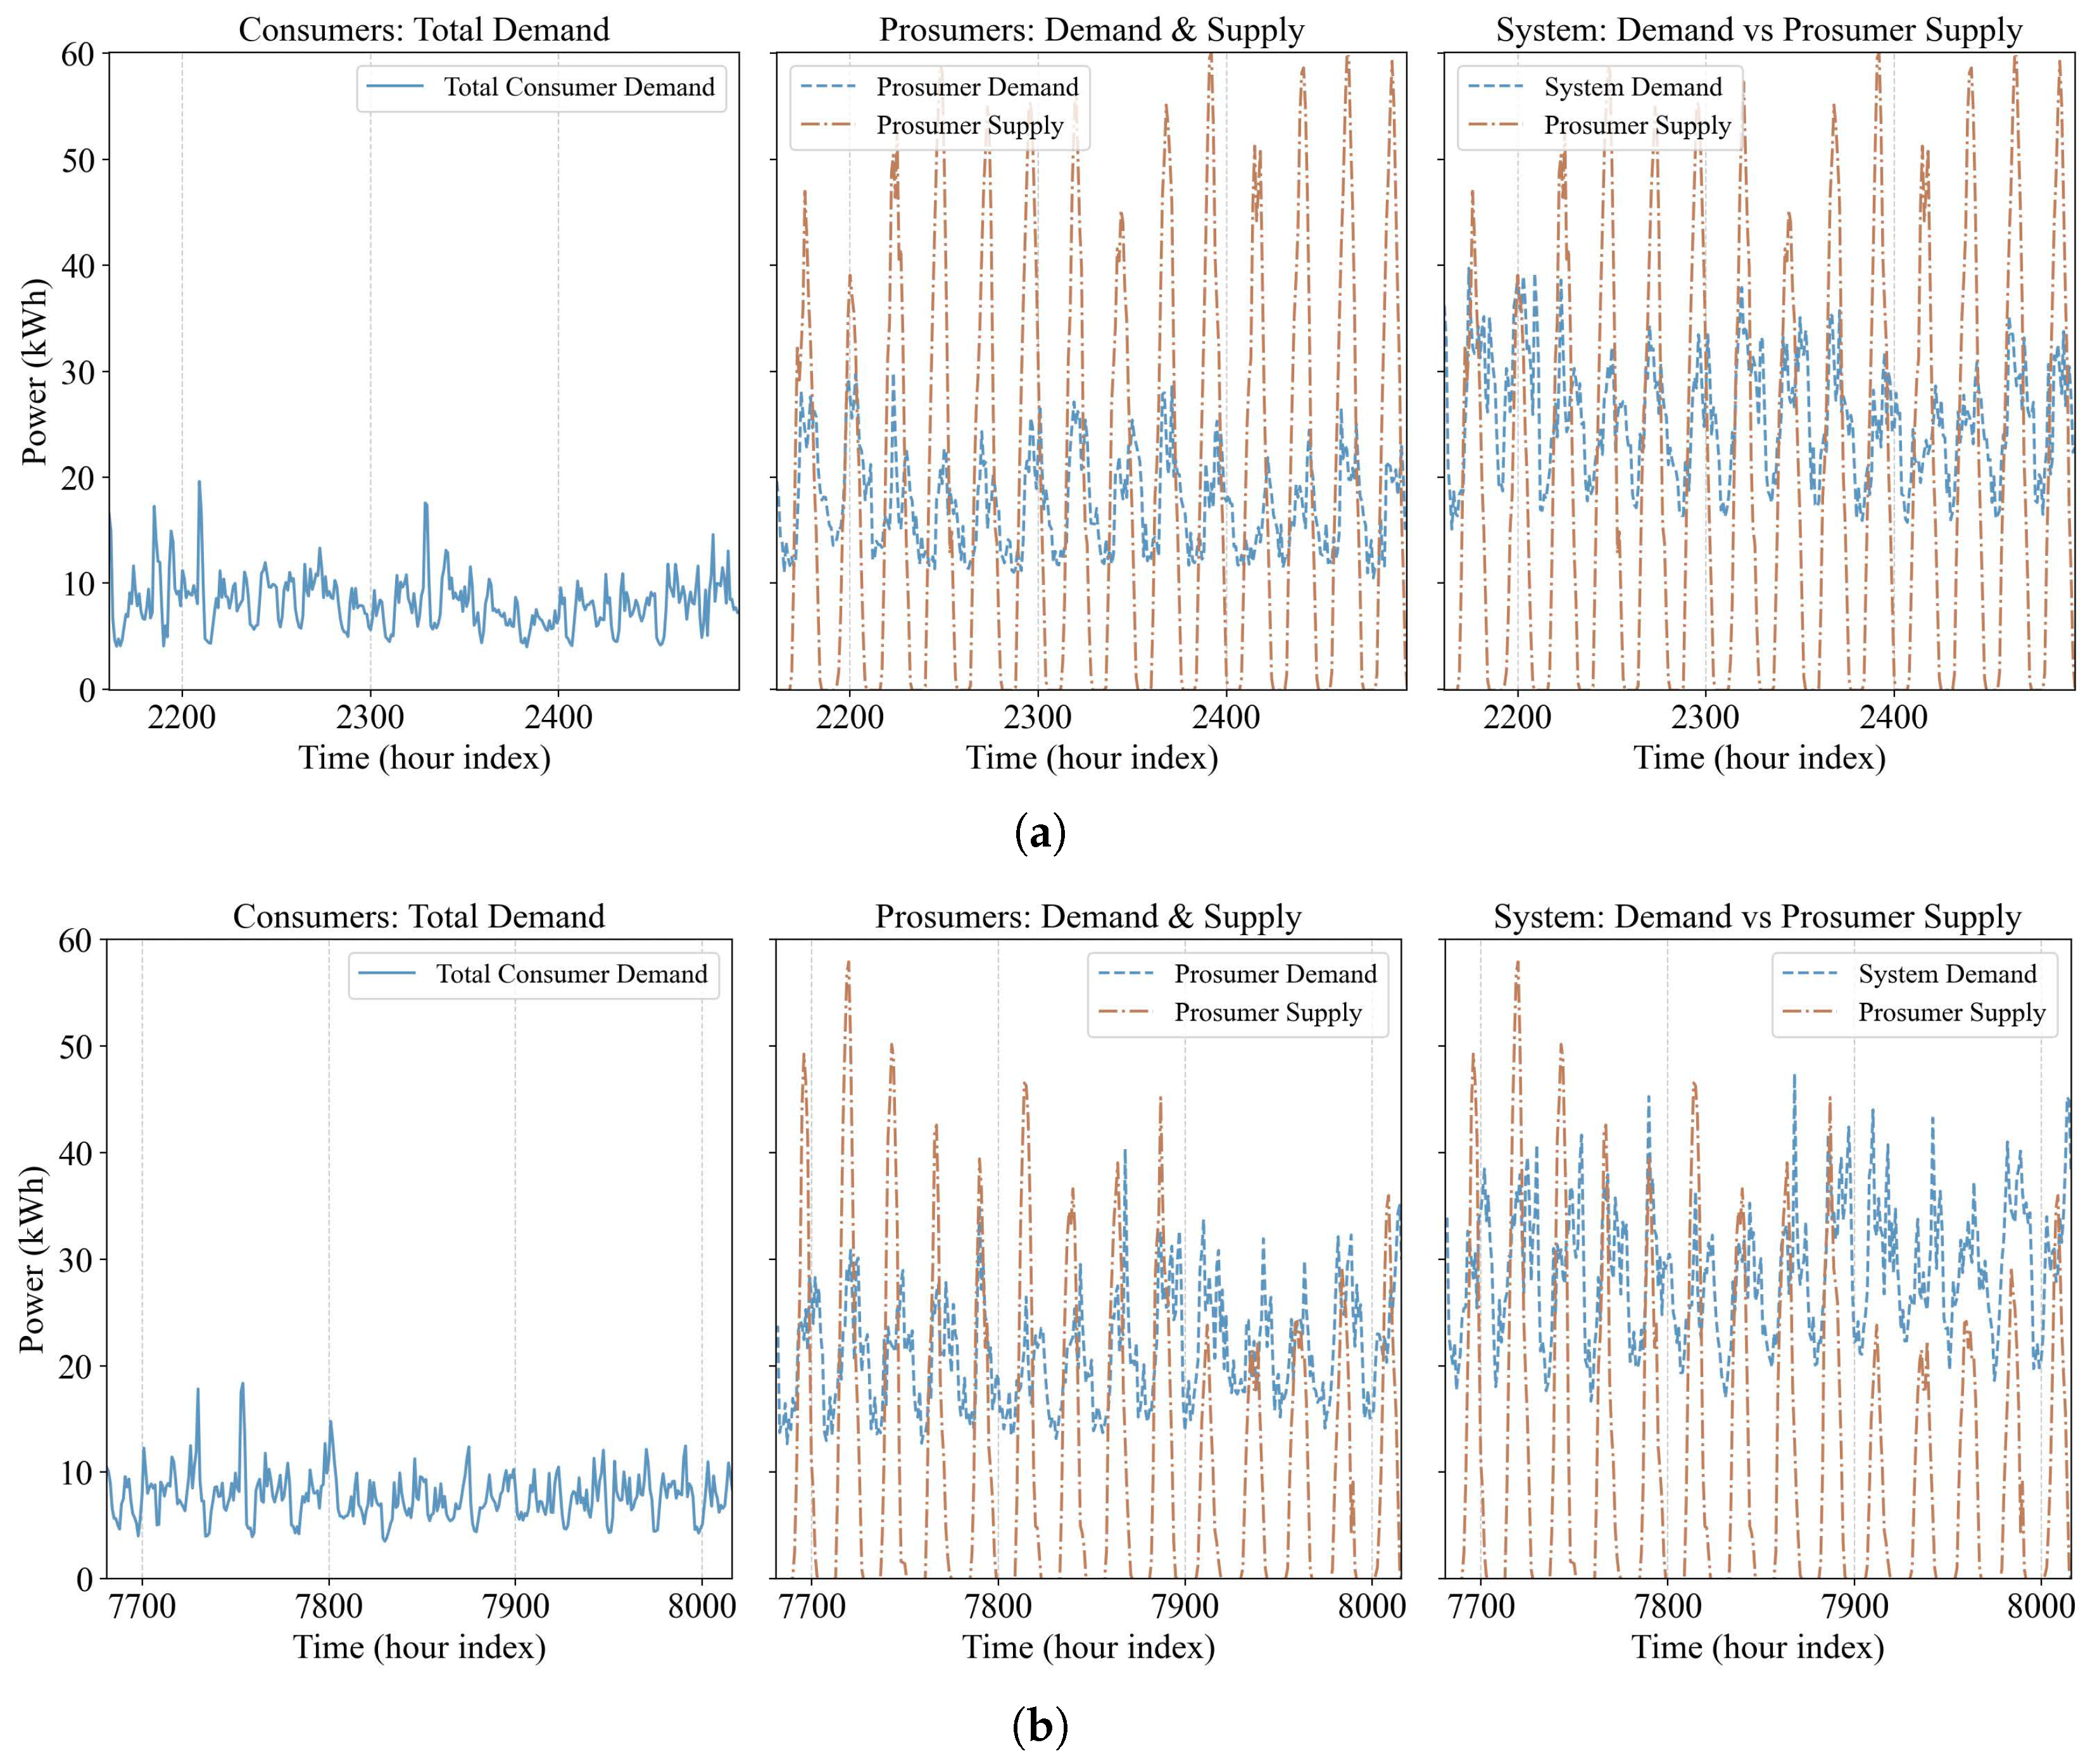
As mentioned earlier, we use one-year data to train the built-in forecasting model of each EMS, and employ the subsequent year’s data as a reference to evaluate and illustrate the internal dynamics of our proposed blockchain energy trading architecture (hereinafter referred to as BTA), including supply–demand fluctuations, pricing, and trading activity. For demonstration purposes, we select two time periods for simulation: Days 91–105 (corresponding to hour index 2161–2496) as Period 1 and Days 321–335 (corresponding to hour index 7681–8016) as Period 2.
Figure 6a illustrates the supply–demand pattern of the grid during Period 1. This period corresponds to Condition
in Algorithms 1 and 2, where solar irradiance is relatively abundant and the aggregate supply from prosumers is high. In contrast, as shown in
Figure 6b, the total prosumer supply in Period 2 is substantially lower, corresponding to Condition
in Algorithm 3. It should be noted that although the Sundance dataset originates from a region with highly favorable geographic conditions, a microgrid with a large number of consumers cannot rely solely on solar panel-based supply to meet the total demand [
40,
41]. In our experimental setting, the ratio between consumers and prosumers is 1:2, and the overall level of consumption is relatively high. As a result, unlike the Algorithms 1 and 2, both conditions require active participation from the national grid to balance supply and demand. We select these two time periods primarily to evaluate whether the proposed BTA can maintain grid stability under different dynamic conditions while simultaneously monitoring the activity of the energy trading market.
Pattern 1:
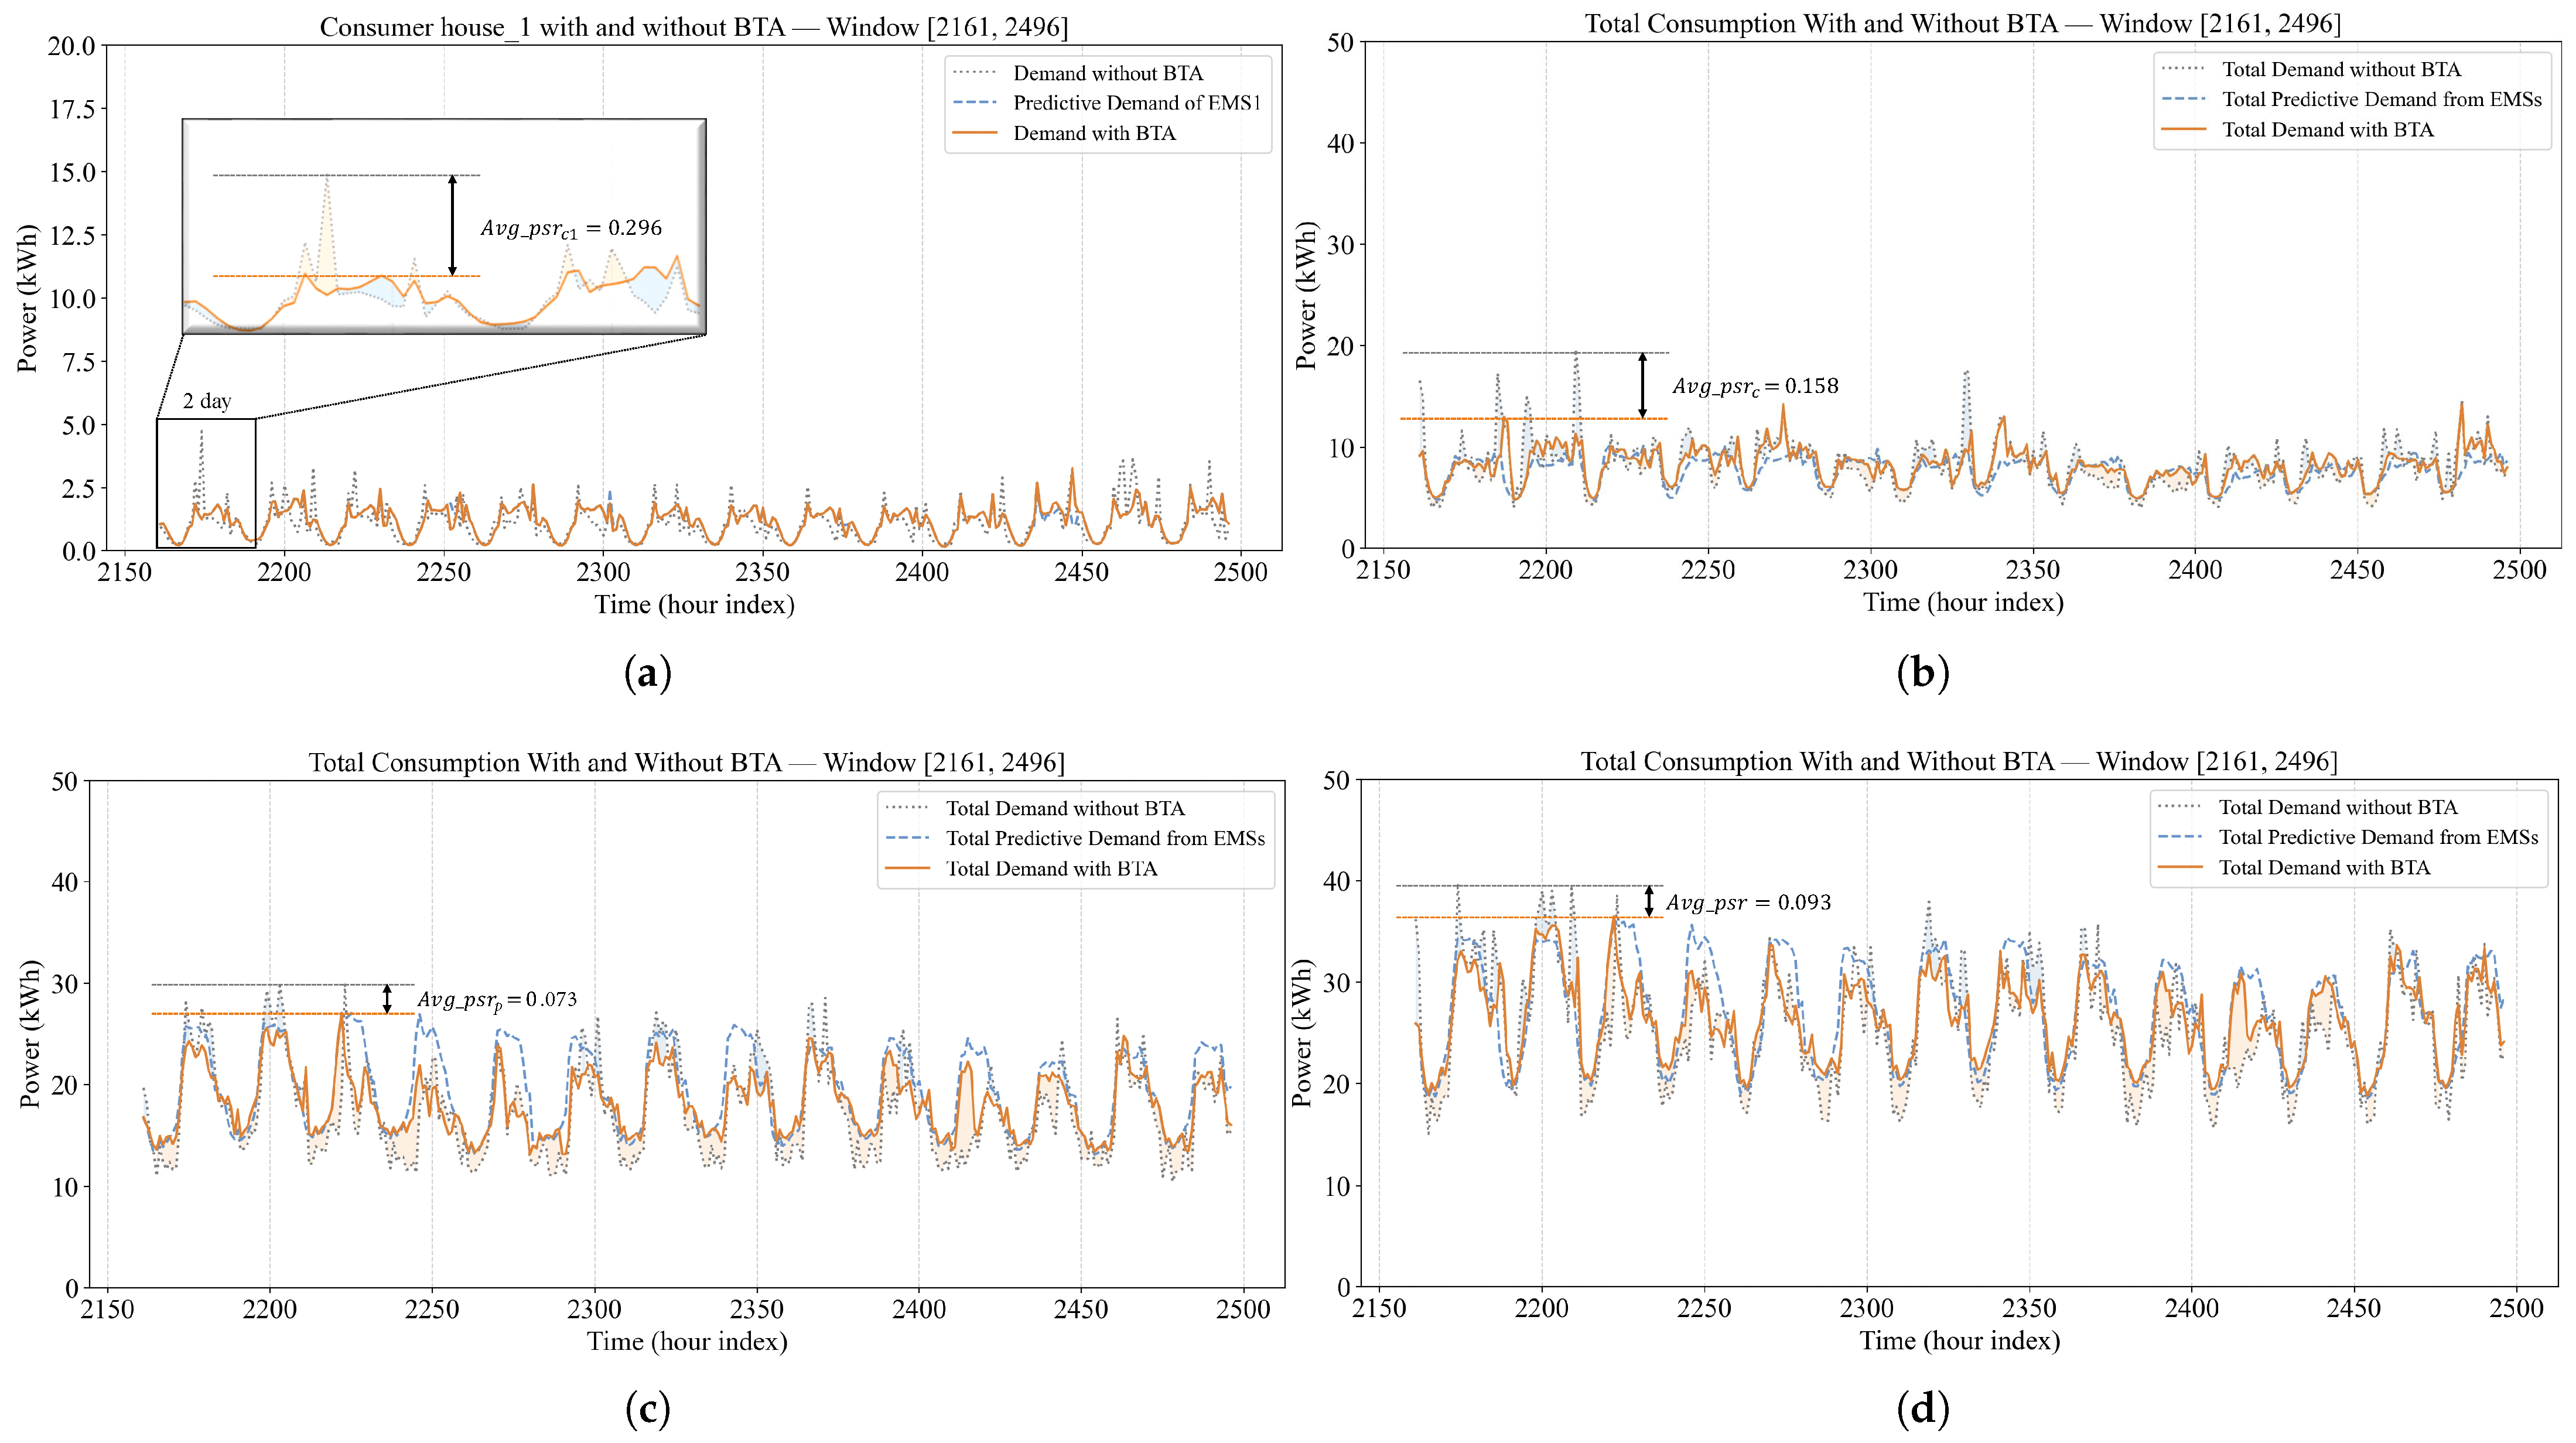
Figure 7 illustrates the dynamic energy consumption within the grid during Period 1. Subfigure (a) presents the consumption behavior of a selected individual endpoint (Consumer 1), (b) shows the aggregated consumption of all consumers, (c) depicts the aggregated consumption of all prosumers, and (d) displays the overall grid consumption. In each subplot, the gray dashed line represents the consumption trend from the original dataset at the corresponding time, the blue dashed line denotes the forecasted values submitted by the EMSs to the blockchain, and the orange solid line indicates the actual consumption dynamics of the power grid, which we refer to as the output of the BTA.
We conceptualize the BTA as a “power transformer” that converts highly fluctuating, single-endpoint consumption inputs into a stabilized aggregate output with reduced peak amplitudes. As shown in
Figure 7a, the BTA exhibits strong distributed control capability for a single endpoint: the average peak shaving rate (
in
Figure 7) of an individual endpoint can reach up to 30%. Since the consumption patterns vary across grid endpoints and some endpoints naturally exhibit low volatility, the average peak shaving rate across all consumers is approximately 15%, while that of all prosumers is around 7.3%. From a power-system perspective, peak-load reduction has direct implications for distribution-grid stability. Under the linearized DistFlow model for radial distribution feeders [
42,
43], nodal voltage drops scale approximately with the active power flowing through each line. A peak-shaving rate, therefore, corresponds to a proportional reduction in the worst-case voltage drop, increasing the system’s voltage margin relative to statutory limits and reducing thermal stress on feeder conductors and transformers. Peak-load reduction is also closely related to economic performance. Lower system peaks typically reduce demand-related capacity charges and can defer network reinforcement investments, which constitute a major portion of distribution-grid operational expenditures [
44,
45]. Moreover, endpoint-side management at each grid endpoint cannot always enforce consumption precisely within the forecasted range. In our simulation, household machines support only a limited number of operating modes (2 modes of high-power and energy-saving). When the actual demand exceeds the forecasted one, the SC of the EMS may switch the refrigerator to an energy-saving mode, but would not turn it off entirely. As a result, the actual consumption slightly deviates from the forecasted demand. Nevertheless, due to the influence of the incentive mechanism, the overall deviation remains small, and the average peak shaving rate of the entire grid remains around 10%.
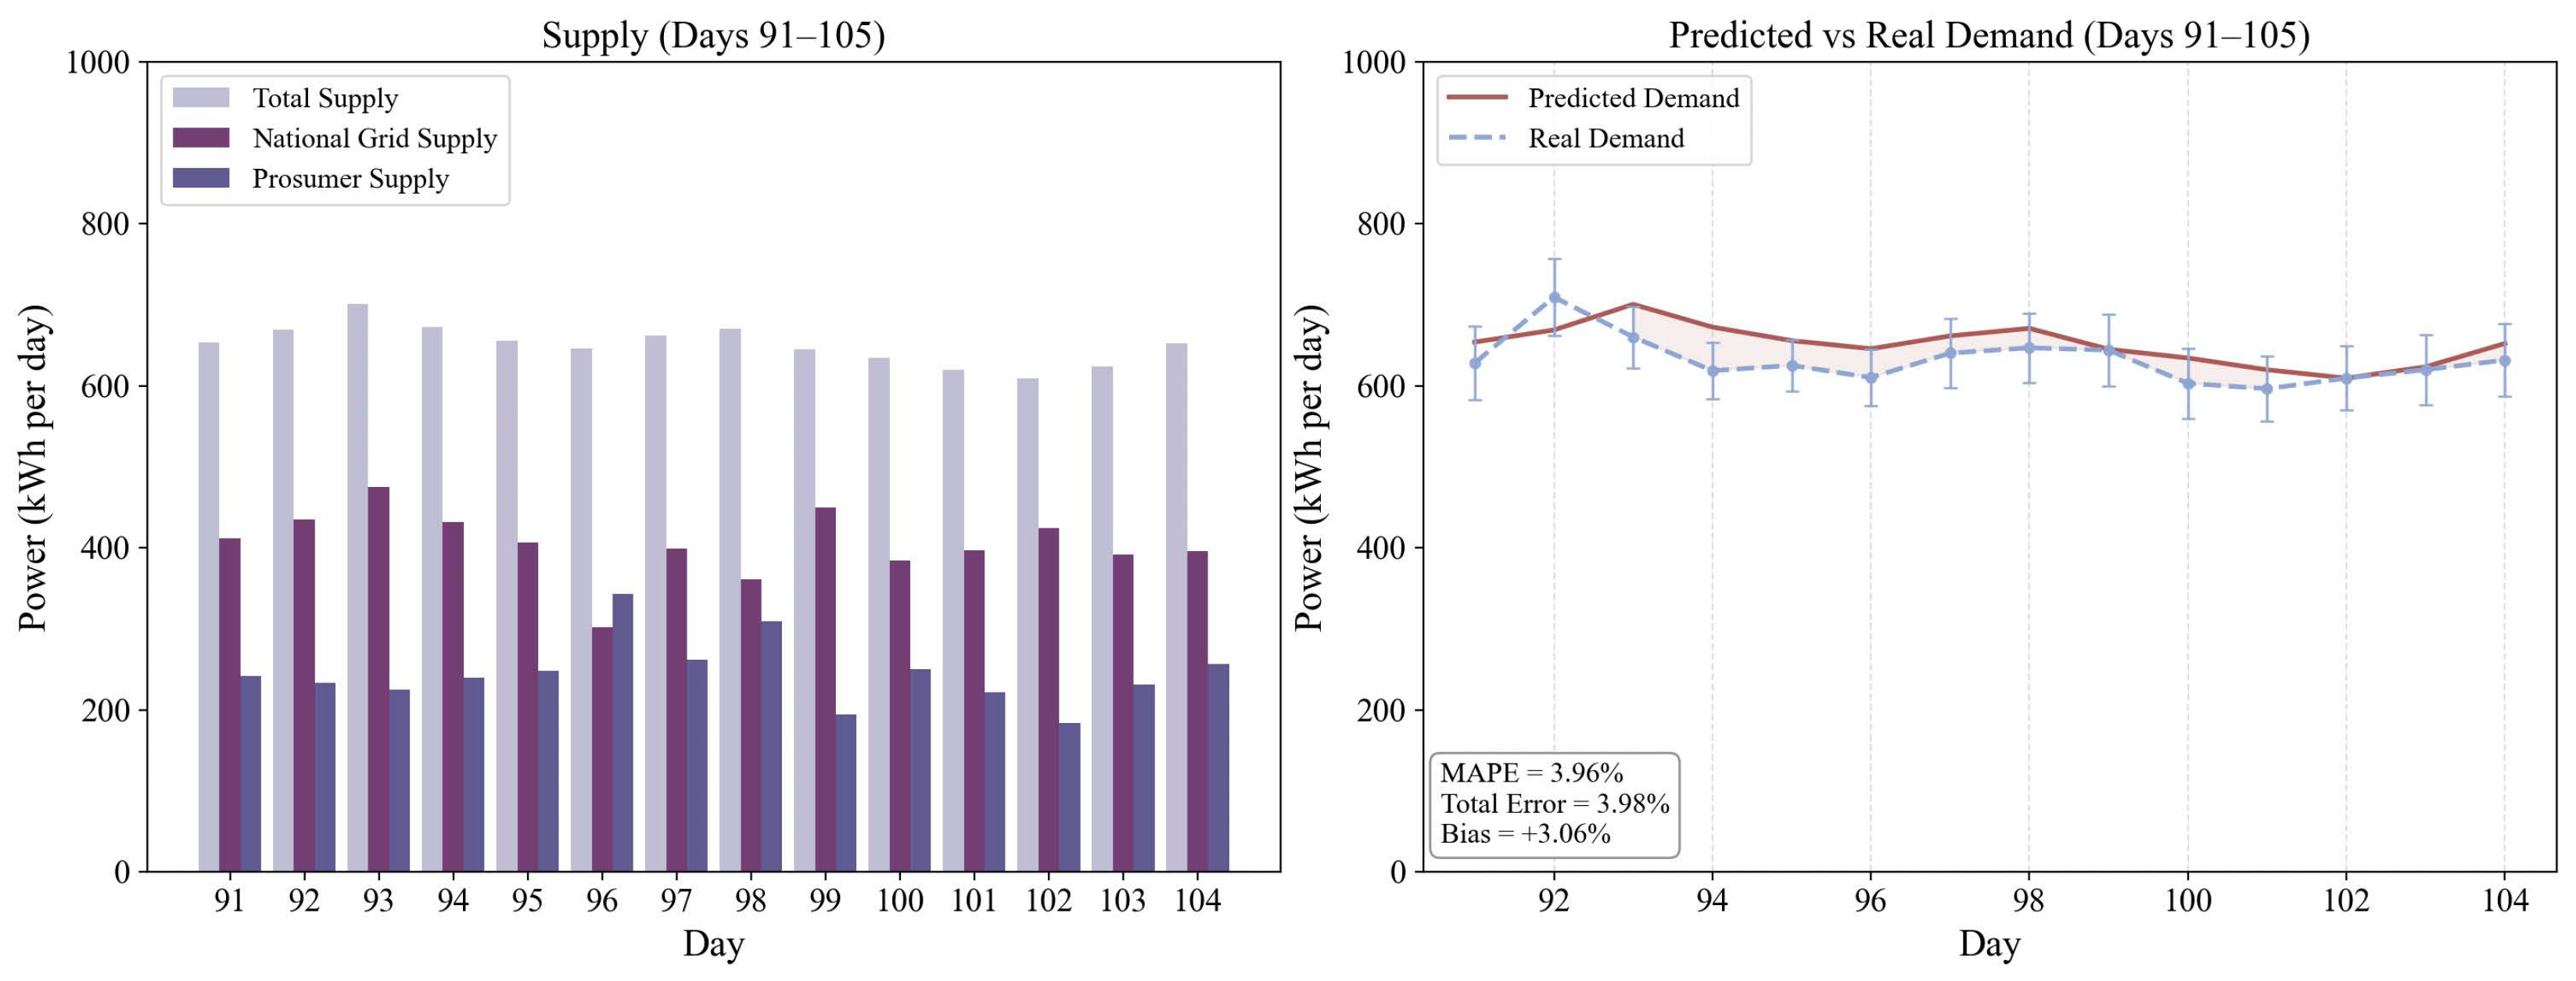
Figure 8 presents the overall supply–demand levels of the power grid during Period 1. Although prosumers generate a relatively high amount of electricity during this period, as also shown in
Figure 6a, their actual contribution to the market is impacted by the energy price, self-demand, and battery status. In our simulation, if the lowest bid price in the market on a given day falls below the previous day’s market-clearing price, prosumers may deem the profit insufficient and choose not to sell their energy. Instead, they store it in their batteries and wait for a more favorable selling opportunity, which aligns with realistic market behavior. As a result, the national grid ultimately supplies slightly more electricity than prosumers during Period 1. However, thanks to the forecasting component in EMS and the PoP incentivized mechanism, the overall prediction error between the forecasted consumption and actual consumption in the power grid remains around 3.98%, which enables the national grid to accurately determine the amount of power that needs to be imported by comparing the forecasted demand with the prosumers’ generation capacity, thereby maintaining a stable balance between supply and demand within the power grid.
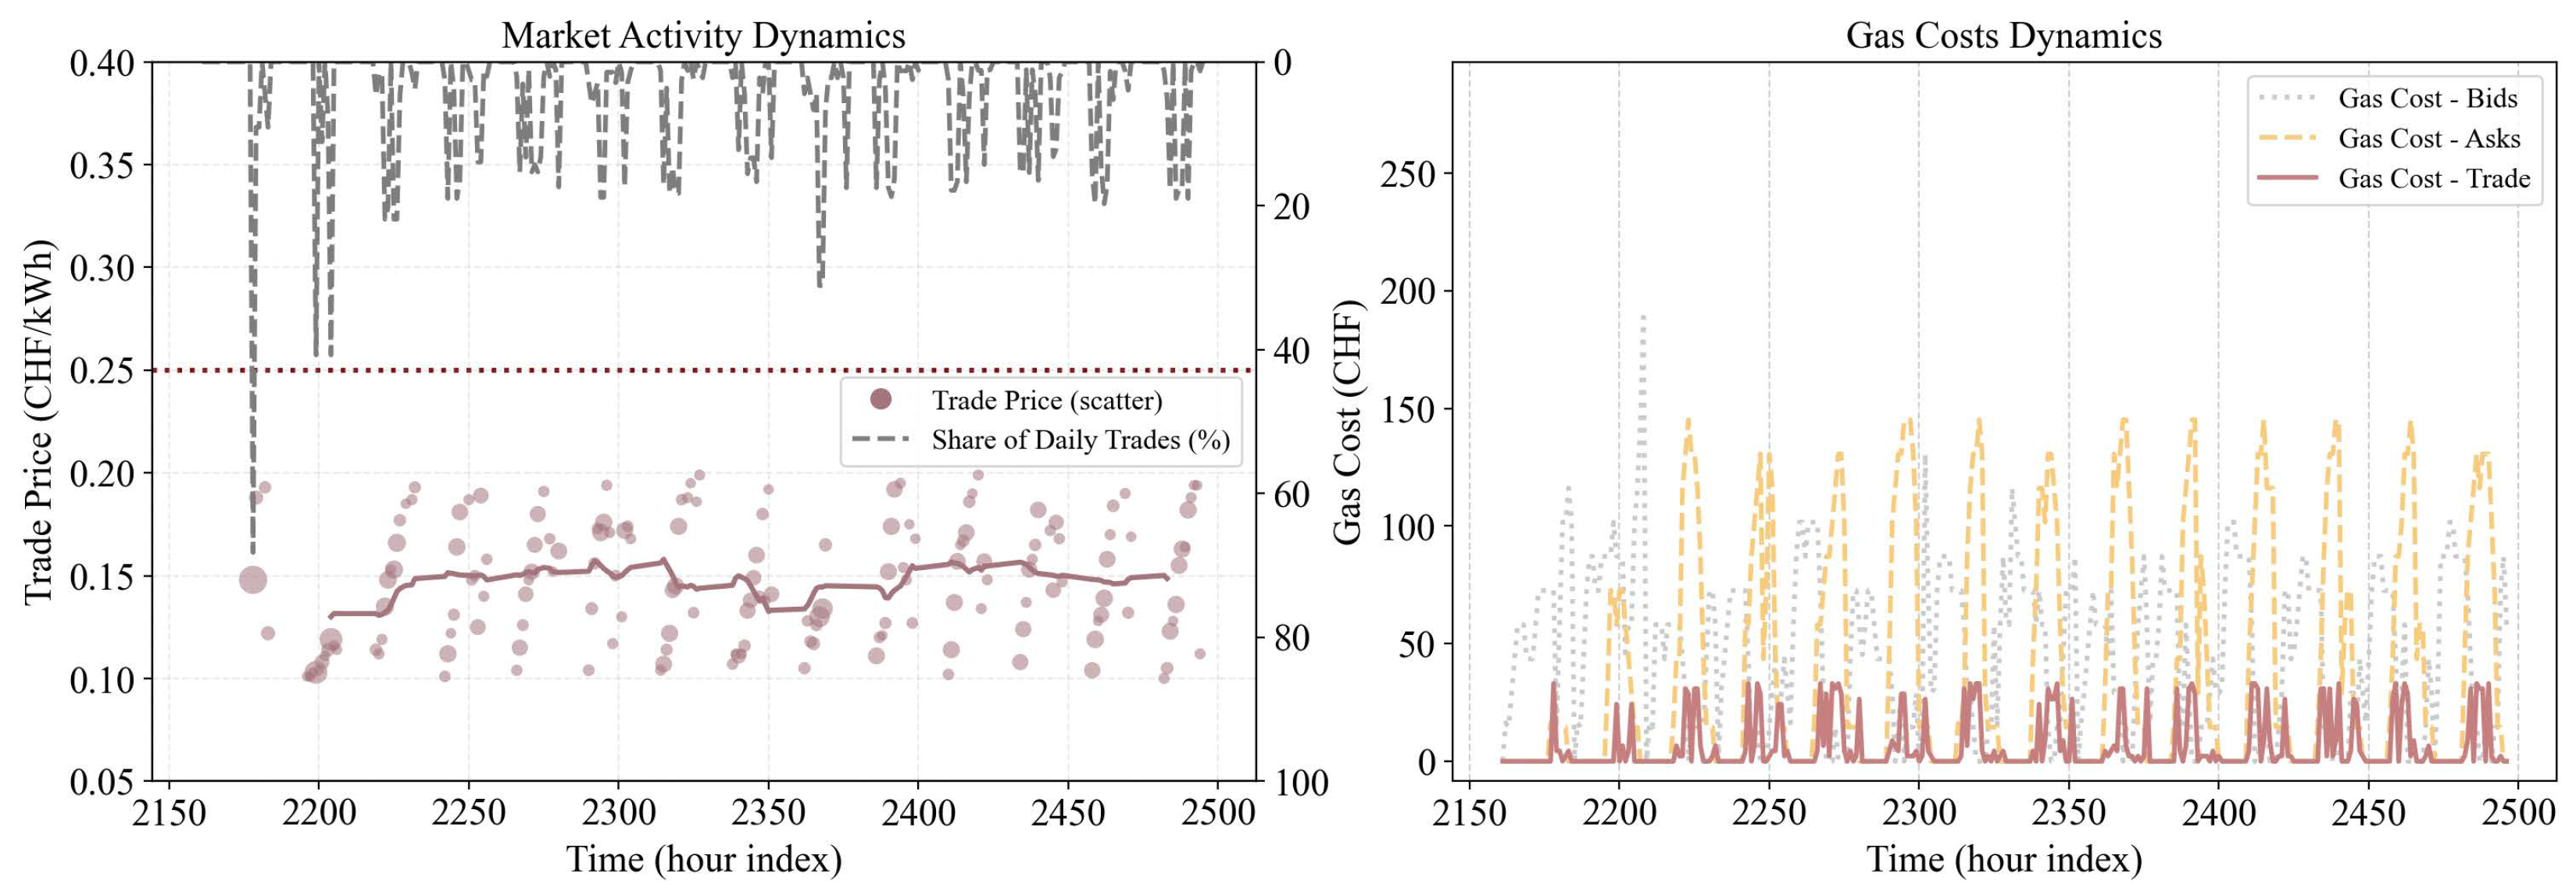
Finally, to evaluate the trading activity of the on-chain energy auction market, we analyze the transaction dynamics during Period 1, including the average auction price at each hour index and the gas cost incurred by EMSs–blockchain interactions, as shown in
Figure 9. We set the electricity price of the national grid to 0.25 CHF/kWh (based on the electricity tariff published by Zug Canton, Switzerland:
https://www.wwz.ch/de/privatpersonen/energie/strom/tarife, accessed on 17 October 2025), which is approximately 0.31 USD/kWh. The pricing strategy for energy selling requires the price to be higher than the previous day’s market-clearing price but lower than the lowest bid price in the current hour index. The purchasing price of energy is determined based on the transaction prices of the previous seven days. As shown in
Figure 9 (left), the auction price in the energy market ranges between 0.10 and 0.20 CHF/kWh, exhibiting relatively stable fluctuations while consistently remaining below the national grid electricity price (0 means no energy flow between consumers and prosumers). This price advantage helps sustain the activity of the energy trading market. Moreover, since each grid endpoint is equipped with a battery for self-management in our simulation, most energy trading occurs in the middle of the day, as shown in
Figure 9 (left) with the gray dashed line. To minimize the computational and energy overhead associated with blockchain execution, we design the smart contract in a lightweight, information-oriented form that avoids any intensive state changes or iterative on-chain logic, which significantly reduces the energy cost of blockchain participation for EMS, making our architecture environment-friendly. The
Figure 9 (right) reports the gas cost required for on-chain transactions. For each time index, we aggregate the gas consumption of all on-chain transactions of a given type and convert the total gas cost from ETH to CHF (The ETH-CHF conversion is computed using real-time exchange rates from CoinGecko:
https://www.coingecko.com, accessed on 17 October 2025). Therefore, each point in the figure represents the total gas expenditure of that transaction type within the corresponding hour. As shown in the
Figure 9 (right), even during periods of intensive market activity, the resulting costs remain moderate and are primarily driven by simple data-registration operations, since all computation-intensive logic is kept off-chain.
Pattern 2: The dynamic consumption pattern of the grid in Period 2 is shown in
Figure 10. Subfigure (a) presents the consumption dynamics of Endpoint 1 (Consumer 1), and subfigure (b) illustrates the overall consumption dynamics of all endpoints during Period 2. Similar to Period 1, the BTA achieves an average peak-shaving rate of 25.8% for Endpoint 1 and 12.1% for the entire grid. In comparison, existing blockchain-based energy trading and demand-side management frameworks typically report peak-demand reductions on the order of 10–25% under different settings. For example, Ouyang et al. [
46] report about a 10% peak reduction in a blockchain-based new energy trading system, while Boumaiza [
22] achieves a 25% highest reduction in peak demand in a blockchain-enhanced DSM case study. Our results therefore fall within the upper range of peak-shaving performance of 29.6% in the pattern 1 reported for blockchain-enabled schemes, while relying only on an incentive-driven, distributed control architecture without centralized optimization. As shown in
Figure 6, Period 2 exhibits stronger consumption volatility compared to Period 1, which imposes higher requirements on the self-management capability of individual endpoints. Nevertheless, as seen in
Figure 10b, the overall fluctuation in consumption during Period 2 remains comparable to that of Period 1, as shown in
Figure 7d, demonstrating the flexibility and robustness of the BTA’s distributed control capability.
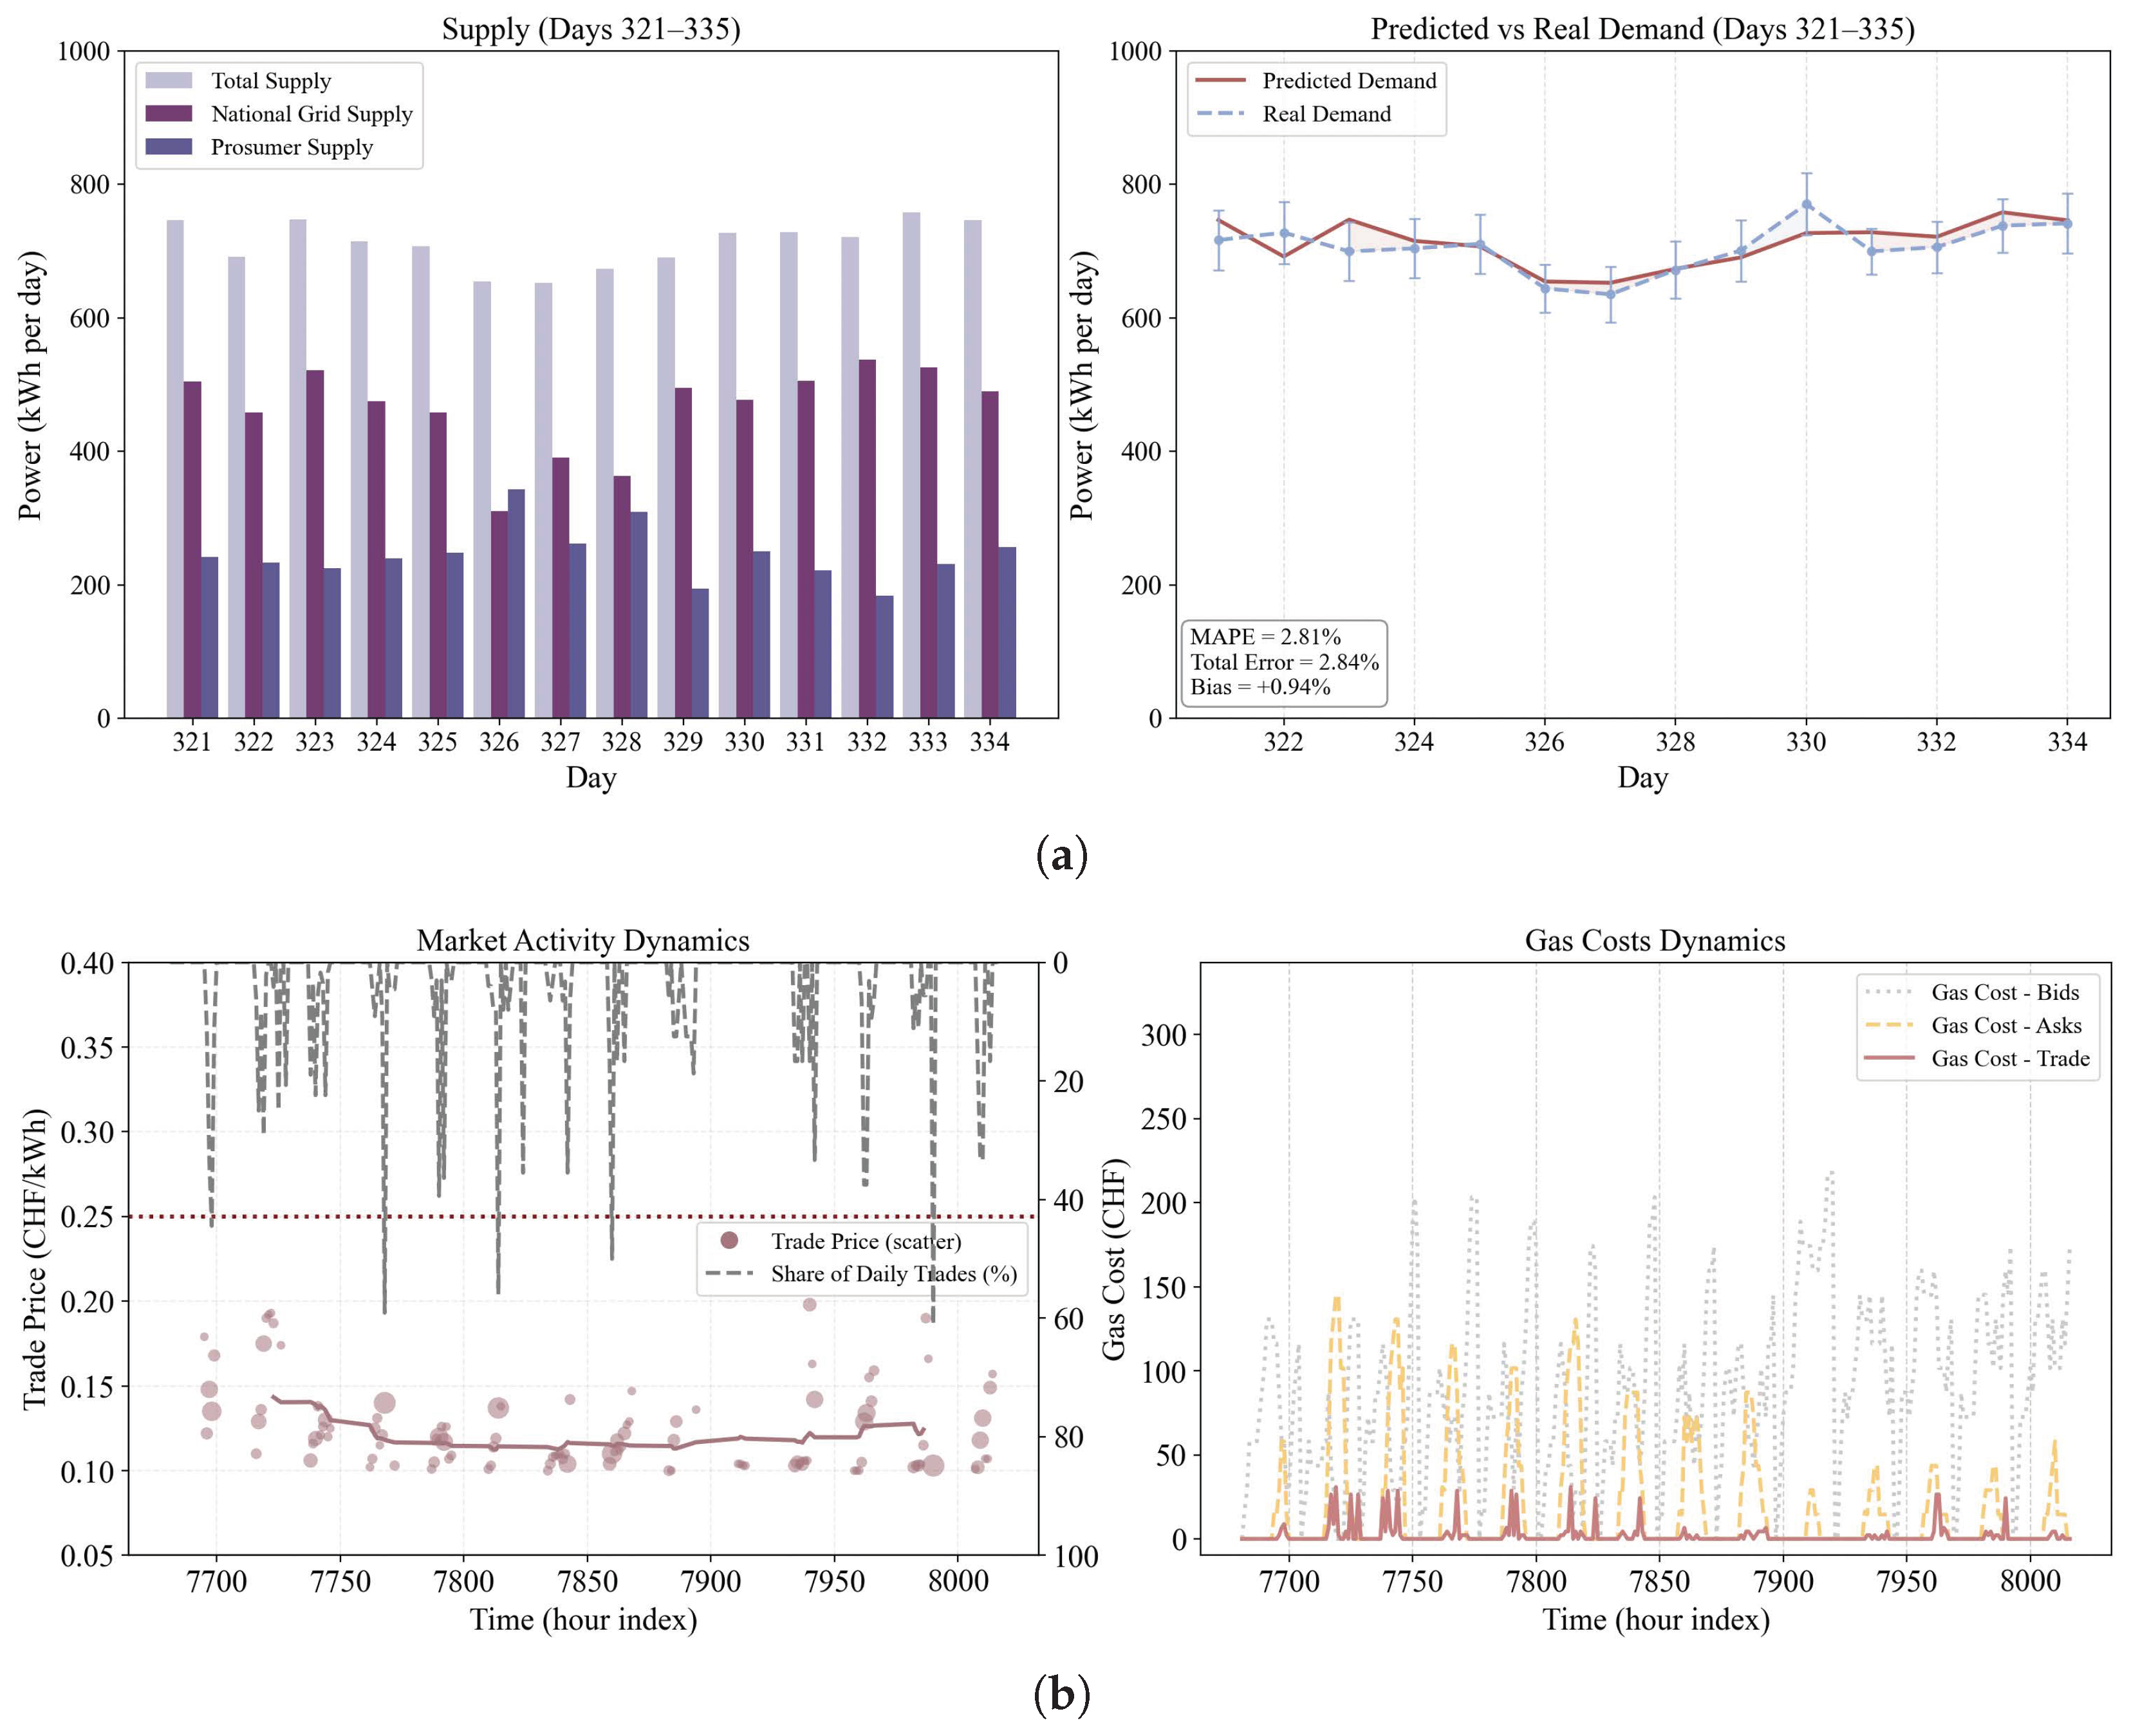
Similar to the dynamic monitoring performed for Period 1, we also analyze the supply–demand behavior of the grid during Period 2, including the distribution of supply between prosumers and the national grid, as well as the resulting supply–demand gap. As shown in
Figure 11a, the total supply from prosumers during Period 2 is lower than in Period 1, leading to a significant increase in the national grid’s contribution. Nevertheless, due to the EMS-based forecasting mechanism, the average supply–demand gap in Period 2 remains as low as approximately 2.84%, ensuring that overall grid balance of supply and demand is maintained. In addition, as illustrated in
Figure 11b (left), the energy market price continues to remain within the range of 0.10–0.20 CHF/kWh, indicating price stability. However, market activity is noticeably lower than in Period 1, particularly among prosumers, as reflected by the yellow dashed line in the
Figure 11b (right).
Based on the observations from the above figures and tables, our proposed BTA integrates bottom-up EMS-driven self-management with top-down blockchain-based incentive coordination, thereby exhibiting strong distributed control capability to maintain grid stability. At the local level, each EMS autonomously smooths its own consumption profile to reduce single-point volatility and leverages accurate forecasting to minimize local unpredictability. At the global level, the blockchain and the regulator enable efficient distributed coordination across all endpoints, thereby stabilizing overall power grid voltage and balancing supply and demand.
