3.2. Computation for S11
For an antenna, the loss constant
can be found by the following equation:
where
= 0,
(
in seawater),
= 8.85 × 10
−12 F/m, and is the angular frequency.
The phase constant
β can be found by the following equation:
where
(
H/m and
in water). The wavelength is given by the following:
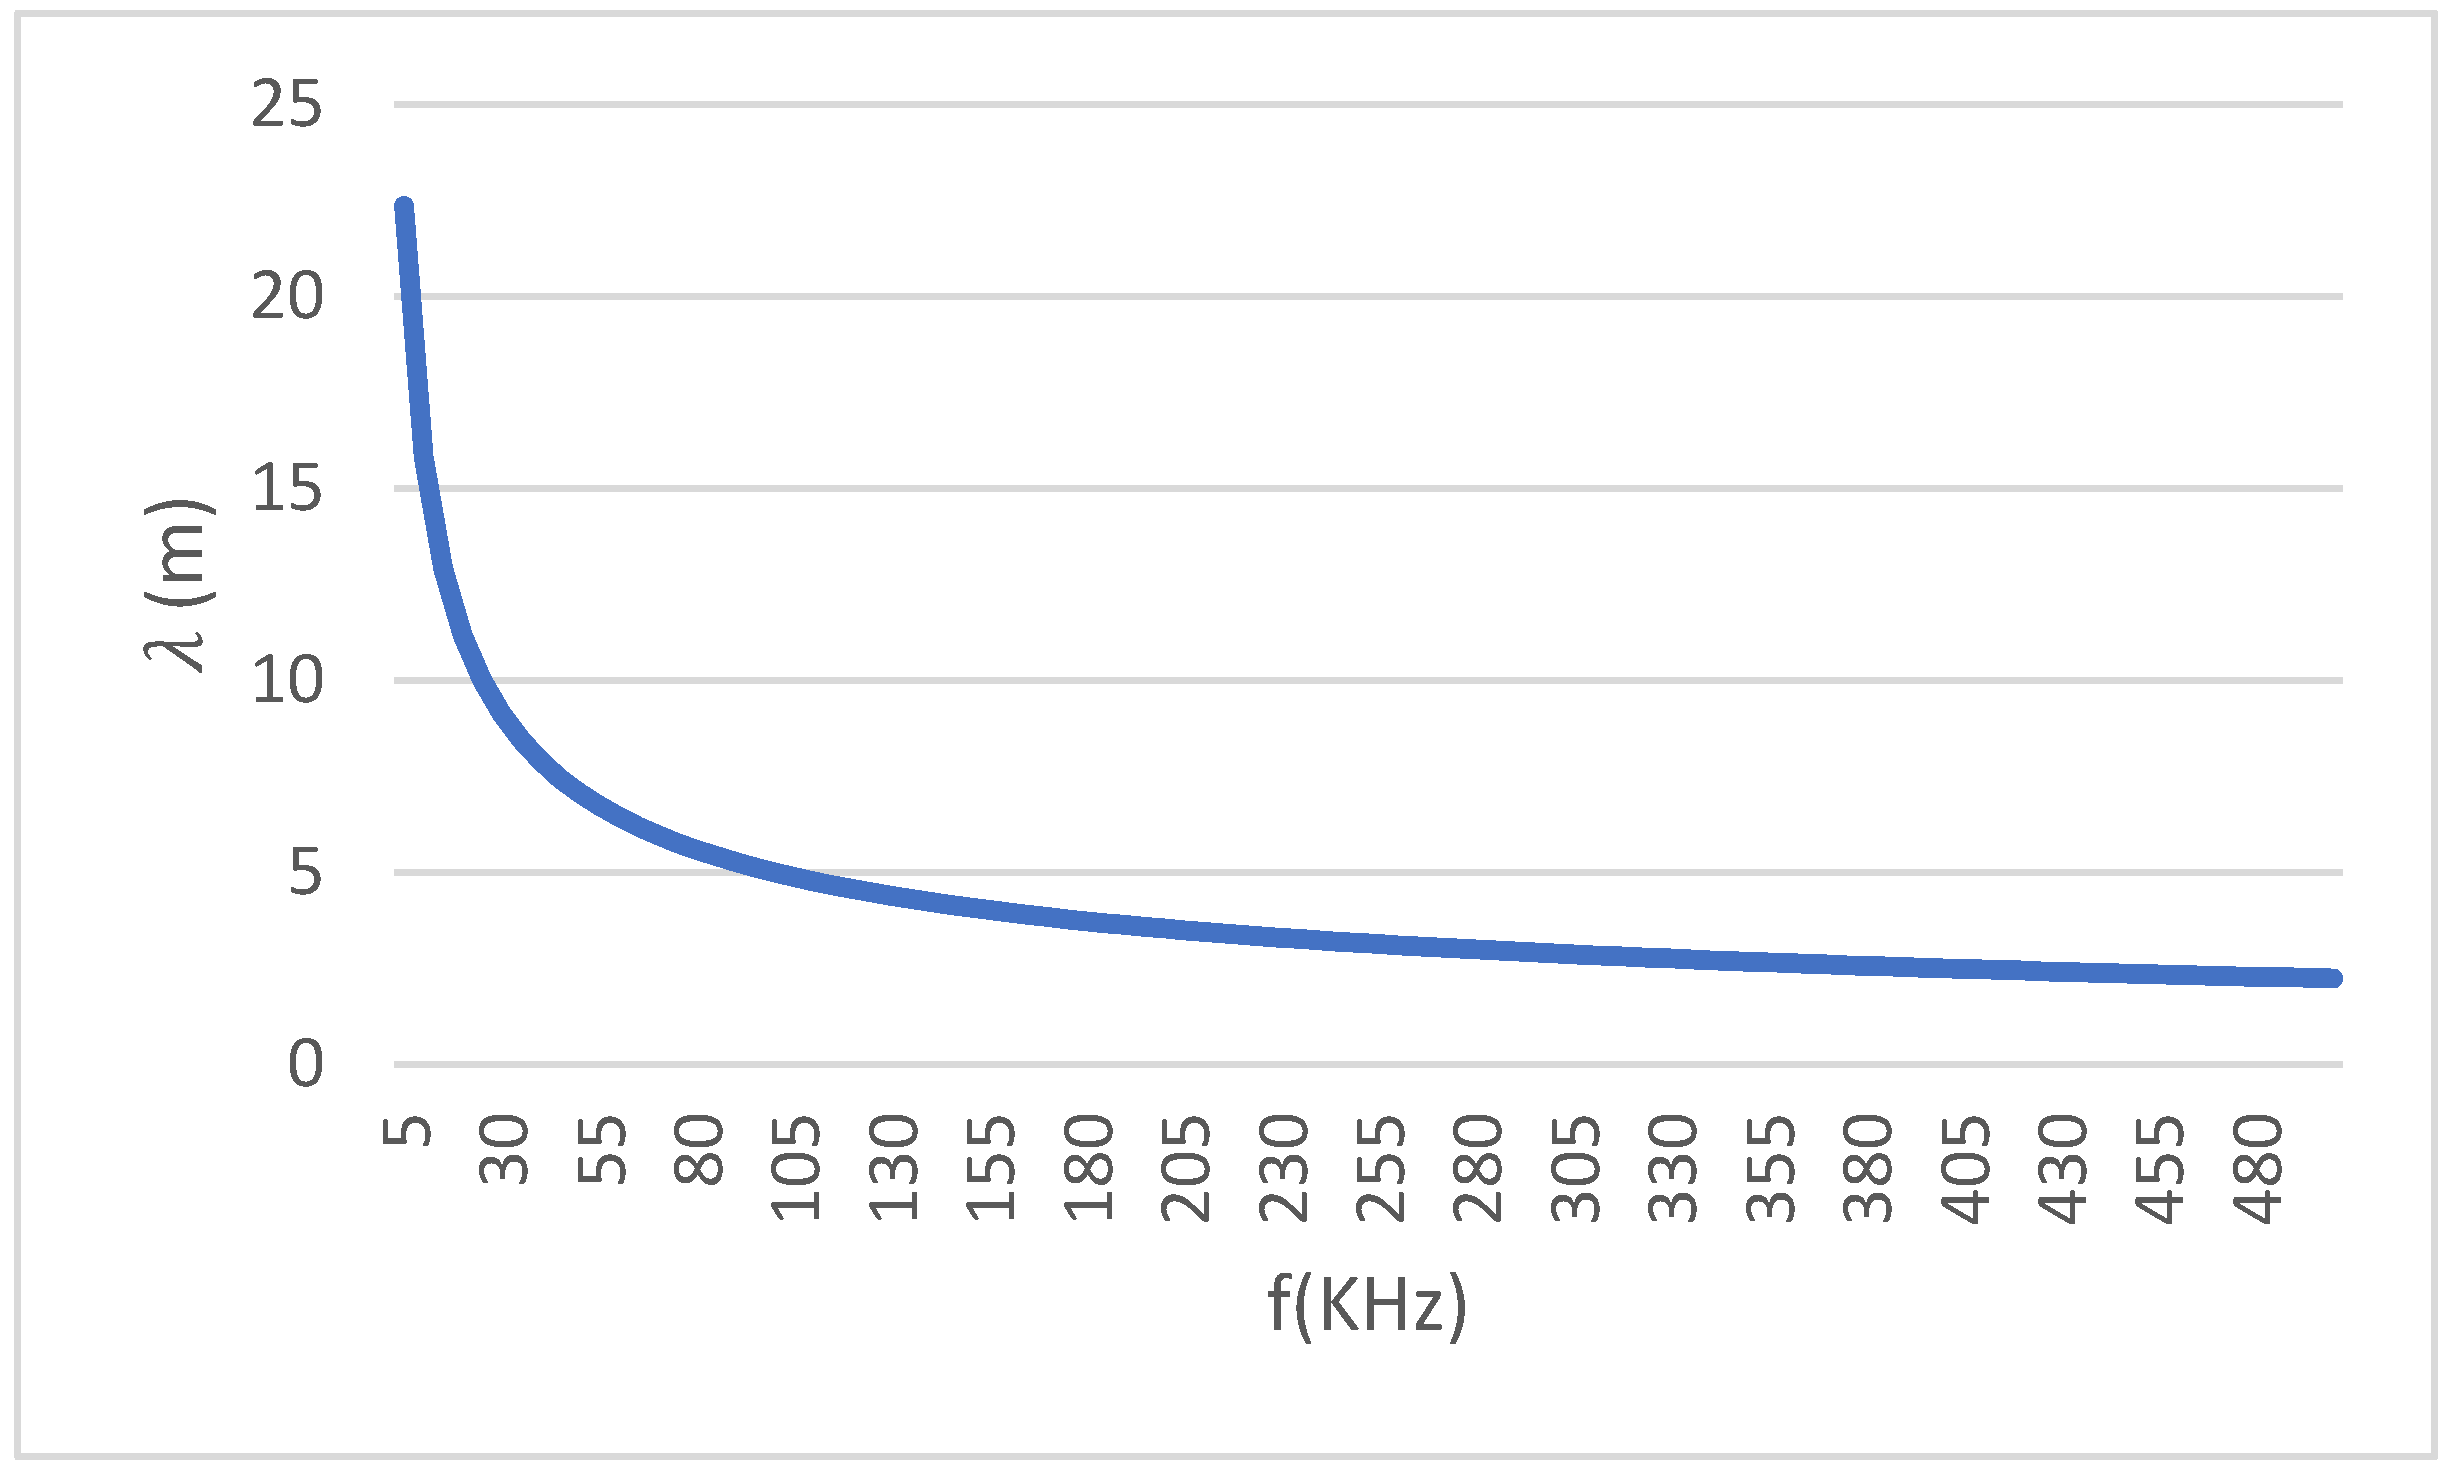
Using the above parameters in Equation (3) and by varying frequency from 0 to 5 kHz, we get the plot in
Figure 5.
The attenuation constant
α is given by the following:
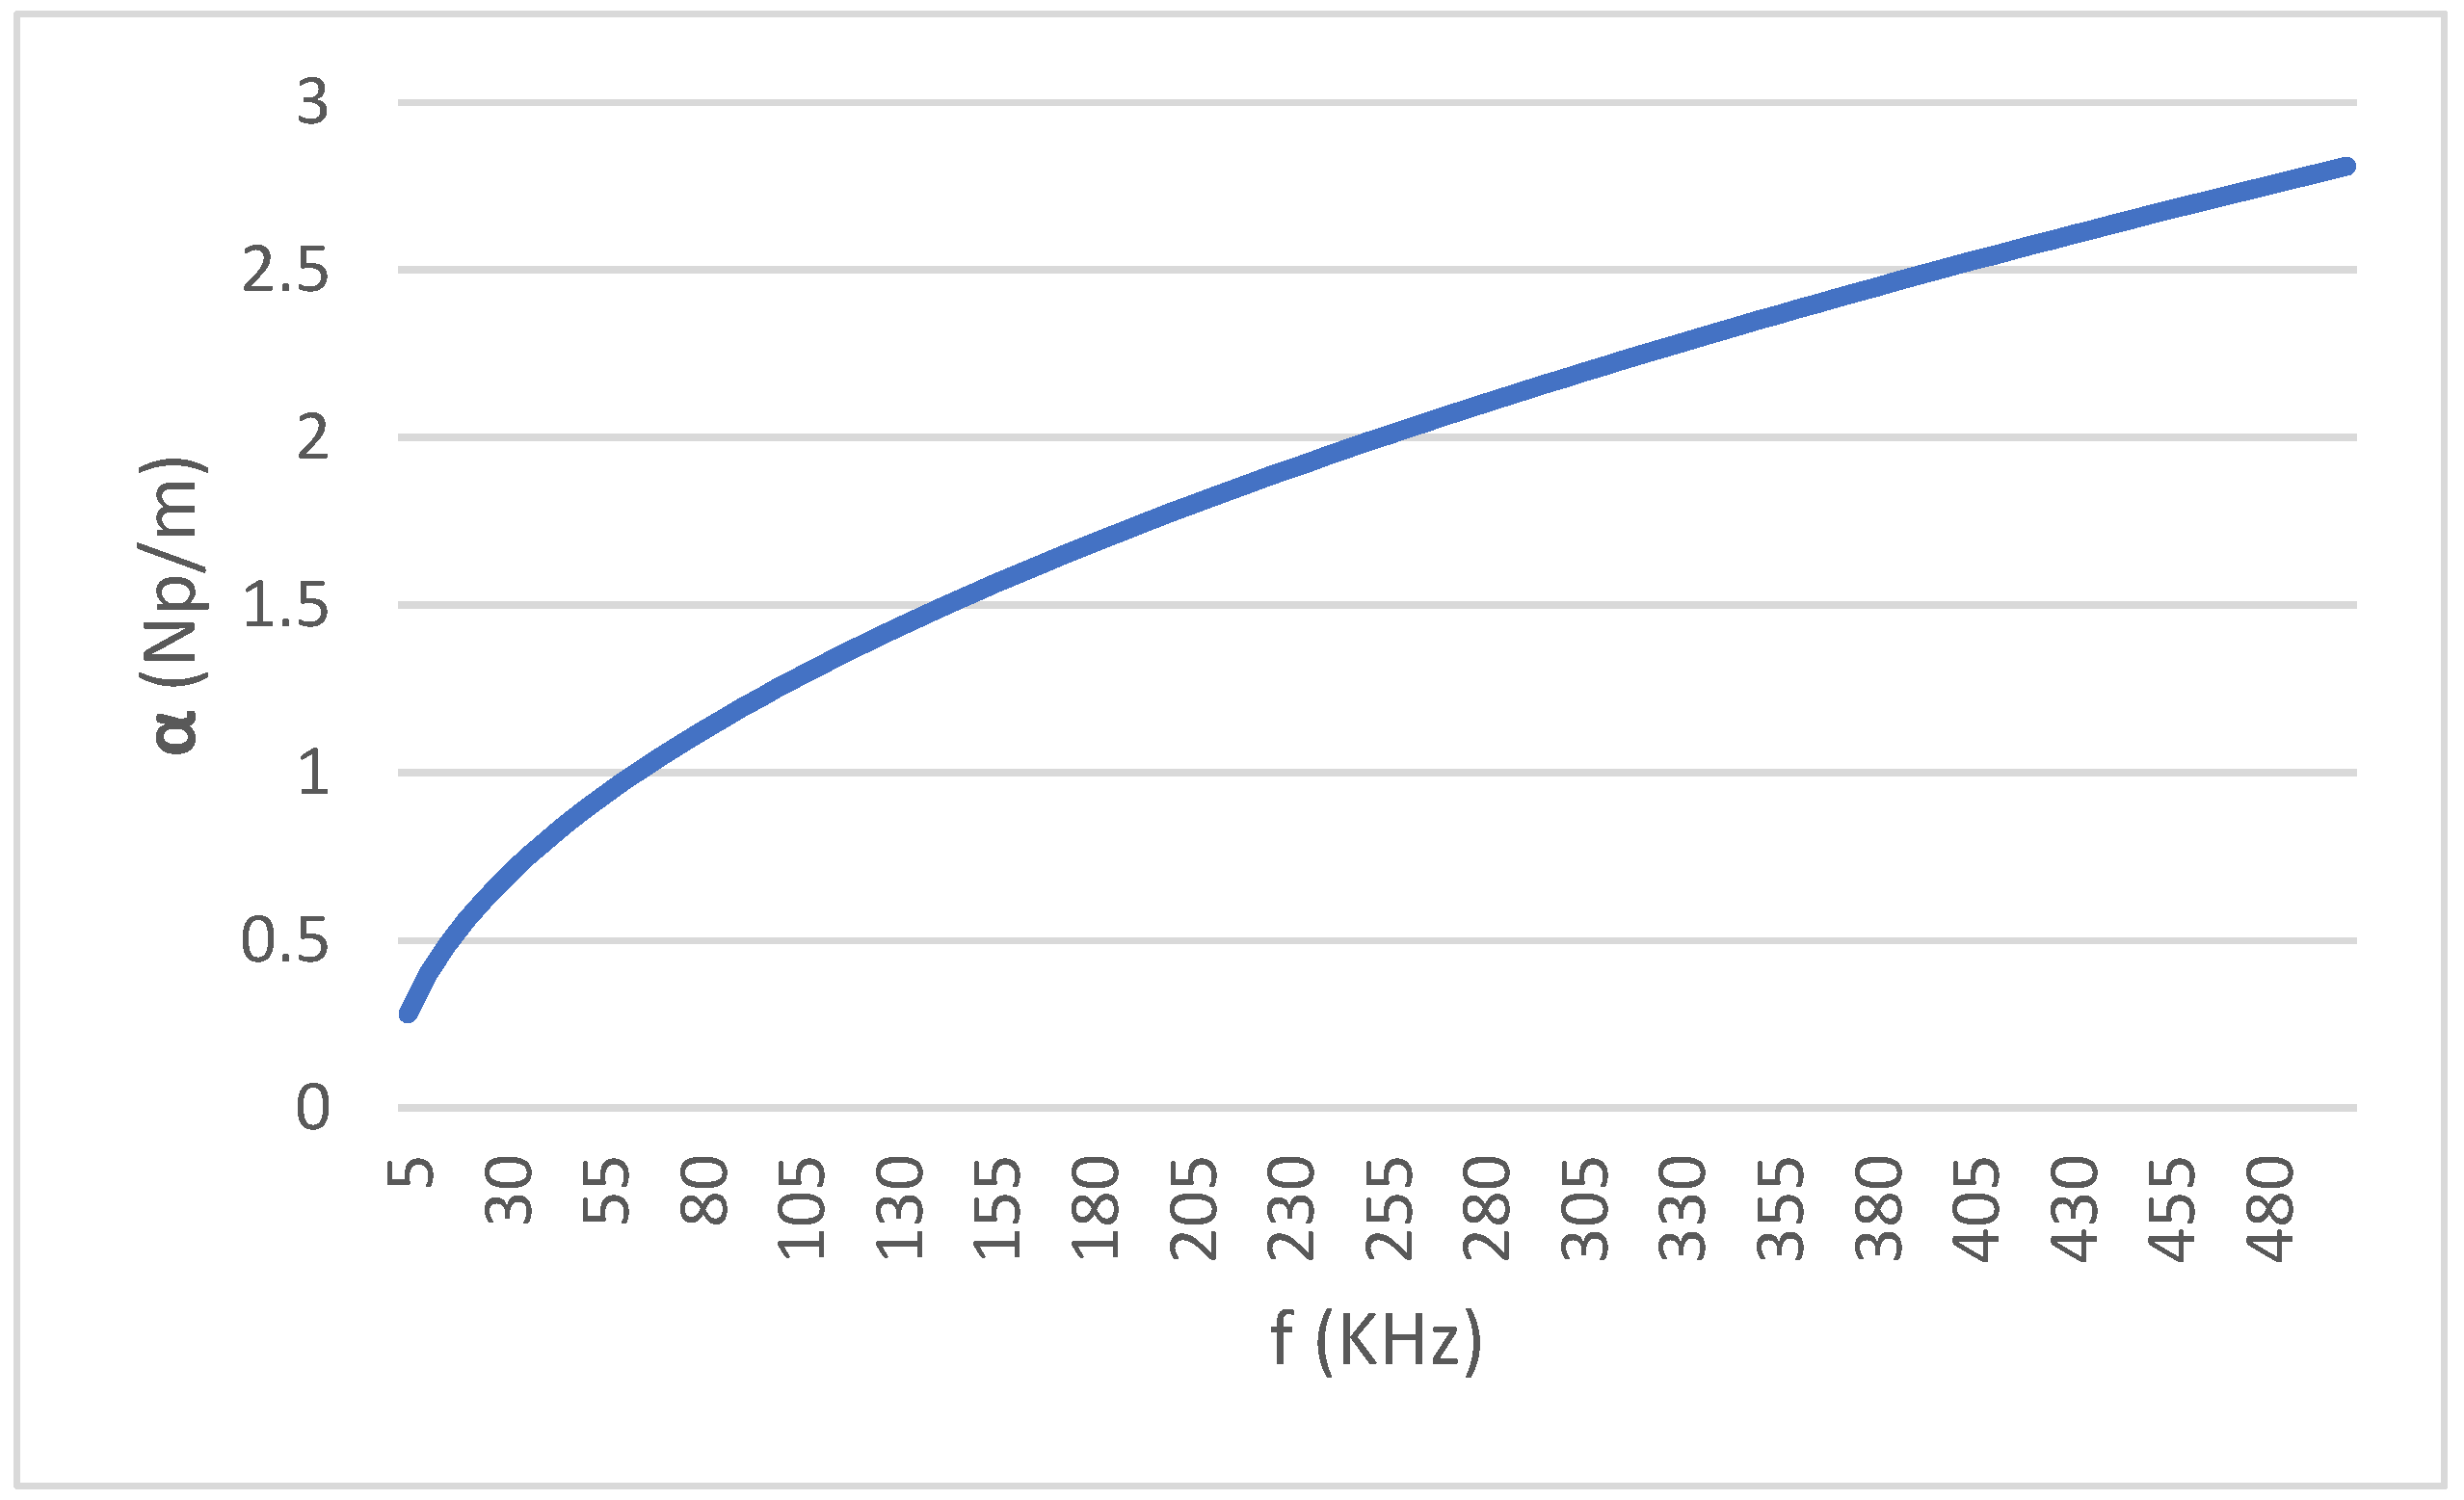
Using (4), we get the attenuation vs. frequency presented in
Figure 6.
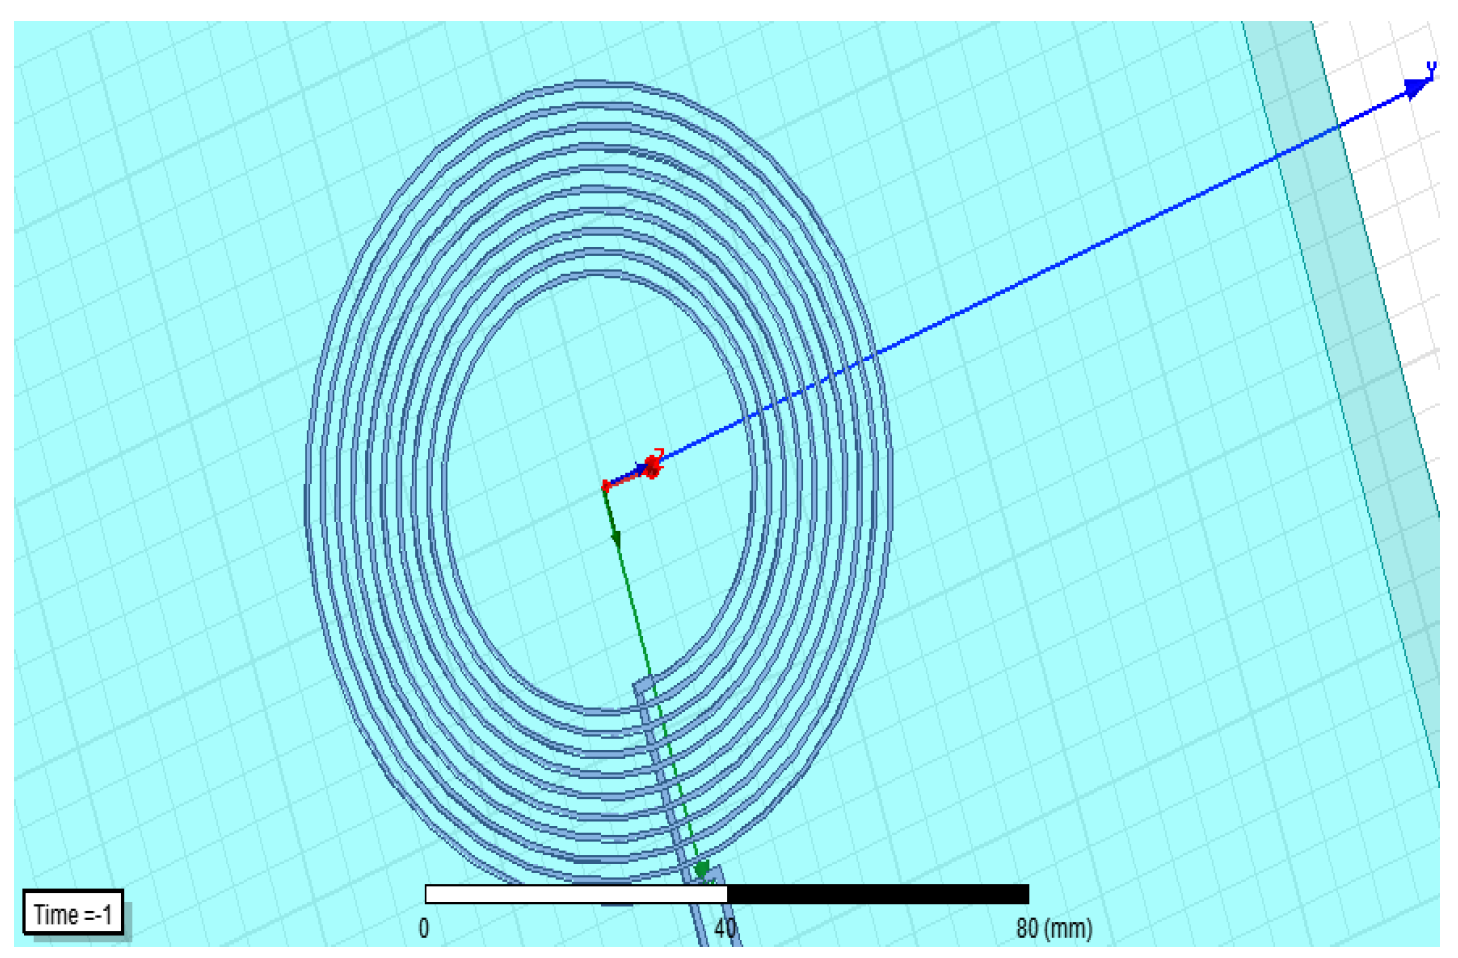
In the next step, we used the following coil that has a radius of 1 mm, ten turns, and an inductive reactance of 6.92 µH, attached to an FR4 plate of 1.5 mm thickness for simulation purposes in ANSYS Maxwell v16.
The reflection coefficient
Γ can be found by the following:
Let
, the system impedance, to be 50 ohms. We are using an RL circuit to excite the coil which includes resistance Ra of 75 ohms, and Xa can be varied at different frequencies. Therefore, the final impedance will be the following:
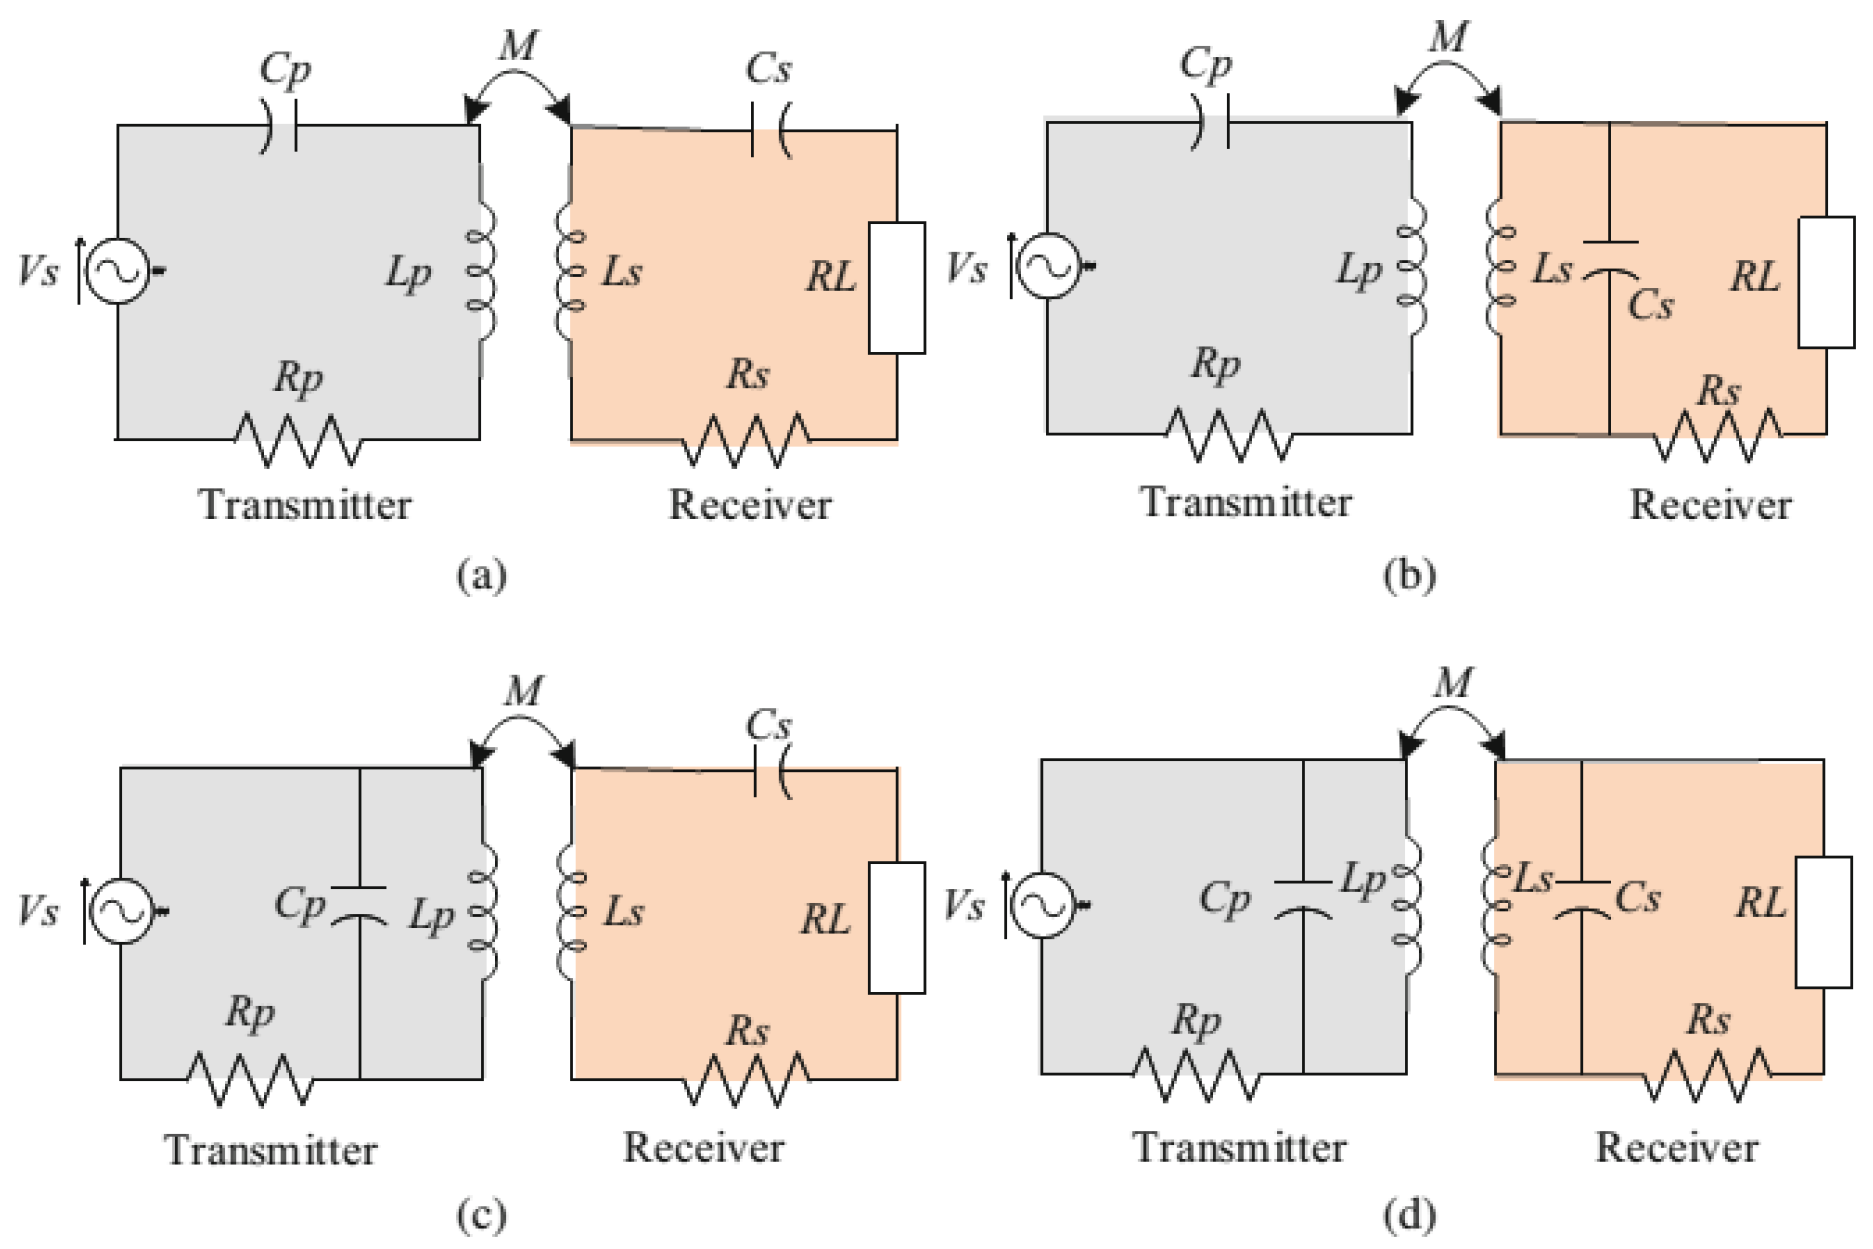
This circuit is a series configuration at the input for the transmitter. We have used the same series confirmation for the receiver coil as the one shown in
Figure 3a.
As per output characteristics amongst the four mentioned basic WPT topologies, the series-series topology is the simplest configuration, it provides constant current, easily flexible to parametric change in the coil and achieves resonance
The reflection coefficient
S11 in dB can be found by the following:
For a system using the S-S compensation topology, a simplified model based on Kirchhoff’s laws can be derived. The relationship between the currents and voltages in the primary and secondary circuits can be expressed as follows:
where
are the voltages of the primary and secondary coils.
are the currents of the primary and secondary coils.
, are the self-inductances of the primary and secondary coils.
, are the compensation capacitances.
, are the resistances of the coils.
M is the mutual inductance.
ω is the angular frequency.
To calculate the basic efficiency of two magnetically coupled (MI) coils, you will need to consider several key parameters that govern their interaction and energy transfer.
A more simper form is calculated as follows:
where
k is the coupling coefficient.
Q1 is the quality factor of the transmitting coil.
Q2 is the quality factor of the receiving coil.
From the above, we get to know that if we increase the coefficient of coupling or the quality factor, we get more efficiency. It would decrease with higher resistance.
3.3. ANSYS Maxwell Simulation
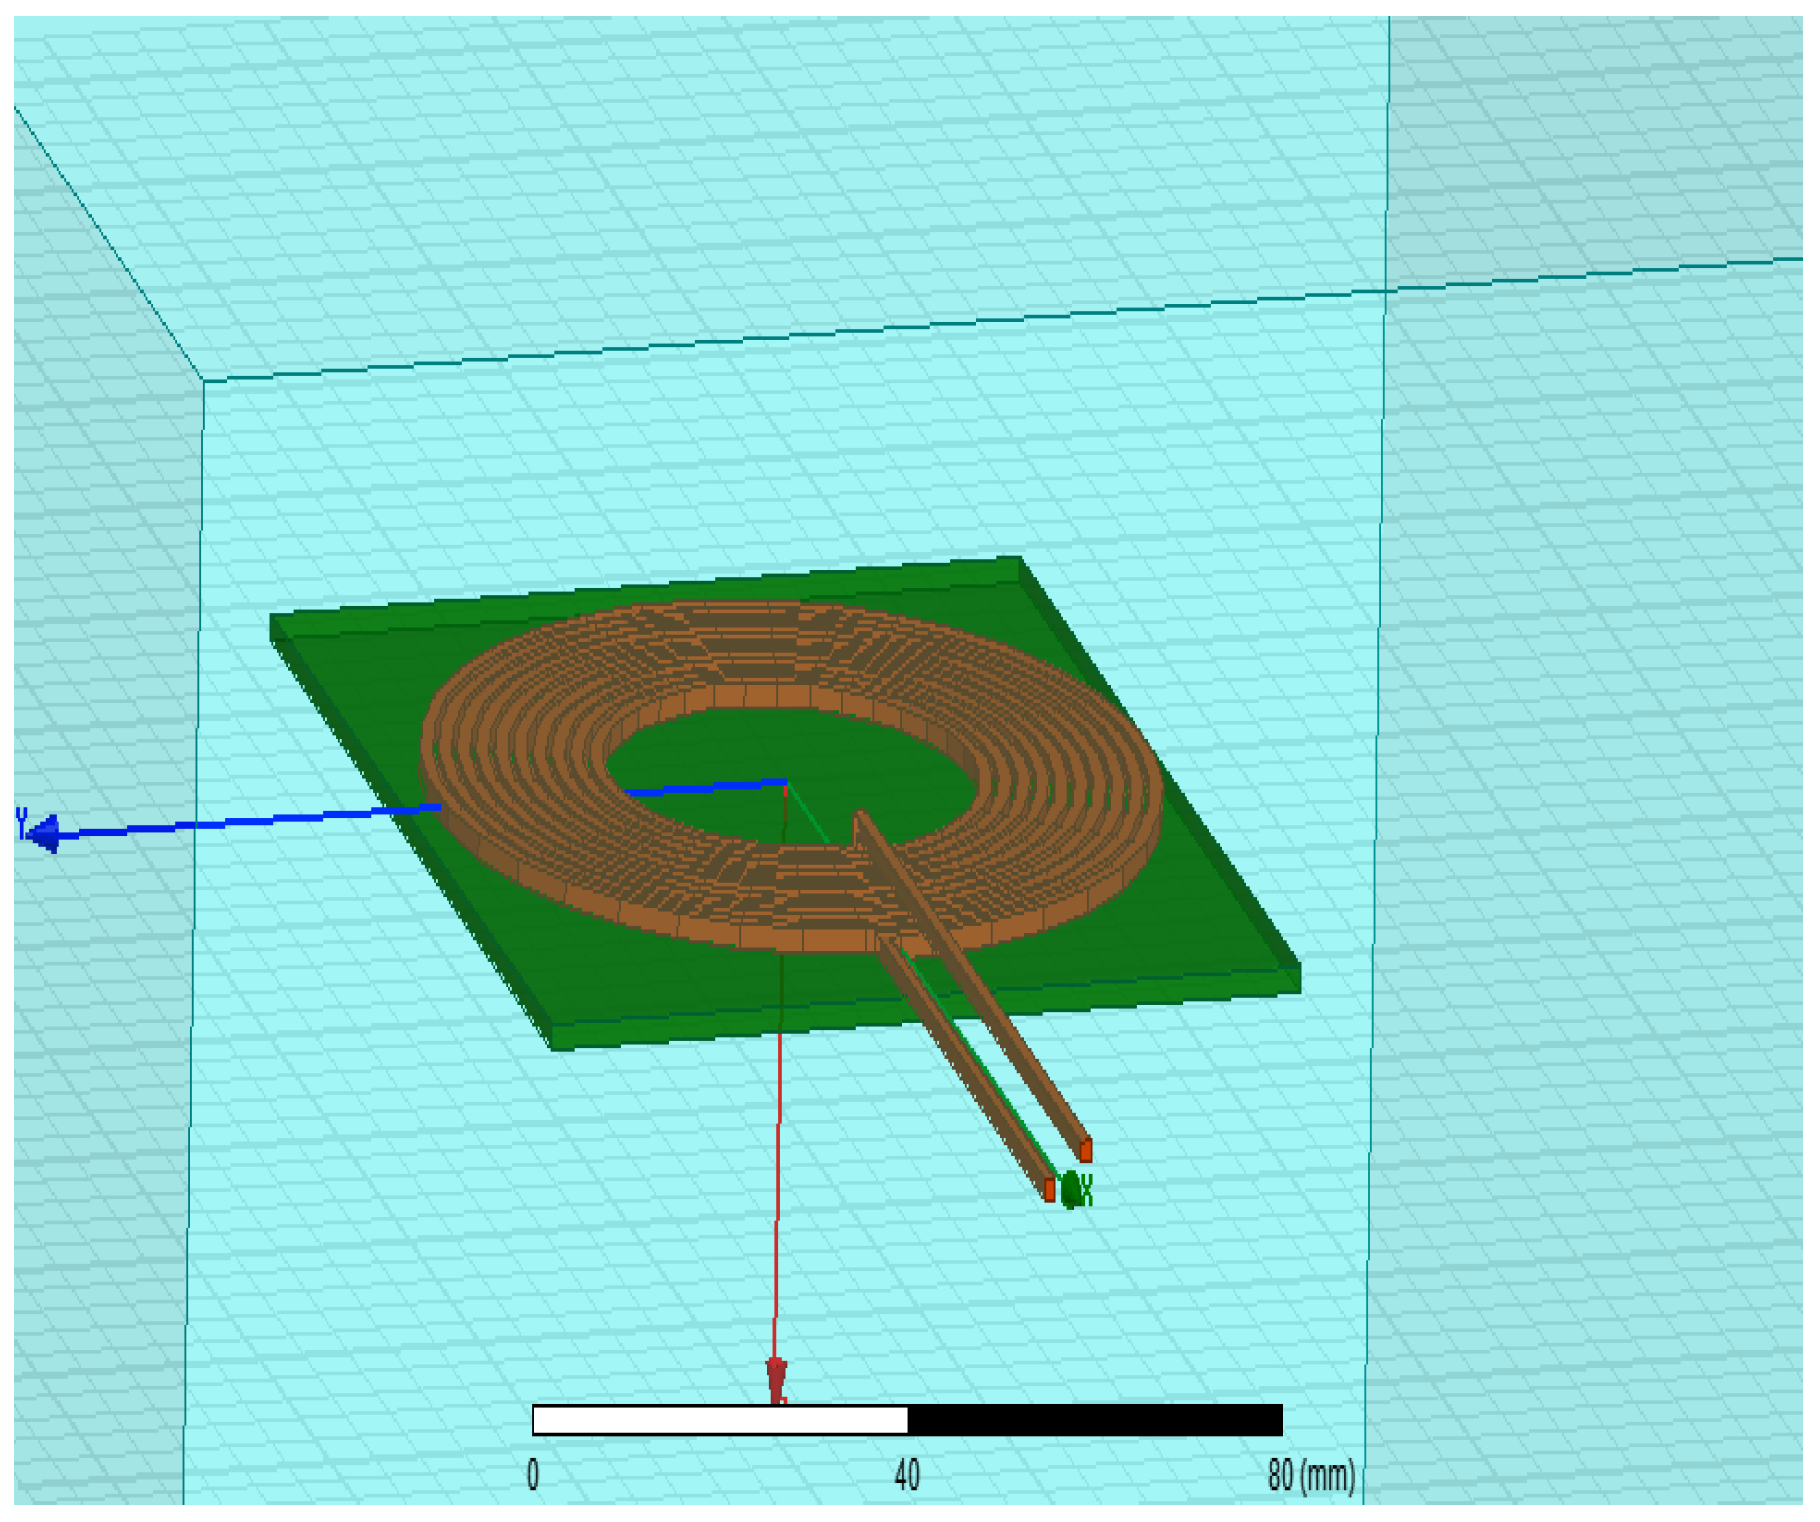
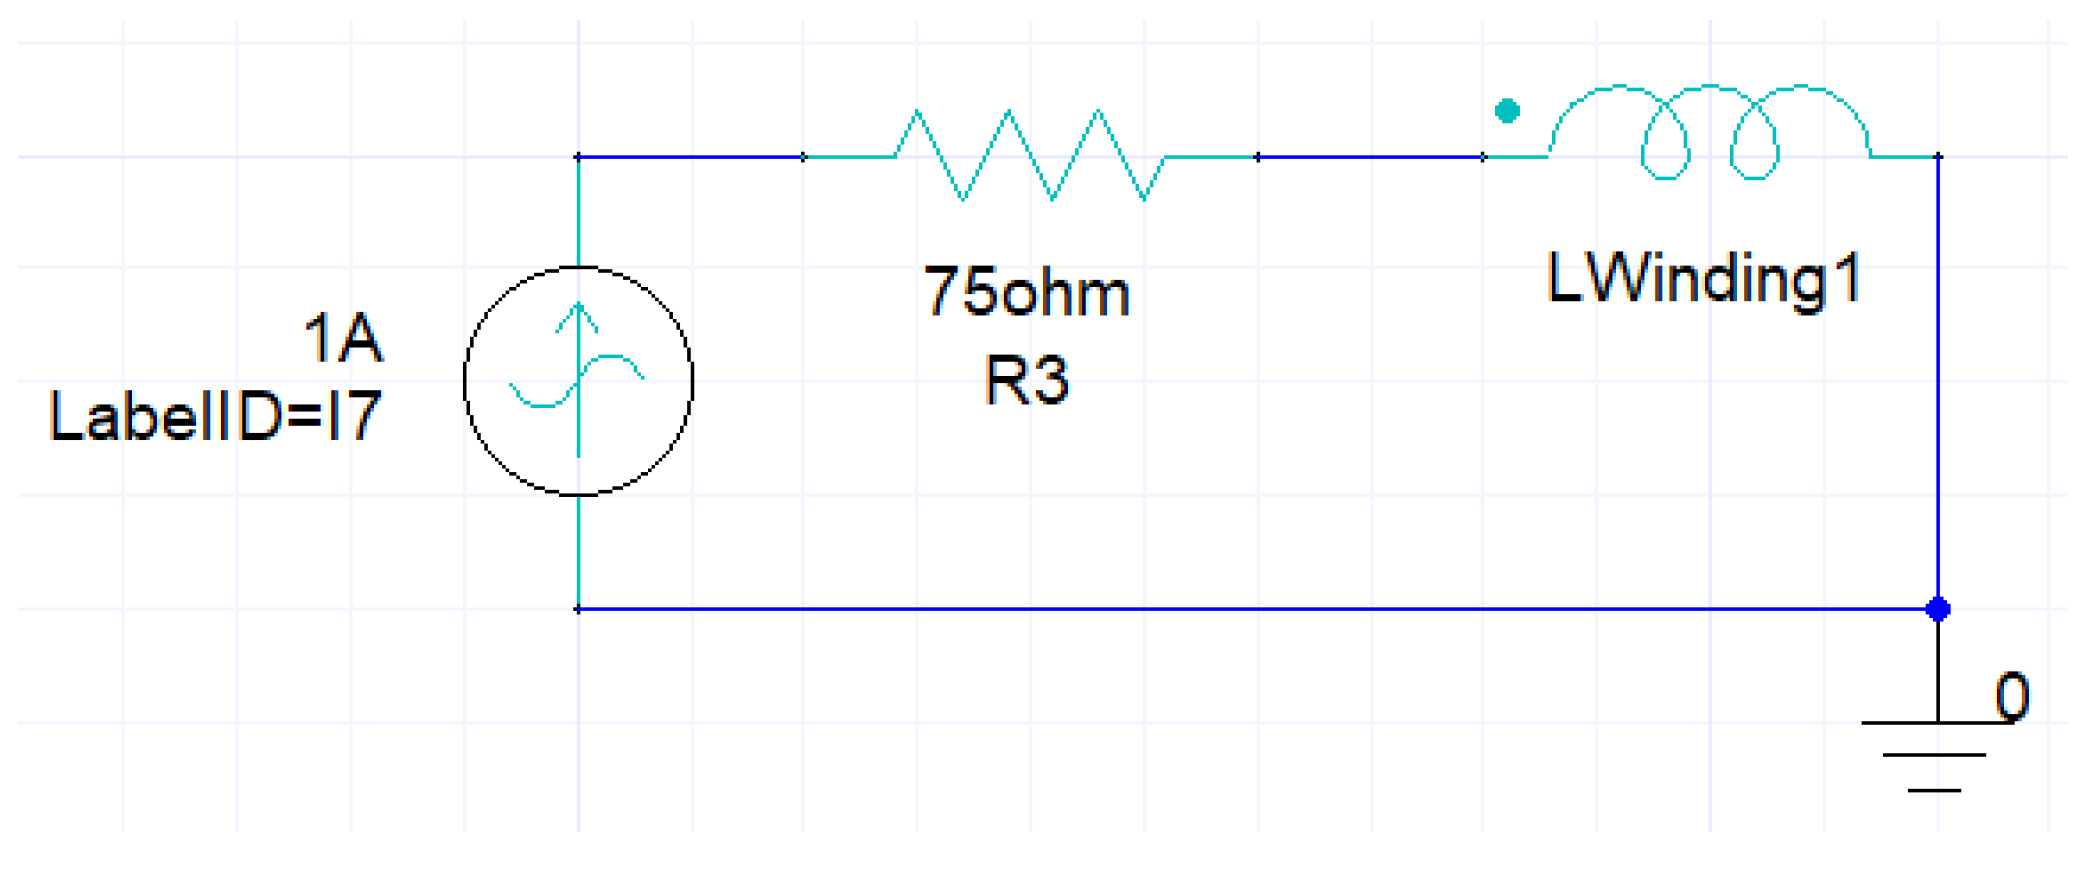
In the next step of analysis, the coil, along with its excitation circuit shown in
Figure 7 and
Figure 8, is analyzed with Ansys Maxwell software. This circuit is a circular copper coil submerged underwater with 10 turns and a radius of 1 mm. It is powered by a 1 A current.
Table 4 shows the obtained absolute value for magnetic flux density (
B, in Tesla units, T) and
Table 5 for magnetic field intensity (
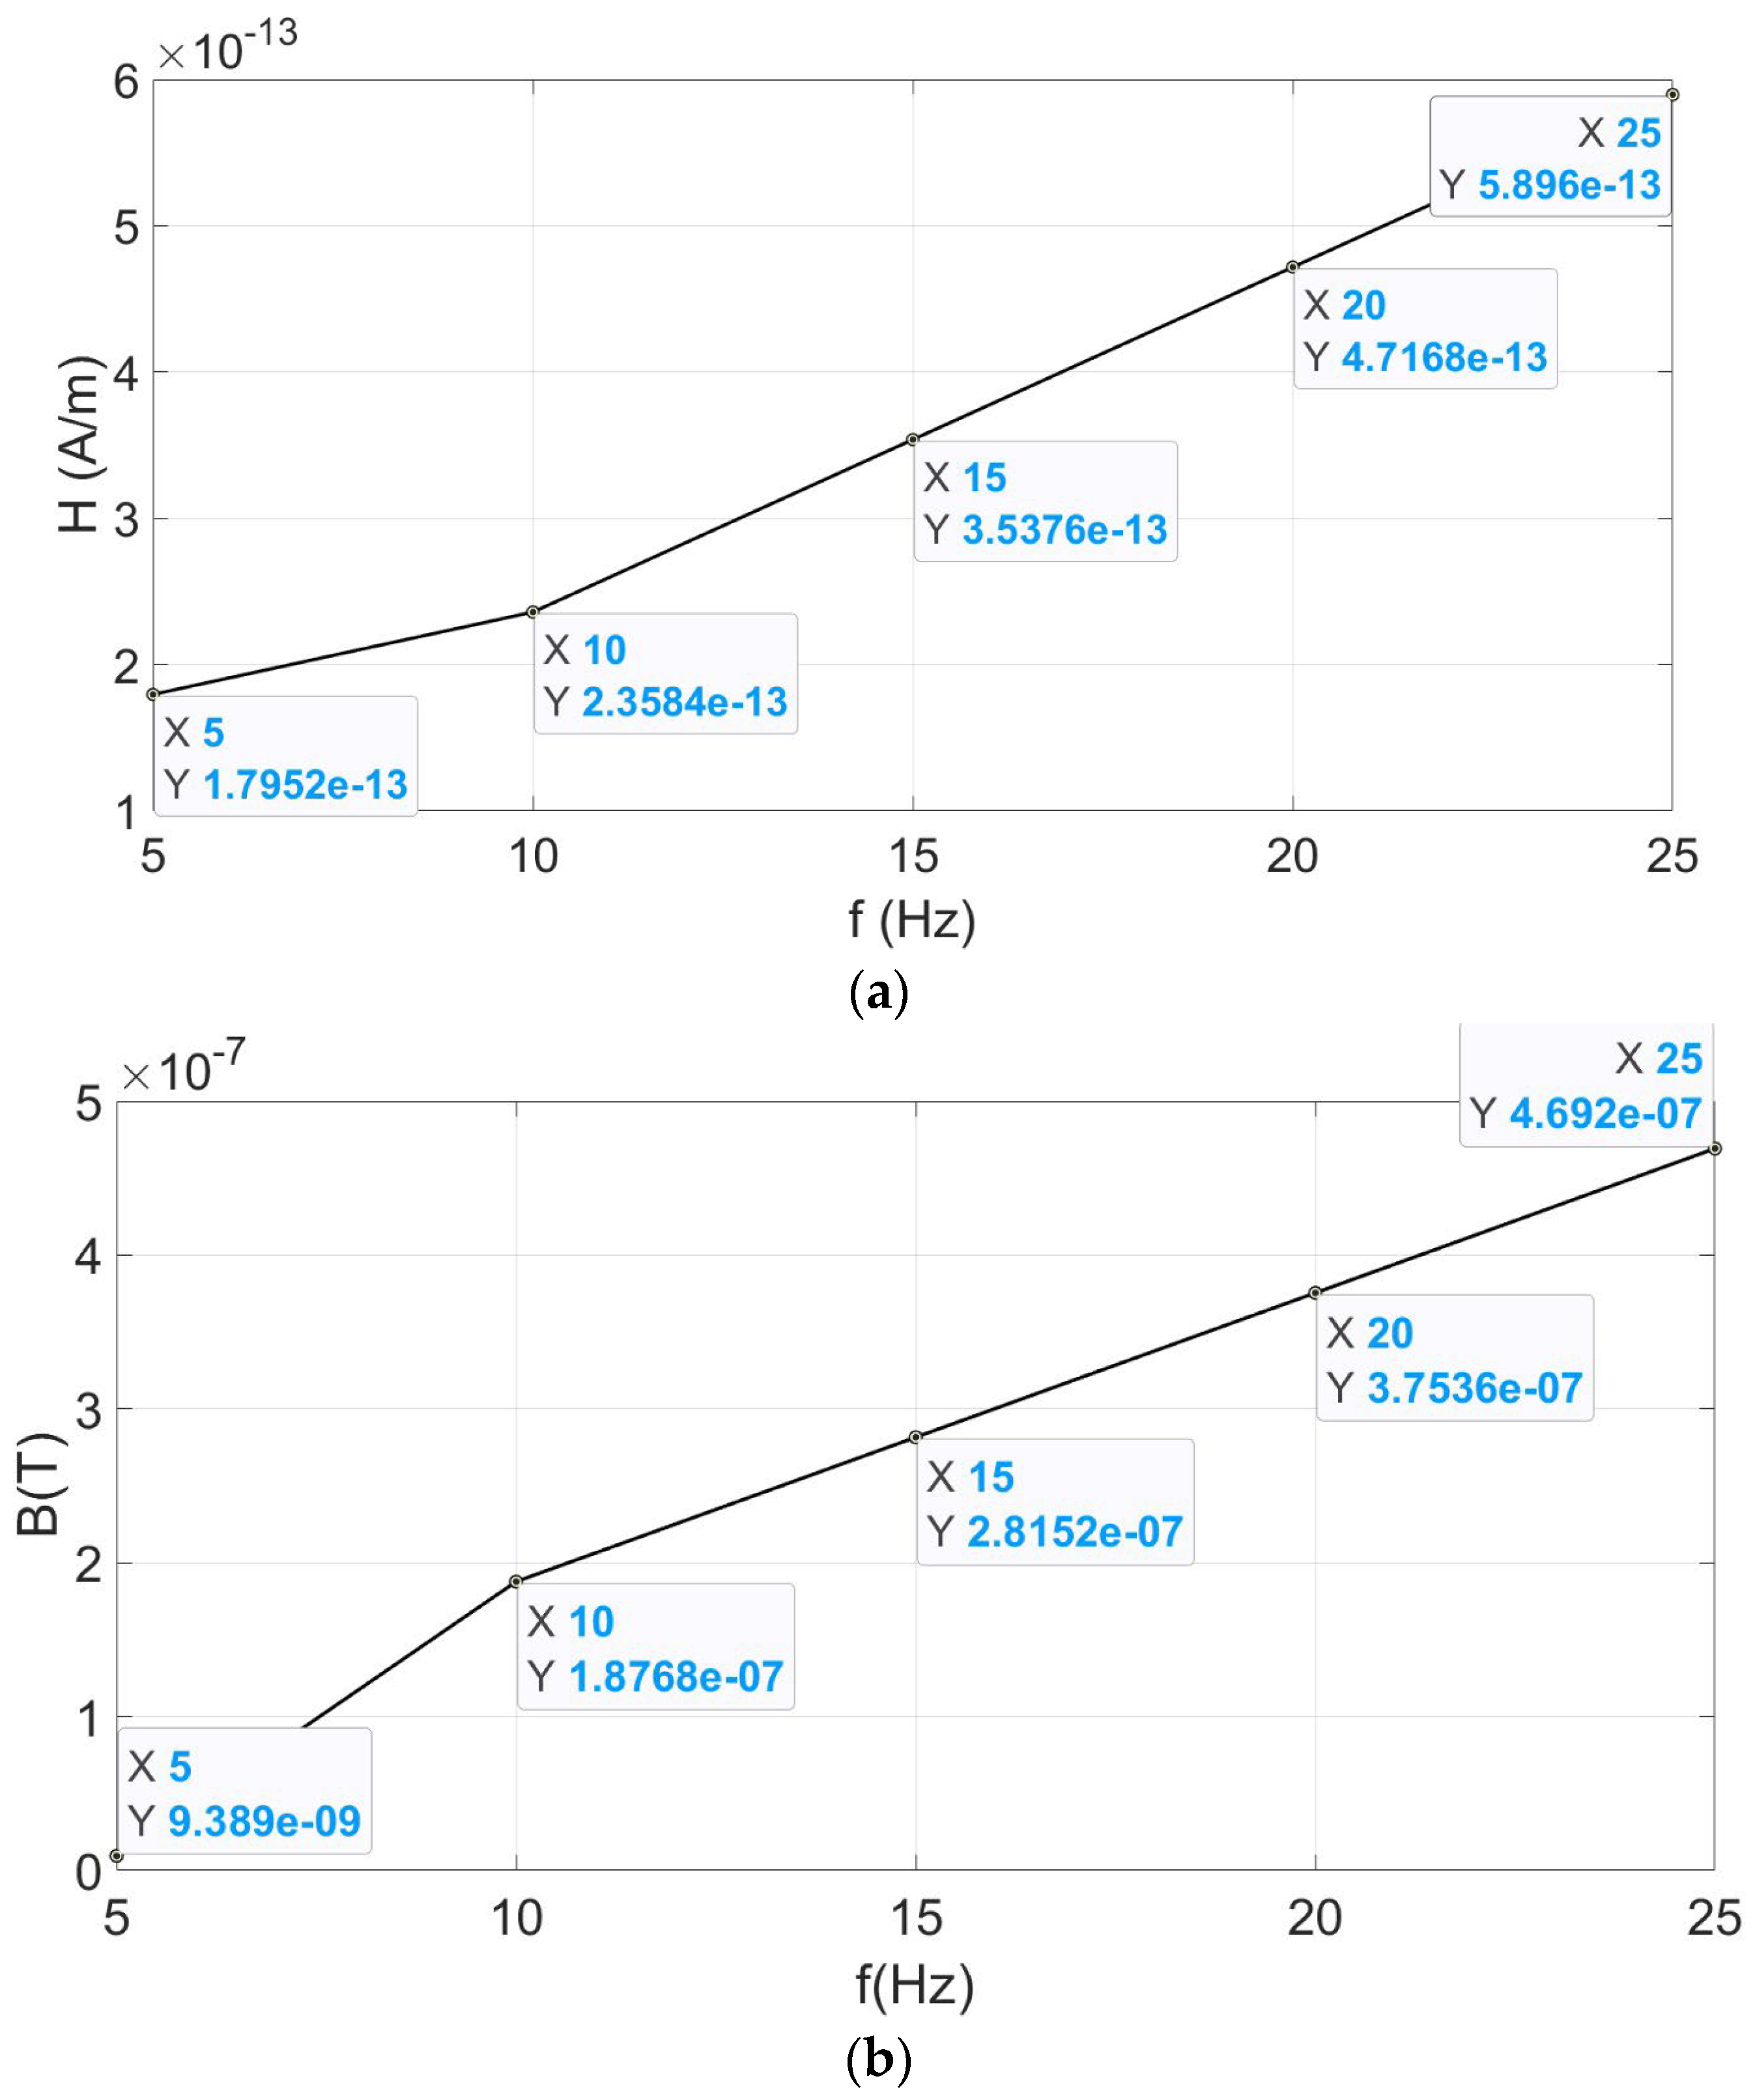
H, in Ampere/meter units) when frequency excitation in the coil varies from 5 to 25 Hz.
From
Figure 9a,b, it can be seen that H shows a linear relationship with frequency, whereas B does not. The relation between magnetic field intensity (H) and magnetic flux density (B) is the magnetic permeability µ (µ = B/H). In the case of ferromagnetic materials (iron, copper, etc.), the magnetic permeability can exhibit nonlinear behavior with frequency, for example, hysteresis phenomena.
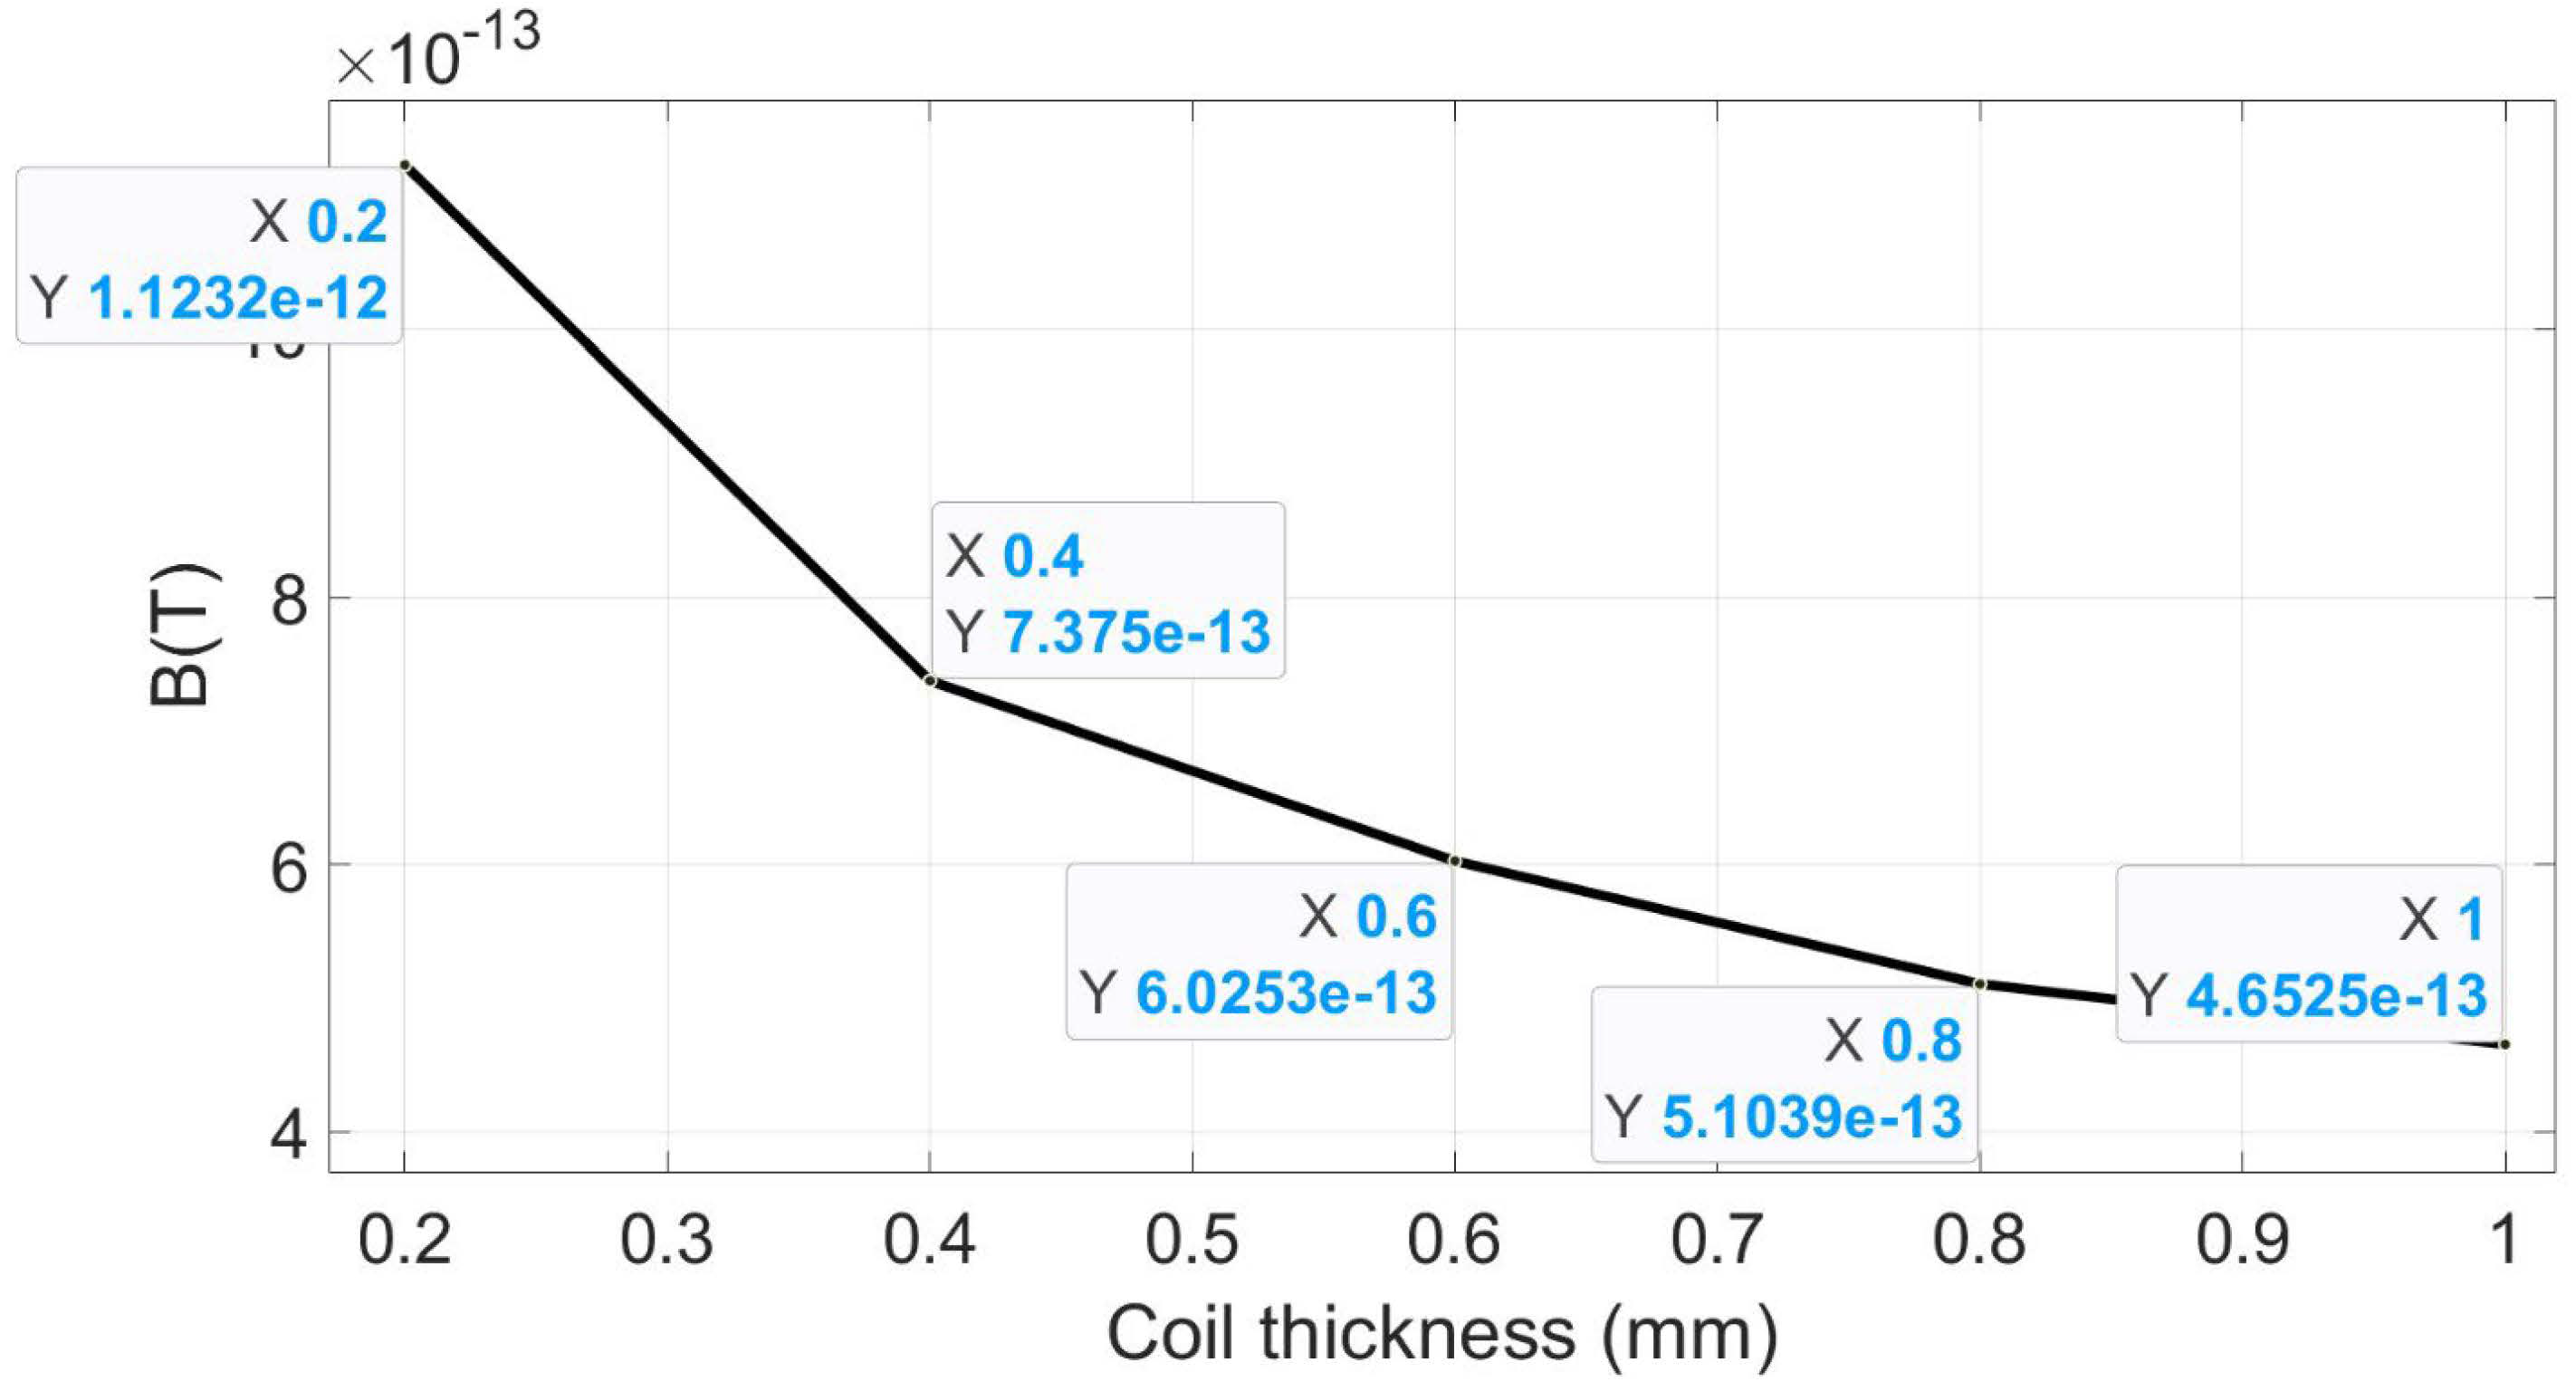
Let us fix the input frequency to 20 Hz and vary the coil thickness or coil radius in the same circuit from 0.2 to 1 mm (spacing between turns is fixed at 2.05 mm). The results obtained are presented in
Figure 10 and
Table 5.
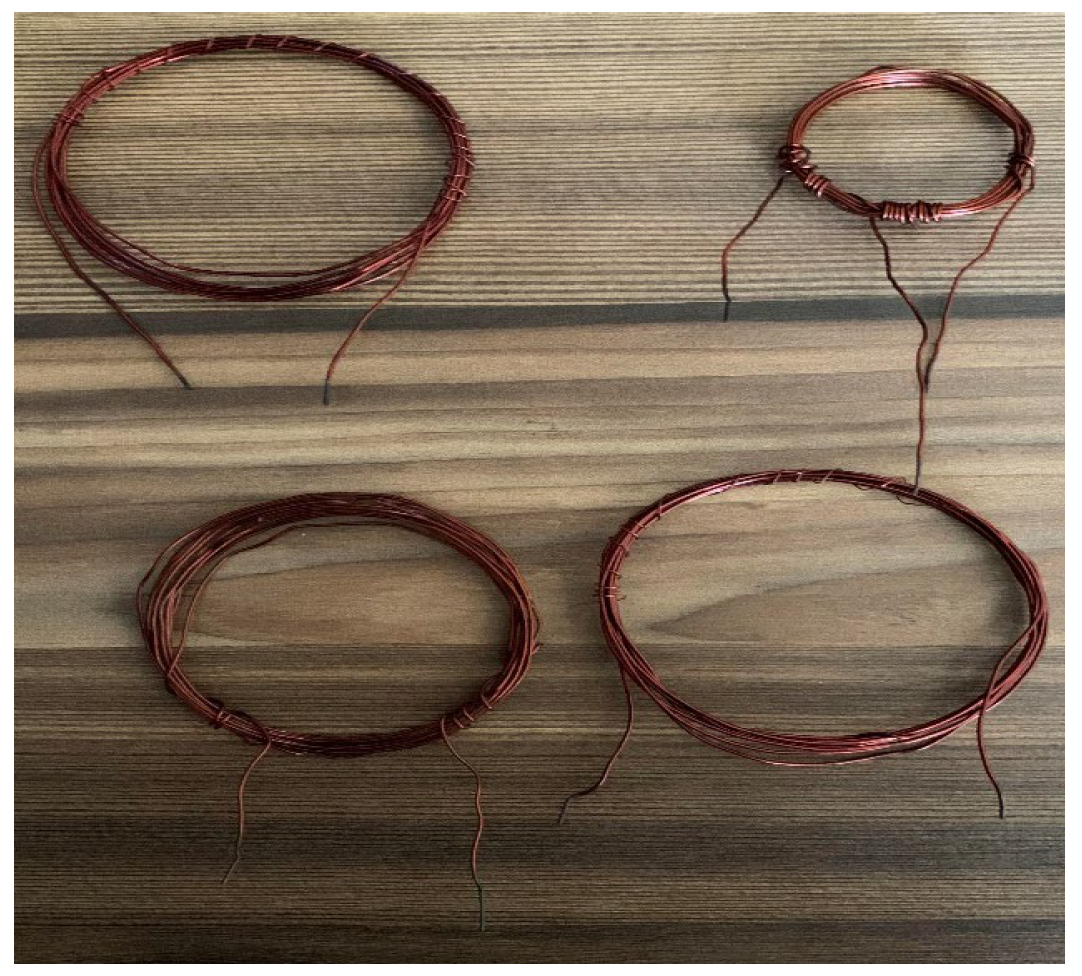
In
Figure 11, a set of different coils is shown in order to be used with the underwater setup of the WPT system.
As shown in
Table 5 and
Figure 12, the flux density decreases as the coil thickness is increased. This means that coil thickness can be adjusted to achieve the optimum magnetic field while selecting the right wire gauge. Increasing the current will also improve the results (a higher MI value). Further, the number of turns and weight can be balanced. A higher number of turns would also improve the MI, while increasing the coil’s weight.
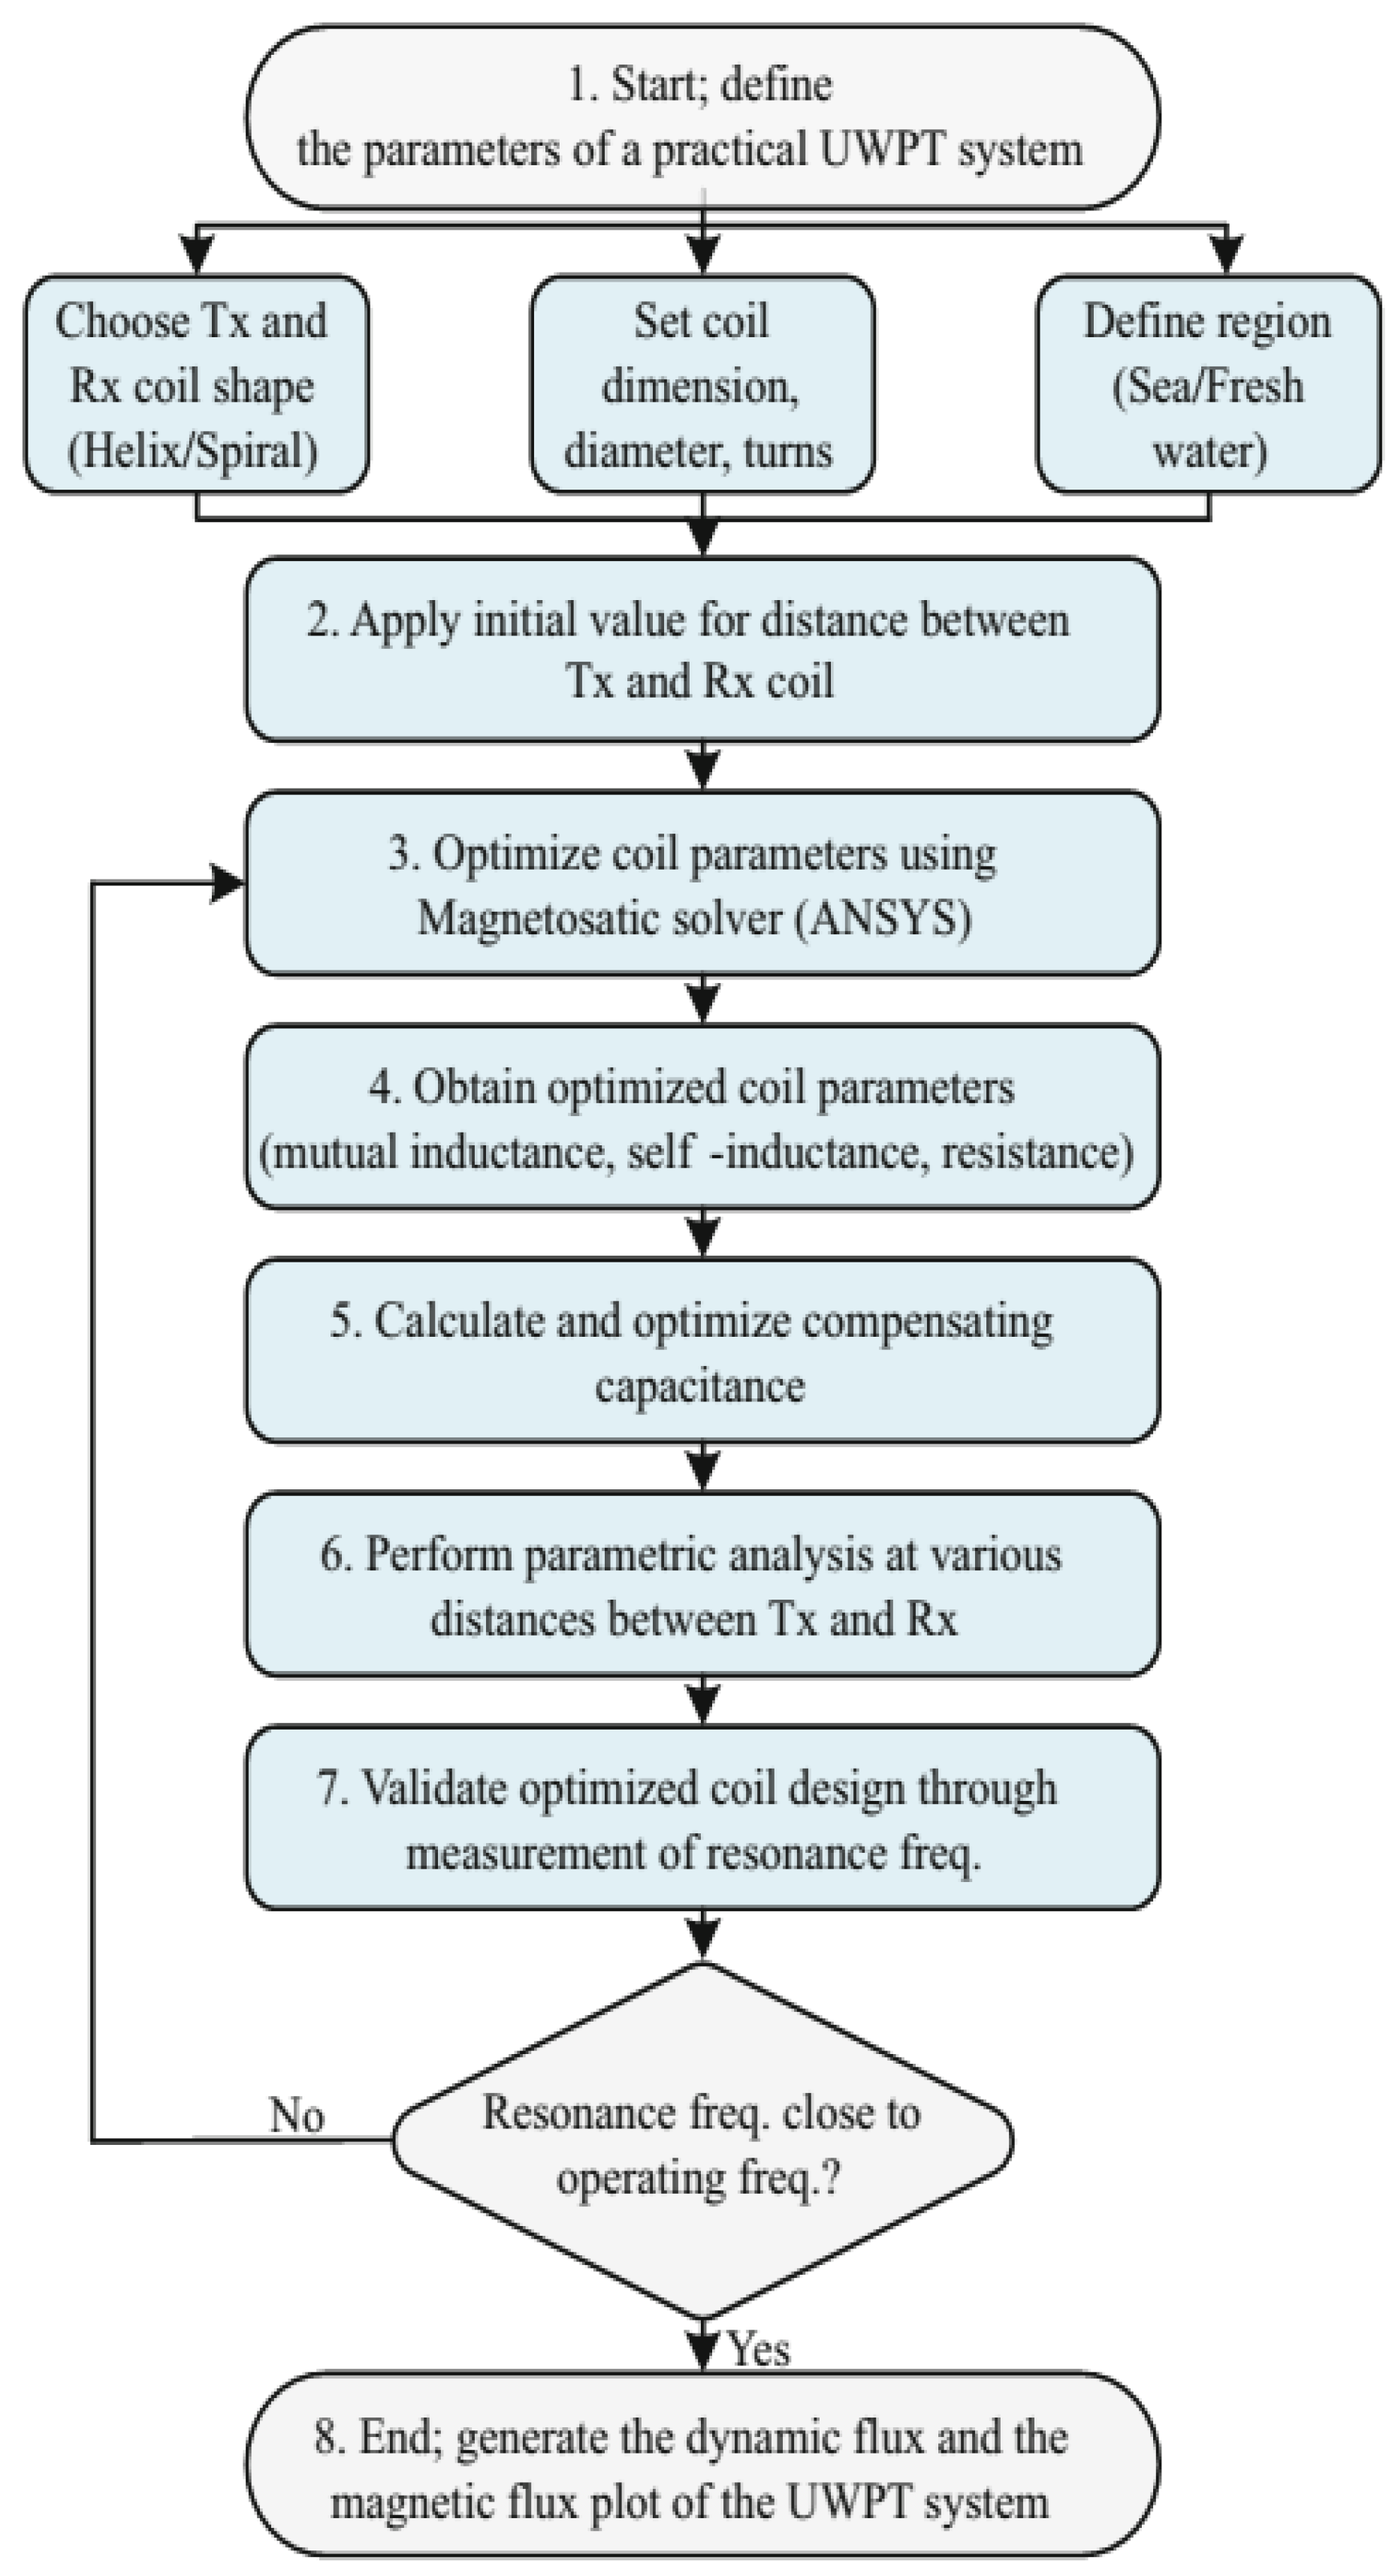
The following flow chart in
Figure 13 explains the steps that may be taken to experiment with various coil shapes, their parameters, underwater environment, excitation, and receiver circuit combinations in a magnetic solver in order to configure an optimized transmitter receiver setup that may provide more distance between them.
In order to follow the process shown in
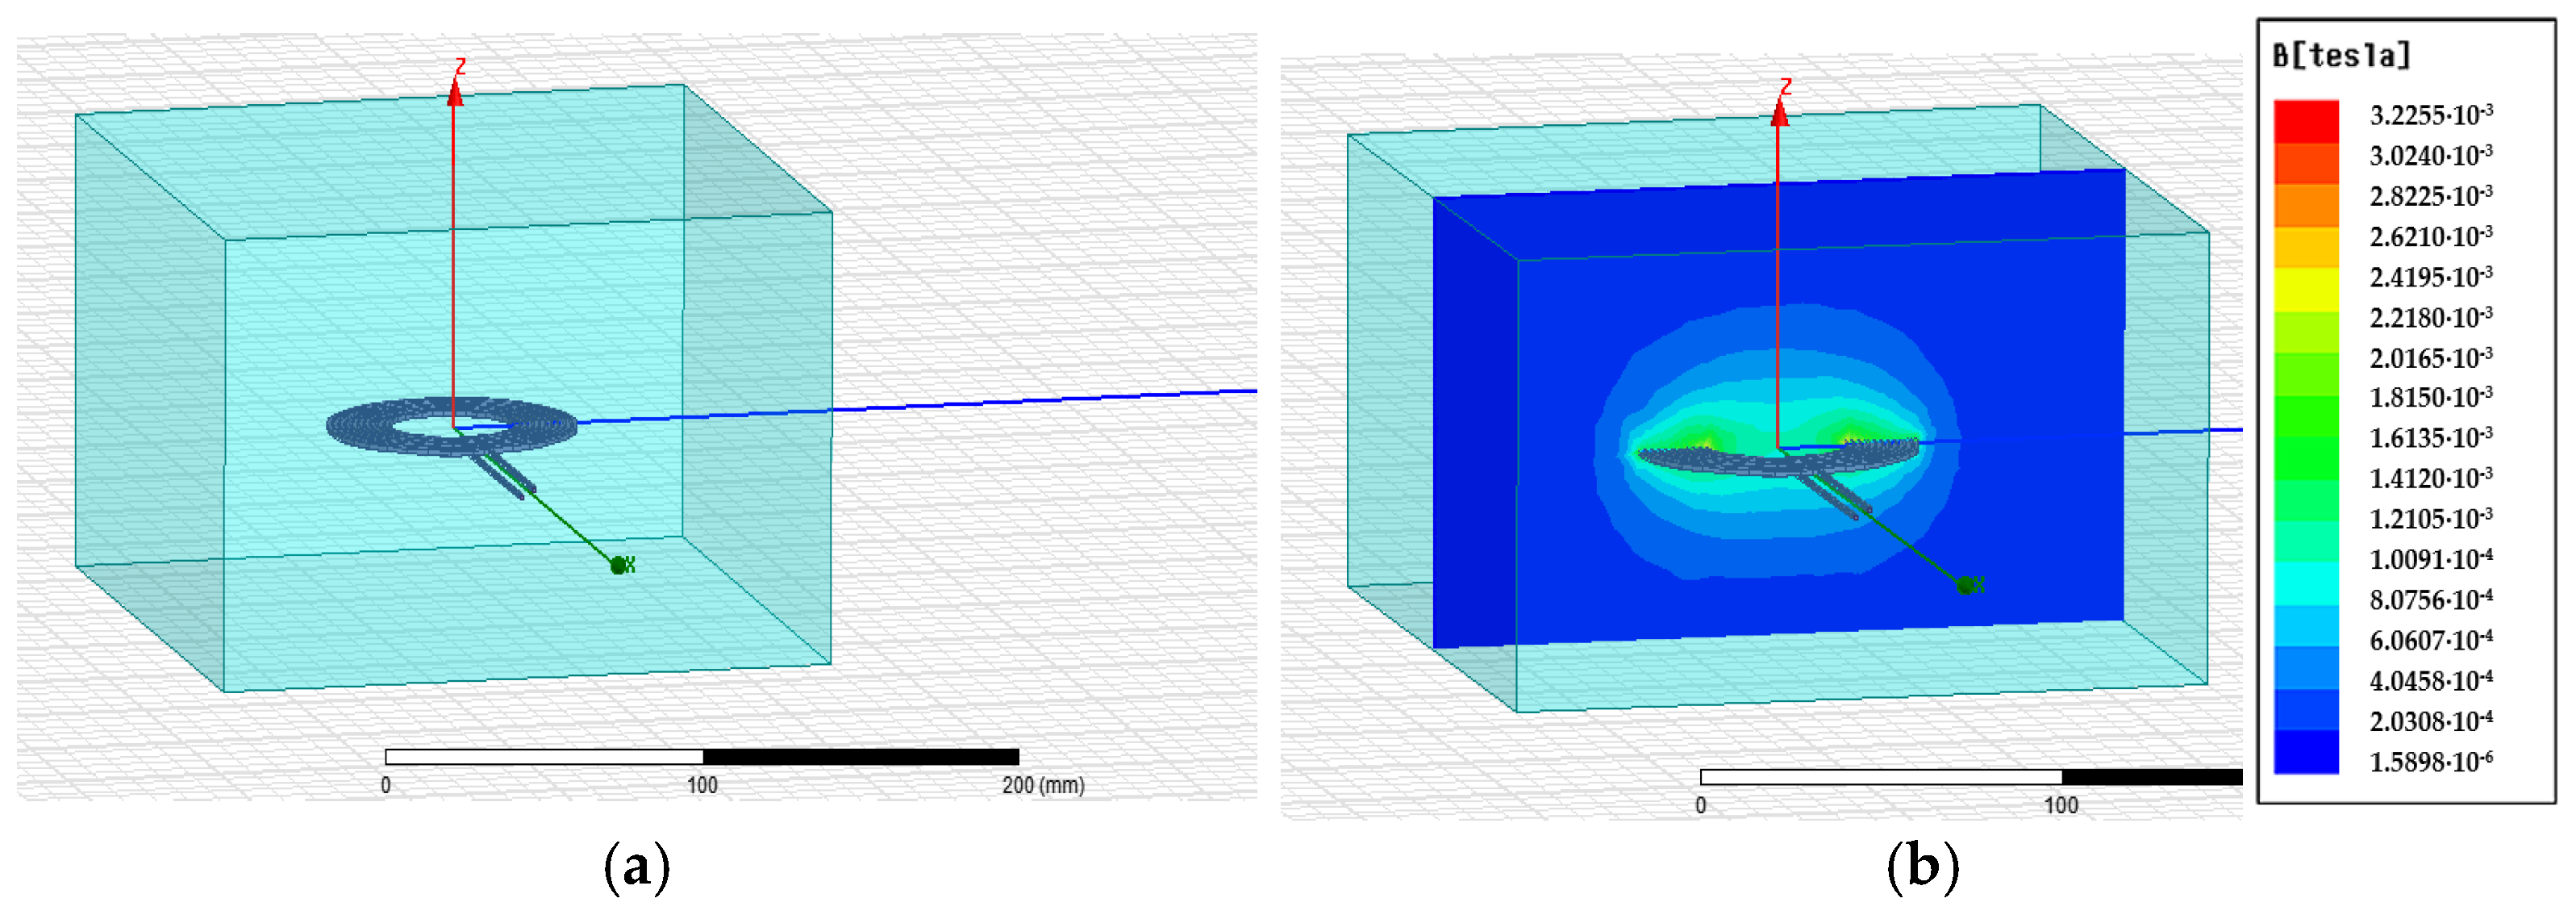
Figure 13, the next step for simulation will be to place the previous copper coil (circular shape, 10 turns, and radius 1 mm) in seawater, as is presented in
Figure 14a, with its corresponding simulated magnetic flux density (
Figure 14b).
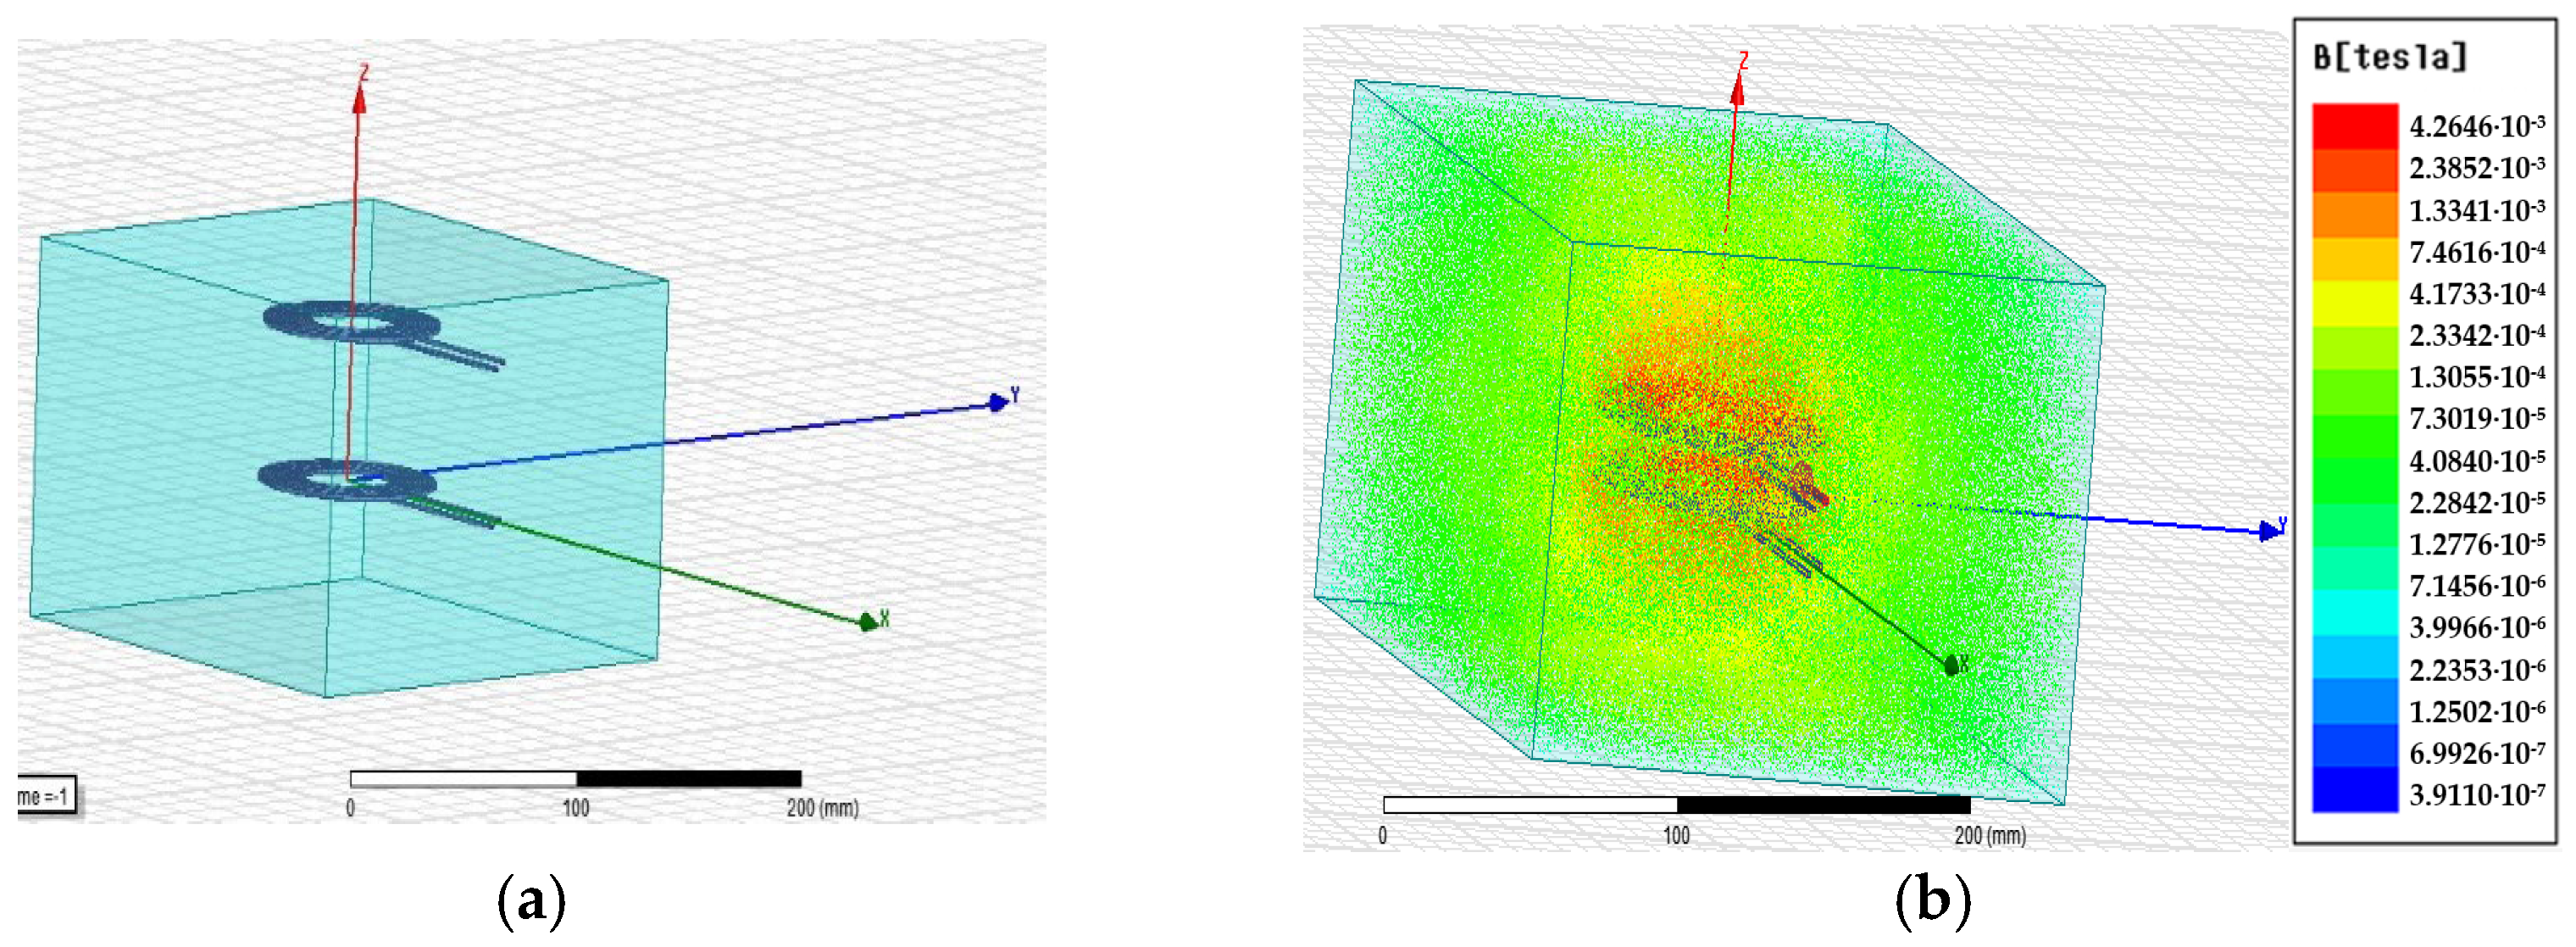
In the next step, we now set up two coils equal to those in
Figure 14a but with an exciting current of 5A. The setup is presented in
Figure 15a and its corresponding B flux in
Figure 15b.
An important parameter which measures the coupling between the coils is the mutual inductance
M, defined by the following:
where K is the coupling magnetic coefficient, and
,
the self-inductance of coils 1 and 2, respectively. In this new experiment, we keep the current constant at 5A and only the distance between the coils is varied.
Table 6 shows the change in
between the coils, and their self-inductance is isolated.
From
Table 6, it can also be seen how the mutual inductance (
) and coefficient of coupling (
) increase when both coils are closer, but they decrease when they are kept far apart.
3.4. Experimentation in the Laboratory
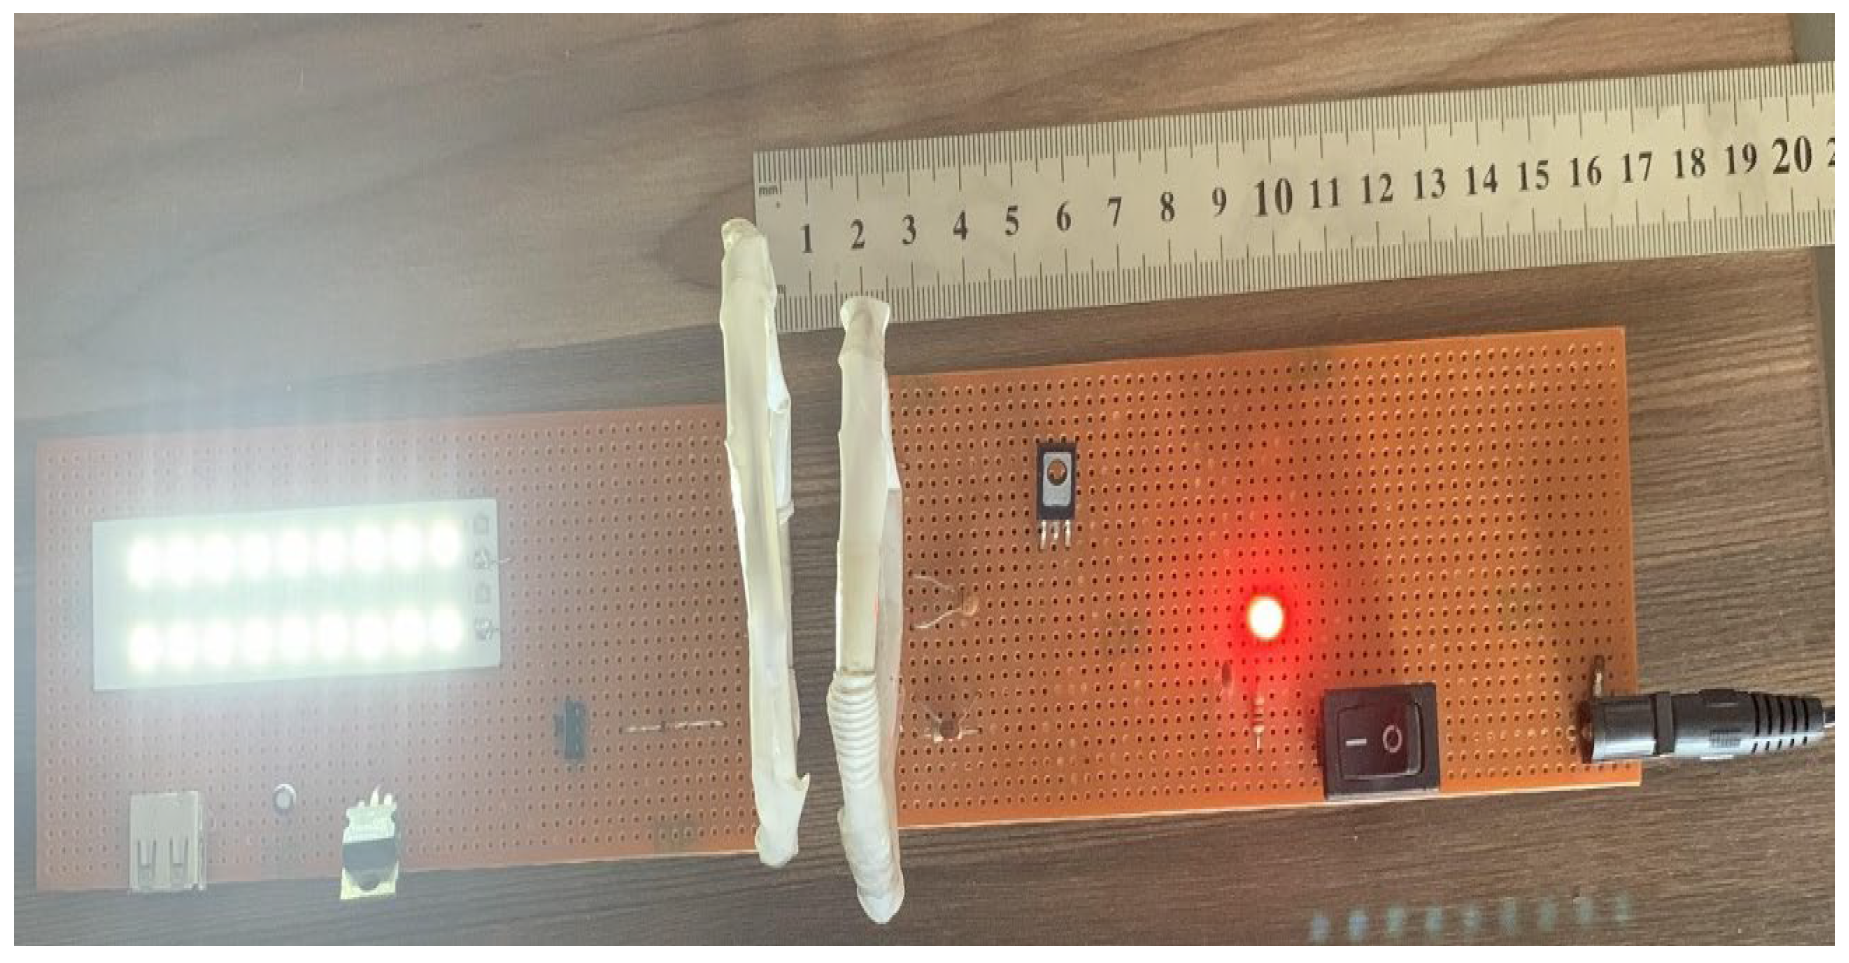
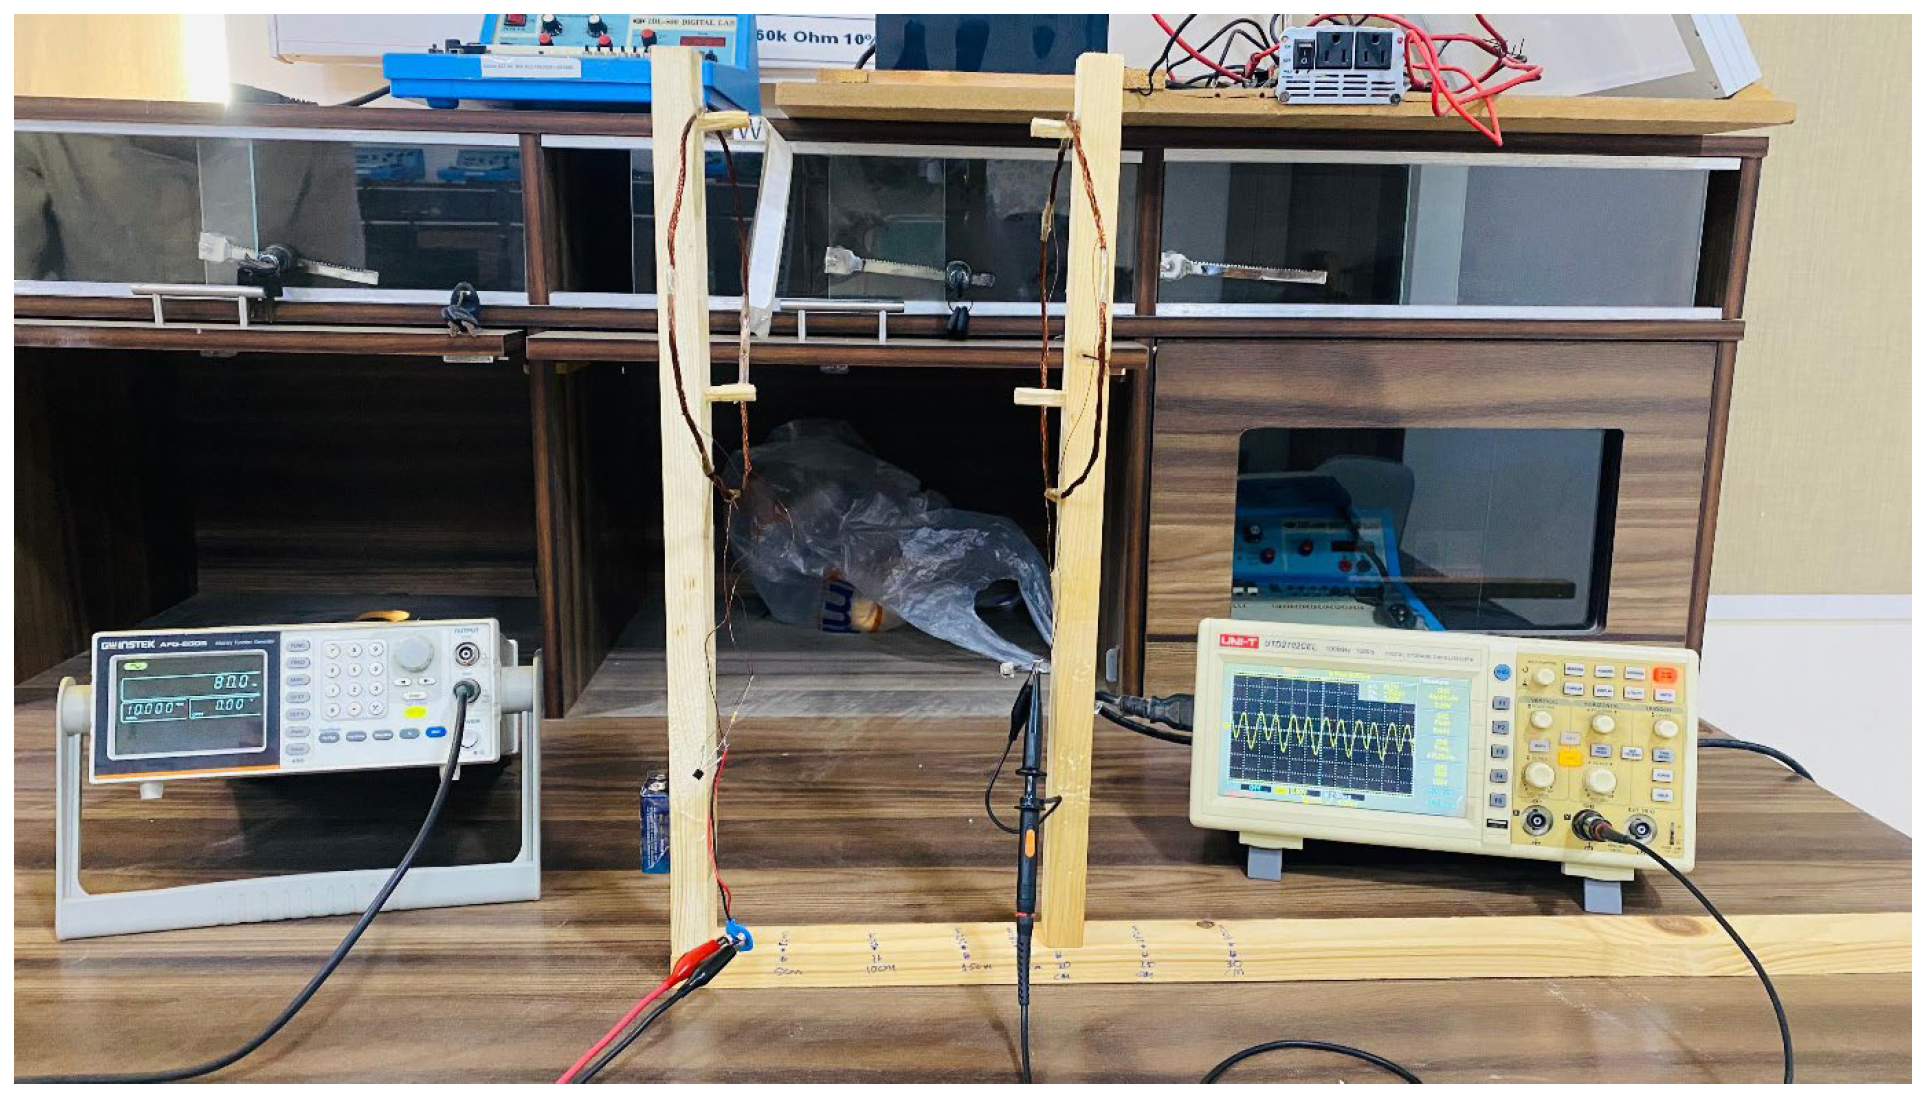
In order to verify WPT operation, a simple aerial prototype is made in the laboratory using handmade coils. The setup is shown in
Figure 16 and can be seen as the energy transmitter (right circuit connected to the power supply), feeding the receiver circuit (on the left), which lights the LED array. The setup parameters and results obtained are presented in
Table 7.
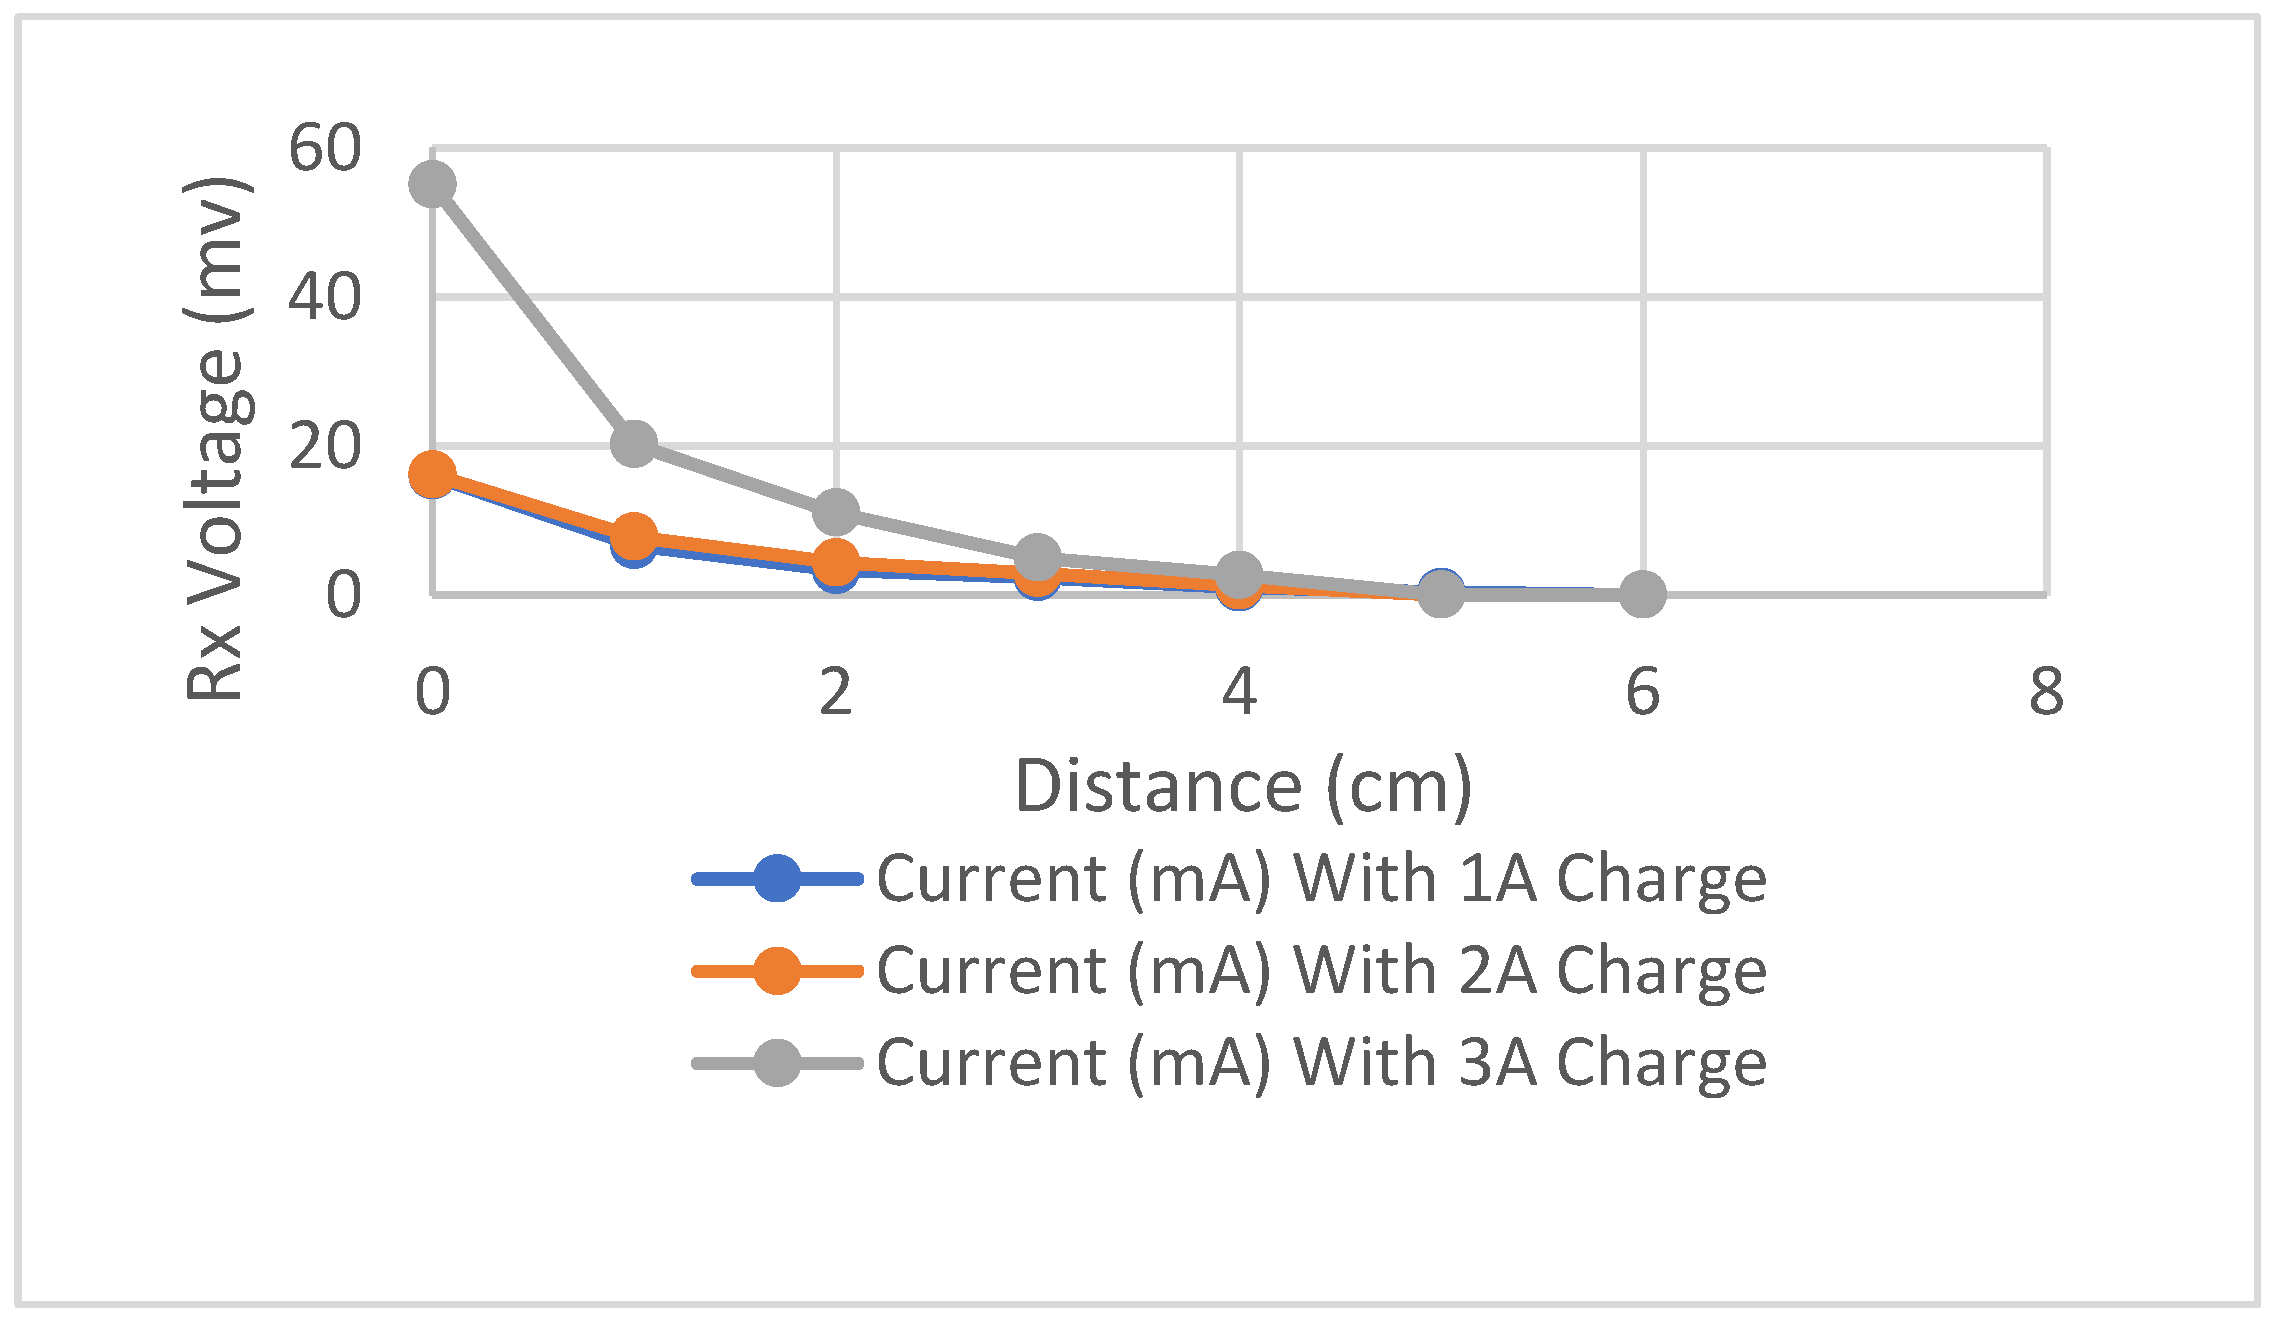
An important feature of a WPT system is the range between the two circuits, the transmitter and the receiver. To estimate this, the supply current varied from 1 A to 4 A in the same prototype. The results obtained for both the aerial and submarine configurations are shown in
Table 8.
From the information in
Table 8, we observe that the voltage received decreases less when the range is increased underwater. From
Table 8, we observe that when power is transmitted underwater, the range is comparatively greater when the current increases.
To enhance the range available between transmitter and receiver, we can increase the quality coil
Q, defined by the following expression:
where f is the signal frequency; r is the spiral radius;
the magnetic permeability; N is the number of turns; R is the resistance of coil; and L is the length of the coil. Another figure of merit related to the quality of the coil is the loss factor, given by the following expression:
The loss factor decreases when the coupling factor
or coil
quality increases. From (9), it can be observed that an increase in the number of turns and radius of the coil results in a higher quality factor. At the same time, this increase would come at the cost of a longer coil and, consequently, higher resistance. Another way is to set the frequency very high, but it is limited to the point where attenuation is at a minimum, as shown in
Figure 6.
The loss factor includes both the skin effect and the proximity effect. Skin effect is when current tends to flow on the outer surface only, rather than being uniformly distributed across the cross-section, and proximity effects [
23]. Due to this effect, eddy currents may flow into nearby coils, thereby producing the proximity effect by crowding the current in the nearby conductor.
In the next step, we prepare a setup to conduct the experiment on the coils using basic transistor-based ASK modulation as shown in
Figure 17, which is an amplitude shift keying method, to propagate signals between the coils while keeping air as the medium. At first, we change the number of turns of both coils, whereas other parameters are kept the same.
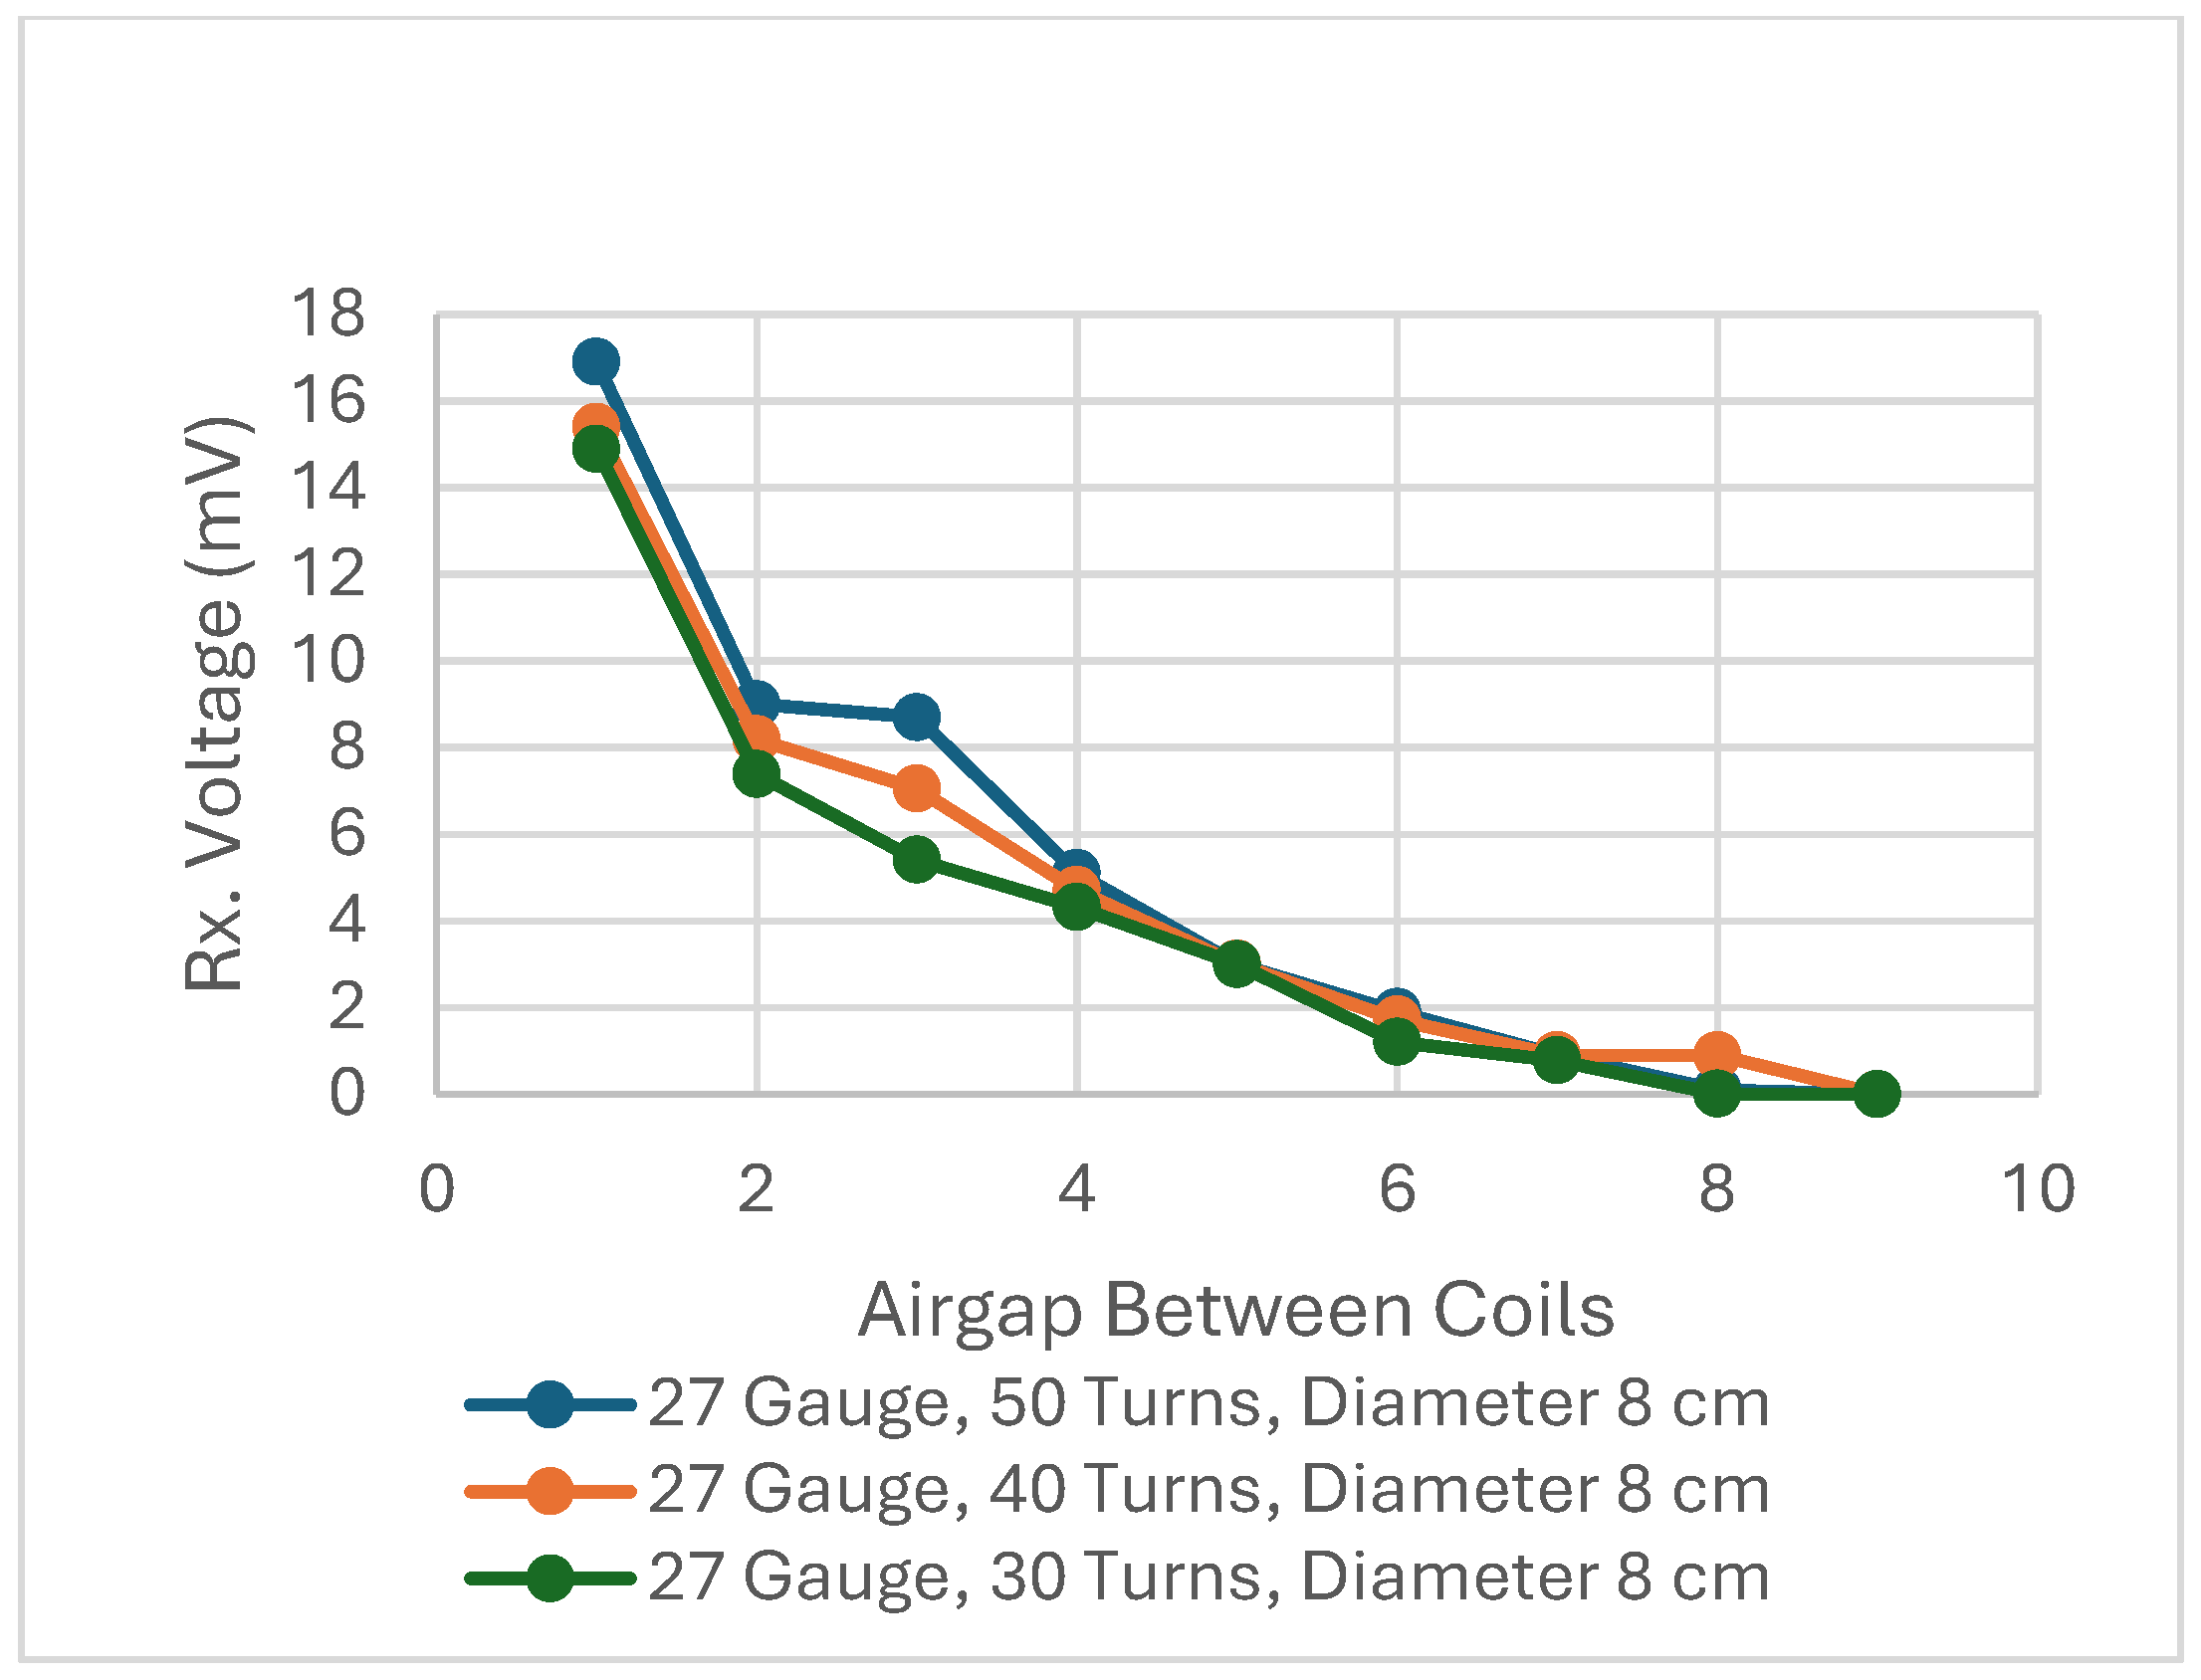
The above results in
Table 9 and
Figure 18 show that the coil having a higher number of turns achieves more mutual voltage and is able to operate at a further distance as compared to others.
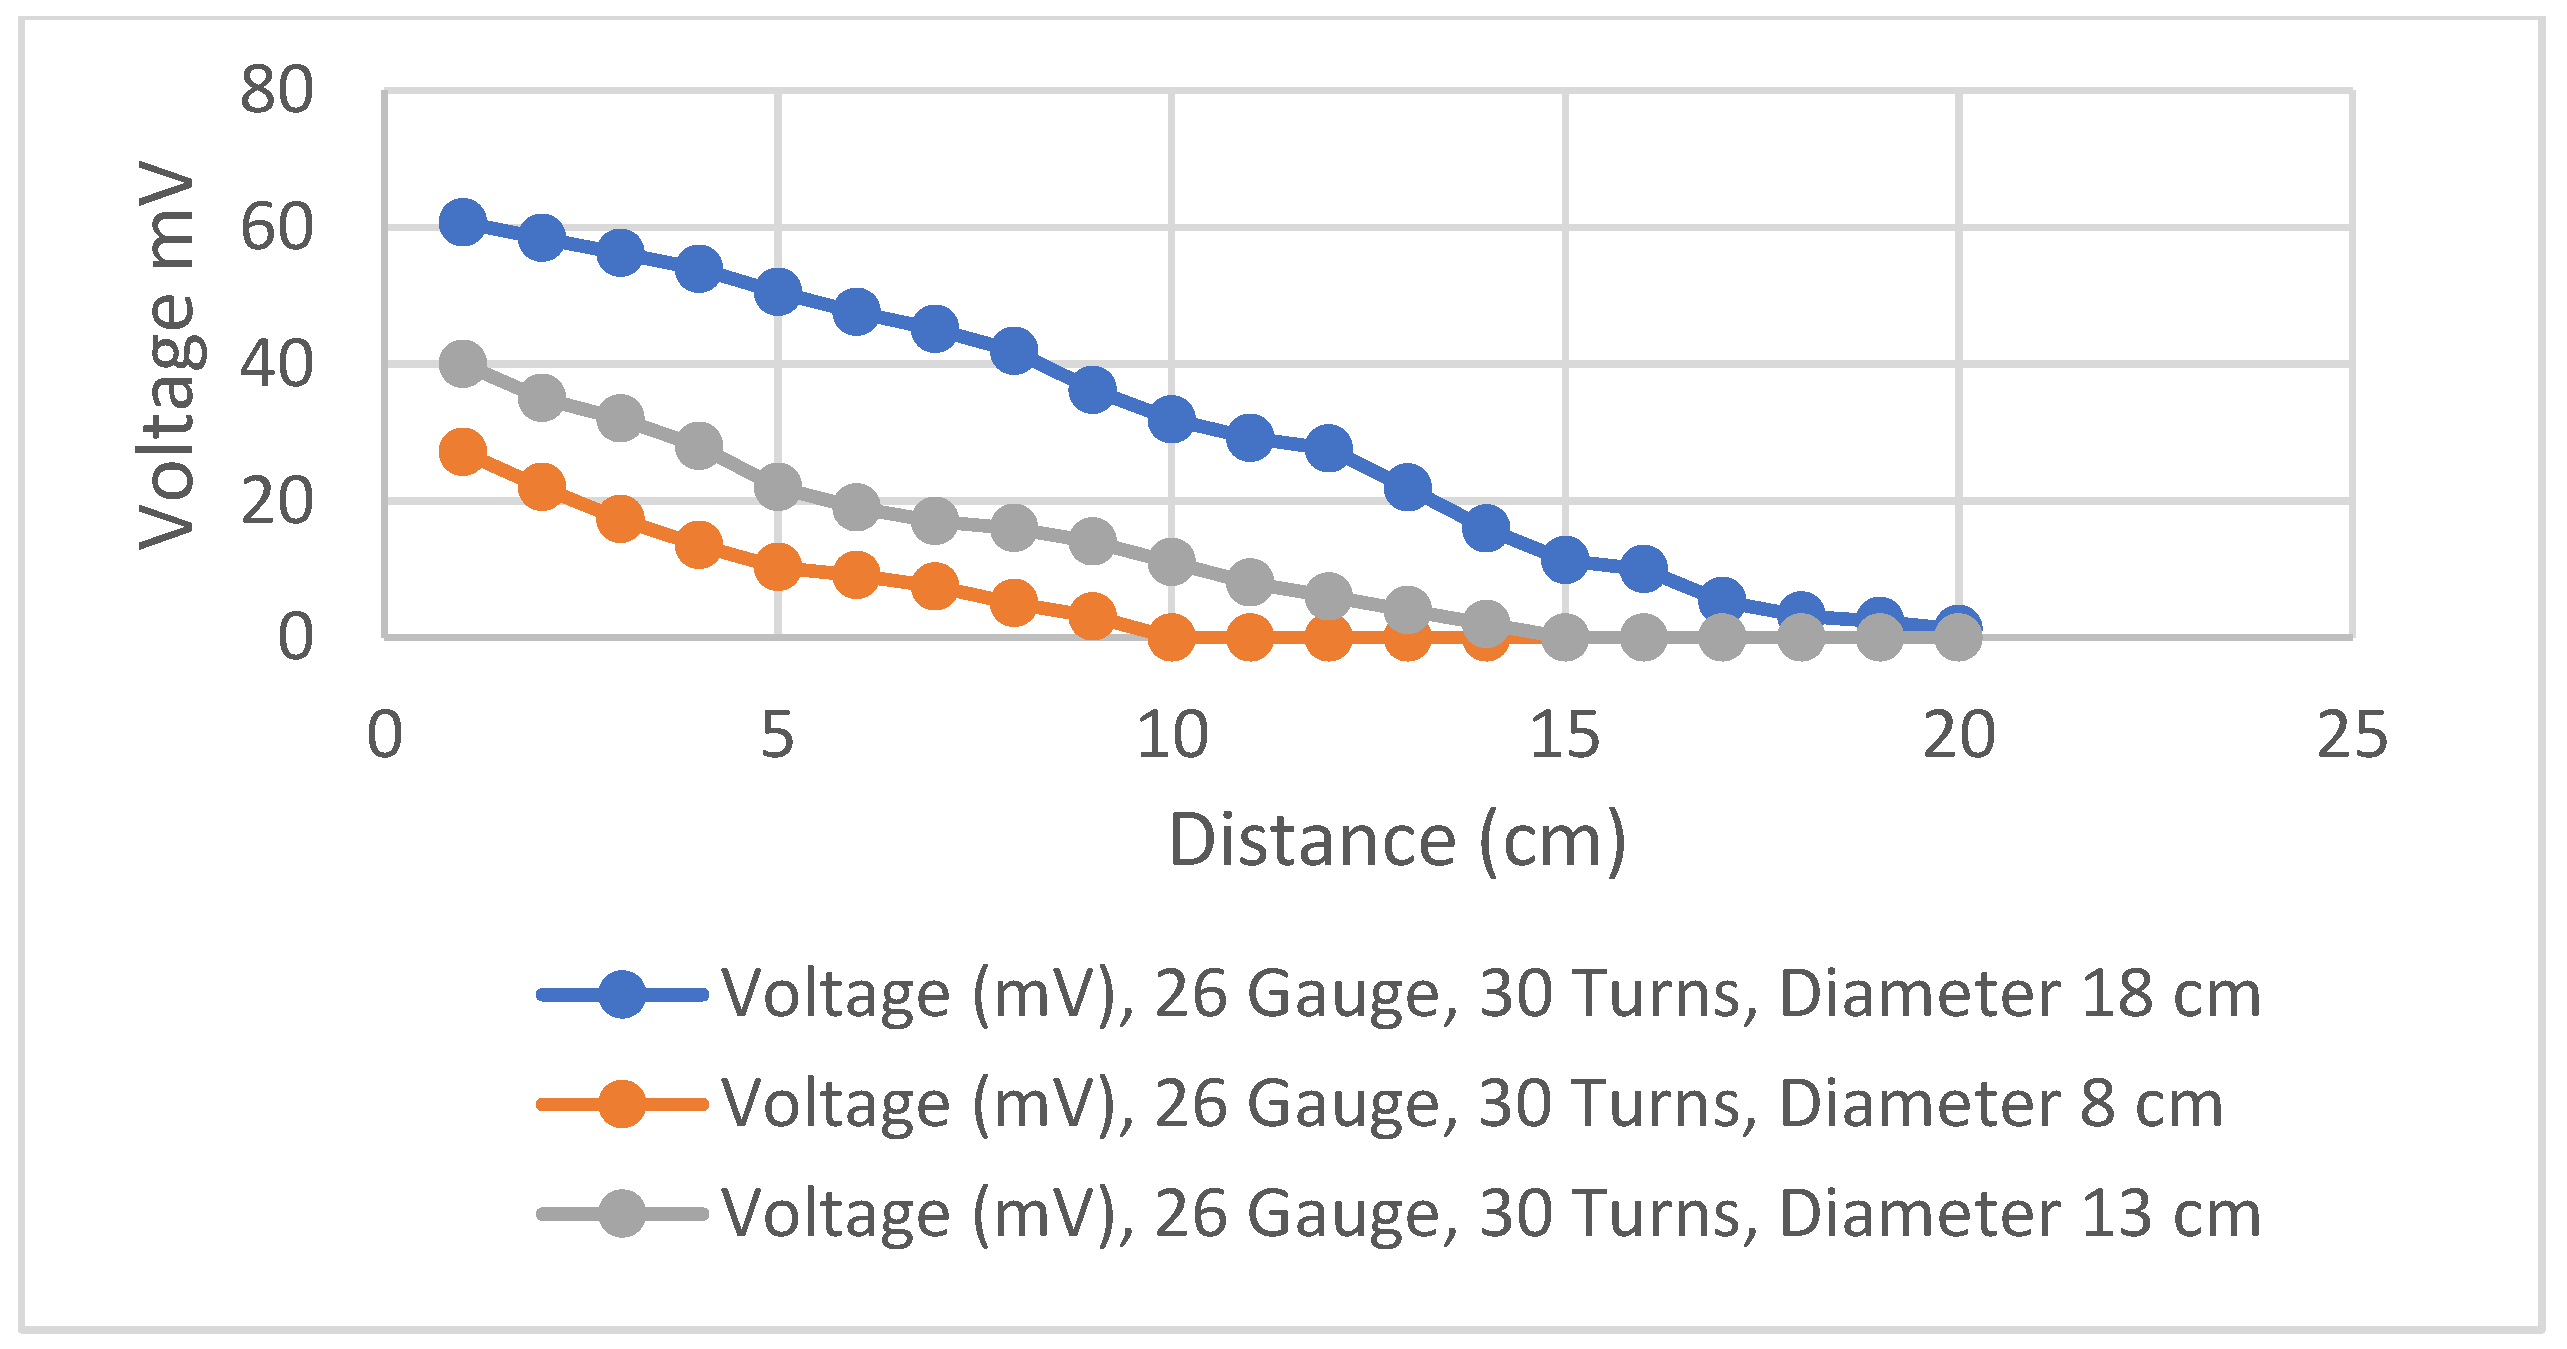
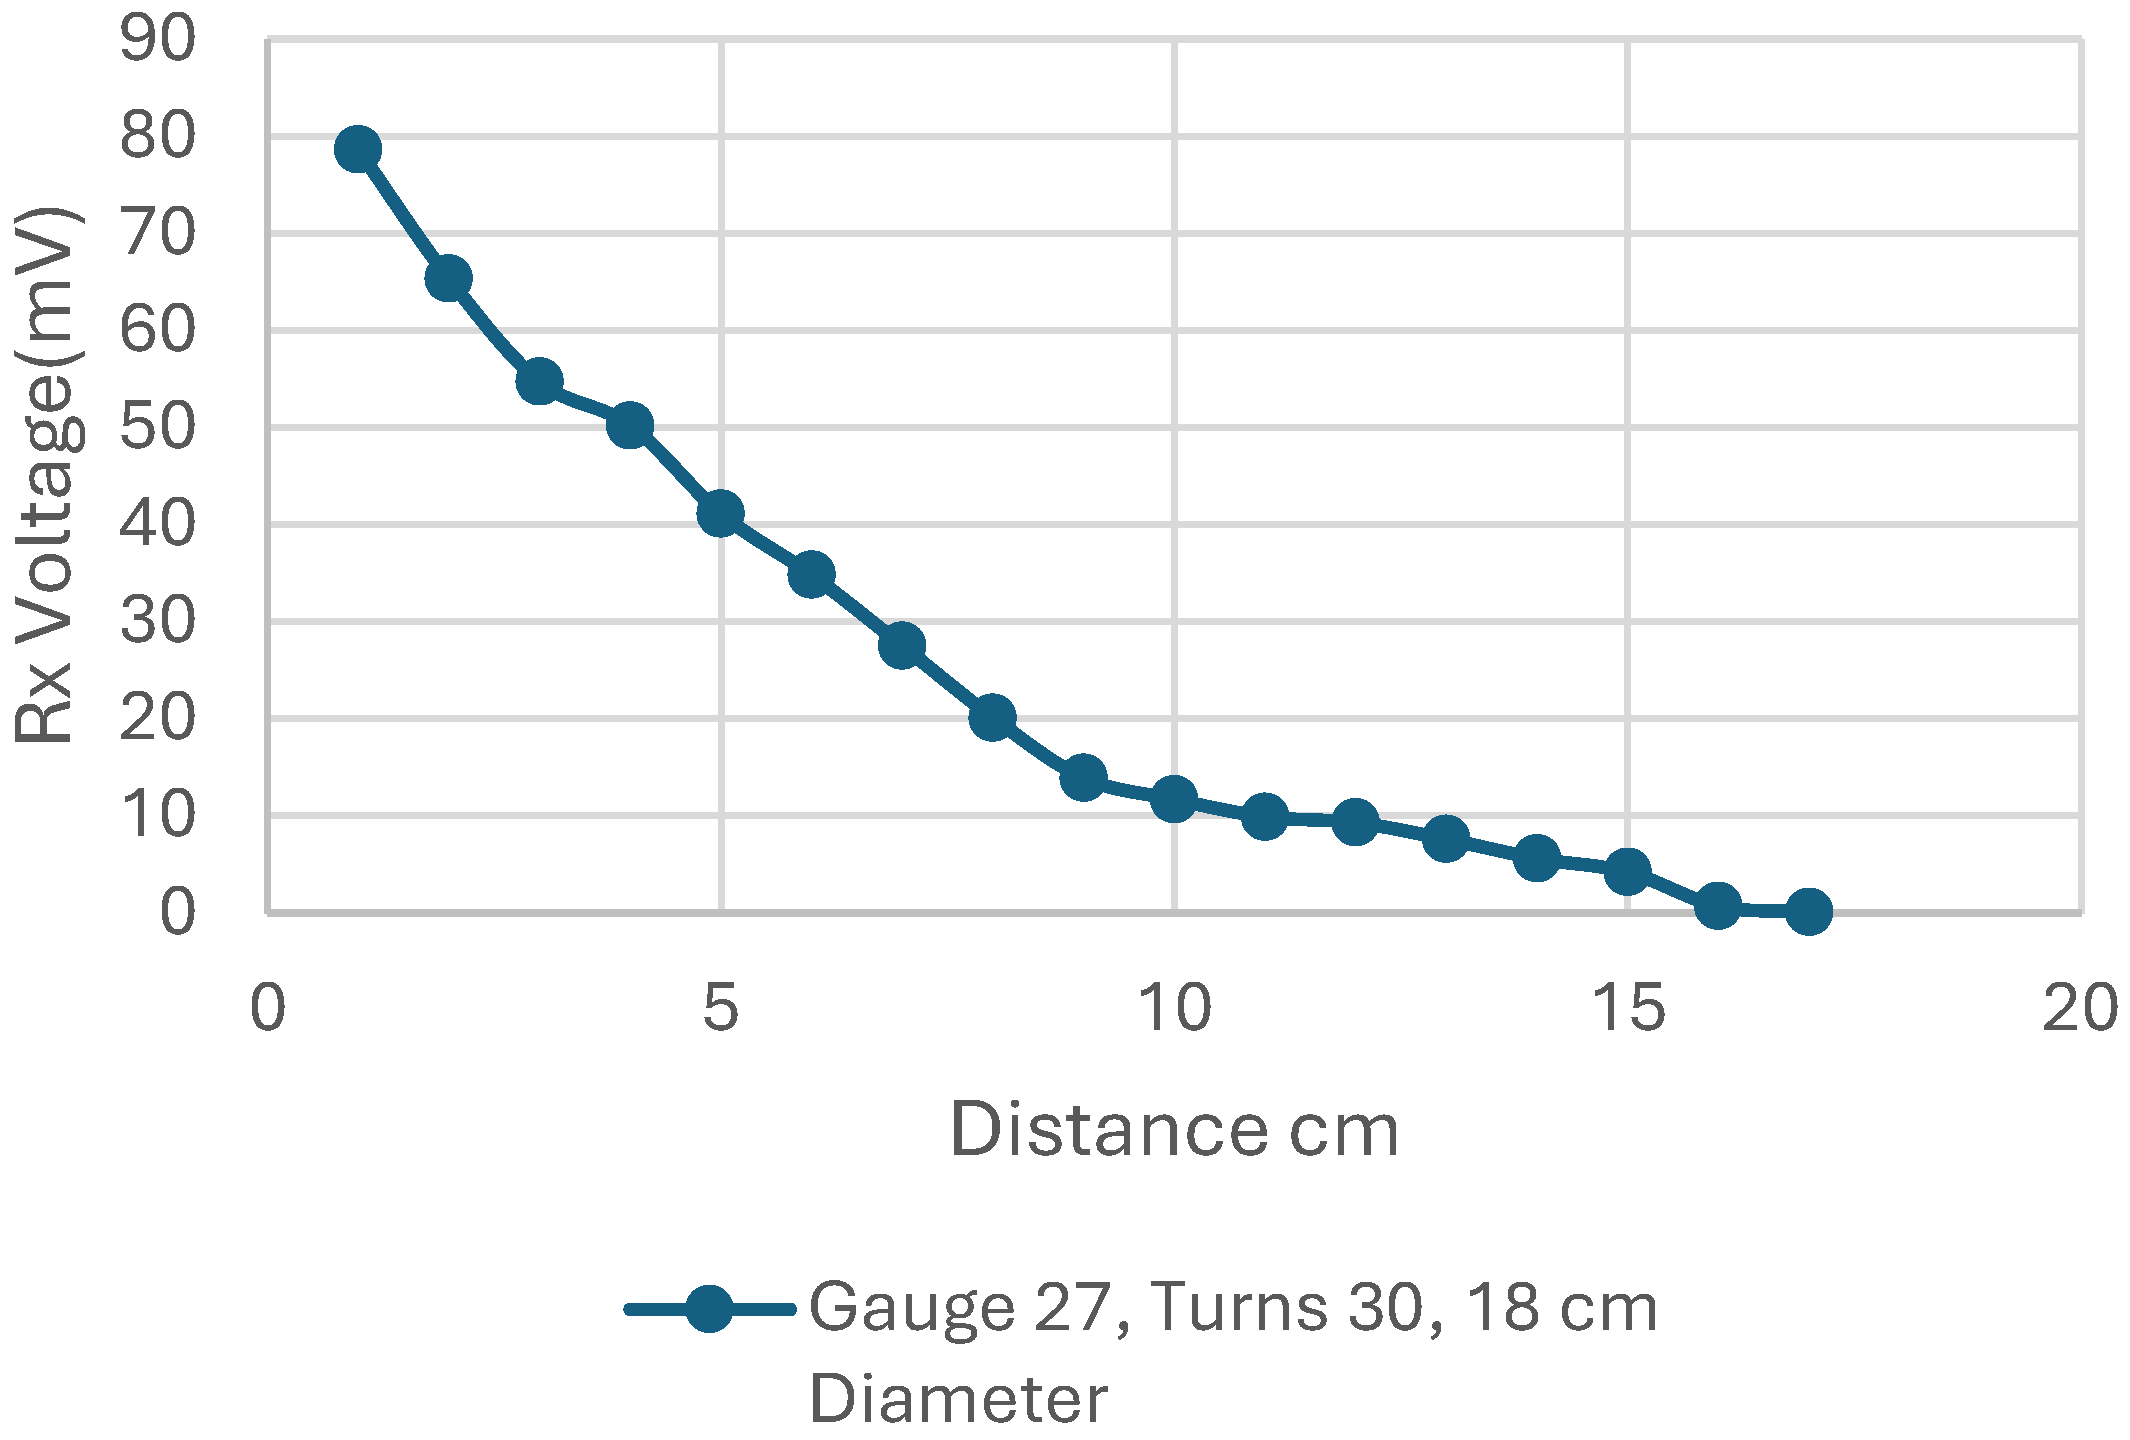
In the next step, we change the diameter to see the results: 8 cm, 13 cm, and 18 cm with the same gauge and number of turns.
The results in
Table 10 and
Figure 19 show that the coil with a larger diameter has a higher mutual voltage and can operate at a greater distance than the others.
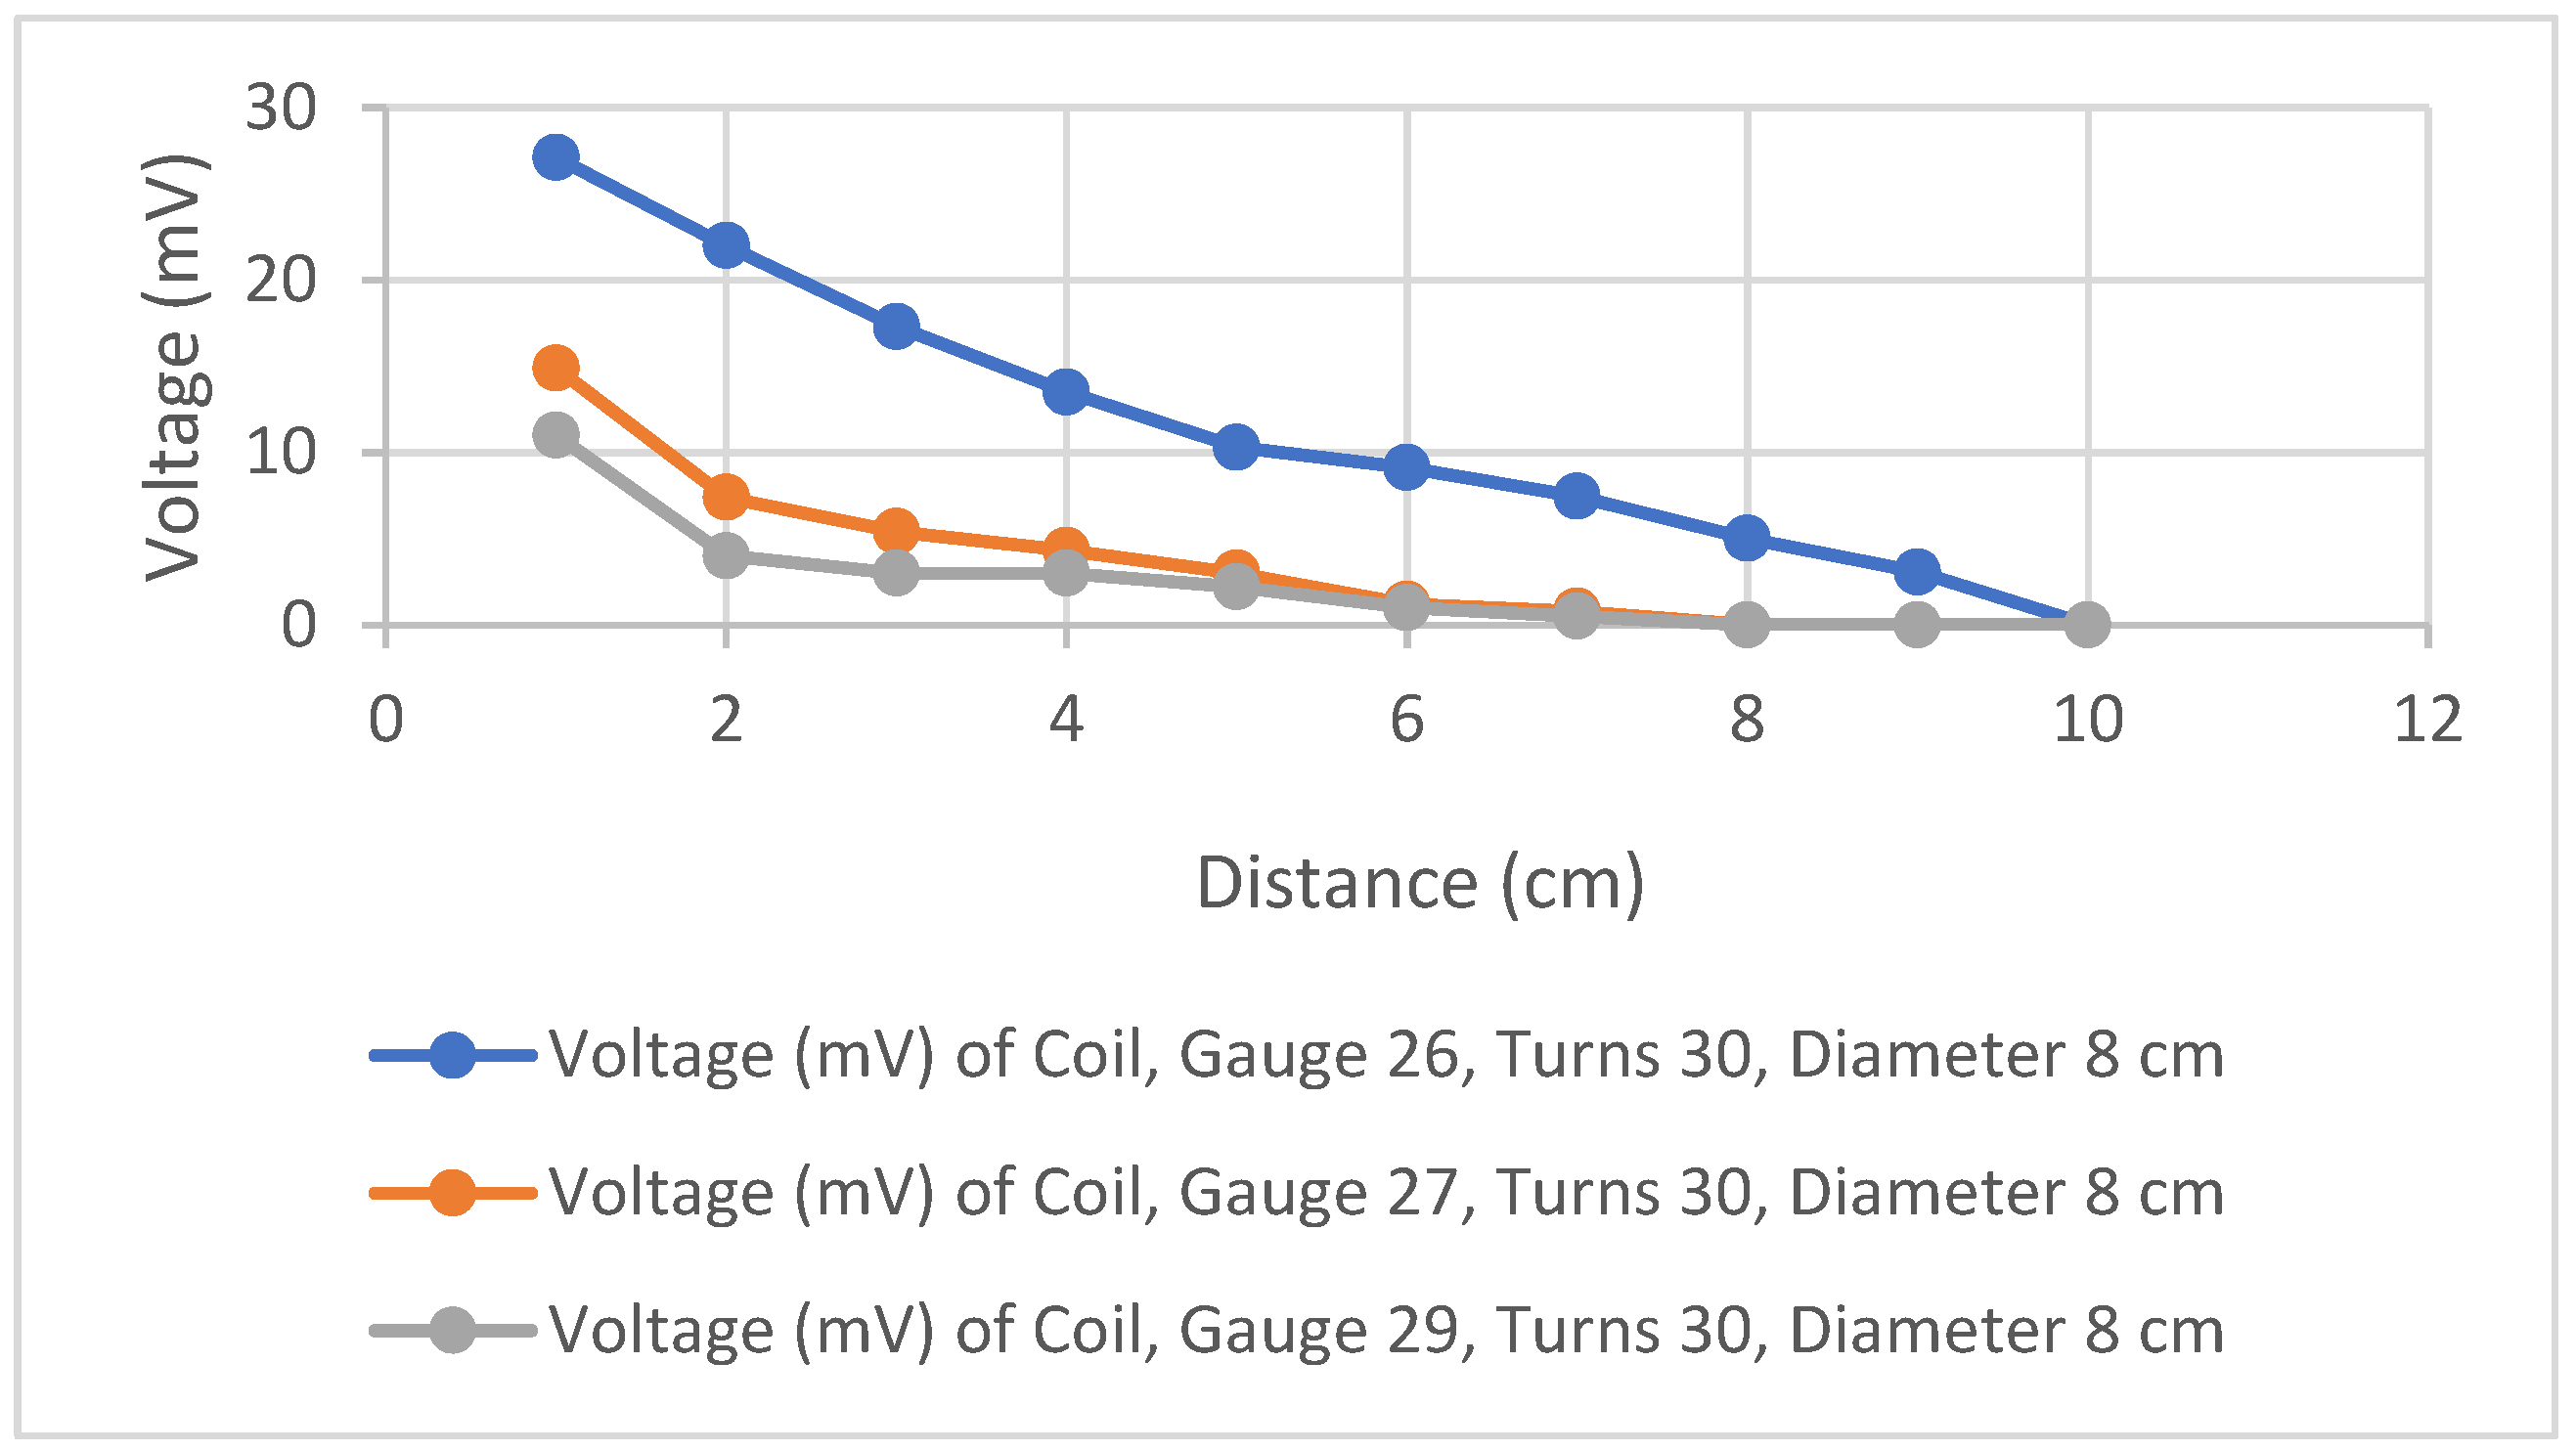
In the next step, we change the cable gauge, which varies in thickness as the two are inversely proportional to each other. We keep the rest of the parameters the same, i.e., 30 turns and an 8 cm diameter.
The results in
Table 11 and
Figure 20 show that the coil with greater thickness, that is, a lower wire gauge, produces higher mutual voltage and can operate at a greater distance than others. In the next step, we change the input current of the transmitting coil and keep other parameters unchanged.
The above results in
Table 12 and
Figure 21 show that the coil that has more input current tends to cover a greater distance. In order to avoid the melting of copper wire, the input current should not exceed the maximum current supported by the wire’s thickness. A thicker wire means that is having less gauge is able to carry more current. Hence the input current can be increased if a lesser gauge wire is used as per its rated value.
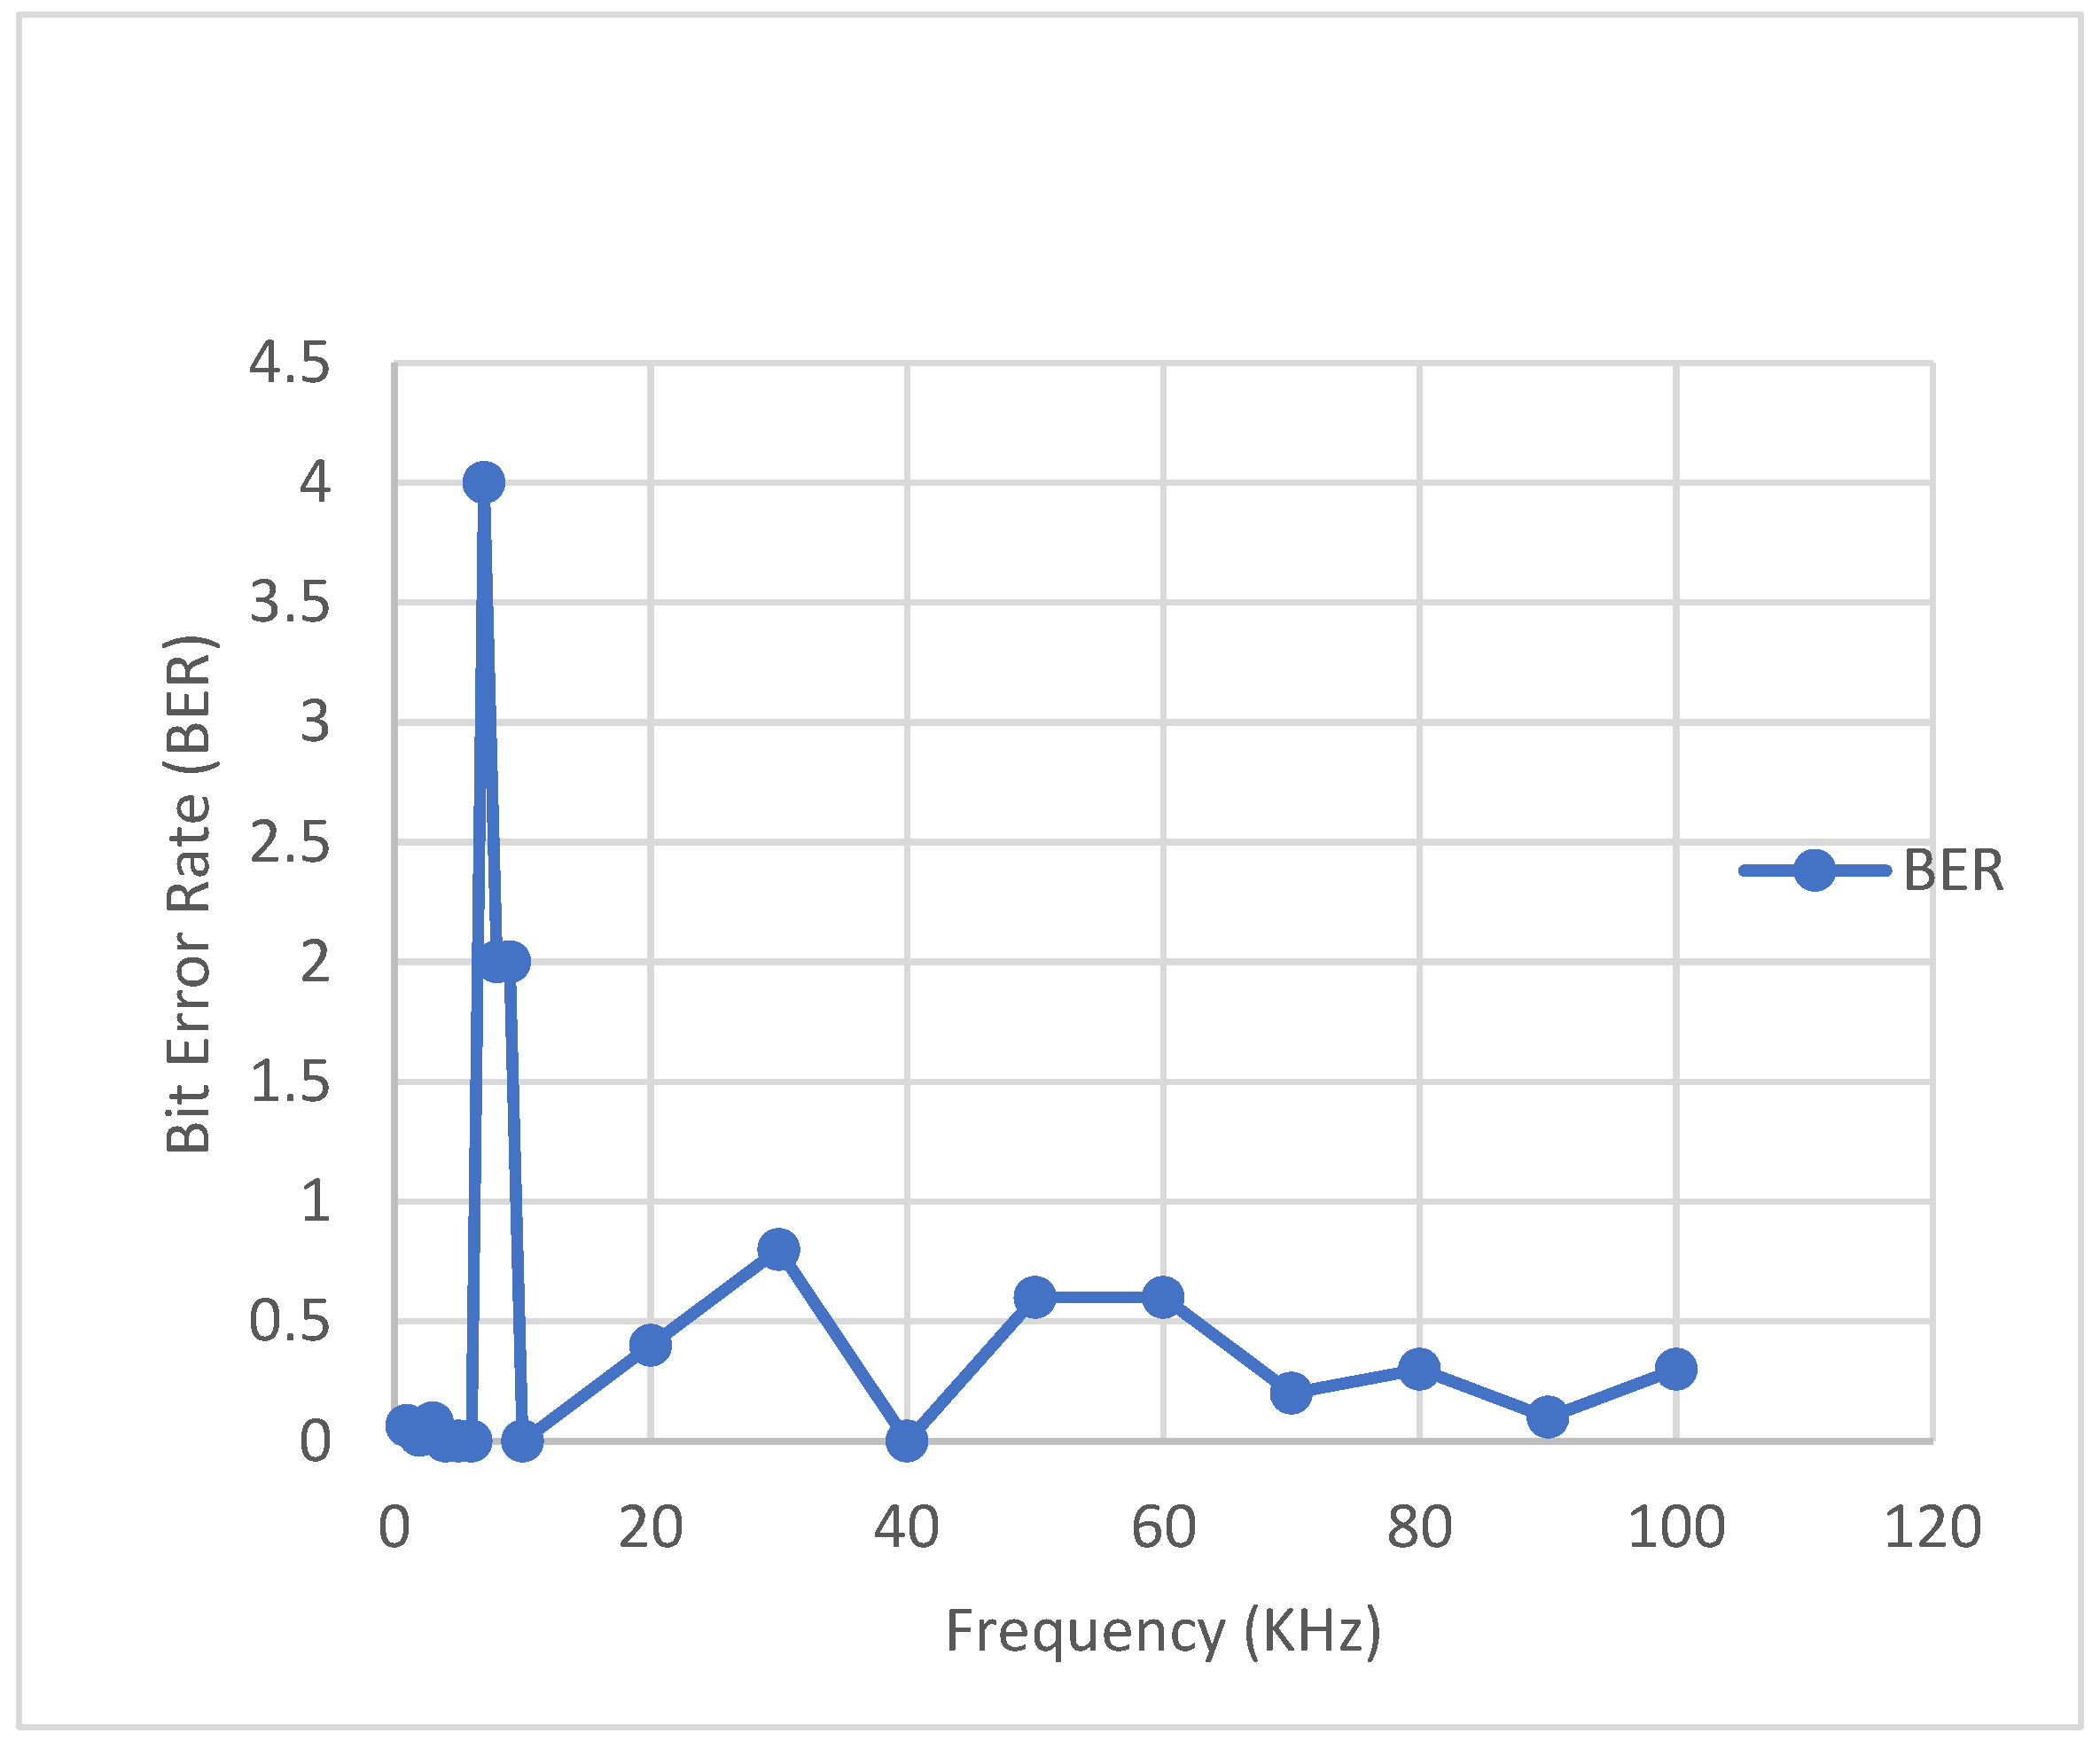
In the next step, we tend to find the bit error when the frequency is varied for the same set of coil parameters. The results are shown in
Table 13 and
Figure 22.
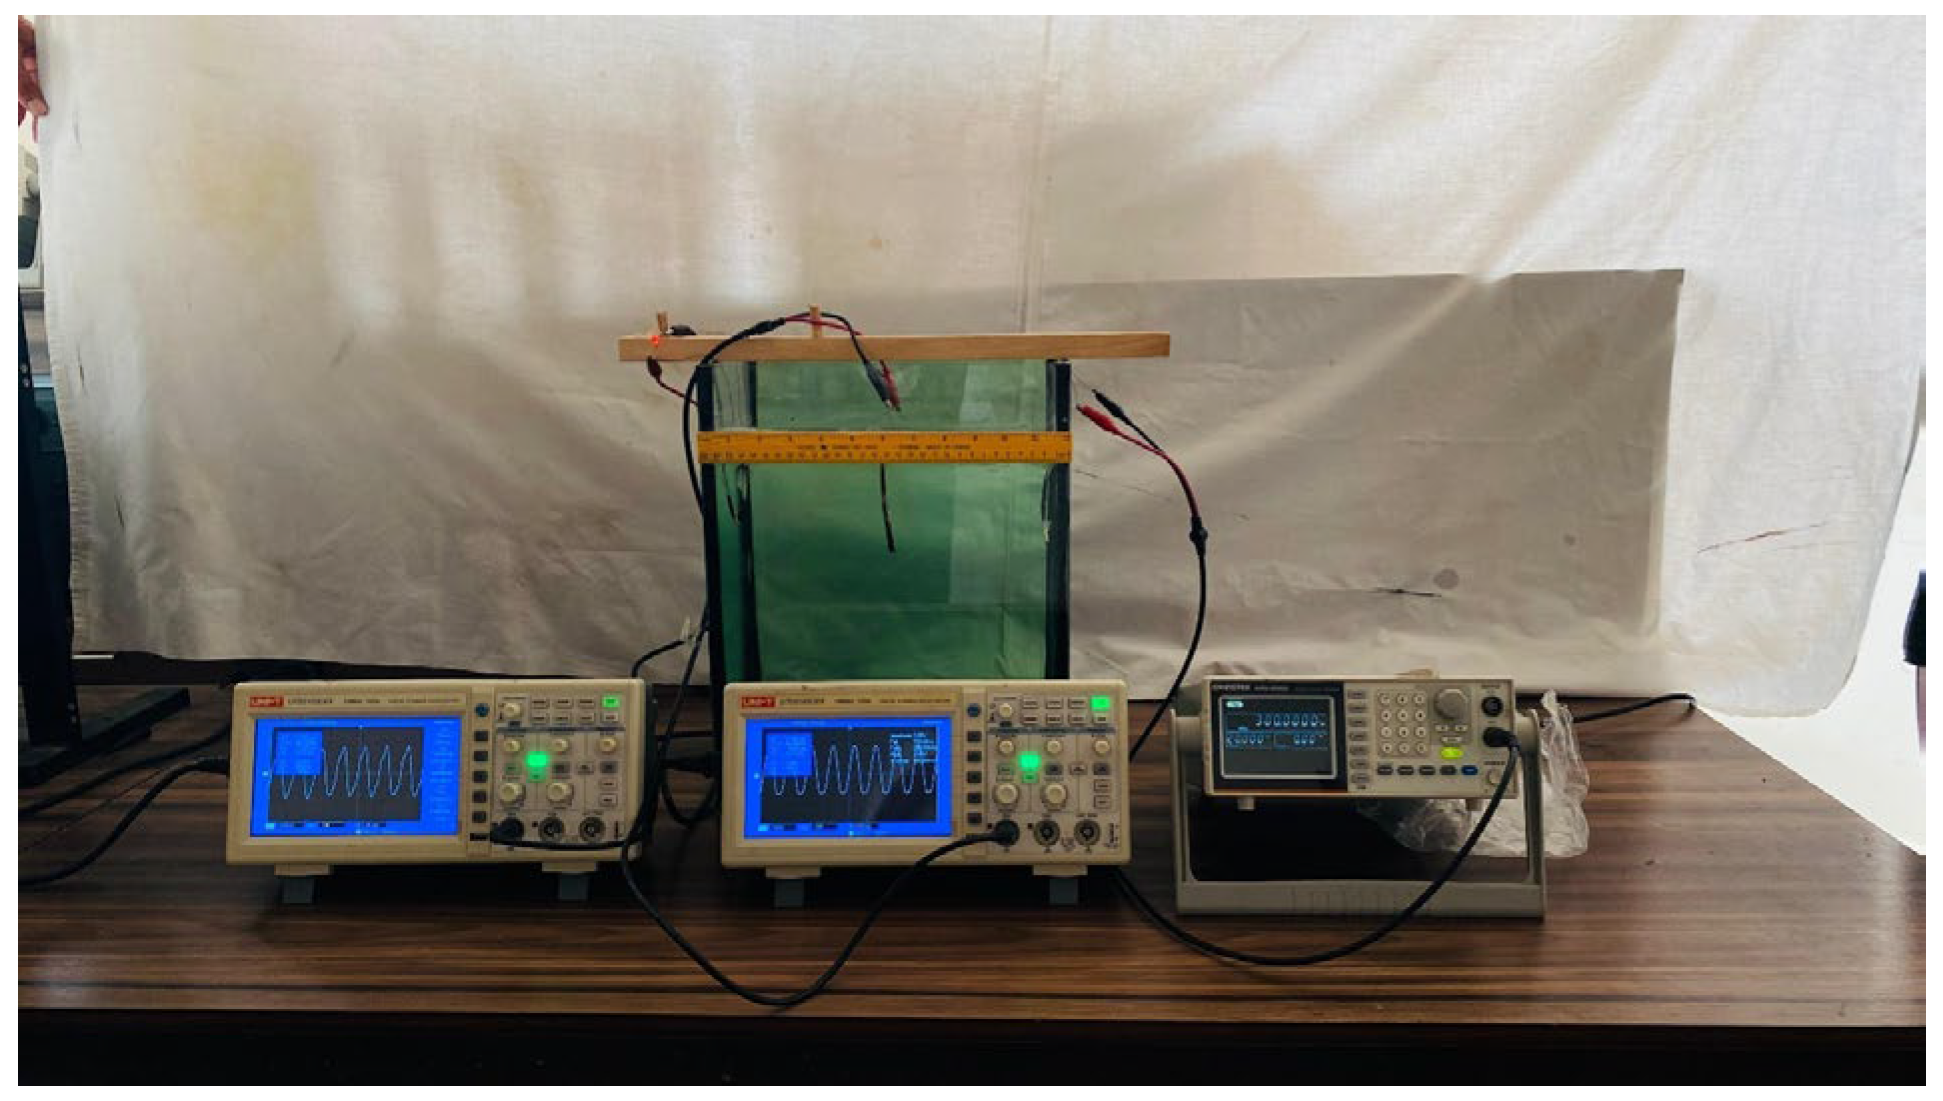
In the next step, we prepare a setup by using a water tank as per the dimensions used in
Figure 15 for simulations conducted underwater with equidistant dimensions for both coils.
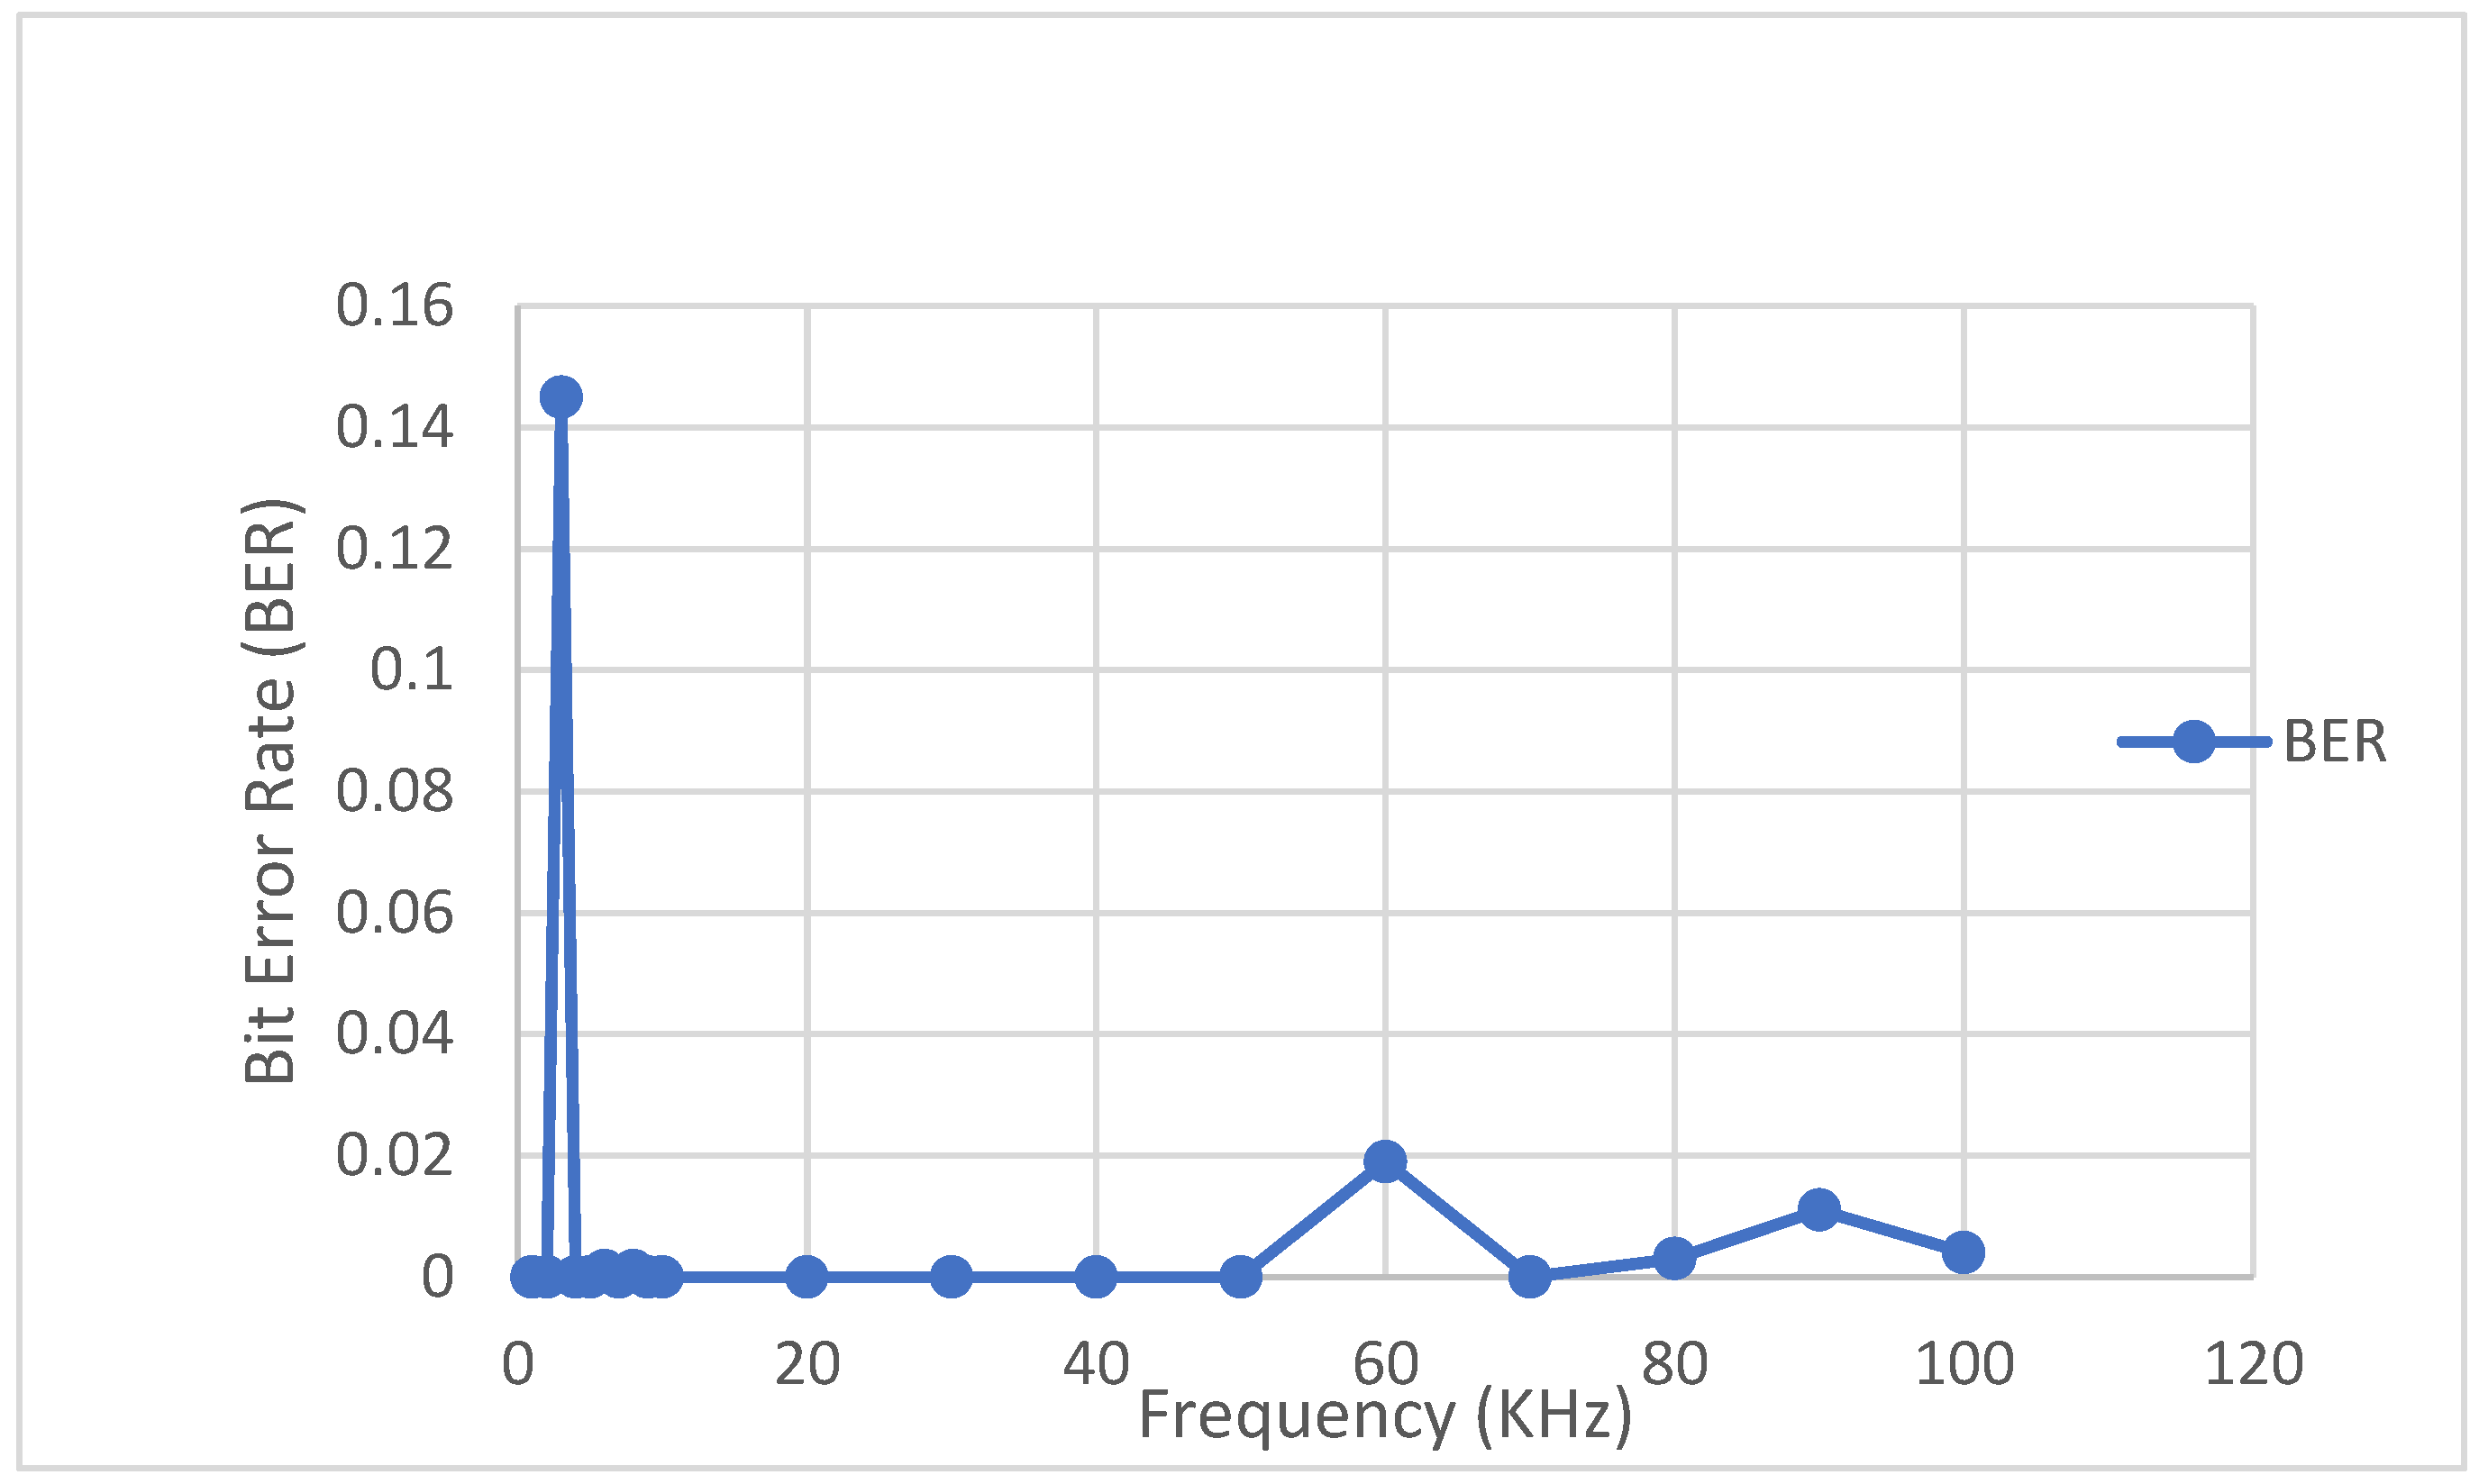
The results in
Table 14 and
Figure 23 show that the bit error rate is zero more often at separate frequencies in water than in air. We have measured the transmit time of the signal from a digital oscilloscope and similarly the receive time. We found out in the result that by varying the frequency, the difference in both time intervals was negligible in water at many frequencies as compared to air.
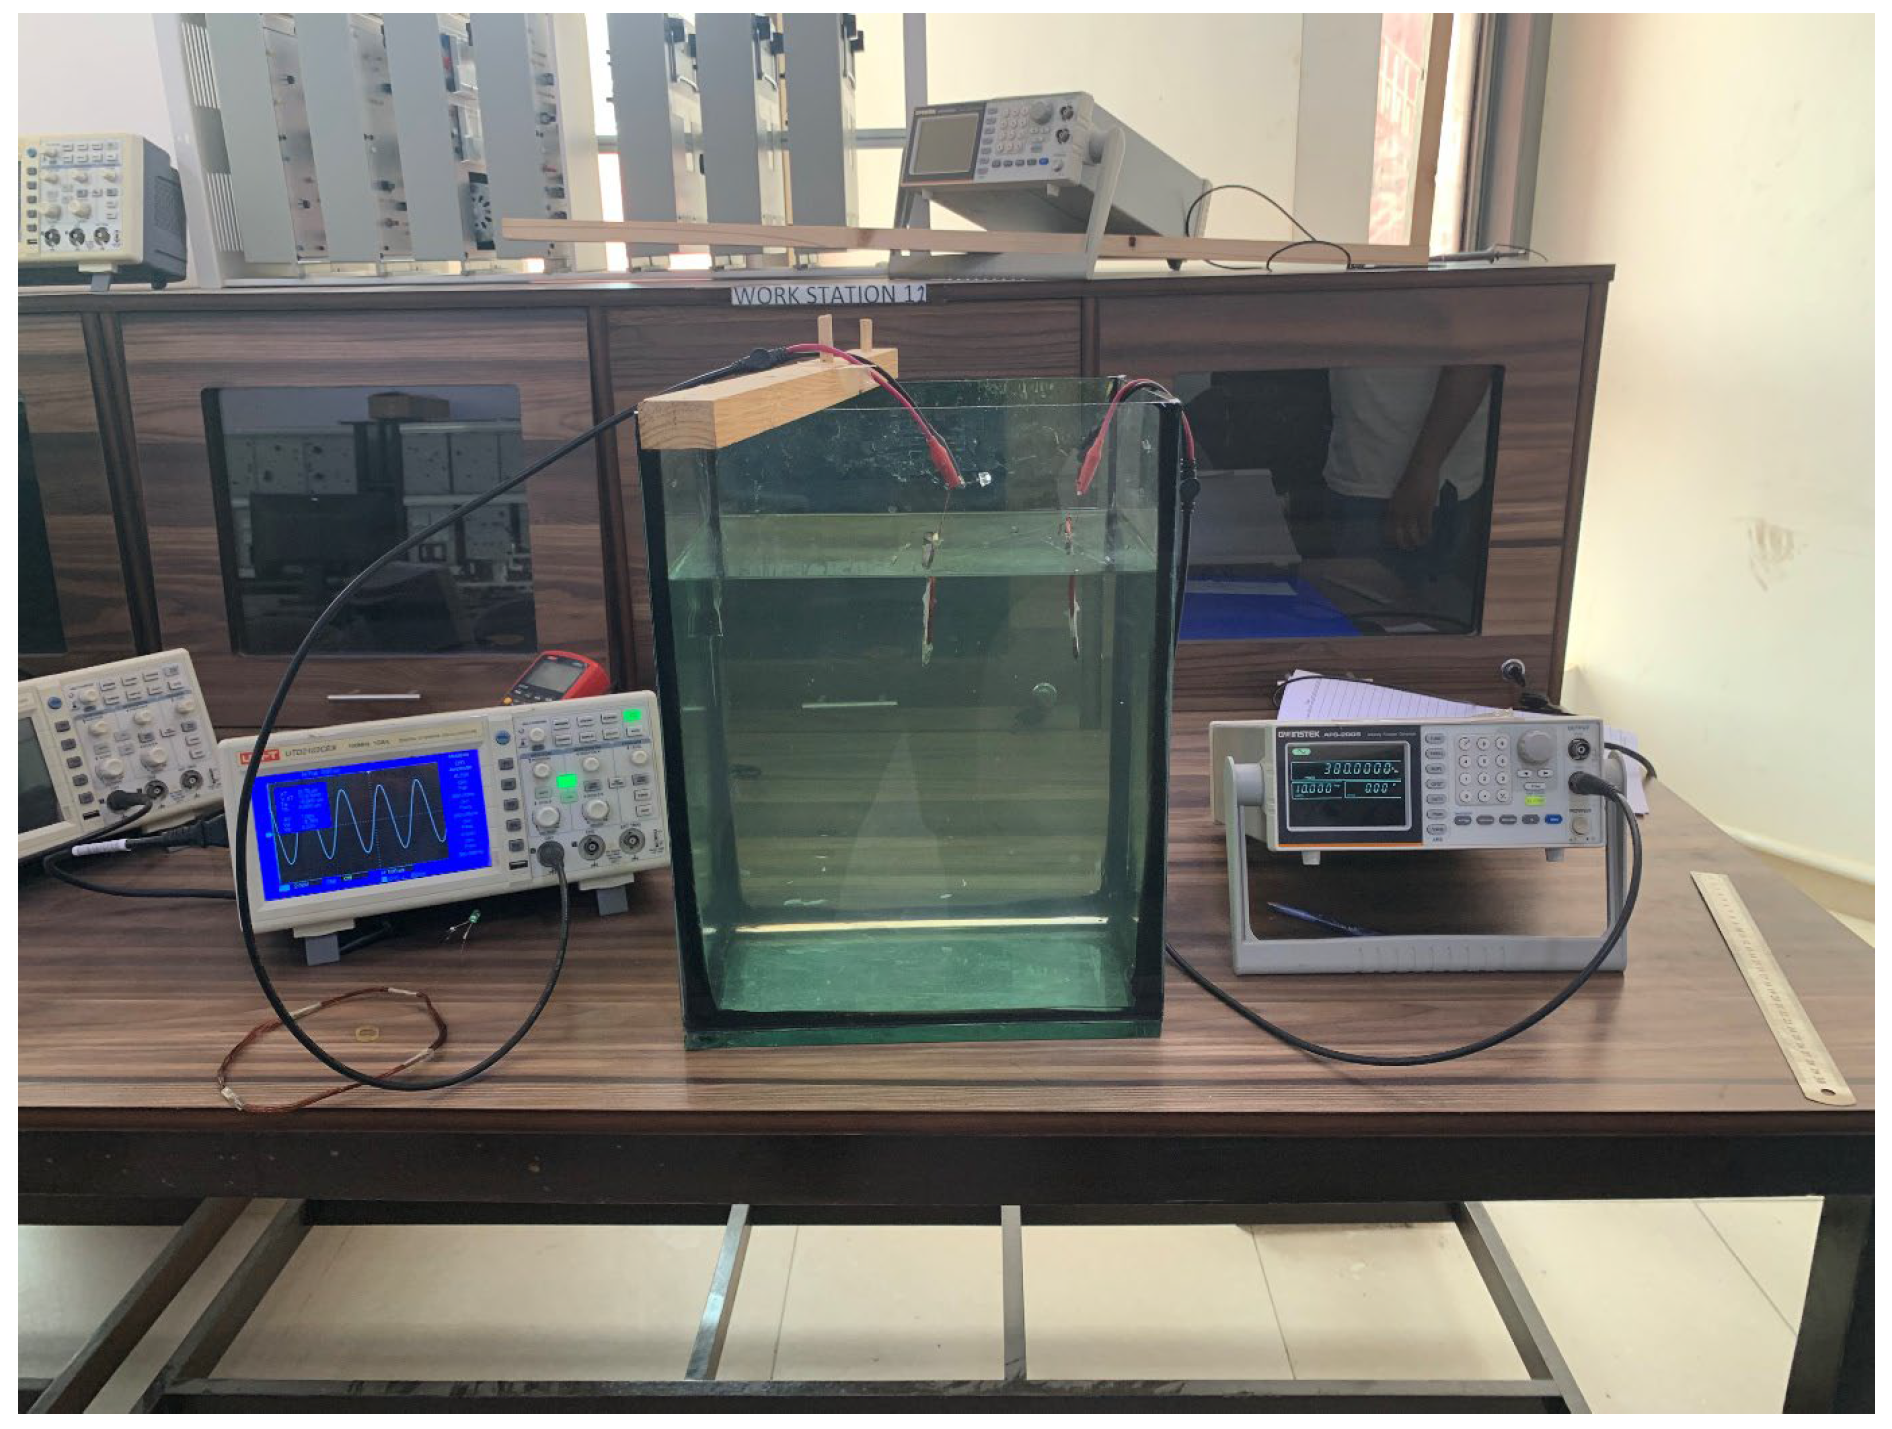
The following
Figure 24 shows the setup used to conduct the experiment in water.
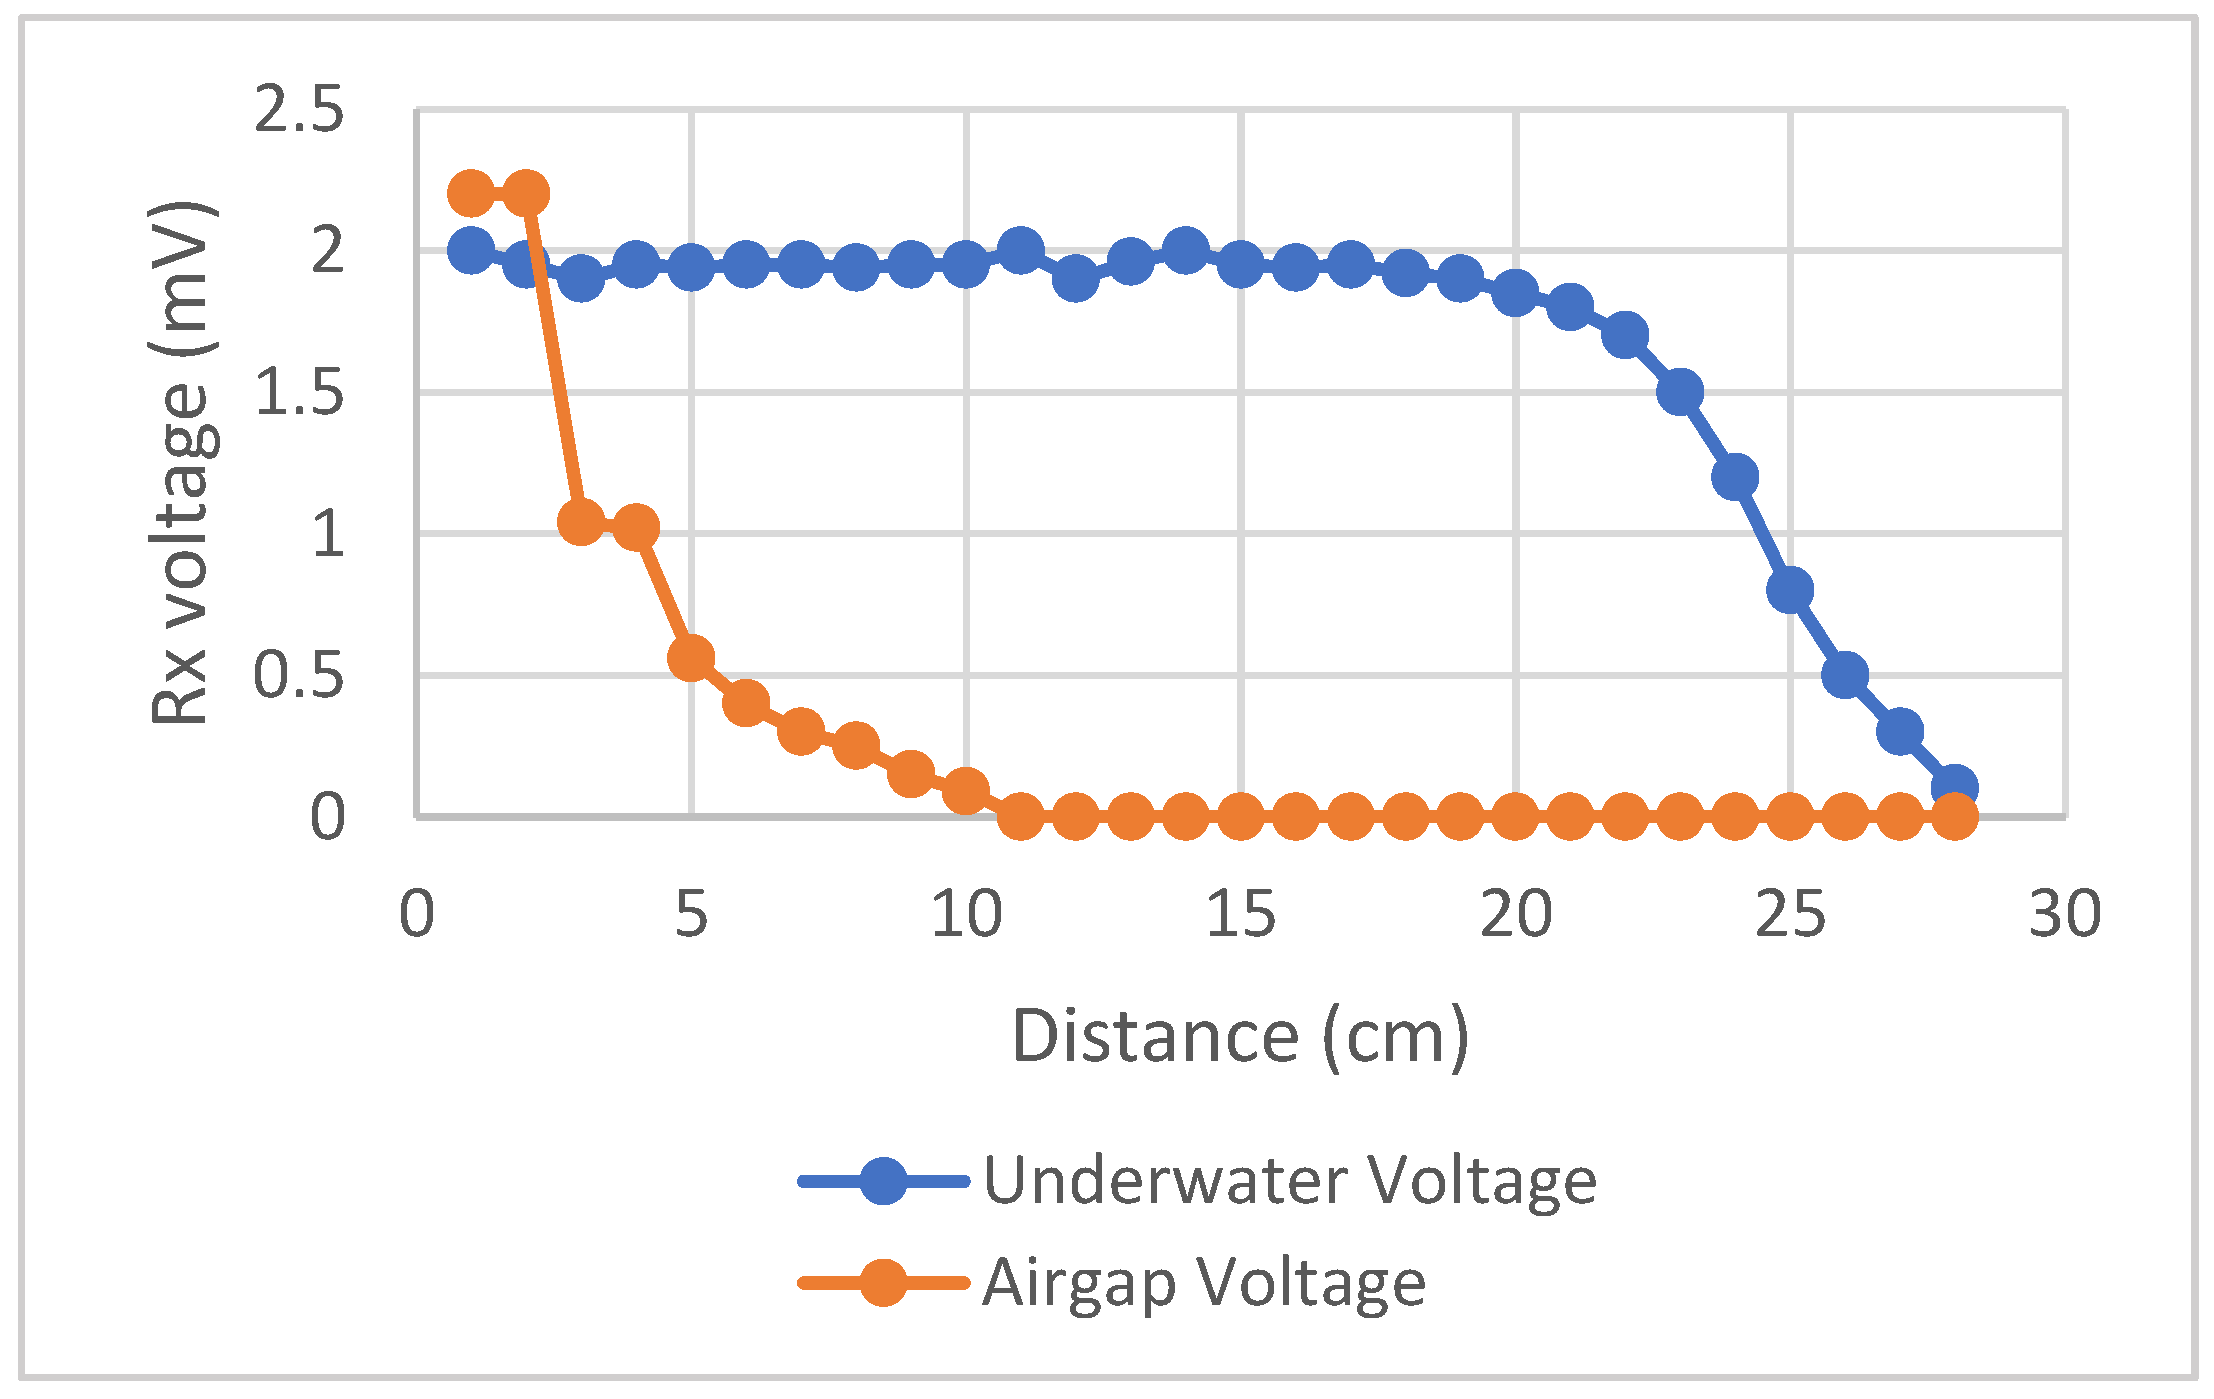
In the next step, we measure the distance covered by applying a 220 kHz signal to the transmitting coil. Both coils have 30 turns of 29 AWG, and a diameter of 8 cm in water and in air.
The results in
Figure 25 and
Table 15 show that conductivity is higher in water than in air between both coils.
In the next step, we increased the temperature of the water and tried to get the results on the receiving coil. The results are shown in
Table 16 and
Figure 26.
At room temperature, the temperature of water is 16 degrees centigrade. We then used a heating rod to raise the temperature of the water to 65 degrees centigrade and then checked the results.
The above result shows a better range achieved for a higher temperature of water
In the next experiment, in order to change the pH of water, we used saline water whose pH is known to be 8.5, and normal water has 7; hence, the pH of water was increased from 7 to 8.5, and an experiment was conducted to check the results. The results are shown in
Table 17 and
Figure 27.
The above result shows an improved result at a lower pH of water, but the difference in covered distance is negligible.
In the next experiment as shown in
Figure 28, a relay method that uses three coils of similar configuration is conducted. The results are shown in
Figure 29.
The above results show the accumulated range achieved by using the relay method of MI coils.
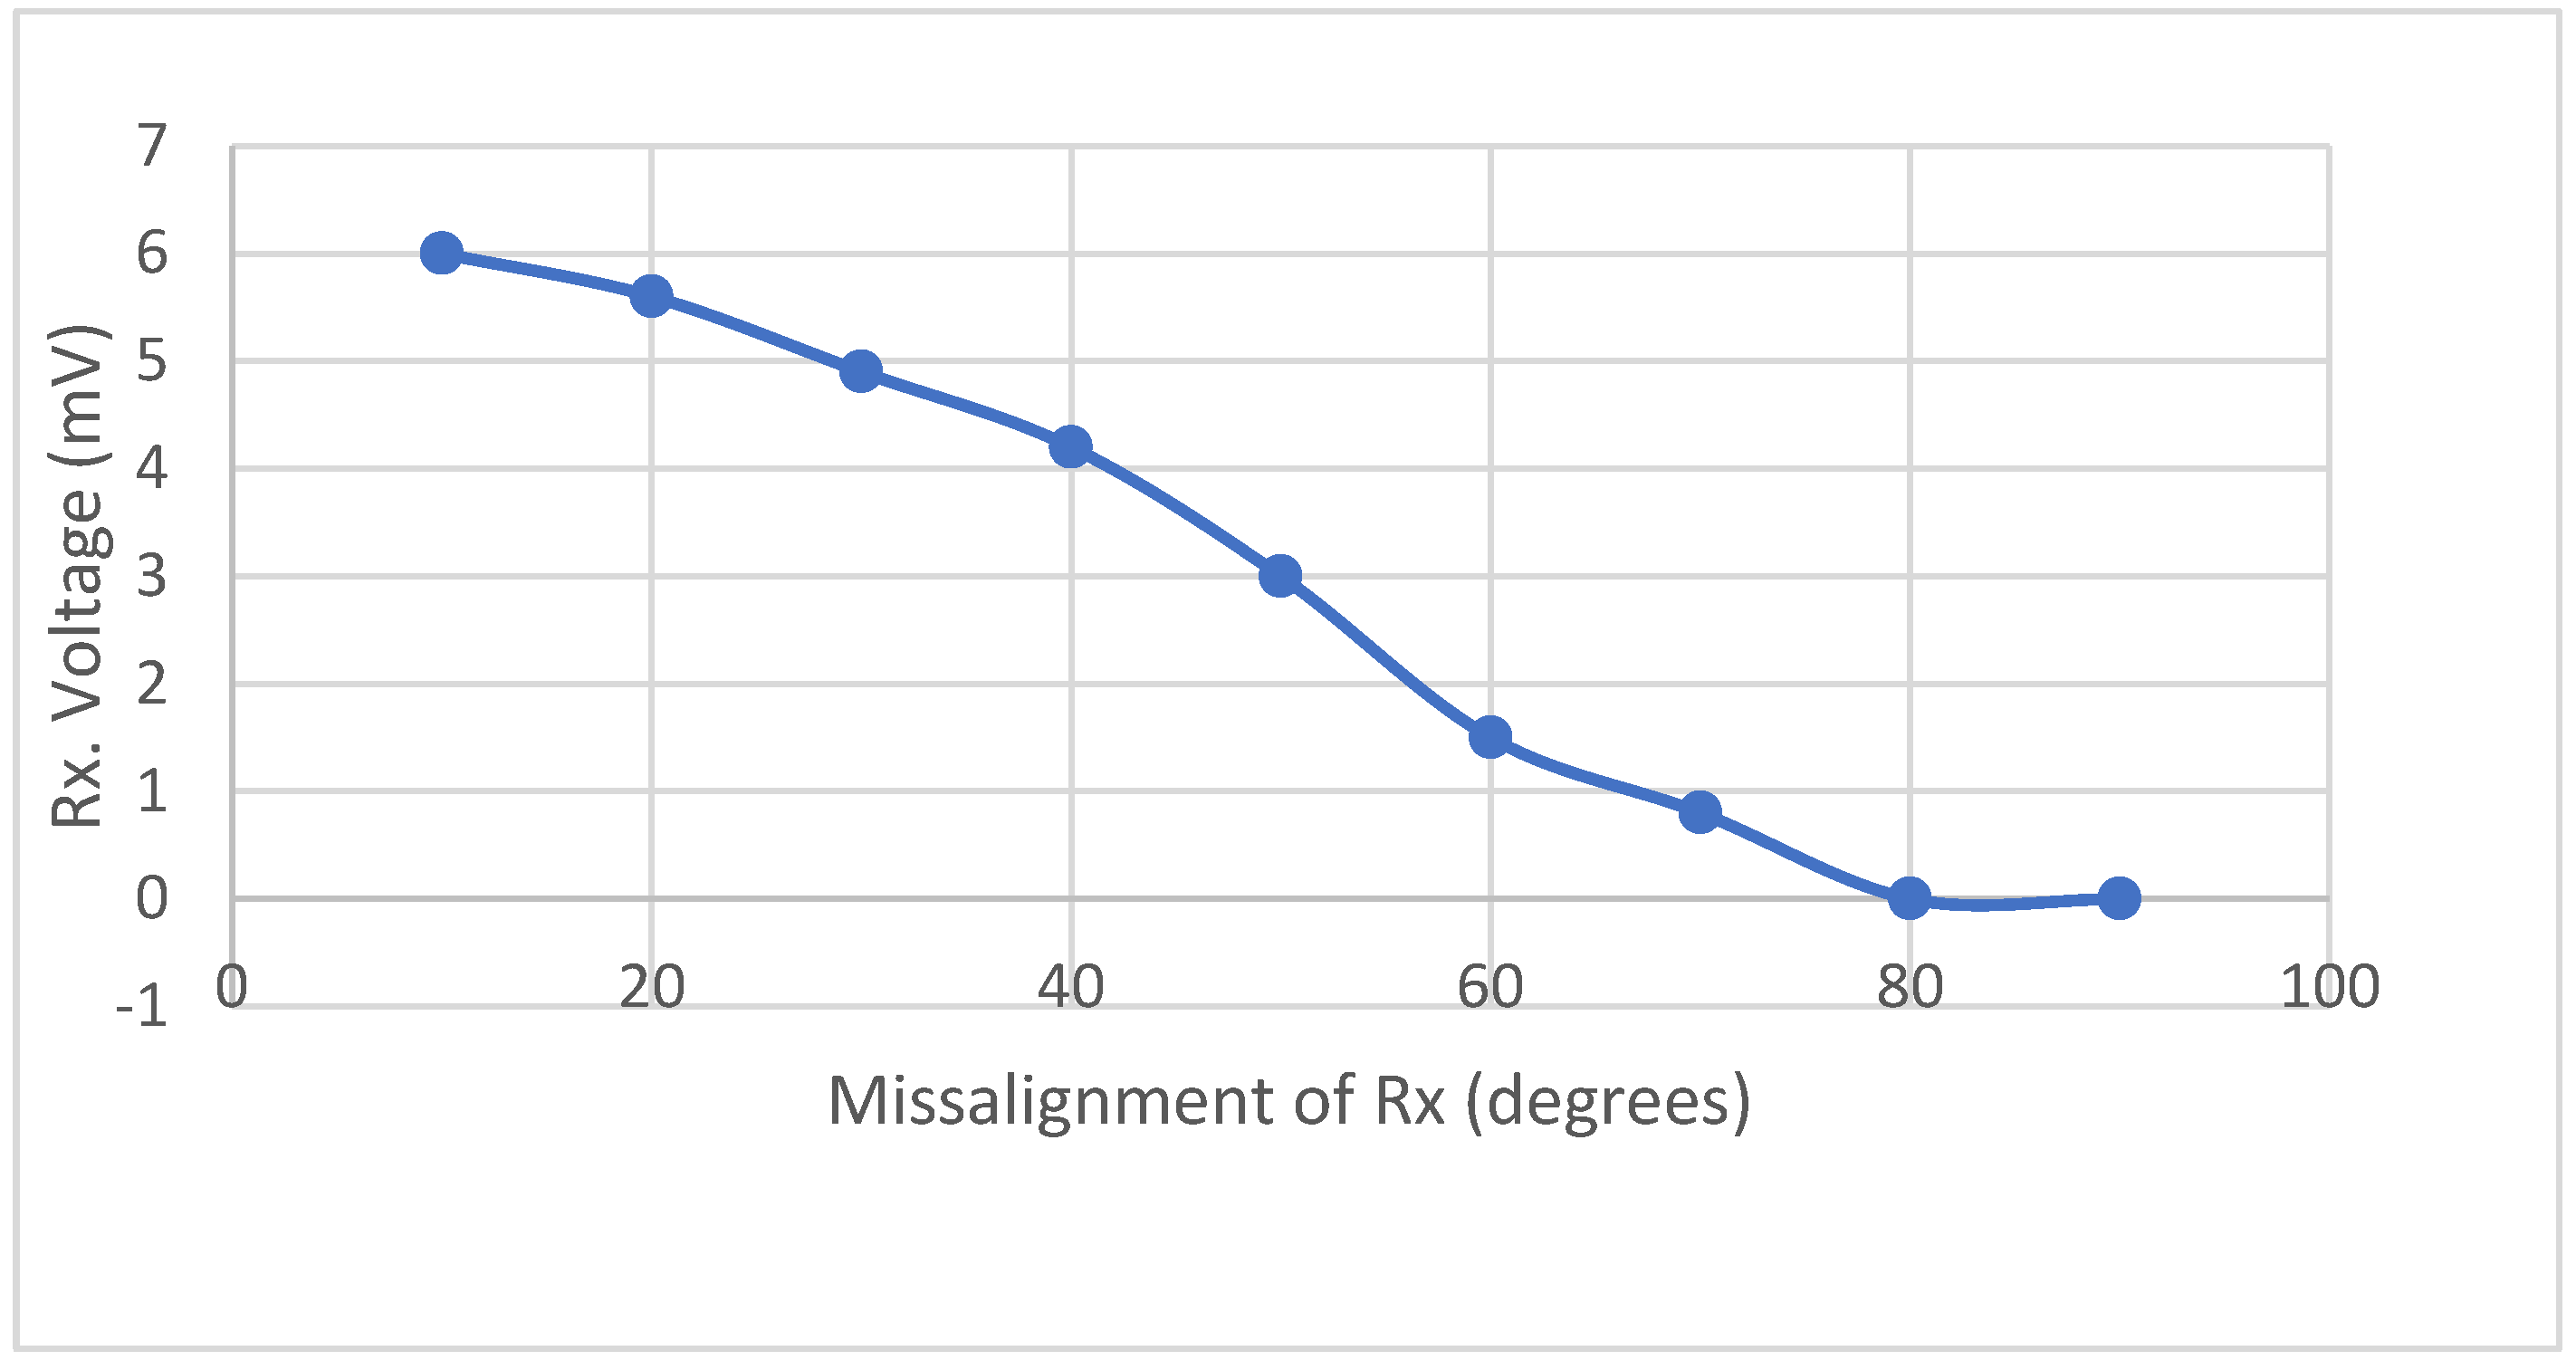
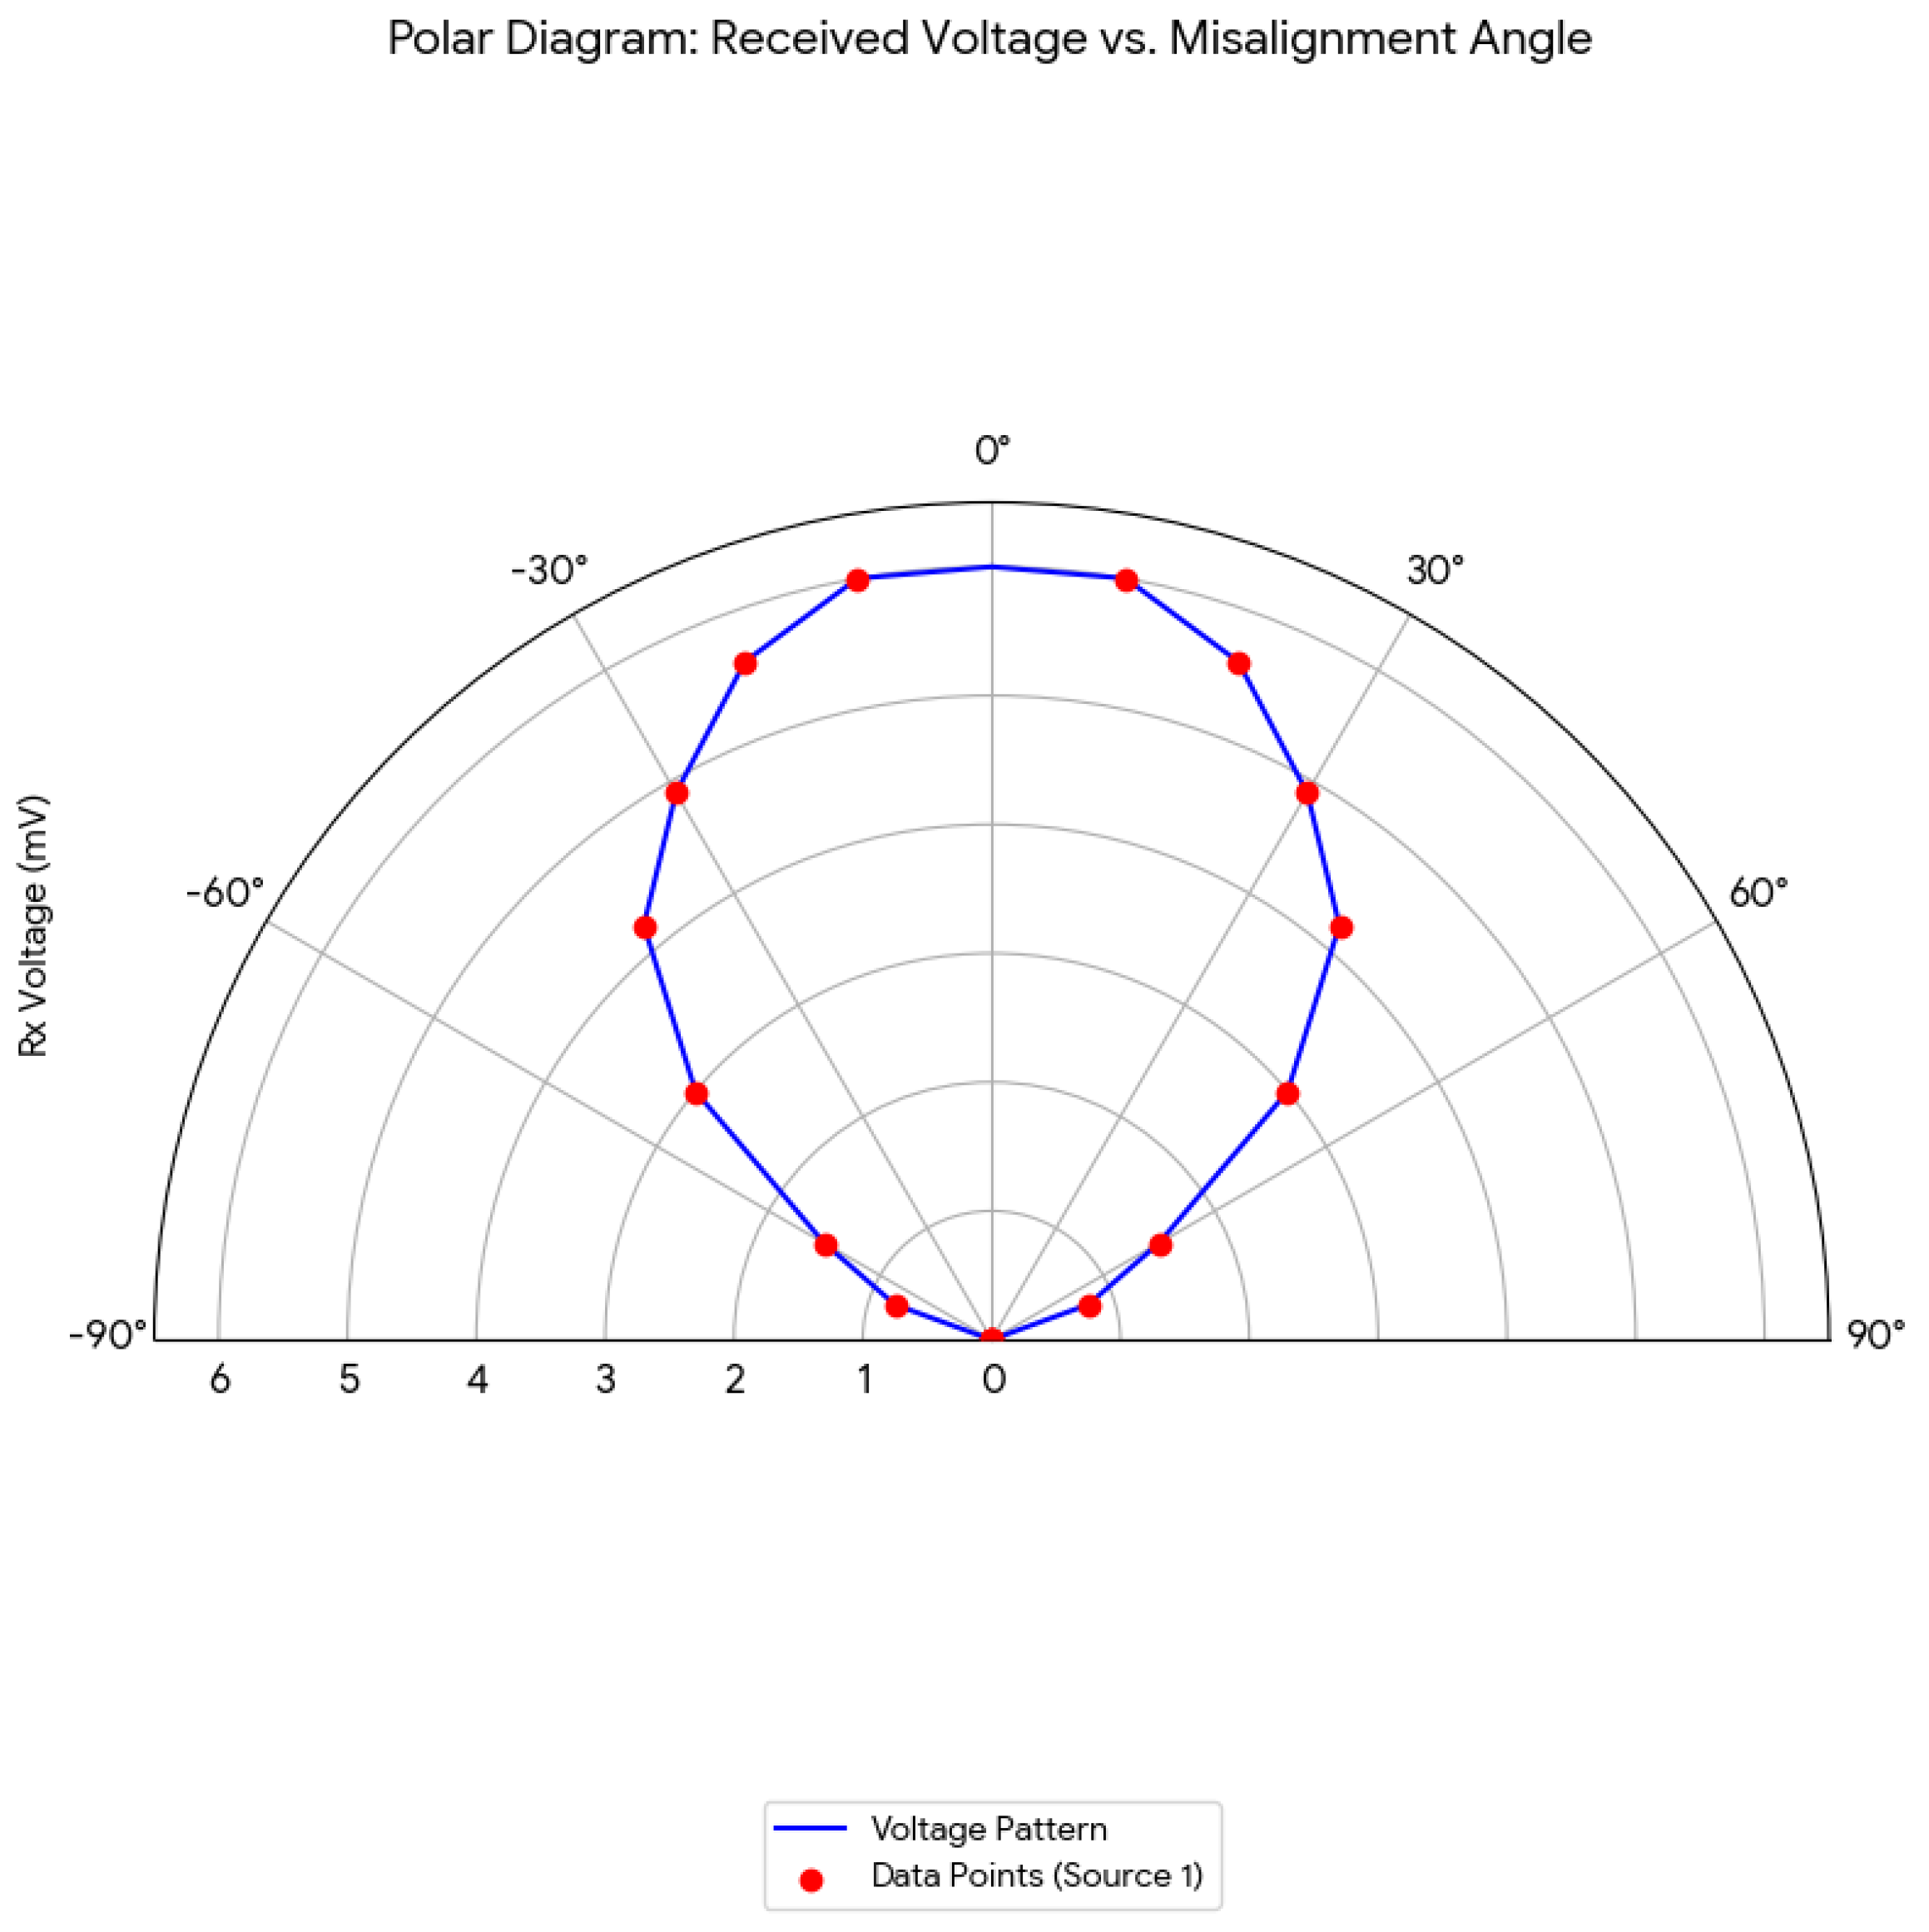
In the next step, we used the two coils (30 turns, 27 AWG, 8 cm coil) and checked the effect of misalignment on the receiver side per 10-degree change. The results are shown in
Table 18 and
Figure 30.
The above result shows the effect of misalignment between the receiving coils on their output signal, which decreases when they are not aligned in parallel.
The following
Figure 31 shows the polar form of the above result.
