Article

Development of Green Lignin–MWCNTs Hybrids for Sustainable Conductive Materials

by
Sofia P. Makri
1,*,
Stefania Koutsourea
1,
Alexios Grigoropoulos
1,
Kata Berkesi
1,
Michalis Kartsinis
1,
Ioanna Deligkiozi
2 and
Alexandros Zoikis-Karathanasis
1,*
1
Creative Nano PC, 43 Tatoiou Street, Metamorfosi, 14451 Athens, Greece
2
AXIA Innovation GmbH, Fritz-Hommel-Weg 4, 80805 München, Germany
*
Authors to whom correspondence should be addressed.
Electronics 2025, 14(22), 4539; https://doi.org/10.3390/electronics14224539
Submission received: 10 October 2025 / Revised: 10 November 2025 / Accepted: 17 November 2025 / Published: 20 November 2025
(This article belongs to the Section Electronic Materials, Devices and Applications)

Abstract

The increasing environmental impact of electronic waste has intensified the pursuit of sustainable materials for manufacturing green electronics. This study presents the development of lignin-based hybrids with multi-walled carbon nanotubes (MWCNTs) via an environmentally friendly ultrasonication process in aqueous medium. Two hybrid materials containing 10 and 20 wt% MWCNTs were synthesized and thoroughly characterized. DLS analysis revealed better dispersion and colloidal stability due to strong physicochemical interactions between lignin and MWCNTs, while SEM and TEM images confirmed a continuous lignin matrix embedding an interconnected MWCNT network. Raman spectroscopy indicated structural ordering within the hybrids. The electrical conductivity of the hybrids reached 2–5 S/cm as evaluated by four-point probe measurements, despite the high lignin content (80–90 wt%). Electrochemical analysis suggested significantly enhanced redox activity and electron transfer kinetics, with measured electroactive surface areas increasing up to 21-fold larger compared with the unmodified electrode. The synergy between lignin and MWCNTs enabled the formation of a conductive network, highlighting these hybrids as promising, cost-effective, and sustainable materials for conductive and electrochemical applications in next-generation green electronics.

1. Introduction

The rapid growth of the electronics industry has led to an increasing demand for advanced electronic products, resulting in the generation of rising volumes of electronic waste (E-waste) [1]. E-waste often contains hazardous substances that pose serious environmental and health risks if not disposed of properly [2]. Thus, the attention has turned to the development of “green” electronics manufactured from renewable, biodegradable, or environmentally benign materials [1].
Materials originating from biomass, such as cellulose, chitin, lignin, and others, have emerged as promising alternatives for developing greener electronic components. Lignin, the second most abundant biopolymer after cellulose, is a byproduct of the paper and pulp industry. Its polyphenolic structure and functional groups (hydroxyl, carbonyl, and carboxyl groups) vary depending on biomass source (hardwood, softwood, or grass) and extraction method [3,4]. Due to its chemical structure, abundant functional groups, and biodegradability, lignin is increasingly employed as a sustainable alternative to fossil-based materials for various applications [5,6,7].
MWCNTs consist of multiple graphene sheets in a coaxial arrangement and can exhibit semiconducting or metallic behavior, depending on their structure [8,9]. Owing to their good electrical, thermal, and mechanical properties, they are widely used in electronics and sensing applications [10,11]. However, CNTs tend to aggregate in most solvents due to strong π–π stacking and van der Waals forces, which significantly limit their processability and performance [12]. To improve their dispersion in water media, fossil-based surfactants such as ionic SDS, cationic CTAB, and non-ionic Triton X-100 are often used [13,14,15,16,17,18].
A few studies have demonstrated that lignin can serve as an efficient dispersant for CNTs, offering comparable or even superior performance to conventional surfactants. Its amphiphilic nature and aromatic structure enable strong π-π interactions with CNTs, improving dispersion in aqueous and other polar media. Goodman et al. demonstrated that alkali lignin dispersed MWCNTs more effectively than SDS and CTAB at lignin:CNT ratios between 1:20 and 5:1 [19]. Similarly, Rochez et al. achieved long-term stable lignin/MWCNT dispersions (1:1–6:1), with the 2:1 ratio showing optimum stability. When incorporated into a PP-g-MA latex, these dispersions yielded uniform composite films with surface resistivity of approximately 105 Ω/sq [20]. Teng et al. [21] further confirmed that fractionated lignin dispersed MWCNTs more effectively than raw lignin in DMF at a lignin:MWCNT ratio of 1:3.1, with the low-molecular-weight fraction yielding the most homogeneous dispersion due to stronger π–π interactions.
The enhanced dispersion provided by lignin and the synergistic interactions between the two components in lignin–CNT systems have also been shown to improve the electrical conductivity and thermoelectric performance of CNT-based materials, as reported in several studies. Zhang et al. reported that increasing lignin content (11.8–23.1 wt%, corresponding to lignin:CNT ratios of 1:7.5–1:3.3) improved CNT exfoliation and charge transport, yielding films with a power factor up to 198 μW m−1 K−2 [7]. Likewise, Culebras et al. demonstrated that lignin-doped CNT yarns achieved conductivities up to 157.6 S cm−1 and a power factor of 132 μW m−1 K−2 at 23 wt% lignin, attributed to π–π interactions that densified CNT bundles and promoted efficient carrier transport [22].
Lignin has also been incorporated into CNT inks and coatings, where it serves a dual role as a dispersant and structural stabilizer. Kamarudin et al. formulated an aqueous MWCNT ink using alkali lignin, which reduced nanotube agglomeration and improved dispersion stability [23]. More recently, Wang et al. fabricated conductive and superhydrophobic lignin/MWCNT coatings with a 1:3 lignin:MWCNT ratio, reaching conductivity close to 0.289 S cm−1. Lignin was uniformly embedded within the CNT network through hydrogen bonding and π–π interactions, effectively preventing aggregation while improving adhesion, abrasion resistance, and long-term stability [24].
In addition to their structural and conductive roles, lignin–CNT hybrids have recently gained attention in electrochemical and energy-related applications [25,26]. Degefu et al. reported a lignin-modified glassy carbon electrode (GCE) capable of catalyzing histamine oxidation in phosphate buffer solution, demonstrating sensitive detection in biological and food samples [27]. Similarly, CNT composites with other biopolymers such as cellulose and chitosan have been extensively studied for electrochemical sensing [28,29]. For instance, CNT–cellulose and CNT–chitosan composites have been widely employed in enzymatic biofuel cells and glucose biosensors, demonstrating enhanced sensitivity and power density [30,31,32]. However, studies employing electrodes modified with lignin/MWCNT hybrids remain limited. For example, Chokkareddy et al. developed lignin–MWCNT–CuO nanocomposites for electrochemical sensing, which exhibited enhanced redox activity due to synergistic interactions among the components [33]. Similarly, Liu et al. designed lignin fiber–CNT–graphene electrodes for Li–S batteries, achieving improved conductivity and energy storage performance [30].
Some of us recently reported that only the incorporation of lignin–MWCNT hybrids as fillers in PLA composites successfully imparted electrical conductivity, in contrast to PLA/lignin and PLA/MWCNT systems, which showed insulating behavior [34]. Building on these findings, this work investigates the intrinsic physicochemical and electrical properties of the lignin–MWCNTs hybrids themselves. Lignin, itself a natural biopolymer, was used as the matrix for developing carbon-based, green, conductive hybrid material. Lignin-based hybrids containing 10 and 20 wt% MWCNTs were prepared via a simple, one-step, environmentally friendly ultrasonication process in aqueous medium. Lignin served a dual function: it acted as a natural dispersant through non-covalent interactions with MWCNTs as well as a binding matrix facilitating the formation of interconnected conductive pathways.
Small hydrodynamic diameter and stable zeta potential values were measured by DLS, suggesting good dispersion and colloidal stability of the hybrids. SEM and TEM images revealed a continuous network of MWCNTs embedded within the lignin matrix. Broadband dielectric spectroscopy (BDS) and four-point probe (4PP) measurements indicated that the newly prepared hybrids show excellent electrical conductivity despite their high lignin content, an insulating biopolymer. The obtained values were significantly higher compared to those reported for other lignin–CNT systems with similar or even higher MWCNTs loadings and comparable to those reported for composites containing polymeric matrices synthesized from biobased monomers. Moreover, the hybrids achieved high electroactivity and charge-transfer efficiency even at low CNT loadings as evidenced by cyclic voltammetry (CV) measurements, highlighting their potential for the manufacturing of electrodes for sensing applications.

2. Materials and Methods

2.1. Materials

Soda lignin (Protobind 1000) was purchased from Tanovis AG (Ruschlikon, Switzerland). Multi-walled carbon nanotubes with >96% purity and outside diameter 8–18 nm were purchased from Nanografi (Ankara, Turkey). The potassium ferricyanide (K3[Fe(CN)6]), potassium chloride (KCl), and N,N-Dimethylformamide (DMF) were obtained from PENTA (Prague, Czech Republic), while poly(tetrafluoroethylene) (CF2CF2)n) and carbon black from Sigma-Aldrich (St. Louis, MO, USA). Electrochemical characterization was performed using a standard three-electrode glass cell setup, with a glassy carbon working electrode (d = 3 mm) in a Teflon body, a platinum mesh counter electrode, and an Ag/AgCl (filled with 3 M KCl) reference electrode (d = 6 mm), all sourced from Stony Lab (New York, NY, USA). Reverse osmosis (RO) water obtained from an in-house purification system was used for all dispersions and sample preparations.

2.2. Synthesis of MWCNTs–Soda Lignin Hybrids

For the preparation of 10% MWCNTs-soda Lignin (sL) hybrid, 0.5 g of MWCNTs was added in a double layer jacketed beaker containing 500 mL RO water under magnetic stirring. The mixture was subjected to ultrasonication (US) using an Ultrasound processor (UP200St, 26 kHz, 200 W; Hielscher Ultrasonics GmbH, Teltow, Germany) equipped with a sonotrode (S26d14; Hielscher Ultrasonics GmbH, Teltow, Germany) for 1 h. Then, 4.5 g of soda lignin was added and US was applied for 2 more hours. The temperature of the dispersion during the entire US process was maintained at 25 °C using an external cooling circulator connected to the double layer beaker jacket. After US, the aqueous dispersion was freeze-dried to obtain MWCNTs–sL hybrid material in powder form. For the preparation of 20% MWCNTs-sL hybrid, the same process was followed using 1.0 g of MWCNTs and 4.0 g of sL. US was carried out under fixed settings: 200 W power, 80% amplitude, and a 50% pulse duty cycle.

2.3. Experimental Methods

2.3.1. Dynamic Light Scattering (DLS)

The hydrodynamic diameter (HDD) and zeta potential (ZP) values were determined using DLS with a Litesizer 500 (Anton Paar GmbH, Graz, Austria) instrument. The samples were diluted to a concentration of 100–200 ppm and were sonicated in a bath for 5 min to ensure uniform dispersion before measurement. Additionally, the surface charge of the dispersion was determined through ZP measurement. The measurements were taken in triplicate.

2.3.2. Scanning Electron Microscopy (SEM)

The surface morphology of starting materials and hybrids were analyzed using SEM analysis with a TESCAN VEGA COMPACT (TESCAN GROUP, a.s., Brno, Czech Republic) instrument at an accelerating voltage of 10–15 keV. Prior to SEM imaging, the samples were gold-coated using the SC7620 ‘Mini’ Sputter Coater/Glow Discharge System (Quorum Technologies Ltd., Laughton, UK).

2.3.3. Transmission Electron Microscopy (TEM)

Nanoscale investigation was performed with a high resolution JEOL JEM-2100 LaB6 transmission electron microscope (HRTEM) (JEOL Ltd., Tokyo, Japan), operating at 200 kV. The samples (~0.1 g) were suspended in deionized water and treated with ultrasound to disaggregate the agglomerated particles. A drop from the suspension was then placed on a 300-mesh carbon coated copper grid and air-dried overnight. Elemental analyses were carried out using an Oxford X-Max 100 Silicon Drift Energy Dispersive X-ray spectrometer (Oxford Instruments, Abingdon, UK), connected to TEM, with a probe size ranging from 2 to 5 nm in STEM mode.

2.3.4. Broadband Dielectric Spectriscopy (BDS)

The electrical conductivity at RT~20 °C was evaluated by dielectric spectroscopy and by means of Novocontrol BDS setup (Novocontrol GmbH, Montabaur, Germany) on the sample in the form of thin disks (~1 mm in thickness). Upon application of an alternate to the sample capacitor, the complex dielectric permittivity, ε* = ε′ − iε″, was recorded isothermally as a function of frequency, f, in the range from 10−1 to 106 Hz. The f dependence of complex electrical conductivity, σ*, was estimated from ε* via Equation (1),
σ ω = i ×   ω × ε 0 ×   ε ( ω )
where ω = 2π∙f is the angular frequency and ε0 is the dielectric permittivity of the vacuum.

2.3.5. Four-Point Probe (4PP)

Four-point probe measurements were carried out using an equally spaced probe head and a Keithley 2612 System source-meter (Keithley Instruments, Solon, Ohio, USA). The pellets prepared for BDS measurements were also used for 4PP characterization. Each pellet had a diameter of d = 1.2 cm and a thickness of t = 1 mm. The outer probes were used to apply a current ranging from −5 mA to +5 mA, while the voltage was measured across the inner probes. This current range was selected to minimize Joule heating effects. The current was swept from −5 mA to +5 mA and then reversed from +5 mA to −5 mA. The spacing between probes was s = 1.6 mm. For each pellet, the current–voltage (I–V) response was acquired, and the resistance was obtained from the linear fit to the I–V slope. The initial sheet resistance (Rs) was calculated using the standard four-point probe equation:
R S = π ln ( 2 ) Δ V I
where Rs is the sheet resistance, ΔV is the voltage measured between the inner probes, and I is the applied current between the outer probes.
The standard equation assumes that the sample dimensions are larger (typically at least 40 times greater) than the probe spacing and the sample thickness is less than 40% of the probe spacing. In the current case, neither condition is satisfied, necessitating a correction based on the sample’s geometry. For circular samples of diameter d and probe spacing s, the geometric correction factor C is computed as follows:
C = ln ( 2 ) ln 2 + ln d 2 s 2 + 3 ln d 2 s 2 3
For d = 1.2 cm and s = 1.6 mm, the geometric correction factor is C = 0.867.
Given that the samples are thicker than 0.64 mm (i.e., 40% of the probe spacing), a further correction must be applied to account for sample thickness. The thickness correction factor depends on the ratio t/s, which in this case is 0.625. Based on this ratio, a correction factor of 0.9898 should be applied. The final sheet resistance values incorporate both geometric and thickness corrections. Electric conductivity was estimated using the following equation (t = 1 mm):
σ = 1 R S × t

2.3.6. Raman Spectroscopy

Raman measurements were performed using a Raman spectroelectrochemical system (DRP-SPELECRAMAN532, Metrohm DropSens, Oviedo, Spain) equipped with a 532 nm excitation laser and controlled by DropView SPELEC software (version 1.0). A Raman reflection probe was employed in combination with a Raman cell designed for experiments with screen-printed electrodes (DRP-RAMANCELL, Metrohm DropSens, Oviedo, Spain). The cell was fitted with aluminum crucible holders (DRP-ALCRUCIBPACK, Metrohm DropSens) to facilitate optical characterization of both solid and liquid samples.
For electrode modification (DRP-110), 1 mg of each sample was dispersed in 5 mL DMF. MWCNT-containing samples were sonicated for 20 min (20 s on/10 s off) to ensure proper dispersion, while lignin samples were used without sonication. The dispersions were diluted 1:1 with water, and 5 µL was drop-cast onto the working electrode, dried at room temperature, and coated three times for uniformity. The modified electrodes were then placed in the Raman cell, and spectra were recorded at fixed laser power and integration time.

2.3.7. Electrochemical Measurements

Electrochemical assessment was performed using Versastat 3 (Princeton Applied Research, AMETEK Inc., Oak Ridge, TN, USA) potentiostat. A standard three-electrode glass body electrochemical cell was used, where the working electrode (WE) was a GCE (d = 3 mm) in a Teflon body, the reference electrode (RE) was Ag/AgCl in saturated KCl (expected potential, E° = +0.197 V vs. standard hydrogen electrode (SHE) at 25 °C), and the counter electrode (CE) was a Pt-mesh. The cyclic voltammetric studies were carried out in 1 mM of K3[Fe(CN)6] in 0.1 M KCl aqueous supporting electrolyte in the potential window of −0.2 to 0.6 V, and the scan rates ranged from 10 to 200 mV/s. All electrochemical measurements were performed without applying automatic potential correction.
Before each experiment, the GCE was polished with 0.06 μm Al2O3 slurry on polishing cloth and rinsed with distilled water and cyclic voltametric curves were recorded to verify that any materials that were physically or chemically adsorbed on the electrode surface were removed. The modified electrode was prepared by mixing 32 mg of the hybrid material (or its components, i.e., sL and MWCNTs), carbon black, and PTFE in an 8:1:1 weight ratio in 10 mL of ethanol. The mixture was ultrasonicated for 10 min, after which 40 μL were drop-cast onto the GCE and dried at 50 °C for 5 min under air.
Determination of Electro-Active Surface Area
The determination of the electroactive surface area was determined by using cyclic voltammetry at varying scan rates (200 mV/s, 100 mV/s, 70 mV/s, 50 mV/s, 20 mV/s, and 10 mV/s). The Randles–Ševčík Equation (5) was applied for the calculation of the surface area of the working electrode [35,36]:
I P = 2.69 × 10 5 A D 1 / 2 n 3 / 2 v 1 / 2 C
where A is the electroactive surface area (cm2), D is the diffusion coefficient (cm2 s−1), n is the number of transferred electrons (which is 1 for the Fe3+/Fe2+ redox couple), ν is the scan rate, and C is the concentration of the electroactive species (mol cm−3). By plotting the peak current (Ipa and Ipc) against the square root of scan rate (v½), the average slope of the resulting Ipa and Ipc lines was used to calculate the EASA of each electrode.

3. Results and Discussion

3.1. Particle Size and Surface Charge of Hybrids

The effectiveness of US in dispersing the individual materials, soda lignin, and MWCNTs as well as their corresponding hybrids (10 and 20% MWCNTs–sL) were investigated. The DLS results showed significantly smaller HDD values for the hybrid materials, indicating a synergistic effect upon hybrid formation.
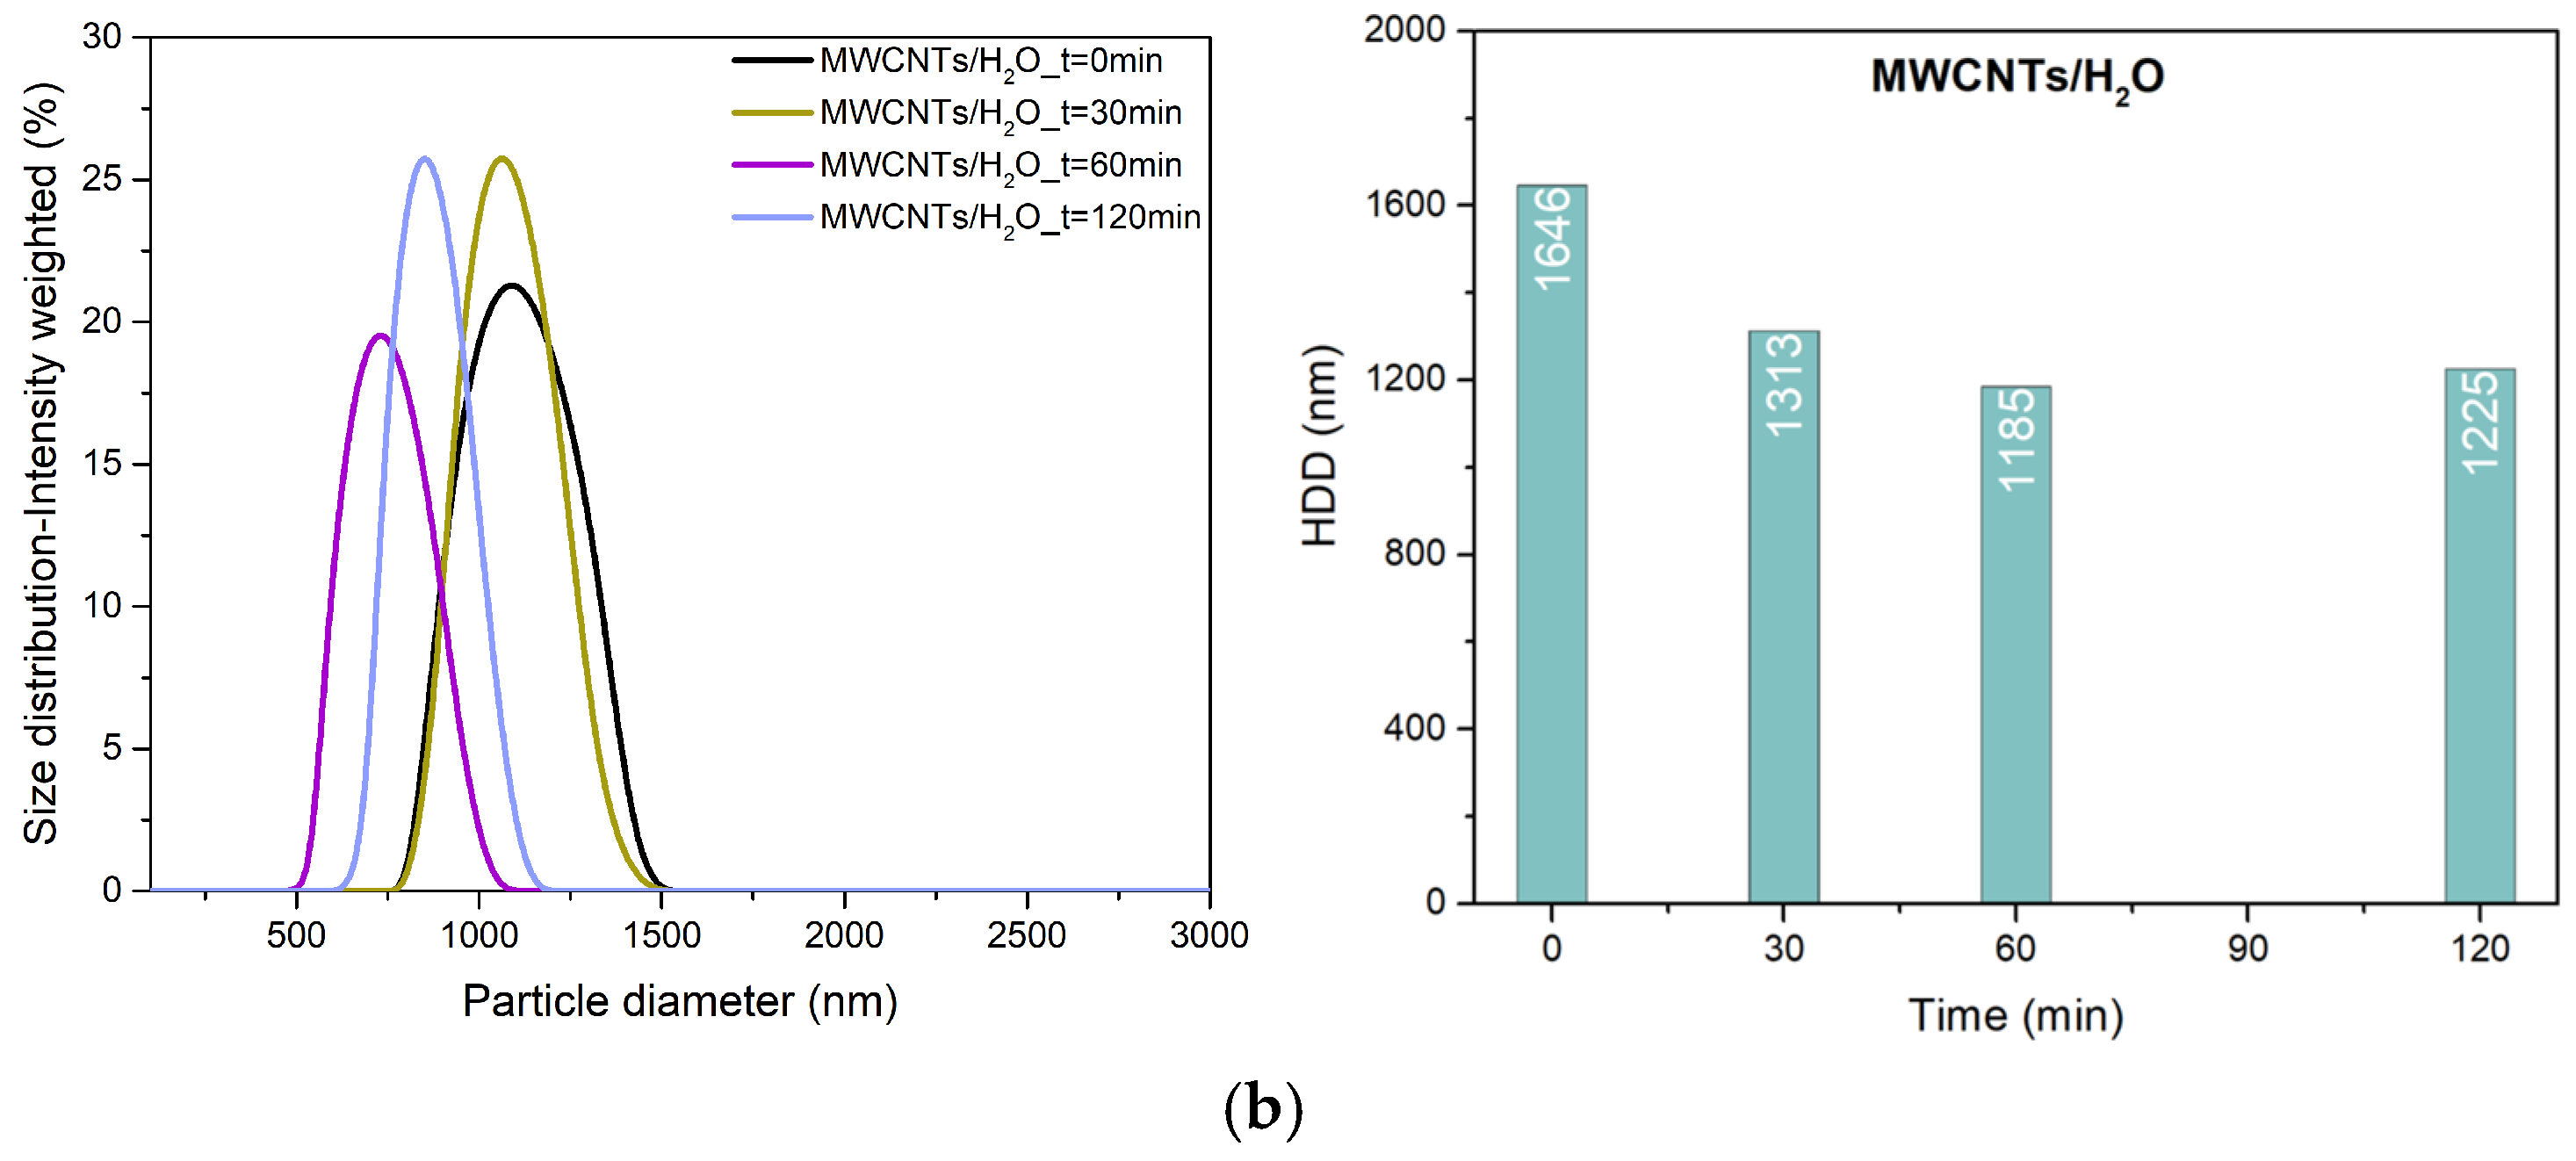
As shown in Figure 1a, a gradual reduction in HDD of soda lignin from 1866 nm to 684 nm within 120 min of US was observed. By contrast, US did not reduce the HDD of CNTs to the sub-micron range, as values remained above 1 µm even after extended treatment (Figure 1b) at 120 min of US. US exposure of up to 60 min resulted in a steady decrease in HDD, reaching a plateau that persisted for up to 120 min. Prolonged US may induce structural degradation or shortening of nanotubes [37,38,39]. Therefore, 60 min was selected as the optimal US time to achieve effective dispersion in water while avoiding potential MWCNT damage.
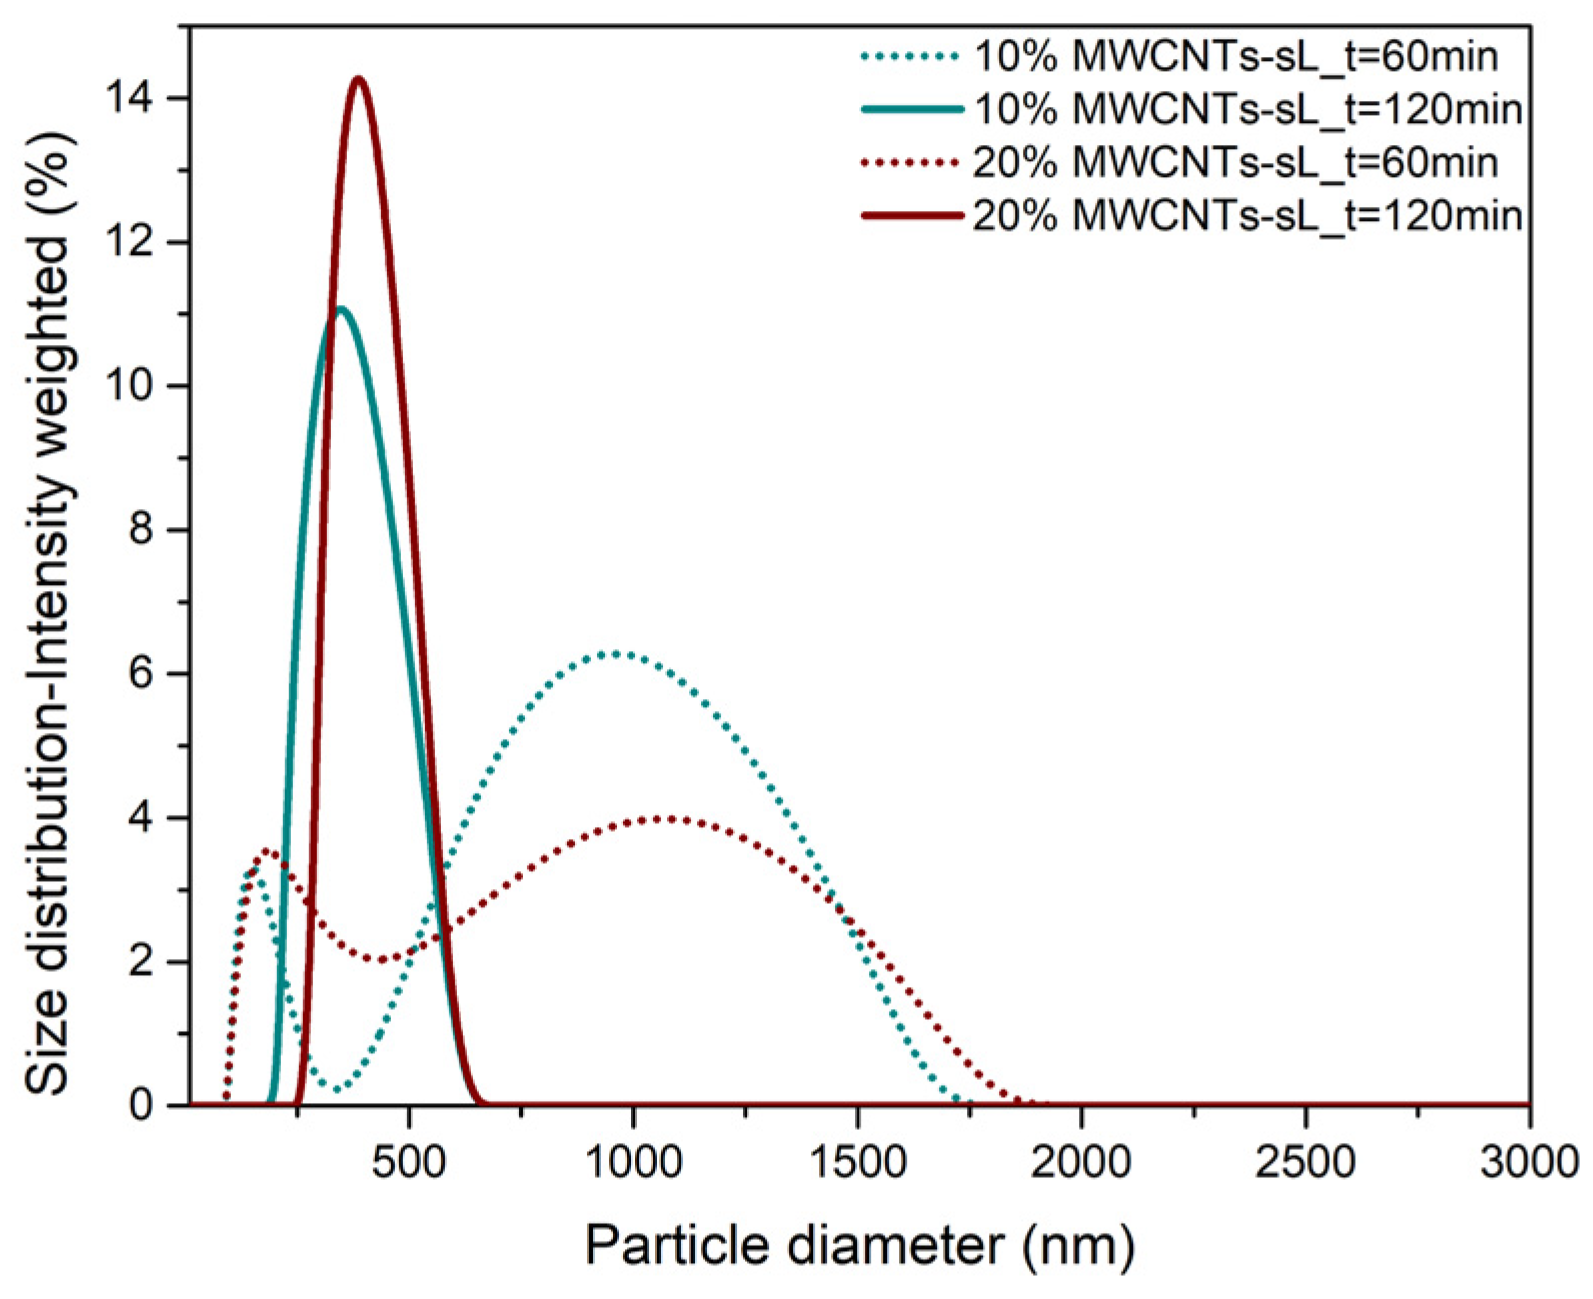
Both MWCNTs–sL hybrids exhibited better dispersion properties. As tabulated in Table 1, both 10% and 20% hybrid systems possessed significantly lower HDD values after US treatment. More specifically, at 60 min of US, the 10% and 20% hybrids exhibited an HDD of 645 nm and 661 nm, respectively. These values were slightly lower compared to the ones observed for sL (HDD = 690 nm) and significantly lower compared to pristine MWCNTs (HDD = 1185 nm). This reduction was even greater at 120 min of US, with the 10% and 20% hybrids exhibiting an HDD of 384 nm and 470 nm, respectively, compared with 684 nm for sL and 1225 nm for MWCNTs. The zeta potential values (−20 to −25 mV) indicated moderate electrostatic stabilization, with slightly higher absolute values observed at lower MWCNT loading. This result is consistent with smaller HDD and narrower size distribution in the case of 10% MWCNTs–sL hybrid (Figure 2), indicating a more efficient stabilization by lignin macromolecules. At lower CNT loading, lignin can more effectively adsorb onto individual nanotube surfaces through π–π interactions and hydrogen bonding, enhancing electrostatic and steric stabilization, whereas partial re-agglomeration at higher CNT content reduces the available surface area for lignin adsorption and slightly lowers the absolute ZP values [40].
Moreover, size distribution profiles (Figure 2) showed that for both hybrids, two particle size populations were present after 60 min of US. Prolonging the US to 120 min led to a single population, verifying the improved dispersion. This highlighted the need for extended US (120 min) for the optimum integration of MWCNTs within the lignin matrix, effectively eliminating aggregates [40]. The better performance in hybrid systems can be attributed to the interaction between lignin macromolecules and MWCNT surfaces, likely by π–π stacking and hydrogen bonding. Lignin can also act as a steric and electrostatic stabilizer, preventing MWCNTs from rebundling during US [19,41].

3.2. Stability Test

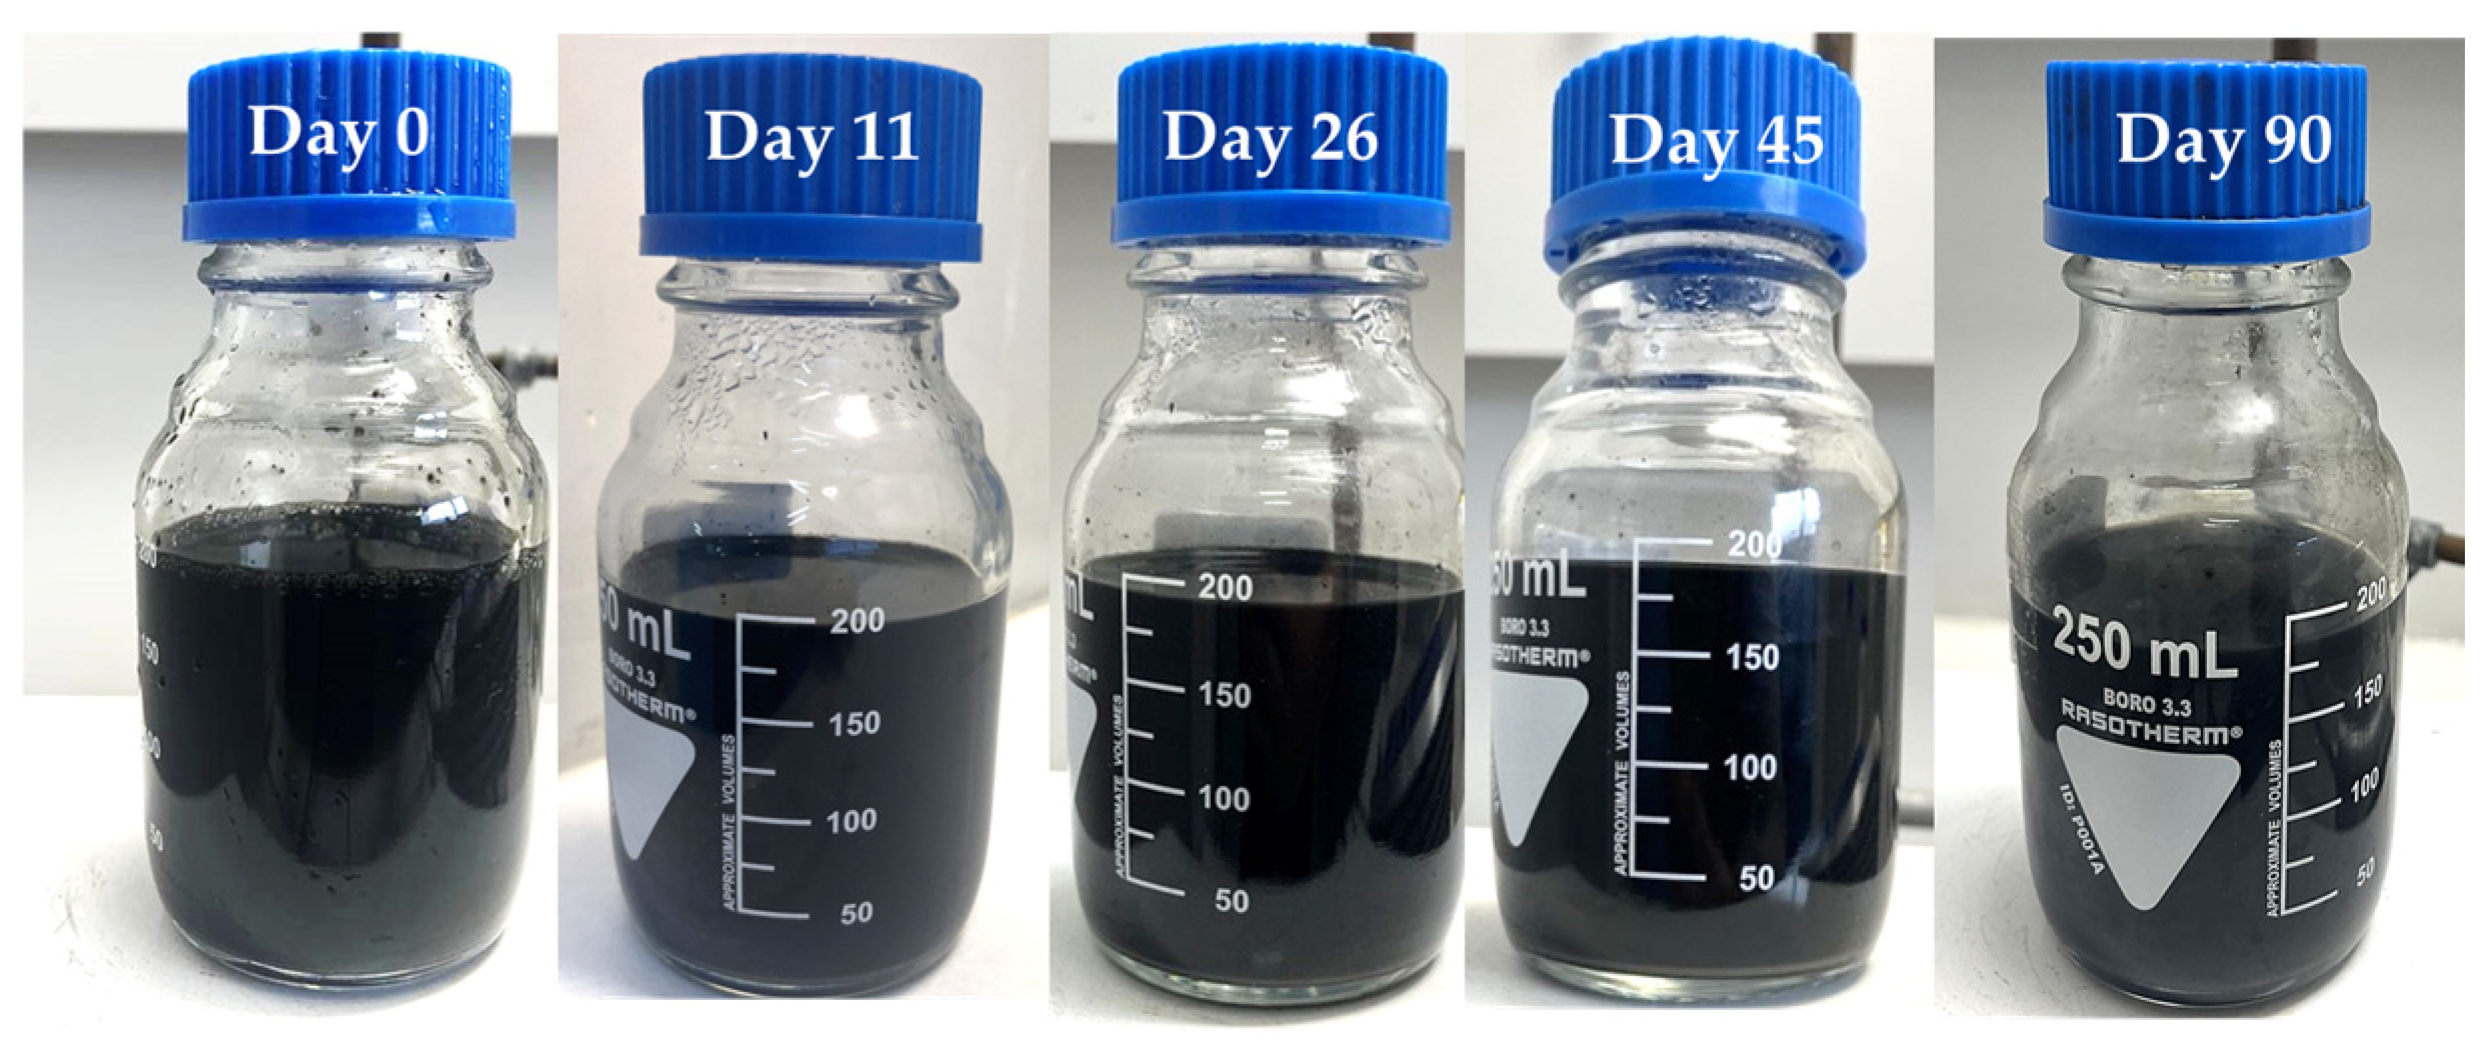
To assess the long-term colloidal stability of the 10% MWCNTs–sL dispersion, HDD and ZP measurements were performed using DLS over a 90-day period. As depicted in Figure 3, the dispersion remained visually homogeneous throughout the storage time. No significant aggregation or phase separation was observed, although minimal sedimentation of larger particles appeared at the bottom of the container after several weeks.
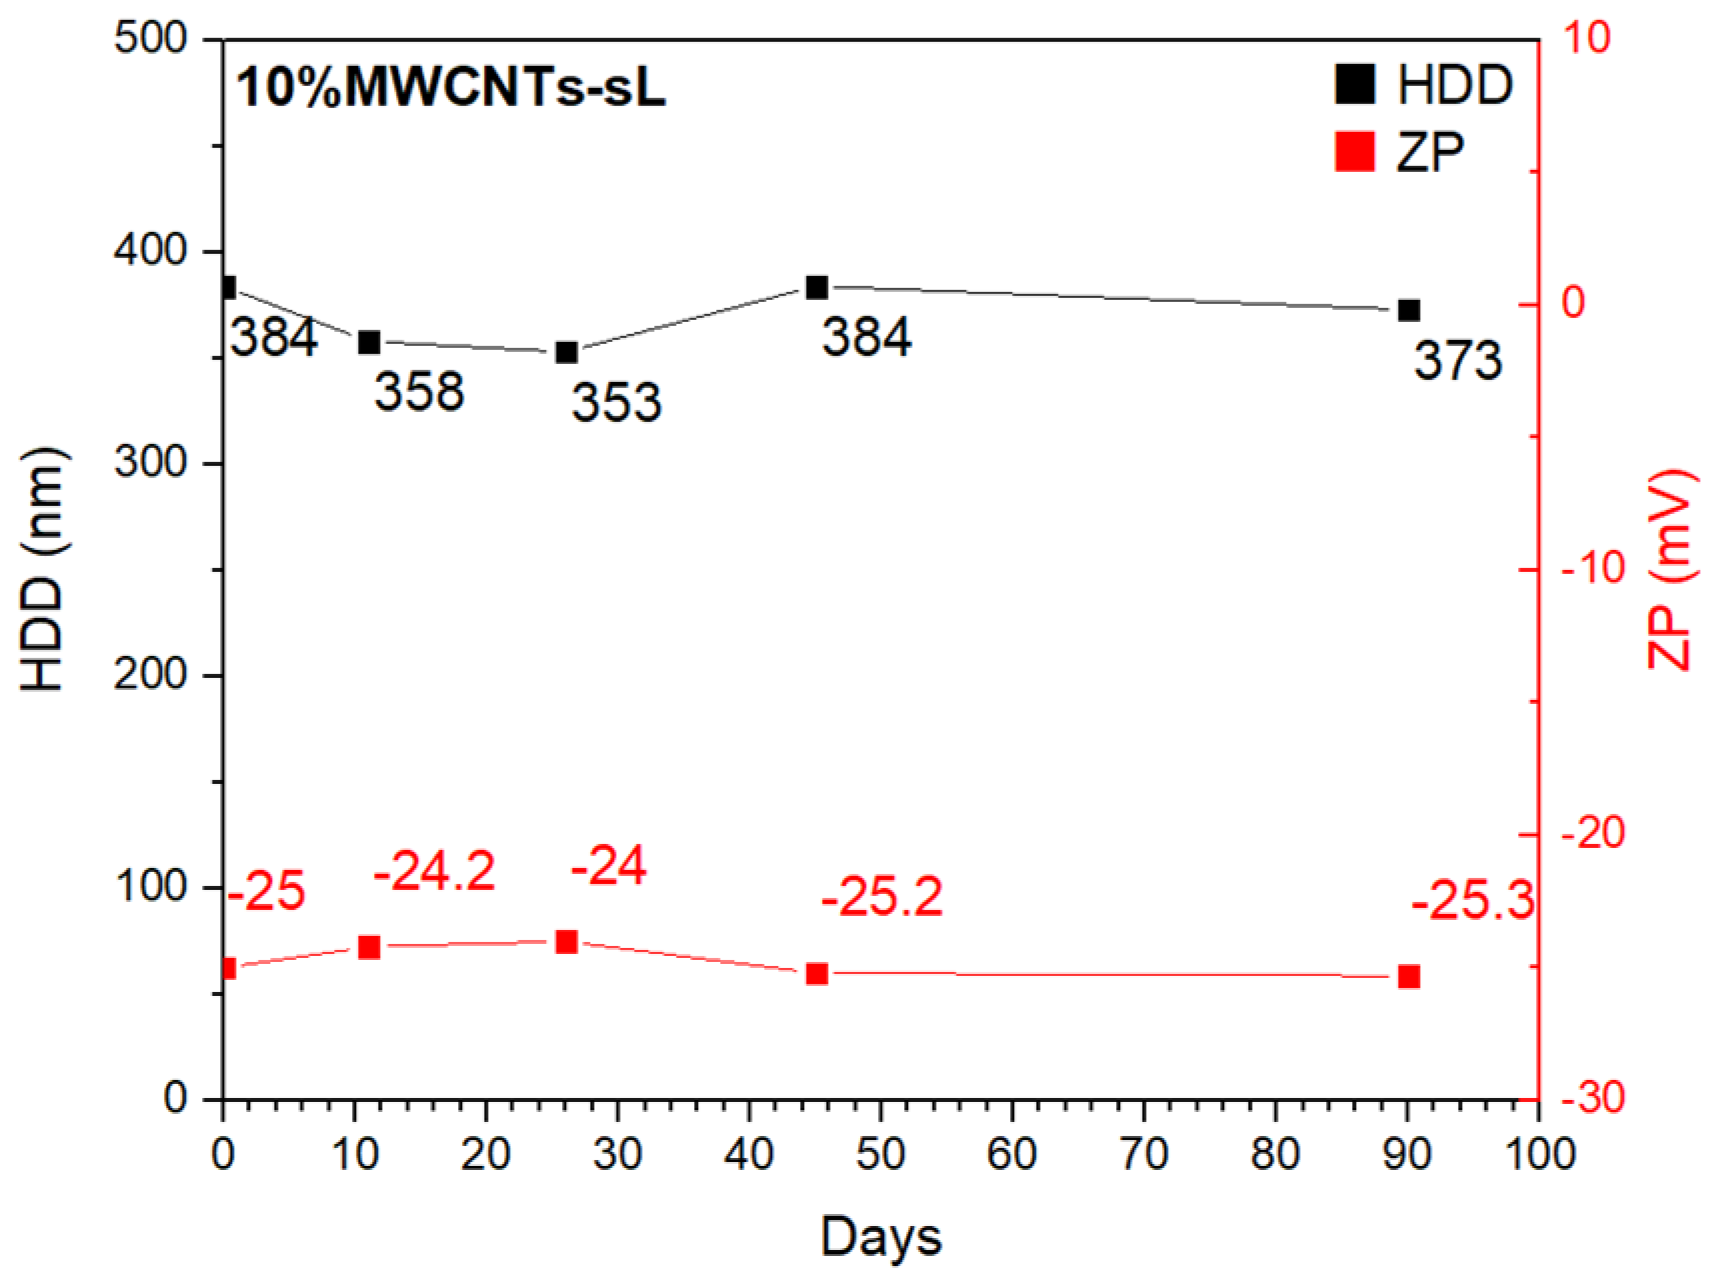
Figure 4 further confirms the long-term colloidal stability of the dispersion. HDD values exhibited minor fluctuations, ranging from 353 to 384 nm over the 90-day period, suggesting a stable particle size distribution. The ZP values ranged from −24 mV to −25.3 mV, indicating that sufficient electrostatic repulsion was maintained to prevent significant aggregation. The results confirmed that lignin effectively stabilizes MWCNTs in aqueous media without the need for additional synthetic surfactants. A similar 10-day stability study was also performed for the 20 wt% MWCNTs–sL hybrid dispersion, and the results are presented in Figure S1 of the Supplementary Information.

3.3. Microscopic Imaging

3.3.1. SEM Imaging

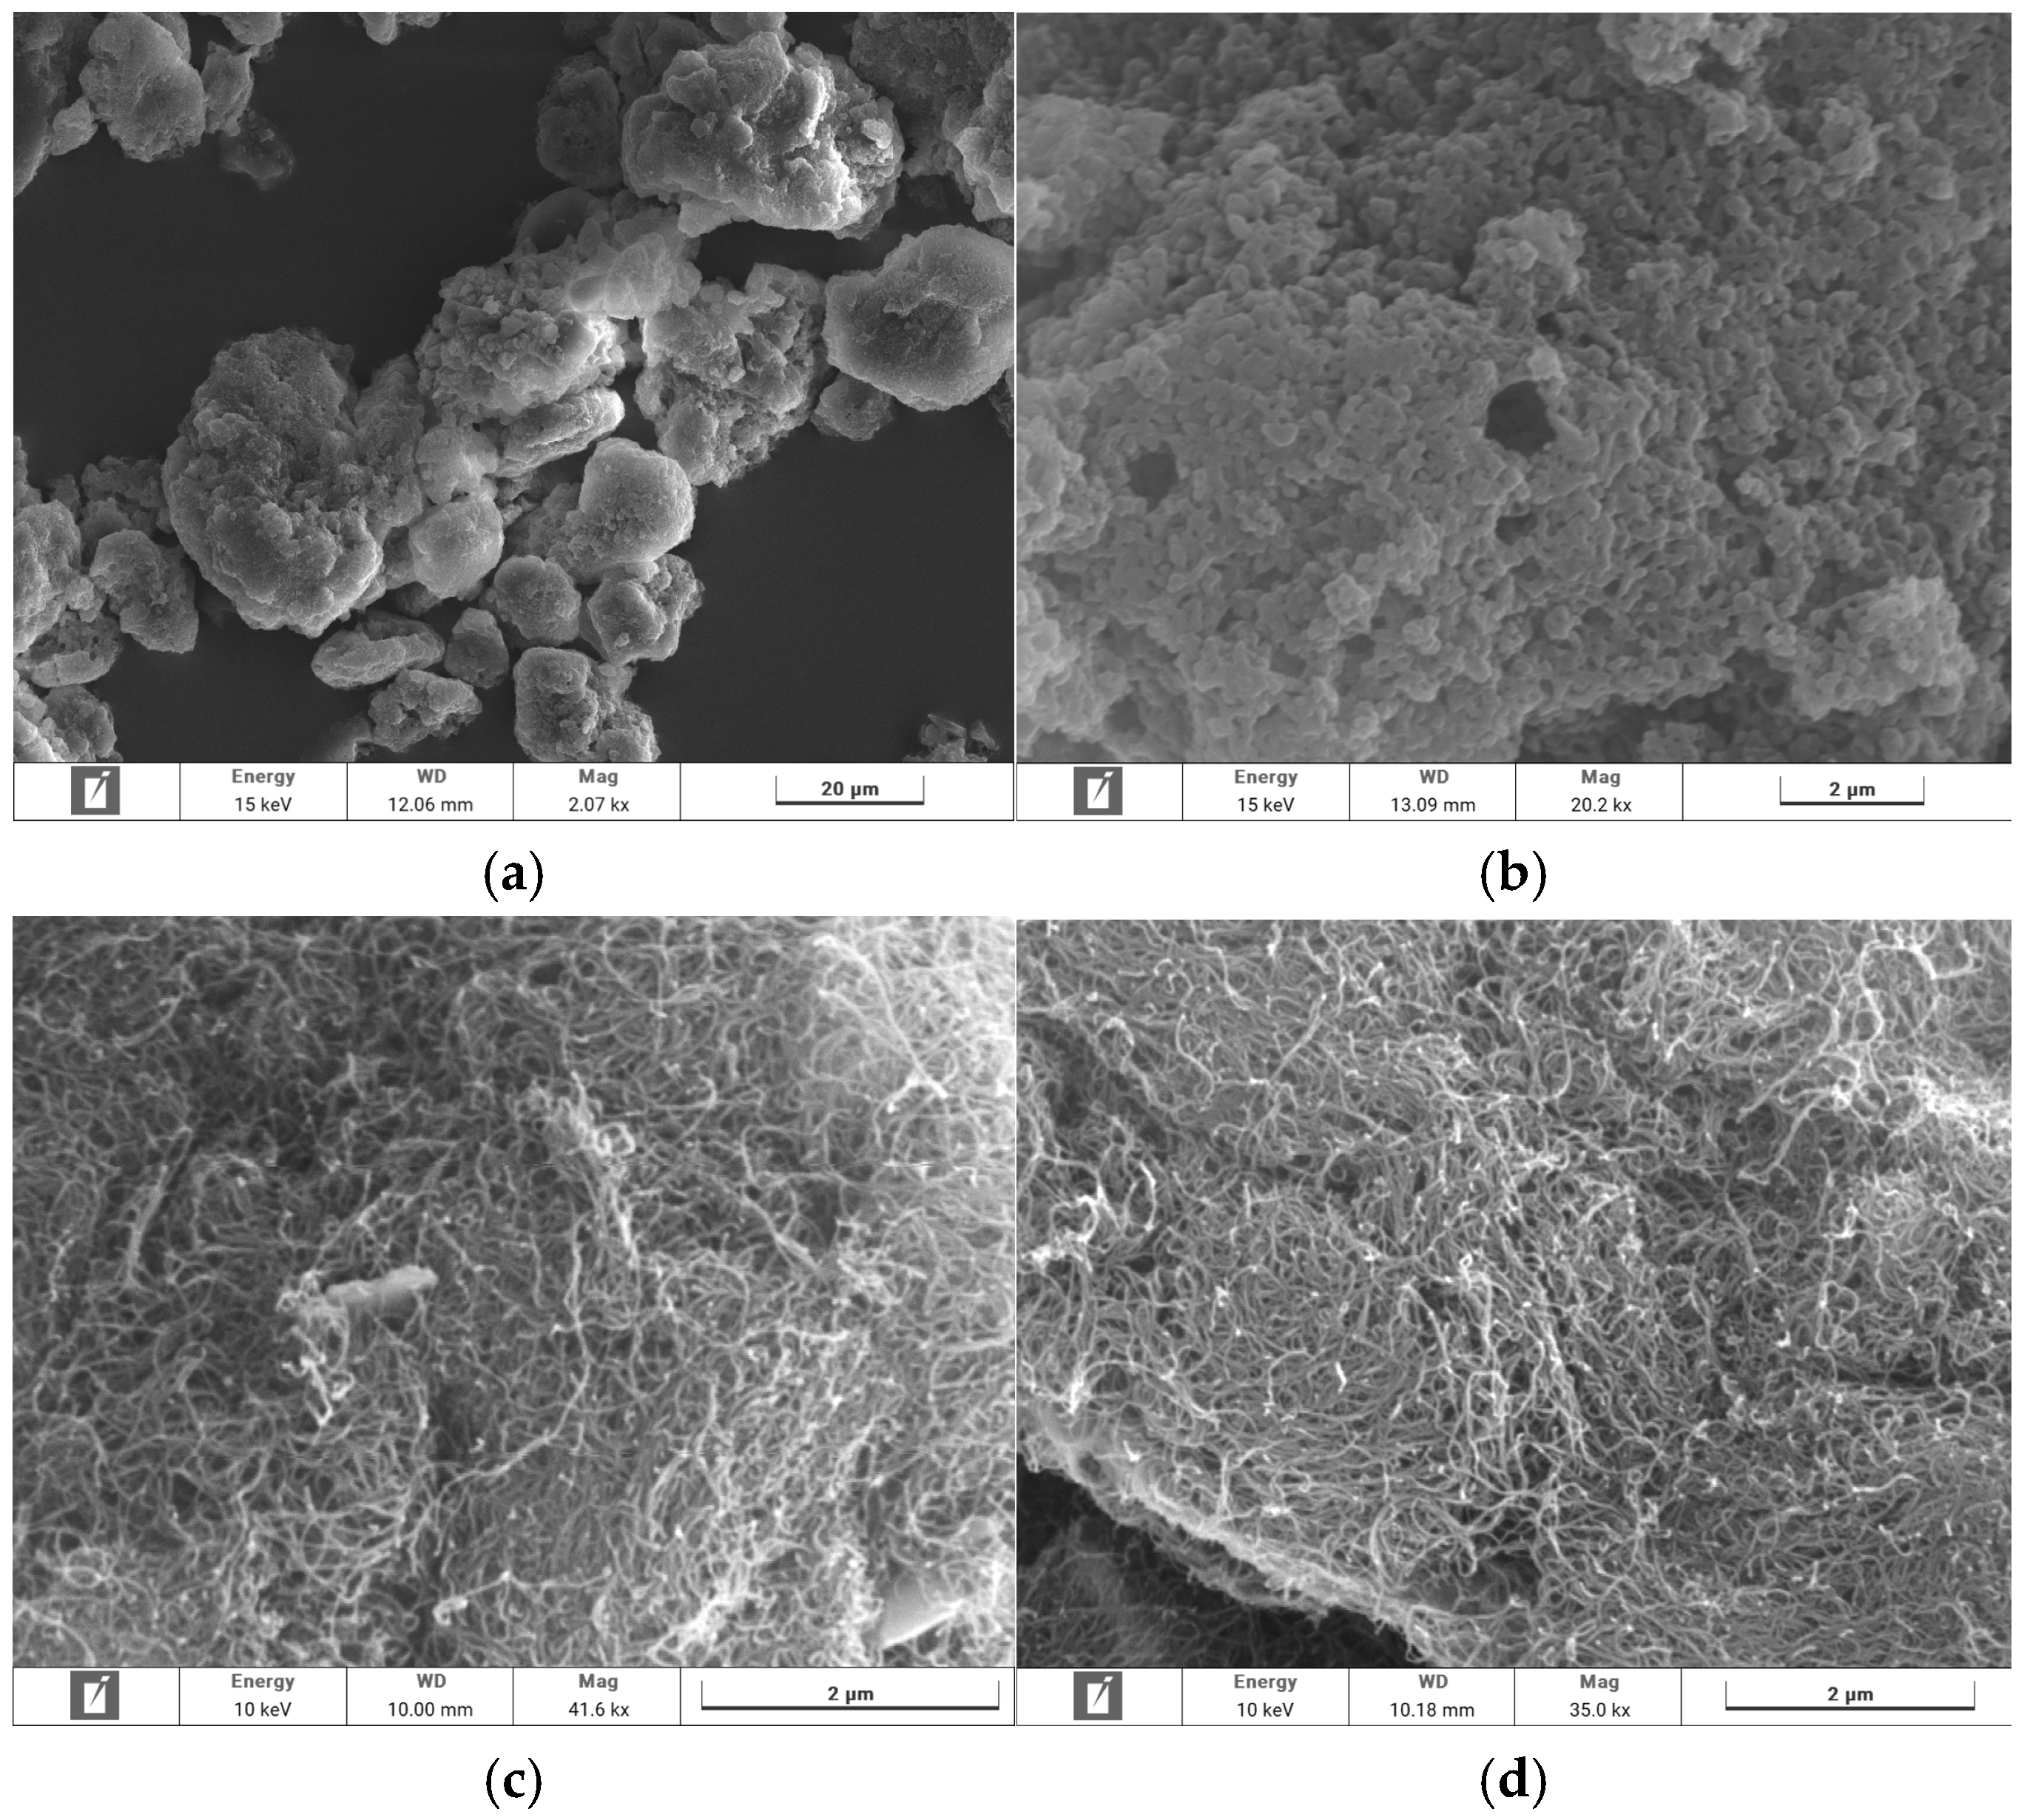
Figure 5 depicts the SEM micrographs of the starting materials at different magnifications: sL (Figure 5a,b) and MWCNTs (Figure 5c,d). The particles showed a wide size distribution, ranging from ~1 to 40 μm. The presence of larger structures indicated a tendency for lignin particles to self-aggregate. MWCNTs micrographs (Figure 5c,d) revealed an entangled network of cylindrical nanotubes with a high aspect ratio. The dense, tangled morphology is typical for MWCNTs and is suitable for the formation of conductive percolation paths in composites/hybrids.
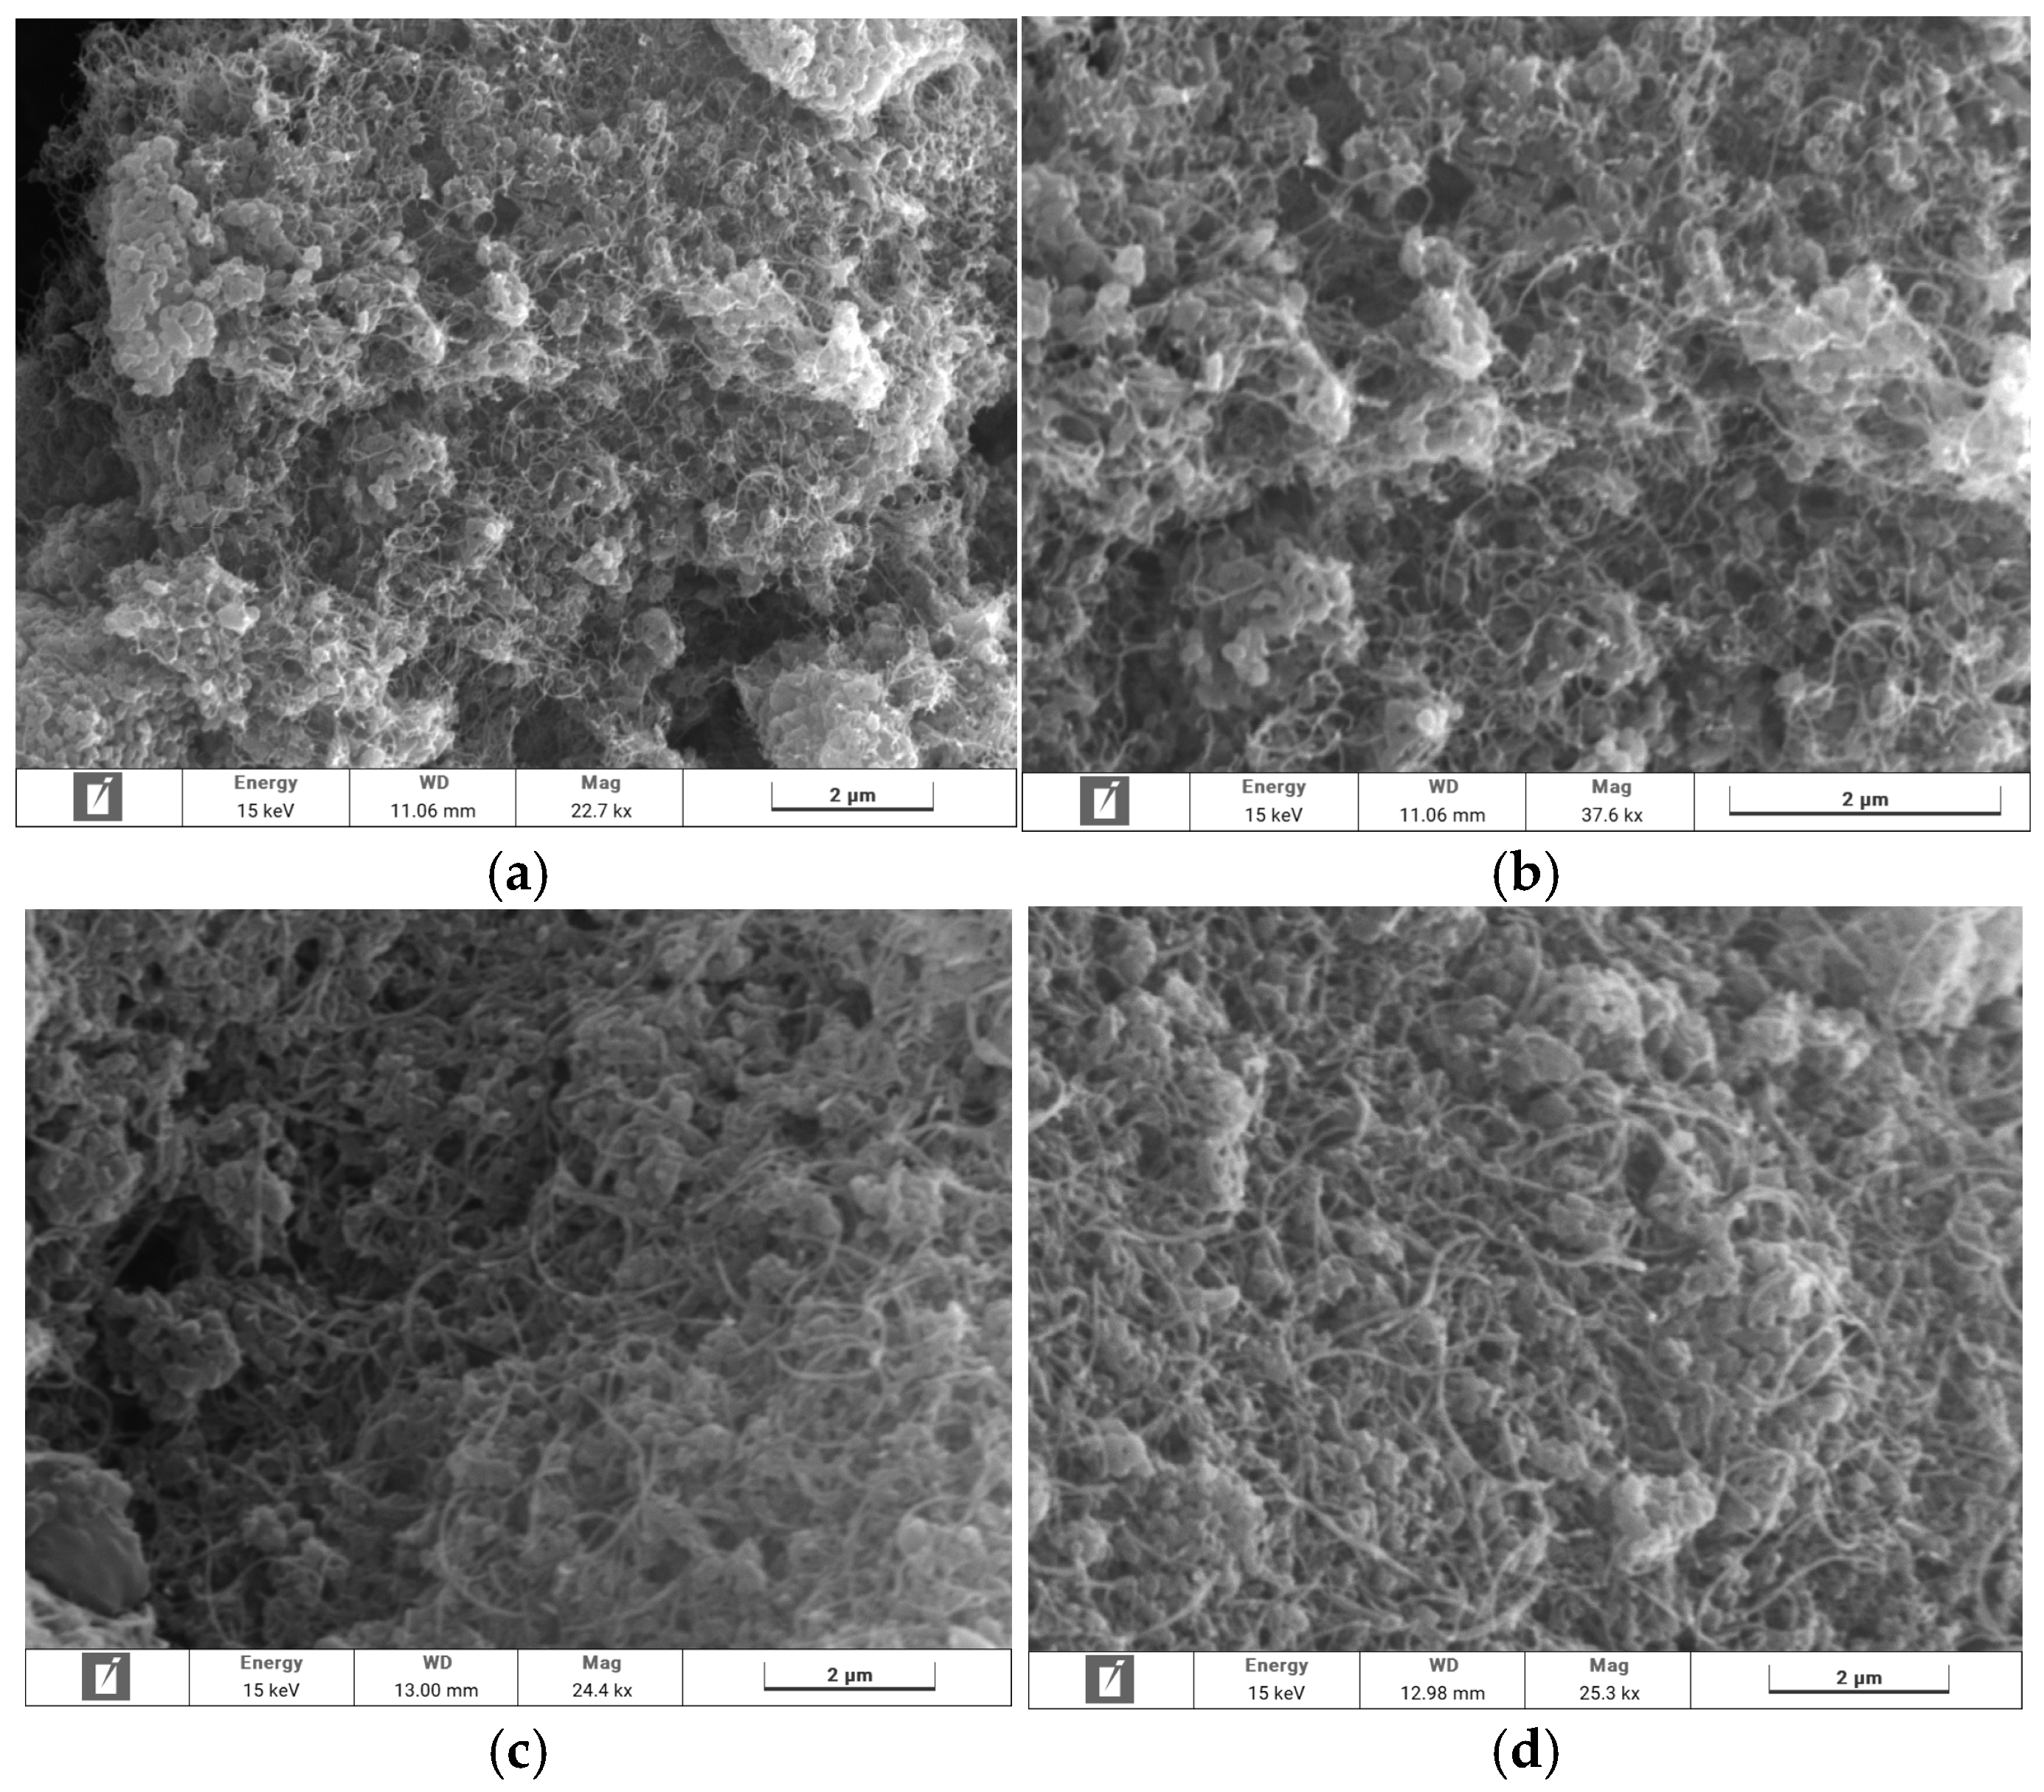
Figure 6 and Figure S2 present the micrographs of the two synthesized hybrids. In both cases, the micrographs indicate that the MWCNTs were entangled around the lignin particles with interconnected networks being created. Lignin appeared to act as a matrix, with the MWCNTs entangled on its surface, indicating an interaction between the two materials. At 10% MWCNT loading (Figure 6a,b), the hybrids displayed a more uniform structure, whereas at 20% MWCNT loading (Figure 6c,d), the presence of aggregates became more pronounced.

3.3.2. TEM Imaging

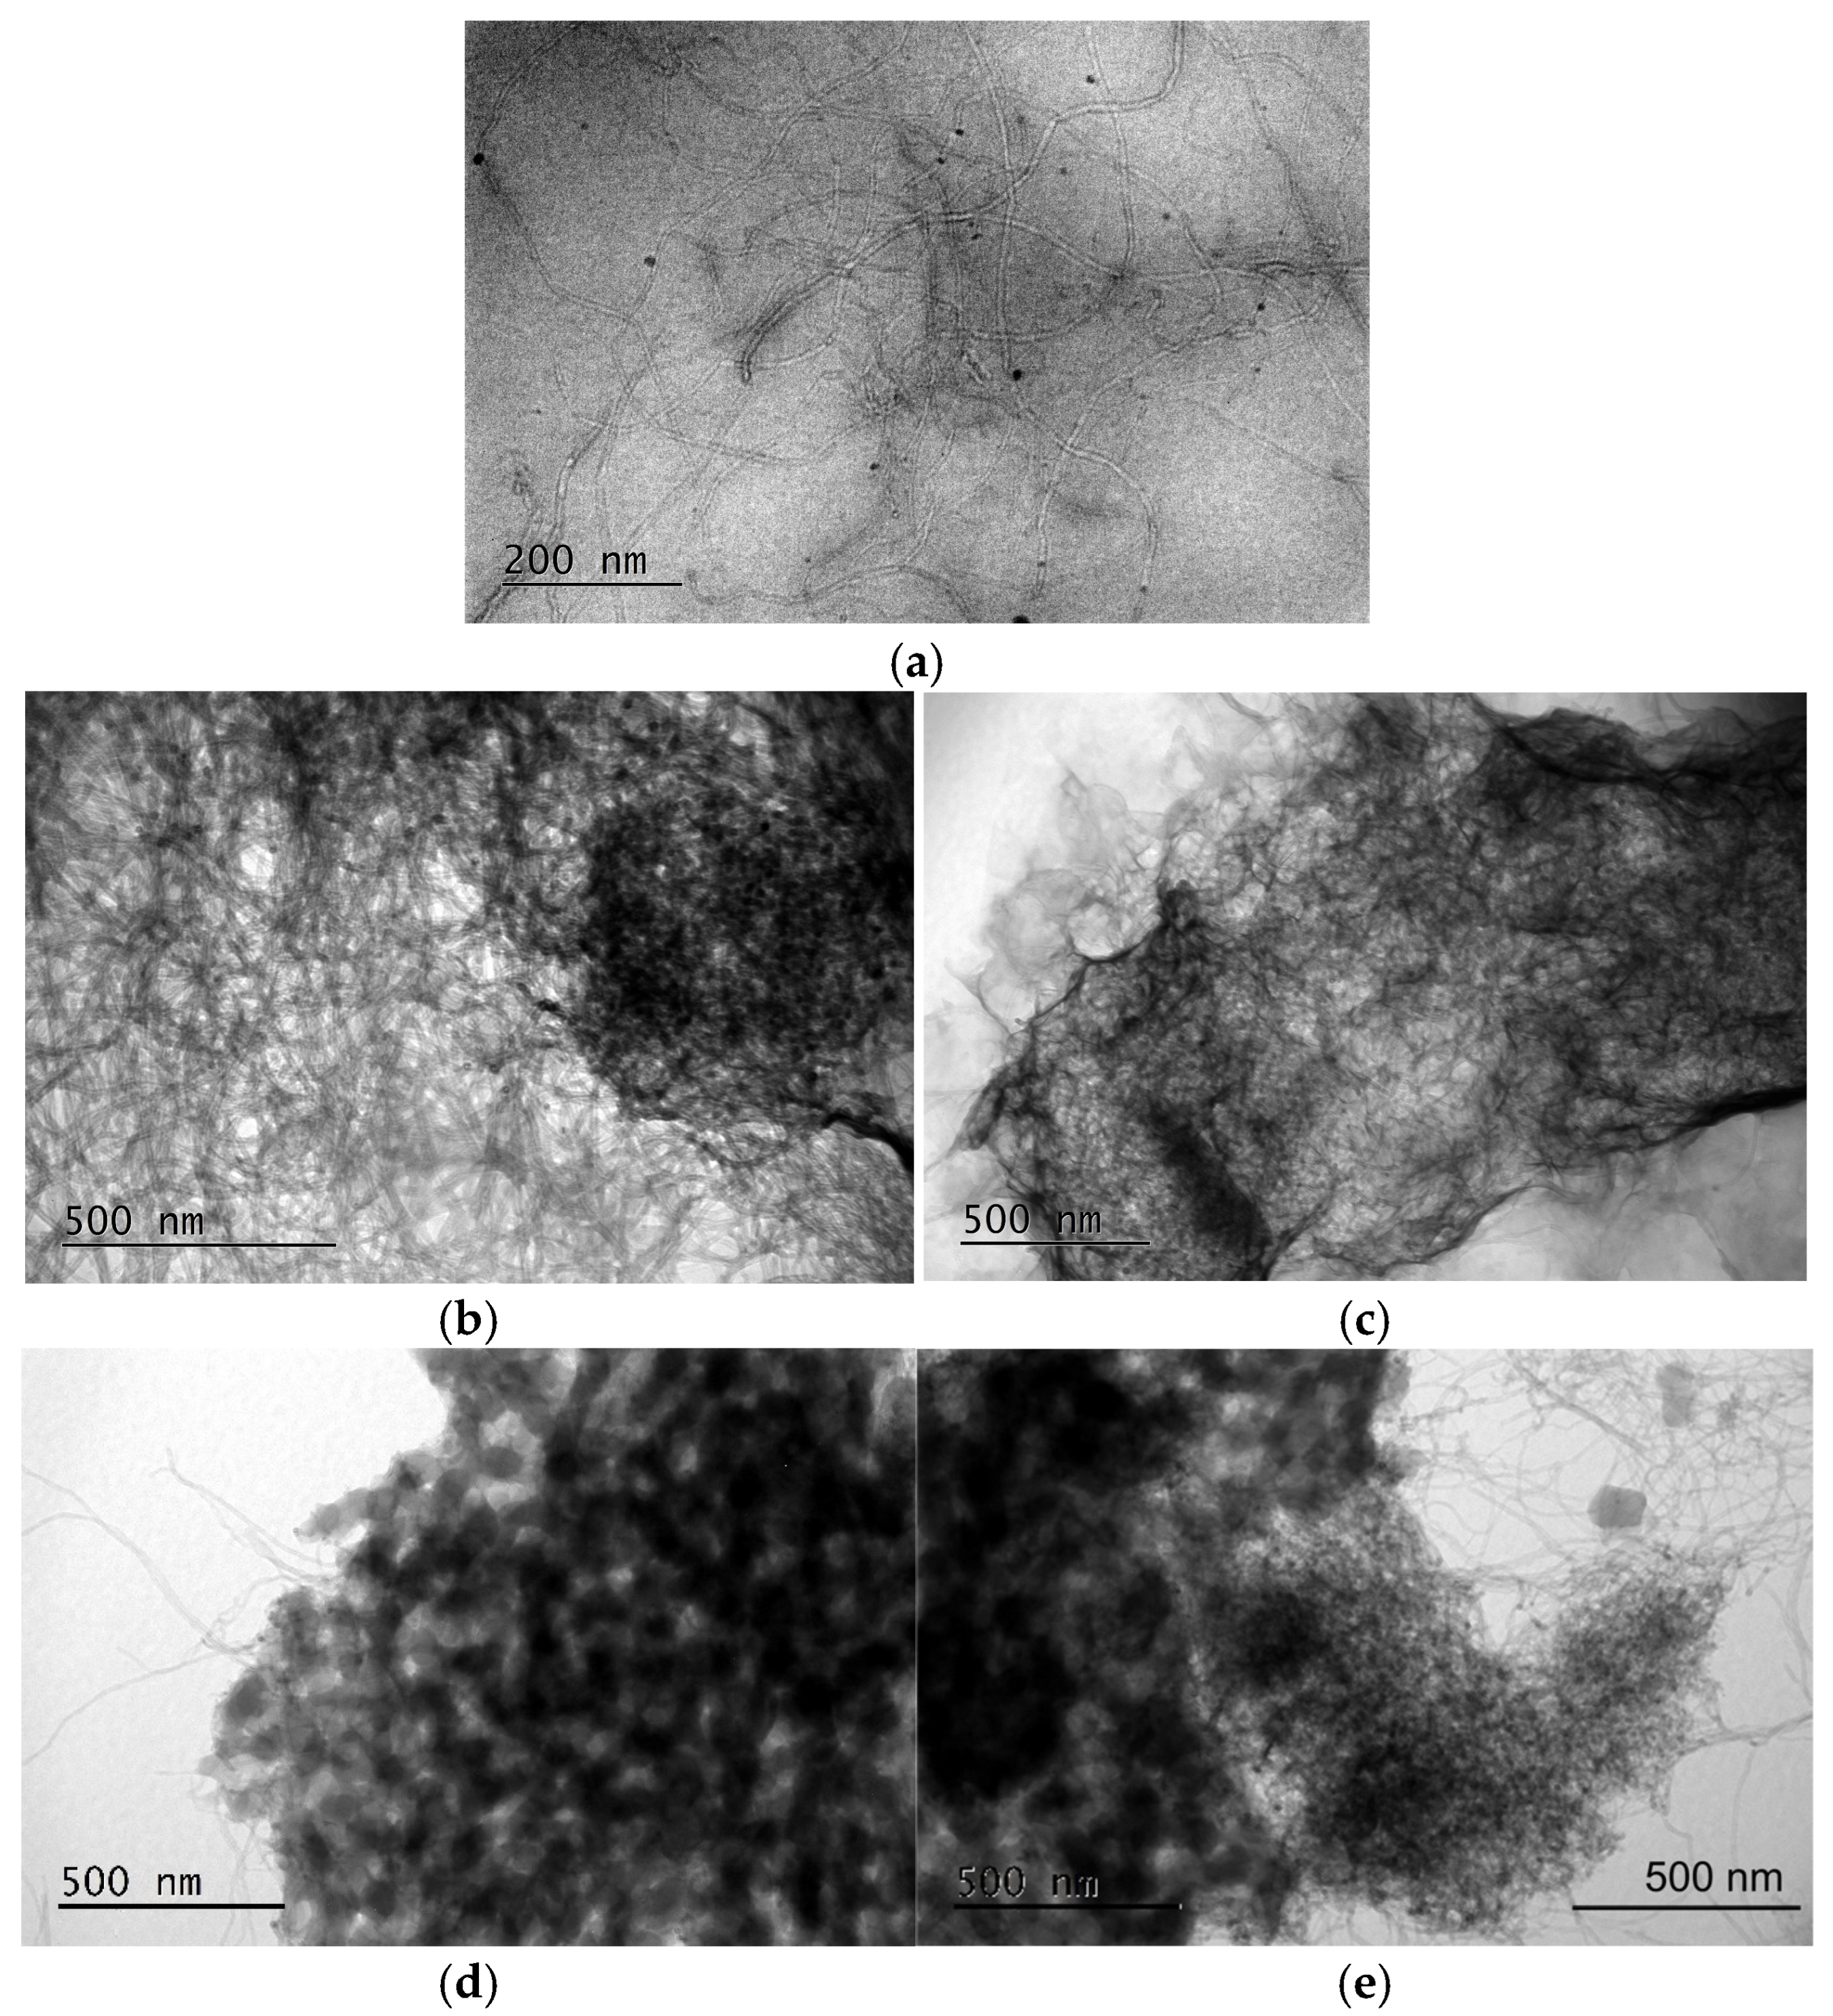
Figure 7 displays TEM micrographs of raw MWCNTs (Figure 7a), 10% MWCNTs–sL hybrid (Figure 7b,c), and 20% MWCNTs–sL hybrid (Figure 7d). In Figure 7a, the raw MWCNTs exhibited their characteristic long and tubular structures with relatively uniform diameter. In the 10% MWCNTs–sL hybrid (Figure 7b,c), a dense network was observed in which the MWCNTs were visibly integrated within the lignin matrix. The interaction appeared to promote the formation of lignin nanoparticle aggregates in certain regions. For the 20% MWCNTs–sL (Figure 7d,e), the structure became denser and more compact. The dark areas indicated aggregation, and MWCNTs were no longer easily distinguishable. This could be attributed to higher MWCNTs loading and reduced dispersion efficiency due to van der Waals interactions [42]. Nevertheless, MWCNTs can still be identified as entangled with the lignin matrix, implying the formation of conductive pathways. The TEM observations are consistent with the DLS and SEM results, confirming that the 10 wt% hybrid exhibits a more homogeneous dispersion with smaller HDD values and higher electrostatic stabilization (HDD = 380 nm, ZP = −25 mV), while the 20 wt% hybrid shows locally denser regions and partial CNTs aggregation, as also seen in the SEM images and reflected in its higher HDD and lower ZP values (HDD = 470 nm, ZP = −25 mV).

3.4. Raman Results and Interpretation

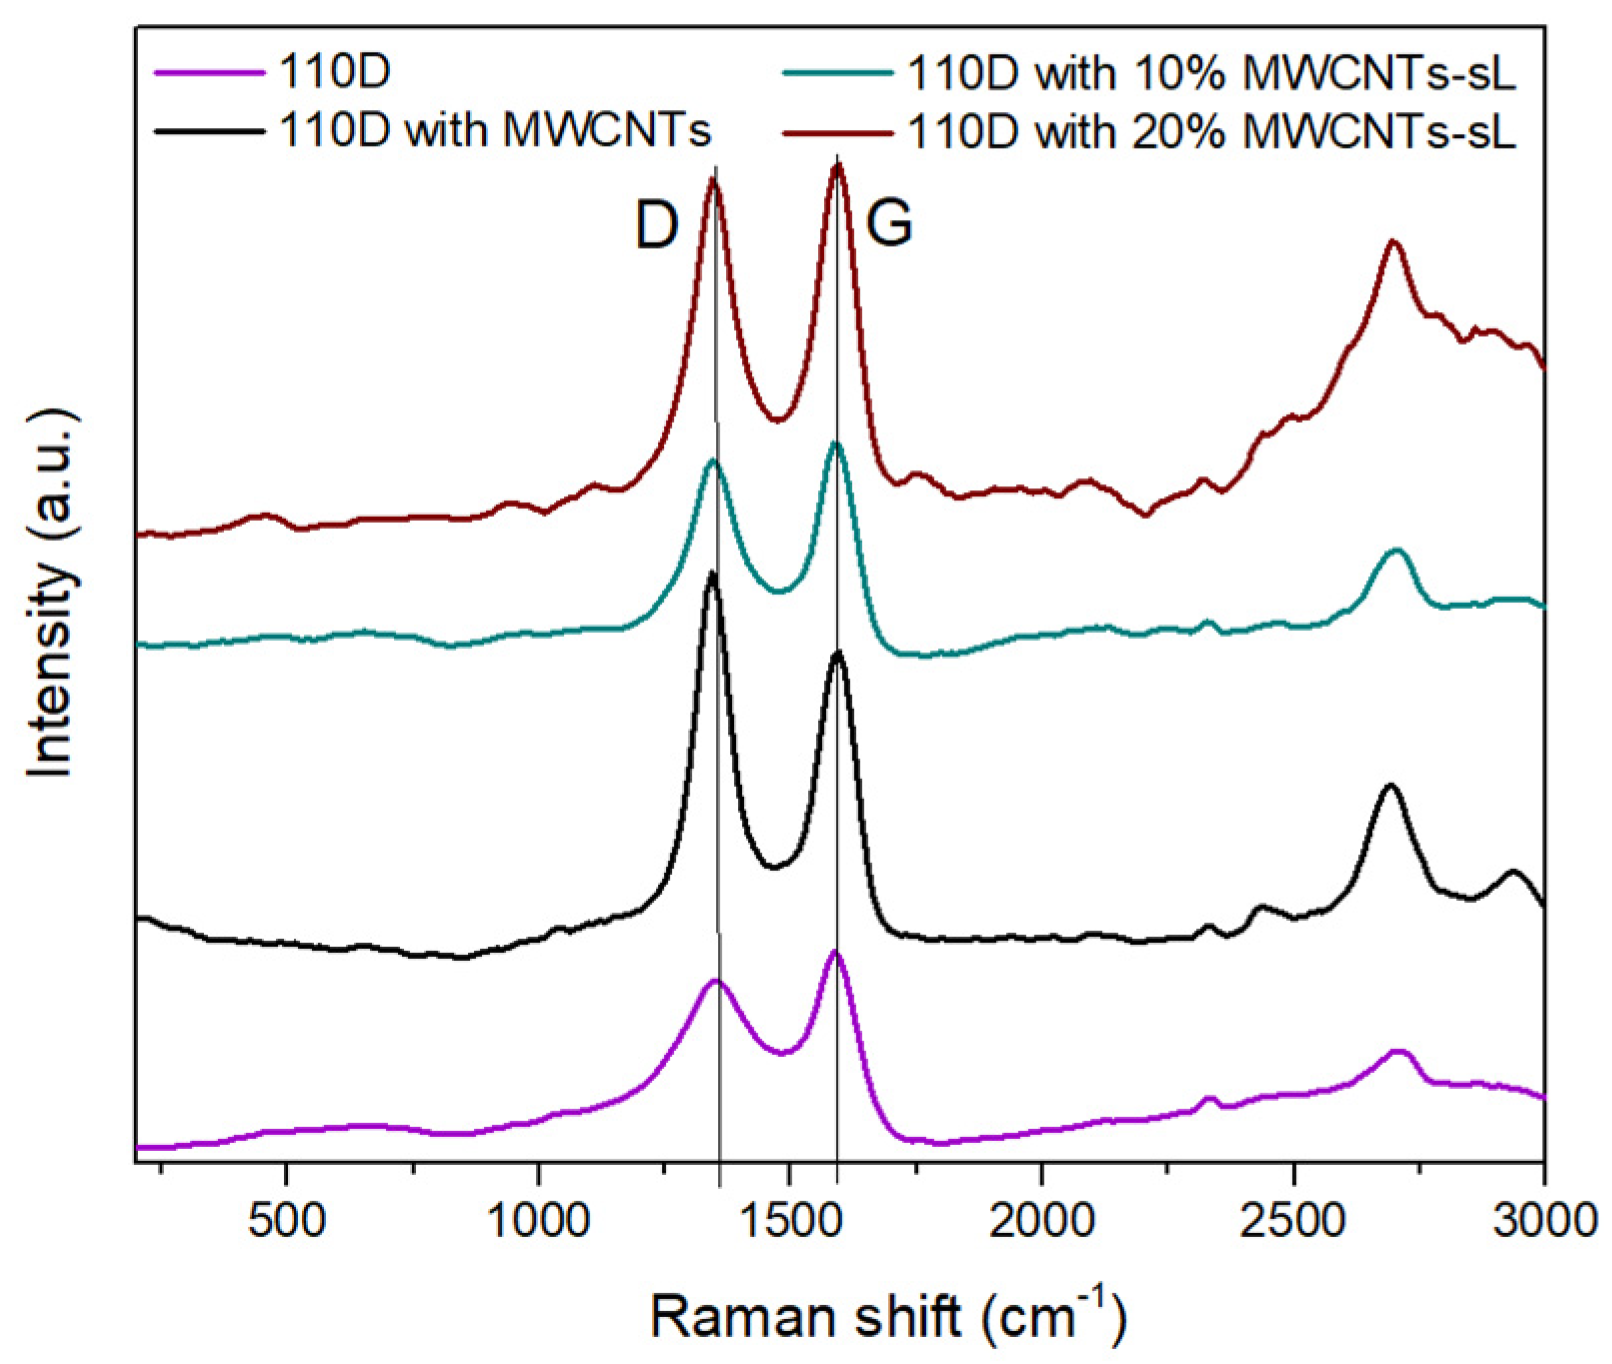
The Raman spectra of the 110D electrode, soda lignin, MWCNTs, and their hybrids are shown in Figure 8, with IG/ID ratios summarized in Table 2. The graphite electrode (110D) exhibited the two typical carbon bands, the D band (~1350 cm−1) and the G band (~1580 cm−1). The relatively high IG/ID ratio of 1.95 indicates a well-ordered graphitic structure with a low defect density, consistent with the crystalline domains of the electrode material [43]. Upon modification with soda lignin (Figure S3), considerable fluorescence was observed, and the spectrum showed an intense broadband, reflecting the complex aromatic structures of lignin [44]. The spectrum of MWCNTs displayed the two well-known bands of CNTs: the D band at ~1350 cm−1, related to structural disorder and defects, and the G band at ~1580 cm−1, corresponding to the in-plane stretching of sp2 carbon bonds in graphitic domains [36]. The low IG/ID ratio of 0.79 suggested a high level of disorder and the presence of amorphous carbon, which is common for untreated CNTs [45]. For the hybrids, both the D and G bands remained visible, but an increased fluorescence background was observed due to the contribution of lignin. No additional peaks appeared, indicating that the interaction between lignin and MWCNTs did not alter the characteristic Raman features of the nanotubes. The IG/ID ratio increased to 1.21 for the 10% MWCNTs–sL hybrid, suggesting improved MWCNT dispersion and partial reordering of the carbon structure facilitated by the lignin matrix. At 20% MWCNT loading, the ratio decreased slightly to 1.09, which can be attributed to CNT re-aggregation and increased structural disorder caused by stronger van der Waals interactions [46].

3.5. Electrical Characterization

3.5.1. BDS Analysis

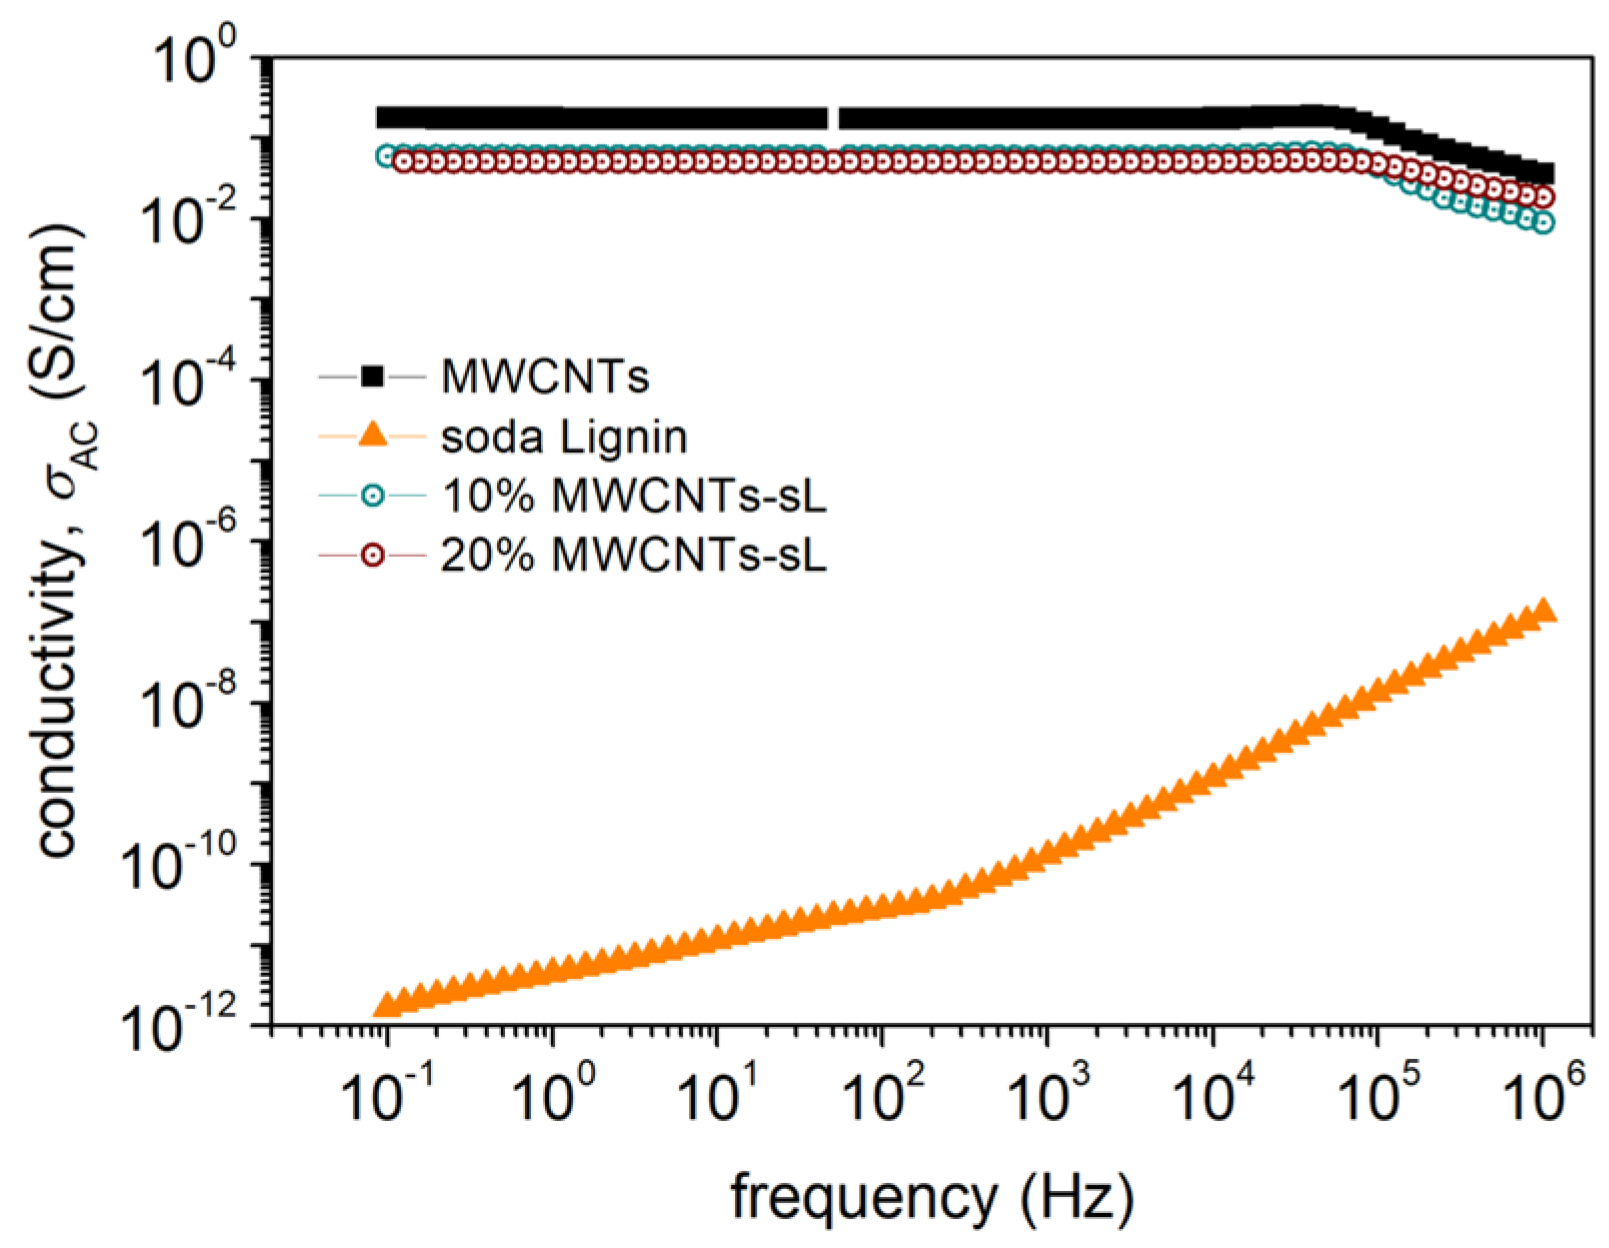
The electrical conductivity of the starting materials and hybrids was measured by BDS analysis (Figure 9). MWCNTs had a conductivity of σDC = 9.4 × 10⁻¹ S/cm, whereas lignin behaved as an insulator. Both hybrids exhibited conductivity values that were only one order of magnitude lower compared to MWCNTs. Specifically, the 10% MWCNTs–sL hybrid exhibited conductivity of σDC = 6 × 10⁻² S/cm, while the 20% MWCNTs–sL hybrid exhibited σDC = 5 × 10⁻² S/cm. This is an important result as the hybrids consist mostly of a biobased insulating matrix (80–90 wt% lignin) and contain only 10–20 wt% of the conductive material. The slightly lower σDC value observed for the 20 wt% hybrid compared to the 10 wt% hybrid may arise from partial CNTs re-agglomeration at higher loading, as evidenced by SEM and TEM observations (Figure 6 and Figure 7), which increases local heterogeneity and interfacial polarization losses. Such effects are commonly encountered in dielectric measurements of conductive composites, because BDS is highly sensitive to electrode polarization and Maxwell–Wagner–Sillars (MWS) interfacial phenomena that intensify with filler aggregation and non-uniform dispersion. These interfacial processes can depress the low-frequency σ plateau and lead to underestimation of the true DC conductivity relative to direct four-point probe measurements [47,48,49]. Electrical conductivity values of CNTs-biobased composites usually range from 10−4 to 1 S/cm depending on CNTs loading, dispersion quality, and type of biobased material. For example, polyamide 6 (PA6) composites with CNTs and metal additives showed conductivity values around 10−4 S/cm, while poly(butylene succinate) (PBS) composites with MWCNTs and Fe3O4 achieved conductivities between 10−3 and 10−2 S/cm [50]. In another study, polystyrene composites with 0.02–3.5 wt% MWCNTs reached up to 1 S/cm, as measured by BDS [51].
It is important to note that BDS is an indirect method to determine conductivity by studying the frequency-dependent dielectric behavior of materials. Due to this, the conductivity measured by BDS is lower than those measured by other techniques such as the four-point probe technique (see Section 3.5.2) that can measure direct conductivity through the percolative network of MWCNTs.

3.5.2. Four-Point Probe Analysis

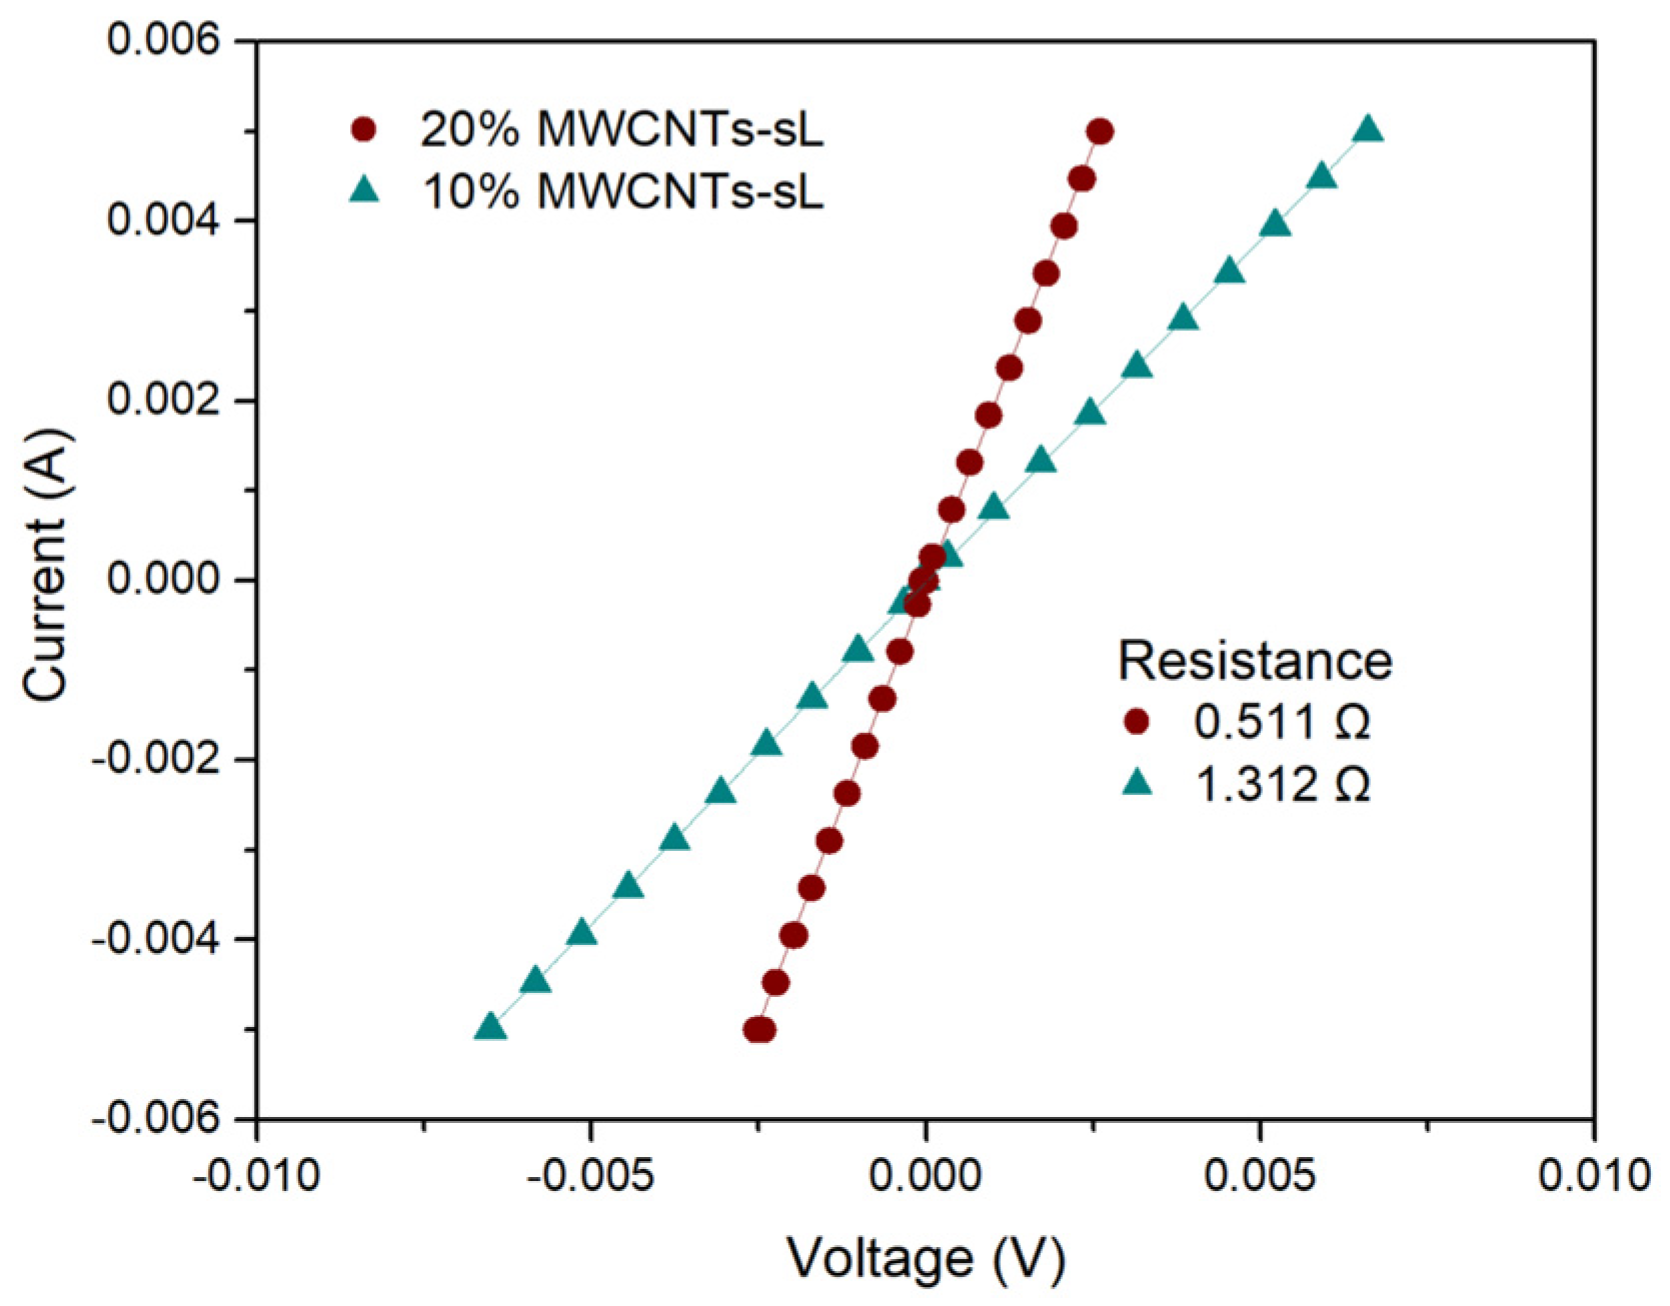
Four-point probe measurements were also carried out on the pellets used for BDS analysis to provide a more comprehensive electrical evaluation. The I–V curves (Figure 10) showed a clear difference between the 10% and 20% MWCNTs–sL hybrids. The slope of the curves reflected resistance, with the 20% hybrid exhibiting a much steeper slope, corresponding to a lower resistance (0.511 Ω), compared to the 10% hybrid (1.312 Ω). This indicated that increasing the MWCNTs content from 10 to 20 wt% enhanced electrical conductivity from approximately 2 S/cm to 5 S/cm, respectively, due to the formation of more effective conductive pathways. Table 3 provides sheet resistance analysis, including geometric and thickness corrections and estimated conductivity values. Pellets of MWCNTs were too brittle to sustain probe contact and fractured. This indicates that lignin probably acts as a binder that enhances mechanical integrity. This effect is confirmed by observations in CNT/polymer composites where a binding matrix enhances structural integrity [52]. Comparable conductivity values have been reported in other CNT/biobased composites. For instance, in polyacrylonitrile (PAN)-based composites with Cu/MWCNTs, conductivity increased significantly with filler loading, reaching 1.479 S/cm at just 0.5 wt% MWCNTs [53]. Similarly, epoxy composites with 25 wt% MWCNTs have demonstrated adequate conductivity around 0.1 S/cm [54]. Another study involving composites of Eucommia ulmoides gum (EUG) with CNTs and graphene nanoplatelets reported conductivities in the range of 2.3–2.7 S/cm, measured via the 4PP method, despite using 10 wt% MWCNTs [55]. Finaly, a similar study has been reported, which developed sodium lignosulfonate/MWCNT composite coatings for paper electronics. In that study, coatings containing 23 wt% MWCNTs exhibited sheet resistances of ~113 Ω/sq [56]. These comparisons highlight that the electrical conductivity values of our MWCNTs/lignin-based hybrids are highly competitive with both synthetic and biobased systems.
The electrical conductivity values of both MWCNTs–sL hybrids measured via BDS (~6 × 10⁻² S cm−1 and ~5 × 10⁻² S cm−1 for 10 wt% and 20 wt% MWCNTs loading, respectively) were significantly lower than those obtained via 4PP measurements (~2 S cm−1 and ~5 S cm−1, respectively). Additionally, BDS indicated comparable conductivities for the two hybrids, whereas four-point probe measurements revealed an increase at higher MWCNT loading (20% > 10%). This discrepancy arose from the fundamental differences between the two measurement techniques. Specifically, the lower conductivity values observed in BDS were commonly attributed to voltage drops at the electrode–sample interface. In carbon–polymer composites, this effect is further influenced by the preferential orientation of conductive fillers, often induced by the preparation method [57]. Supporting this, a study by Madinehei et al. reported that in graphene–polyester composites, BDS-derived conductivities were typically an order of magnitude lower than those measured by four-point probe, due to the factors mentioned above [57].

3.6. Electrochemical Performance

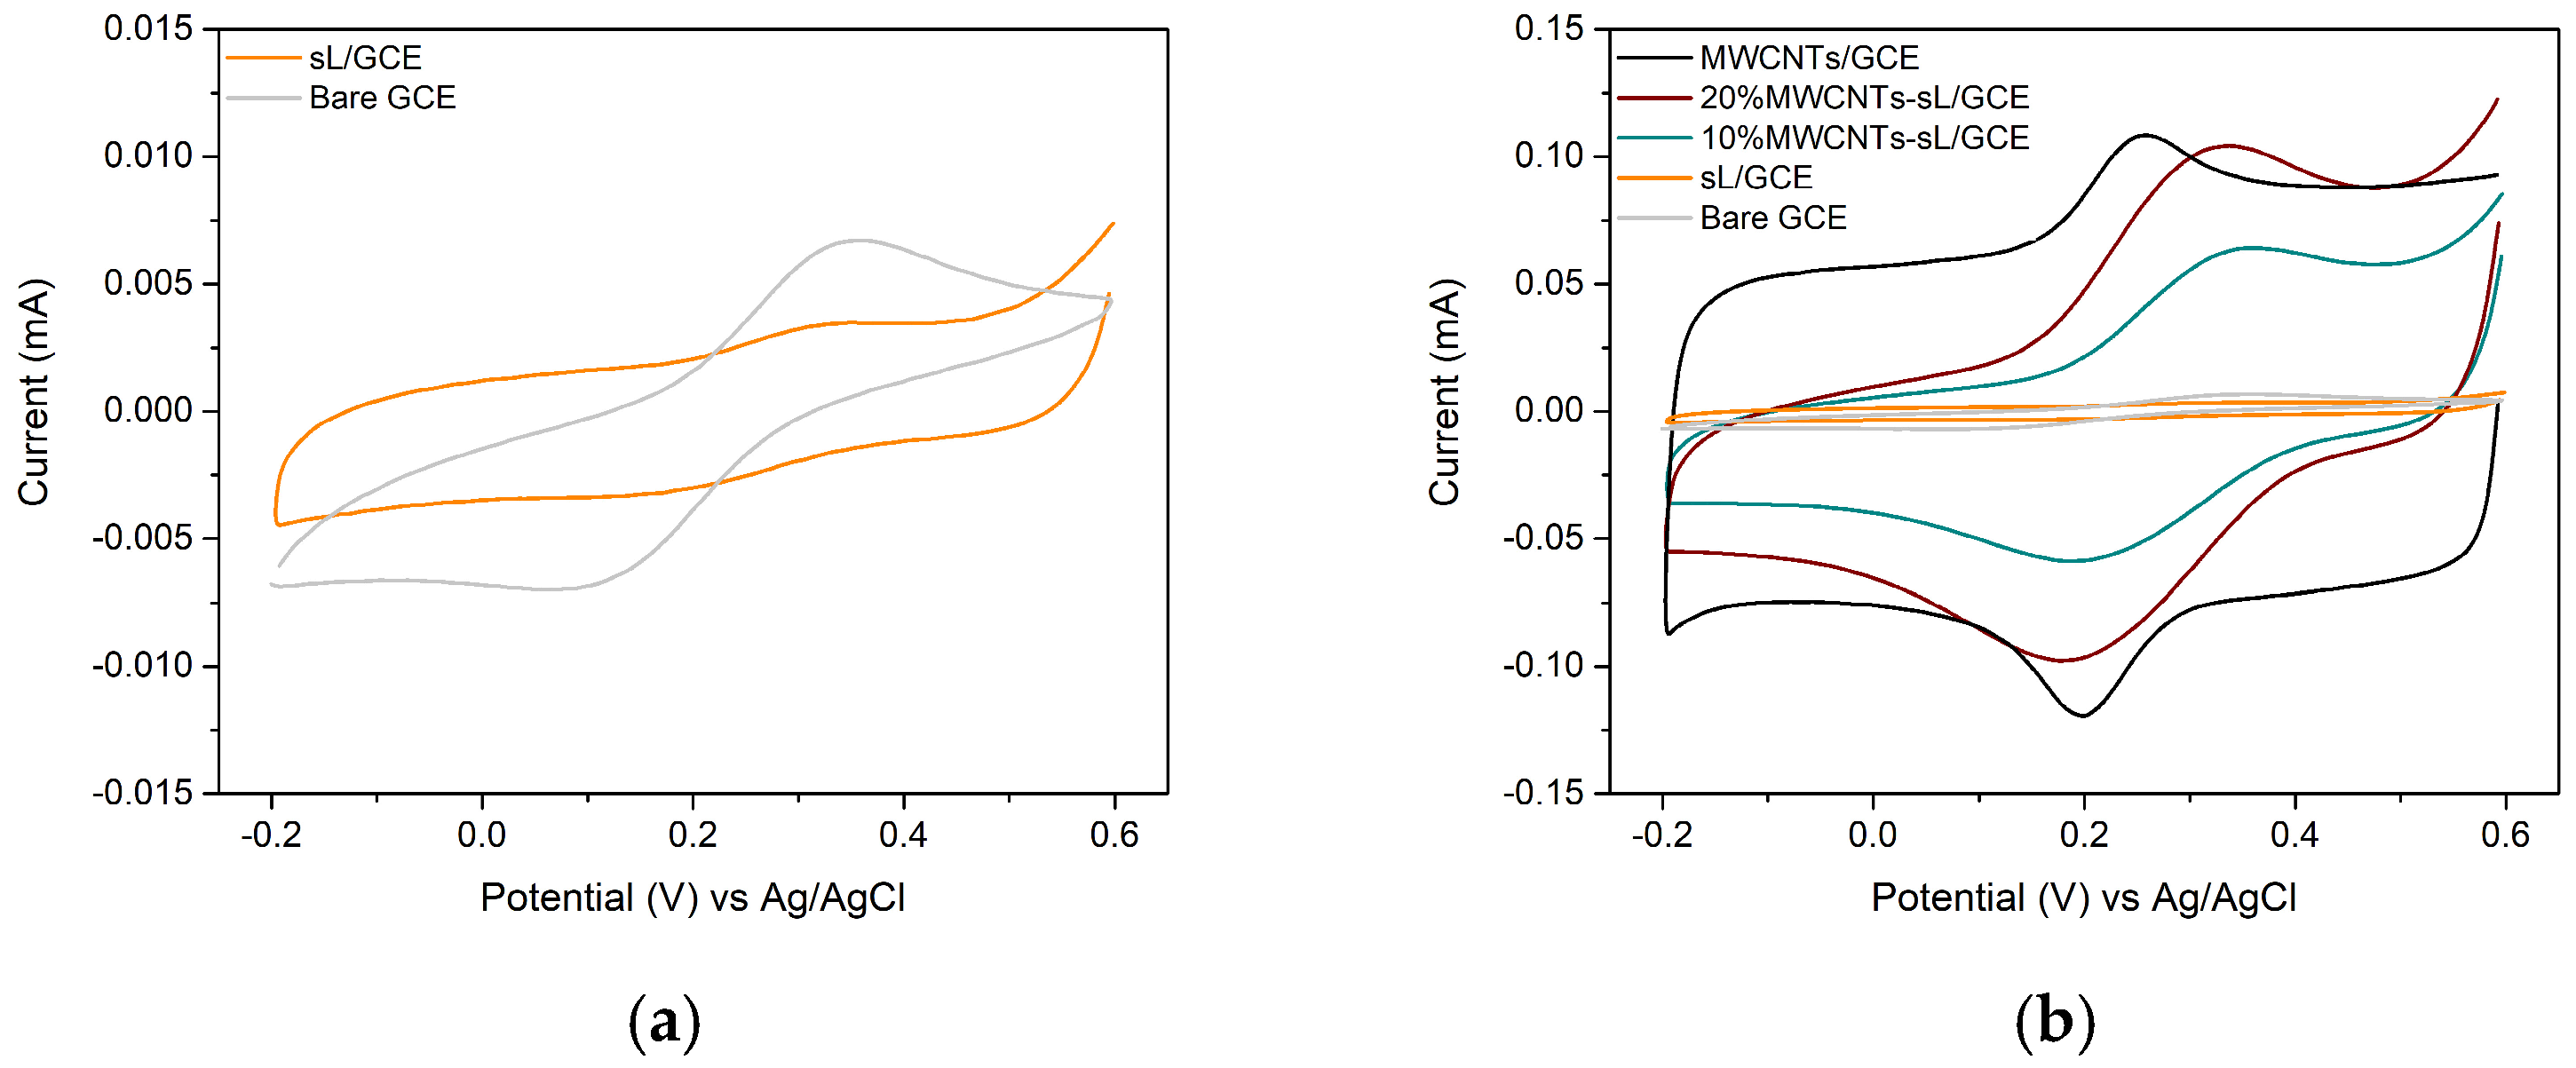
The electrochemical behaviors of raw MWCNTs, sL, 10% MWCNTs–sL, and 20% MWCNTs–sL were investigated using cyclic voltammetry. Measurements were performed with bare GCE, MWCNTs/GCE, sL/GCE, 10%MWCNTs–sL/GCE, and 20% MWCNTs–sL/GCE in a standard 1 mM K3[Fe(CN)6] as a redox probe in 0.1 M KCl as the aqueous supporting electrolyte at a scan rate of 50 mV/s (Figure 11), and additionally at 20 mV/s and 100 mV/s, as shown in Figure S4a–d.
The expected electrochemical behavior of the [Fe(CN)6]3−/4− redox couple is observed, with distinct anodic and cathodic peaks indicating a quasi-reversible or reversible electron transfer process. The anodic peak corresponds to the oxidation of [Fe(CN)6]4− to [Fe(CN)6]3−, while the cathodic peak represents the reverse reduction in [Fe(CN)6]3− to [Fe(CN)6]4− [58].
The comparison of the cyclic voltammograms for the bare GCE and modified electrodes revealed notable differences in electrochemical behavior, indicating changes in surface morphology and confirming modification with MWCNTs lignin-based hybrids. As shown in Figure 11, the sL/GCE showed a significantly lower current response, approaching the values of bare GCE, in agreement with its insulating nature, as confirmed by BDS measurements. In contrast, the MWCNTs/GCE exhibited a well-defined redox couple with a reduction peak ≈ 0.18 V and an oxidation peak ≈ 0.25 V. This behavior reflects efficient electron transfer kinetics, attributed to its adequate electrical conductivity (σDC = 9.4 × 10⁻¹ S/cm), along with strong capacitive characteristics. The modified electrode composed of 10% MWCNTs and 90% soda lignin demonstrated an intermediate current response, higher than soda lignin alone but lower than pure MWCNTs, indicating an improvement due to the presence of conductive CNTs. Additionally, the potential values of the redox couple peaks for the 10% MWCNTs–sL/GCE were shifted slightly towards more positive potential values (oxidation peak ≈ 0.35 V; reduction ≈ 0.20 V). Notably, the 20% MWCNTs–sL/GCE demonstrated a further enhancement, with peak currents approaching those of the raw MWCNTs/GCE. This trend in the electrochemical current response of the hybrid-modified electrodes follows the direct conductivity values obtained by 4PP, confirming that improved redox performance originates from enhanced charge transport through the MWCNT network. The shifts in peak potentials for both hybrids modified electrodes compared to MWCNTs/GCE can be attributed to the interaction between soda lignin and MWCNTs, as further supported by complementary characterization techniques.

Determination of Electro-Active Surface Area

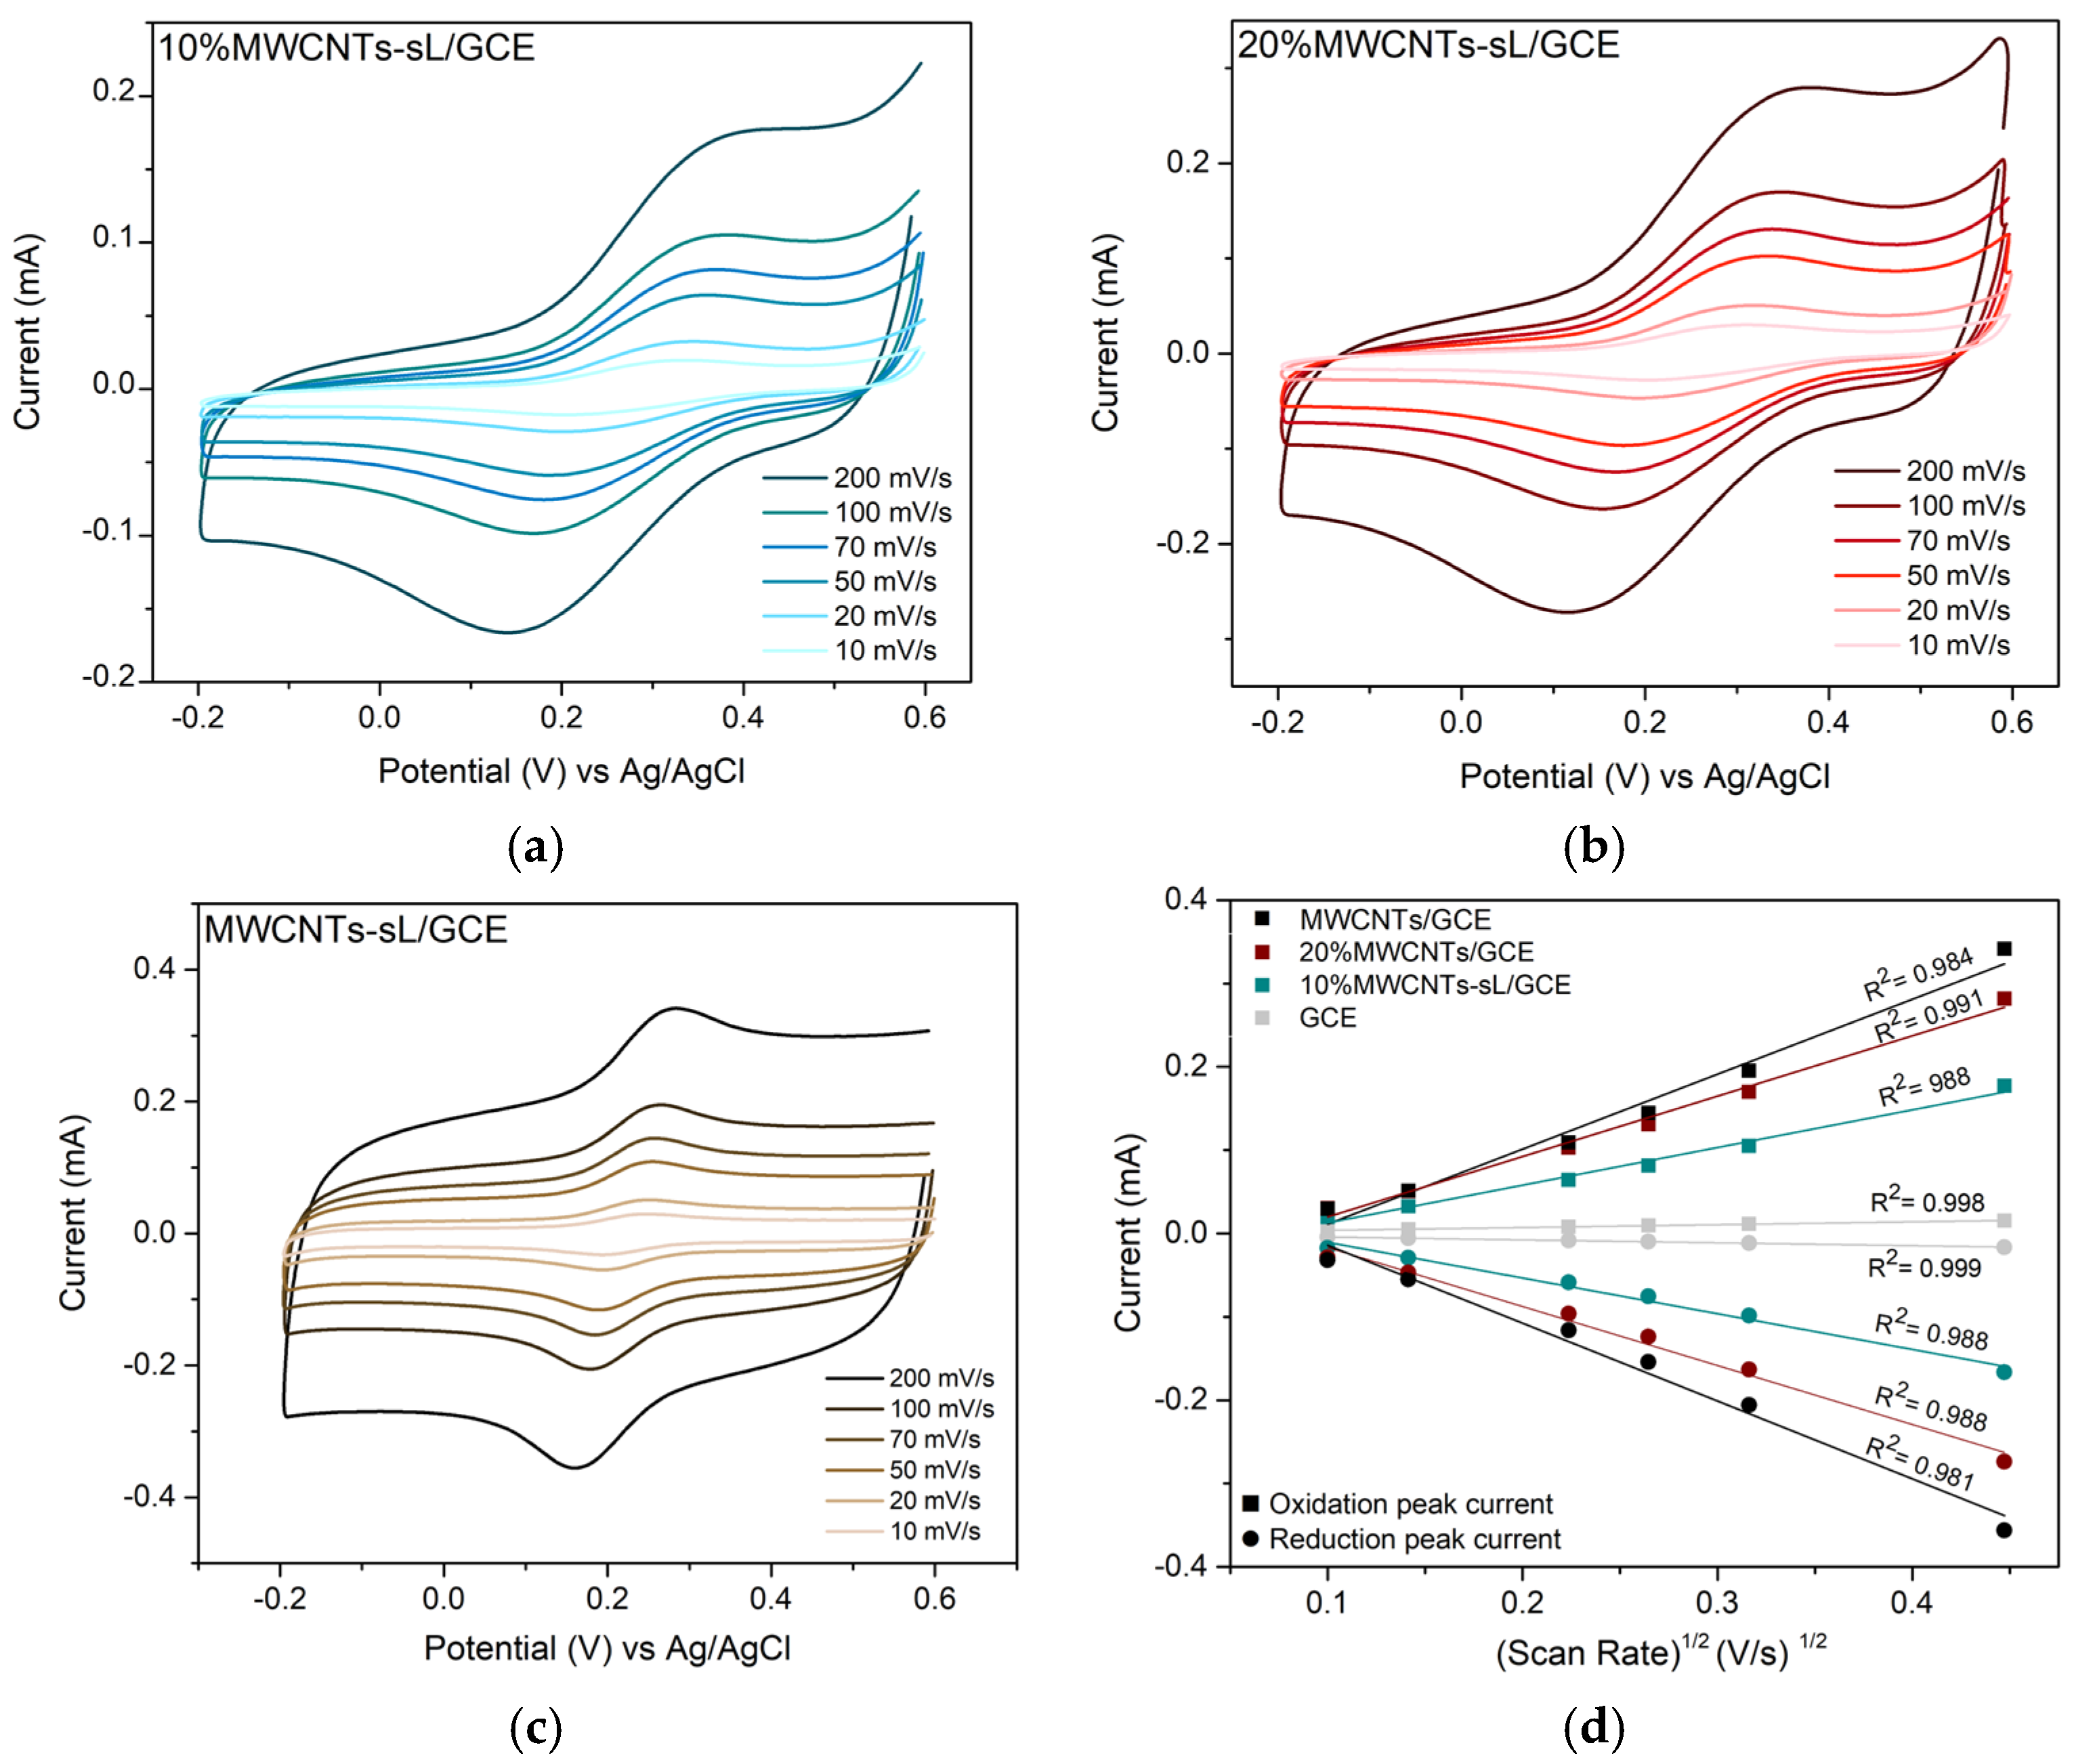
The electrochemical properties of bare GCE, MWCNTs/GCE, 10% MWCNTs–sL/GCE and 20% MWCNTs–sL/GCE were further investigated through evaluation of their electroactive surface areas. This was achieved via cyclic voltammetry conducted under identical supporting electrolyte conditions. Measurements were conducted at various scan rates (200, 100, 70, 50, 20, and 10 mV/s), as illustrated in Figure 12a–c and Figure S5a for the bare GCE. The peak currents (Ipa and Ipc) were plotted against the square root of scan rate (v½) (Figure 12d and Figure S5b) and the average slope of the resulting Ipa and Ipc lines was used to calculate the EASA of each electrode (Table 4) based on the Randles–Ševčík Equation (5).
According to the equation, the electroactive surface areas of 10% MWCNTs–sL/GCE, 20% MWCNTs–sL/GCE, and MWCNTs/GCE were found to be 0.6418 cm2, 1.0442 cm2, and 1.3364 cm2, respectively, which were 13, 21, and 27 times higher than that of bare GCE (0.0500 cm2). The increase in EASA, attributed to higher MWCNTs loading in the hybrid material, reflects faster electron transfer kinetics at the electrode/electrolyte interface and is owed to the resulting electrical conductivity of the hybrid, due to the soda lignin matrix embedding the MWCNTs.

4. Conclusions

In this study, sustainable lignin–MWCNT hybrid materials for conductive and electrochemical applications, using a simple, water-based ultrasonication process, were successfully developed and characterized. This environmentally benign synthesis route avoided the use of organic solvents and hazardous reagents in accordance with green chemistry principles. Soda lignin served not only as a biobased matrix but also as an efficient natural dispersant for MWCNTs through π–π interactions and hydrogen bonding. This dual functionality enabled homogeneous dispersion of MWCNTs in water, as evidenced by the significant reduction in HDD and stable ZP values over extended storage, confirming long-term colloidal stability without the need for synthetic surfactants. SEM and TEM imaging confirmed the formation of dense conductive networks, while Raman spectroscopy indicated the improved structural order of MWCNTs upon hybrid formation. These findings indicate an interfacial compatibility between lignin and MWCNTs, which plays a decisive role in promoting effective charge transport pathways. Despite containing up to 90 wt% of insulating lignin, the hybrids exhibited adequate electrical performance. BDS analysis revealed conductivities up to 6 × 10⁻² S/cm, while direct 4PP measurements showed even higher values of ~2 S/cm for 10 wt% MWCNTs and ~5 S/cm for 20 wt%, confirming the formation of efficient percolated MWCNT networks. Such values shows that lignin effectively contributes to network formation in combination with MWCNTs, rather than acting as a passive insulator. Electrochemical characterization further demonstrated the high functional performance of the hybrids. The modified GCEs exhibited substantially increased current responses, improved reversibility, and significantly enhanced electron transfer kinetics compared to bare or lignin-modified electrodes. The electroactive surface area increased up to 21 times relative to the unmodified GCE, underscoring the hybrids’ potential as efficient electrochemical interfaces. This performance is attributed to the synergistic effect between the conductive MWCNT network and the aromatic lignin structure, which facilitates faster electron transfer kinetics at the electrode–electrolyte interface.
Overall, this work showed that the combination of renewable lignin and conductive MWCNTs provides an effective strategy for producing cost-effective, scalable, and environmentally responsible materials for green electronics, sensors, and energy-related applications. The approach of replacing synthetic fossil-based surfactants and polymeric matrices with a fully biobased component offers a practical pathway toward the sustainable production of functional conductive materials that align with the circular economy and eco-design principles.

Supplementary Materials

The following supporting information can be downloaded at https://www.mdpi.com/article/10.3390/electronics14224539/s1, Figure S1: Stability test of 20% MWCNTs–sL hybrid suspended in water over a 10-day period; Figure S2: SEM images of the two hybrids: 10% MWCNTs–soda lignin (a & b) and 20% MWCNTs–soda lignin (c & d) hybrids; Figure S3: Raman spectra of 110D electrode with soda Lignin; Figure S4: Cyclic voltametric curves of bare GCE, MWCNTs/GCE, sL/GCE, 10% MWCNTs–sL/GCE and 20% MWCNTs–sL/GCE hybrids, recorded in 1mM K3[Fe(CN)6] in 0.1 M KCl aqueous supporting electrolyte, at a scan rate of 100 mV/s and 20 mV/s: (a) & (b) sL/GCE and bare GCE at an expanded current scale and (c) & (d) all electrodes plotted together for comparison; Figure S5: Cyclic voltametric curves of Bare GCE recorded in 1mM K3[Fe(CN)6] in 0.1 M KCl aqueous supporting electrolyte, at a scan rate of 200 mV/s, 100 mV/s, 70 mV/s, 50 mV/s, 20 mV/s and 10 mV/s (a). Linear fit of Ipa and Ipc vs. scan rate 1/2 for bare electrode to estimate EASA (b).

Author Contributions

Conceptualization, A.Z.-K., I.D. and A.G.; methodology, A.Z.-K., I.D., A.G., S.P.M. and S.K.; validation, A.Z.-K., I.D., A.G., S.P.M. and S.K.; formal analysis, S.P.M., S.K., K.B. and A.G.; investigation, S.P.M., S.K., K.B. and M.K.; resources, A.Z.-K. and I.D.; data curation, S.P.M., S.K., K.B. and M.K.; writing—original draft preparation, S.P.M., S.K. and A.G.; writing—review and editing, all authors; supervision, A.Z.-K., I.D. and A.G.; funding acquisition, A.Z.-K. All authors have read and agreed to the published version of the manuscript.

Funding

This research was funded by the European Community’s Horizon Europe Framework Program (grant number: 101070556; project: Sustain-a-Print, Sustainable materials and process for green printed electronics; https://www.sustainaprint.eu/, accessed on 15 October 2025).

Data Availability Statement

All the data of this study are included in the manuscript and Supplementary Material.

Acknowledgments

The authors would like to express their gratitude to Panagiotis Klonos and Apostolos Kyritsis, Department of Physics, National Technical University of Athens (NTUA), for the BDS analysis; Petros Tsakiridis, School of Mining and Metallurgical Engineering, National Technical University of Athens (NTUA), for TEM observations; María Begoña González García and Daniel Izquierdo Bote, Metrohm DropSens, S.L., for Raman analysis; and Grigoris Kaltsas, Department of Electrical and Electronics Engineering—Head of the microSENSES Lab, University of West Attica, for 4PP measurements.

Conflicts of Interest

Several authors (S.P.M., S.K., A.G., K.B., M.K., A.Z.-K.) are employees of Creative Nano PC, and one author (I.D.) is an employee of AXIA Innovation GmbH. The companies had no commercial or financial interest in the outcomes of this research, which was conducted within the framework of the EU-funded project Sustain-a-Print (grant number: 101070556). No other conflicts of interest are declared.

Abbreviations

The following abbreviations are used in this manuscript:
BDSBroadband dielectric spectroscopy
CNTsCarbon nanotubes
CTABCetrimonium bromide
CGAChlorogenic acid
CECounter electrode
DIDeionized
DLSDynamic light scattering
DMFDimethylformamide
DMSODimethylsulfoxide
EASAElectroactive surface area
EUGEucommia ulmoides gum
GCEGlassy carbon electrode
HDDHydrodynamic diameter
I-VCurrent–voltage
MTMSMethyl trimethoxysilane
MWCNTsMulti-walled carbon nanotubes
PANPolyacrylonitrile
PDMSPolydimethylsiloxane
PLAPolylactic acid
PP-g-MAPolypropylene-grafted-maleic anhydride
REReference electrode
RsSheet resistance
SDSSodium dodecyl sulfate
SEMScanning electron microscopy
SHEStandard hydrogen electrode
sLSoda lignin
TEMTransmission electron microscopy
Triton X-100Octyl phenol ethoxylate
USUltrasonication
WEWorking electrode
ZPZeta potential
4PPFour-point probe

References

  1. Su, Z.; Yang, Y.; Huang, Q.; Chen, R.; Ge, W.; Fang, Z.; Huang, F.; Wang, X. Designed Biomass Materials for “Green” Electronics: A Review of Materials, Fabrications, Devices, and Perspectives. Prog. Mater. Sci. 2022, 125, 100917. [Google Scholar] [CrossRef]
  2. Jain, M.; Kumar, D.; Chaudhary, J.; Kumar, S.; Sharma, S.; Singh Verma, A. Review on E-Waste Management and Its Impact on the Environment and Society. Waste Manag. Bull. 2023, 1, 34–44. [Google Scholar] [CrossRef]
  3. Georgs, V.; Piili, H.; Gustafsson, J.; Xu, C. A Critical Review on Lignin Structure, Chemistry, and Modification towards Utilisation in Additive Manufacturing of Lignin-Based Composites. Ind. Crops Prod. 2025, 233, 121416. [Google Scholar] [CrossRef]
  4. Ali, S.; Rani, A.; Dar, M.; Qaisrani, M.; Noman, M.; Yoganathan, K.; Asad, M.; Berhanu, A.; Barwant, M.; Zhu, D. Recent Advances in Characterization and Valorization of Lignin and Its Value-Added Products: Challenges and Future Perspectives. Biomass 2024, 4, 947–977. [Google Scholar] [CrossRef]
  5. Libretti, C.; Santos Correa, L.; Meier, M.A.R. From Waste to Resource: Advancements in Sustainable Lignin Modification. Green Chem. 2024, 26, 4358–4386. [Google Scholar] [CrossRef]
  6. Ruwoldt, J.; Blindheim, F.H.; Chinga-Carrasco, G. Functional Surfaces, Films, and Coatings with Lignin—A Critical Review. RSC Adv. 2023, 13, 12529–12553. [Google Scholar] [CrossRef]
  7. Zhang, H.; Li, H.; Wang, W.; Li, P.; Liu, S.; Yang, M.; He, C. Biomass Lignin as Dispersion to Substantially Enhance Carbon Nanotubes Thermoelectric Converter for Energy Harvesting. Carbon 2024, 229, 119489. [Google Scholar] [CrossRef]
  8. Beg, S.; Rahman, M.; Jain, A.; Saini, S.; Hasnain, M.S.; Swain, S.; Imam, S.; Kazmi, I.; Akhter, S. Emergence in the Functionalized Carbon Nanotubes as Smart Nanocarriers for Drug Delivery Applications. In Fullerens, Graphenes and Nanotubes; Elsevier: Amsterdam, The Netherlands, 2018; pp. 105–133. ISBN 978-0-12-813691-1. [Google Scholar]
  9. Manzetti, S.; Andersen, O. Carbon Nanotubes in Electronics: Background and Discussion for Waste-Handling Strategies. Challenges 2013, 4, 75–85. [Google Scholar] [CrossRef]
  10. Tu, C.; Luo, W.; Peng, Y.; Yu, P.; Shi, C.; Wu, Z.; Shao, L.; Zhan, P. Preparation of Lignin-Based Carbon Nanotubes Using Micelles as Soft Template. Ind. Crops Prod. 2023, 191, 116009. [Google Scholar] [CrossRef]
  11. Zhou, M.; Wang, Z.; Wang, X. Carbon Nanotubes for Sensing Applications. In Industrial Applications of Carbon Nanotubes; Elsevier: Amsterdam, The Netherlands, 2017; pp. 129–150. ISBN 978-0-323-41481-4. [Google Scholar]
  12. Khan, F.S.A.; Mubarak, N.M.; Khalid, M.; Walvekar, R.; Abdullah, E.C.; Ahmad, A.; Karri, R.R.; Pakalapati, H. Functionalized Multi-Walled Carbon Nanotubes and Hydroxyapatite Nanorods Reinforced with Polypropylene for Biomedical Application. Sci. Rep. 2021, 11, 843. [Google Scholar] [CrossRef] [PubMed]
  13. Yoon, H.; Thompson, R.; Hwang, B. Dispersibility Study of Carbon Nanotubes Using Multiple Light Scattering: A Mini-Review. Colloid Interface Sci. Commun. 2023, 52, 100686. [Google Scholar] [CrossRef]
  14. Li, S.; Yan, J.; Zhang, Y.; Qin, Y.; Zhang, Y.; Du, S. Comparative Investigation of Carbon Nanotubes Dispersion Using Surfactants: A Molecular Dynamics Simulation and Experimental Study. J. Mol. Liq. 2023, 377, 121569. [Google Scholar] [CrossRef]
  15. Choi, Y.J.; Nacpil, E.J.C.; Han, J.; Zhu, C.; Kim, I.S.; Jeon, I. Recent Advances in Dispersant Technology for Carbon Nanotubes toward Energy Device Applications. Adv. Energy Sustain. Res. 2024, 5, 2300219. [Google Scholar] [CrossRef]
  16. Yang, H.; Neal, L.; Flores, E.E.; Adronov, A.; Kim, N.Y. Role and Impact of Surfactants in Carbon Nanotube Dispersions and Sorting. J. Surfactants Deterg. 2023, 26, 607–622. [Google Scholar] [CrossRef]
  17. Abdulhameed, A.; Halin, I.A.; Mohtar, M.N.; Hamidon, M.N. Optimization of Surfactant Concentration in Carbon Nanotube Solutions for Dielectrophoretic Ceiling Assembly and Alignment: Implications for Transparent Electronics. ACS Omega 2022, 7, 3680–3688. [Google Scholar] [CrossRef] [PubMed]
  18. Li, H.; Qiu, Y. Dispersion, Sedimentation and Aggregation of Multi-Walled Carbon Nanotubes as Affected by Single and Binary Mixed Surfactants. R. Soc. Open Sci. 2019, 6, 190241. [Google Scholar] [CrossRef]
  19. Goodman, S.M.; Ferguson, N.; Dichiara, A.B. Lignin-Assisted Double Acoustic Irradiation for Concentrated Aqueous Dispersions of Carbon Nanotubes. RSC Adv. 2017, 7, 5488–5496. [Google Scholar] [CrossRef]
  20. Rochez, O.; Zorzini, G.; Amadou, J.; Claes, M.; Richel, A. Dispersion of Multiwalled Carbon Nanotubes in Water by Lignin. J. Mater. Sci. 2013, 48, 4962–4964. [Google Scholar] [CrossRef]
  21. Teng, N.-Y.; Dallmeyer, I.; Kadla, J.F. Effect of Softwood Kraft Lignin Fractionation on the Dispersion of Multiwalled Carbon Nanotubes. Ind. Eng. Chem. Res. 2013, 52, 6311–6317. [Google Scholar] [CrossRef]
  22. Culebras, M.; Ren, G.; O’Connell, S.; Vilatela, J.J.; Collins, M.N. Lignin Doped Carbon Nanotube Yarns for Improved Thermoelectric Efficiency. Adv. Sustain. Syst. 2020, 4, 2000147. [Google Scholar] [CrossRef]
  23. Kamarudin, S.F.; Ismail, N.H.; Mariatti, M. Lignin-Assisted Carbon Nanotube Dispersion for Conductive Ink Application. In Proceedings of the 3rd International Postgraduate Conference on Materials, Minerals & Polymer (MAMIP) 2019, Penang, Malaysia, 31 October–1 November 2019; p. 020003. [Google Scholar]
  24. Wang, E.; Huang, W.; Miao, Y.; Jia, L.; Liang, Y.; Wang, S.; Zhang, W.; Zou, L.-H.; Zhong, Y.; Huang, J. Conductive and Superhydrophobic Lignin/Carbon Nanotube Coating with Nest-like Structure for Deicing, Oil Absorption and Wearable Piezoresistive Sensor. Int. J. Biol. Macromol. 2024, 278, 134886. [Google Scholar] [CrossRef]
  25. Onfray, C.; Thiam, A. Biomass-Derived Carbon-Based Electrodes for Electrochemical Sensing: A Review. Micromachines 2023, 14, 1688. [Google Scholar] [CrossRef]
  26. Madikere Raghunatha Reddy, A.K.; Darwiche, A.; Reddy, M.V.; Zaghib, K. Review on Advancements in Carbon Nanotubes: Synthesis, Purification, and Multifaceted Applications. Batteries 2025, 11, 71. [Google Scholar] [CrossRef]
  27. Degefu, H.; Amare, M.; Tessema, M.; Admassie, S. Lignin Modified Glassy Carbon Electrode for the Electrochemical Determination of Histamine in Human Urine and Wine Samples. Electrochim. Acta 2014, 121, 307–314. [Google Scholar] [CrossRef]
  28. Bounegru, A.V.; Bounegru, I. Chitosan-Based Electrochemical Sensors for Pharmaceuticals and Clinical Applications. Polymers 2023, 15, 3539. [Google Scholar] [CrossRef]
  29. Shalauddin, M.; Akhter, S.; Basirun, W.J.; Bagheri, S.; Anuar, N.S.; Johan, M.R. Hybrid Nanocellulose/f-MWCNTs Nanocomposite for the Electrochemical Sensing of Diclofenac Sodium in Pharmaceutical Drugs and Biological Fluids. Electrochim. Acta 2019, 304, 323–333. [Google Scholar] [CrossRef]
  30. Liu, T.; Sun, S.; Song, W.; Sun, X.; Niu, Q.; Liu, H.; Ohsaka, T.; Wu, J. A Lightweight and Binder-Free Electrode Enabled by Lignin Fibers@carbon-Nanotubes and Graphene for Ultrastable Lithium–Sulfur Batteries. J. Mater. Chem. A 2018, 6, 23486–23494. [Google Scholar] [CrossRef]
  31. Won, K.; Kim, Y.-H.; An, S.; Lee, H.J.; Park, S.; Choi, Y.-K.; Kim, J.H.; Hwang, H.-I.; Kim, H.J.; Kim, H.; et al. Glucose Oxidase/Cellulose–Carbon Nanotube Composite Paper as a Biocompatible Bioelectrode for Biofuel Cells. Appl. Biochem. Biotechnol. 2013, 171, 1194–1202. [Google Scholar] [CrossRef] [PubMed]
  32. Sun, Y.; Yang, L.; Lu, X.; He, C. Biodegradable and Renewable Poly(Lactide)–Lignin Composites: Synthesis, Interface and Toughening Mechanism. J. Mater. Chem. A 2015, 3, 3699–3709. [Google Scholar] [CrossRef]
  33. Chokkareddy, R.; Redhi, G.G.; Karthick, T. A Lignin Polymer Nanocomposite Based Electrochemical Sensor for the Sensitive Detection of Chlorogenic Acid in Coffee Samples. Heliyon 2019, 5, e01457. [Google Scholar] [CrossRef]
  34. Klonos, P.A.; Ioannidis, R.O.; Pitsavas, A.; Bikiaris, N.D.; Makri, S.P.; Koutsourea, S.; Grigoropoulos, A.; Deligkiozi, I.; Zoikis-Karathanasis, A.; Kyritsis, A.; et al. Segmental Mobility, Interfacial Polymer, Crystallization and Conductivity Study in Polylactides Filled with Hybrid Lignin-CNT Particles. Nanomaterials 2025, 15, 660. [Google Scholar] [CrossRef]
  35. Asl, A.Z.; Rafati, A.A.; Khazalpour, S. Electrocatalytic Behavior of TiO2 /MWCNTs Nanocomposite Decorated on Glassy Carbon Electrode for Individual and Simultaneous Voltammetric Determination of Adenine and Guanine in Real Samples. J. Electrochem. Soc. 2022, 169, 047516. [Google Scholar] [CrossRef]
  36. Zhang, M.; Lu, Z.; Zhao, J.; Hasebe, Y.; Zhang, Z.; Wang, Y. Simultaneous Electrochemical Determination of Hydroquinone and Catechol by Lignocellulose Biopolymers Derived Porous Carbon. ChemistrySelect 2023, 8, e202303610. [Google Scholar] [CrossRef]
  37. Arrigo, R.; Teresi, R.; Gambarotti, C.; Parisi, F.; Lazzara, G.; Dintcheva, N. Sonication-Induced Modification of Carbon Nanotubes: Effect on the Rheological and Thermo-Oxidative Behaviour of Polymer-Based Nanocomposites. Materials 2018, 11, 383. [Google Scholar] [CrossRef]
  38. Rennhofer, H.; Zanghellini, B. Dispersion State and Damage of Carbon Nanotubes and Carbon Nanofibers by Ultrasonic Dispersion: A Review. Nanomaterials 2021, 11, 1469. [Google Scholar] [CrossRef] [PubMed]
  39. Price, G.J.; Nawaz, M.; Yasin, T.; Bibi, S. Sonochemical Modification of Carbon Nanotubes for Enhanced Nanocomposite Performance. Ultrason. Sonochem. 2018, 40, 123–130. [Google Scholar] [CrossRef]
  40. Badorrek, J.; Walter, M. Computational Study on Noncovalent Interactions between (n, n) Single-walled carbon nanotubes and Simple Lignin Model-compounds. J. Comput. Chem. 2022, 43, 340–348. [Google Scholar] [CrossRef] [PubMed]
  41. Łukawski, D.; Grześkowiak, W.; Lekawa-Raus, A.; Widelicka, M.; Lisiecki, F.; Dudkowiak, A. Flame Retardant Effect of Lignin/Carbon Nanotubes/Potassium Carbonate Composite Coatings on Cotton Roving. Cellulose 2020, 27, 7271–7281. [Google Scholar] [CrossRef]
  42. Ravindren, R.; Mondal, S.; Nath, K.; Das, N.C. Synergistic Effect of Double Percolated Co-supportive MWCNT-CB Conductive Network for High-performance EMI Shielding Application. Polym. Adv. Technol. 2019, 30, 1506–1517. [Google Scholar] [CrossRef]
  43. Inam, A.; Brydson, R.; Edmonds, D.V. Raman Spectroscopy Study of the Crystallinity of Graphite Formed in an Experimental Free-Machining Steel. Mater. Charact. 2020, 163, 110264. [Google Scholar] [CrossRef]
  44. Agarwal, U.P. Analysis of Cellulose and Lignocellulose Materials by Raman Spectroscopy: A Review of the Current Status. Molecules 2019, 24, 1659. [Google Scholar] [CrossRef]
  45. Datsyuk, V.; Kalyva, M.; Papagelis, K.; Parthenios, J.; Tasis, D.; Siokou, A.; Kallitsis, I.; Galiotis, C. Chemical Oxidation of Multiwalled Carbon Nanotubes. Carbon 2008, 46, 833–840. [Google Scholar] [CrossRef]
  46. Osswald, S.; Havel, M.; Gogotsi, Y. Monitoring Oxidation of Multiwalled Carbon Nanotubes by Raman Spectroscopy. J. Raman Spectrosc. 2007, 38, 728–736. [Google Scholar] [CrossRef]
  47. Monti, M.; Zaccone, M.; Frache, A.; Torre, L.; Armentano, I. Dielectric Spectroscopy of PP/MWCNT Nanocomposites: Relationship with Crystalline Structure and Injection Molding Condition. Nanomaterials 2021, 11, 550. [Google Scholar] [CrossRef] [PubMed]
  48. Iannarelli, A.; Ghaffarian Niasar, M.; Ross, R. Electrode Interface Polarization Formation in Dielectric Elastomer Actuators. Sens. Actuators A Phys. 2020, 312, 111992. [Google Scholar] [CrossRef]
  49. Jiang, M.-J.; Dang, Z.-M.; Bozlar, M.; Miomandre, F.; Bai, J. Broad-Frequency Dielectric Behaviors in Multiwalled Carbon Nanotube/Rubber Nanocomposites. J. Appl. Phys. 2009, 106, 084902. [Google Scholar] [CrossRef]
  50. Oliveira, F.M.; Ezquerra, T.A.; Denchev, Z.Z. Broadband Electrical Conductivity of Metal/Carbon Nanotubes Polyamide 6 Composites Fabricated by Reactive Encapsulation. J. Mater. Sci. 2024, 59, 1348–1363. [Google Scholar] [CrossRef]
  51. Arjmand, M.; Sundararaj, U. Broadband Dielectric Properties of Multiwalled Carbon Nanotube/Polystyrene Composites. Polym. Eng. Sci. 2015, 55, 173–179. [Google Scholar] [CrossRef]
  52. Lage-Rivera, S.; Ares-Pernas, A.; Becerra Permuy, J.C.; Gosset, A.; Abad, M.-J. Enhancement of 3D Printability by FDM and Electrical Conductivity of PLA/MWCNT Filaments Using Lignin as Bio-Dispersant. Polymers 2023, 15, 999. [Google Scholar] [CrossRef]
  53. Chinnappan, A.; Lee, J.K.Y.; Jayathilaka, W.A.D.M.; Ramakrishna, S. Fabrication of MWCNT/Cu Nanofibers via Electrospinning Method and Analysis of Their Electrical Conductivity by Four-Probe Method. Int. J. Hydrogen Energy 2018, 43, 721–729. [Google Scholar] [CrossRef]
  54. Hoang, A.S.; Nguyen, H.N.; Bui, H.T.; Tran, A.T.; Duong, V.A.; Nguyen, V.B. Carbon Nanotubes Materials and Their Application to Guarantee Safety from Exposure to Electromagnetic Fields. Adv. Nat. Sci Nanosci. Nanotechnol. 2013, 4, 025012. [Google Scholar] [CrossRef]
  55. Kang, H.; Luo, S.; Du, H.; Han, L.; Li, D.; Li, L.; Fang, Q. Bio-Based Eucommia Ulmoides Gum Composites with High Electromagnetic Interference Shielding Performance. Polymers 2022, 14, 970. [Google Scholar] [CrossRef]
  56. Łukawski, D.; Martin, A.; Dudkowiak, A. Cost-Effective, Electroconductive Sodium Lignosulfonate/Carbon Nanotube Composite Coating for Paper Electronics. Diam. Relat. Mater. 2023, 139, 110372. [Google Scholar]
  57. Madinehei, M.; Kuester, S.; Kaydanova, T.; Moghimian, N.; David, É. Influence of Graphene Nanoplatelet Lateral Size on the Electrical Conductivity and Electromagnetic Interference Shielding Performance of Polyester Nanocomposites. Polymers 2021, 13, 2567. [Google Scholar] [CrossRef] [PubMed]
  58. Koç, Y.; Morali, U.; Erol, S.; Avci, H. Investigation of Electrochemical Behavior of Potassium Ferricyanide/Ferrocyanide Redox Probes on Screen Printed Carbon Electrode through Cyclic Voltammetry and Electrochemical Impedance Spectroscopy. Turk. J. Chem. 2021, 45, 1895–1915. [Google Scholar] [CrossRef] [PubMed]
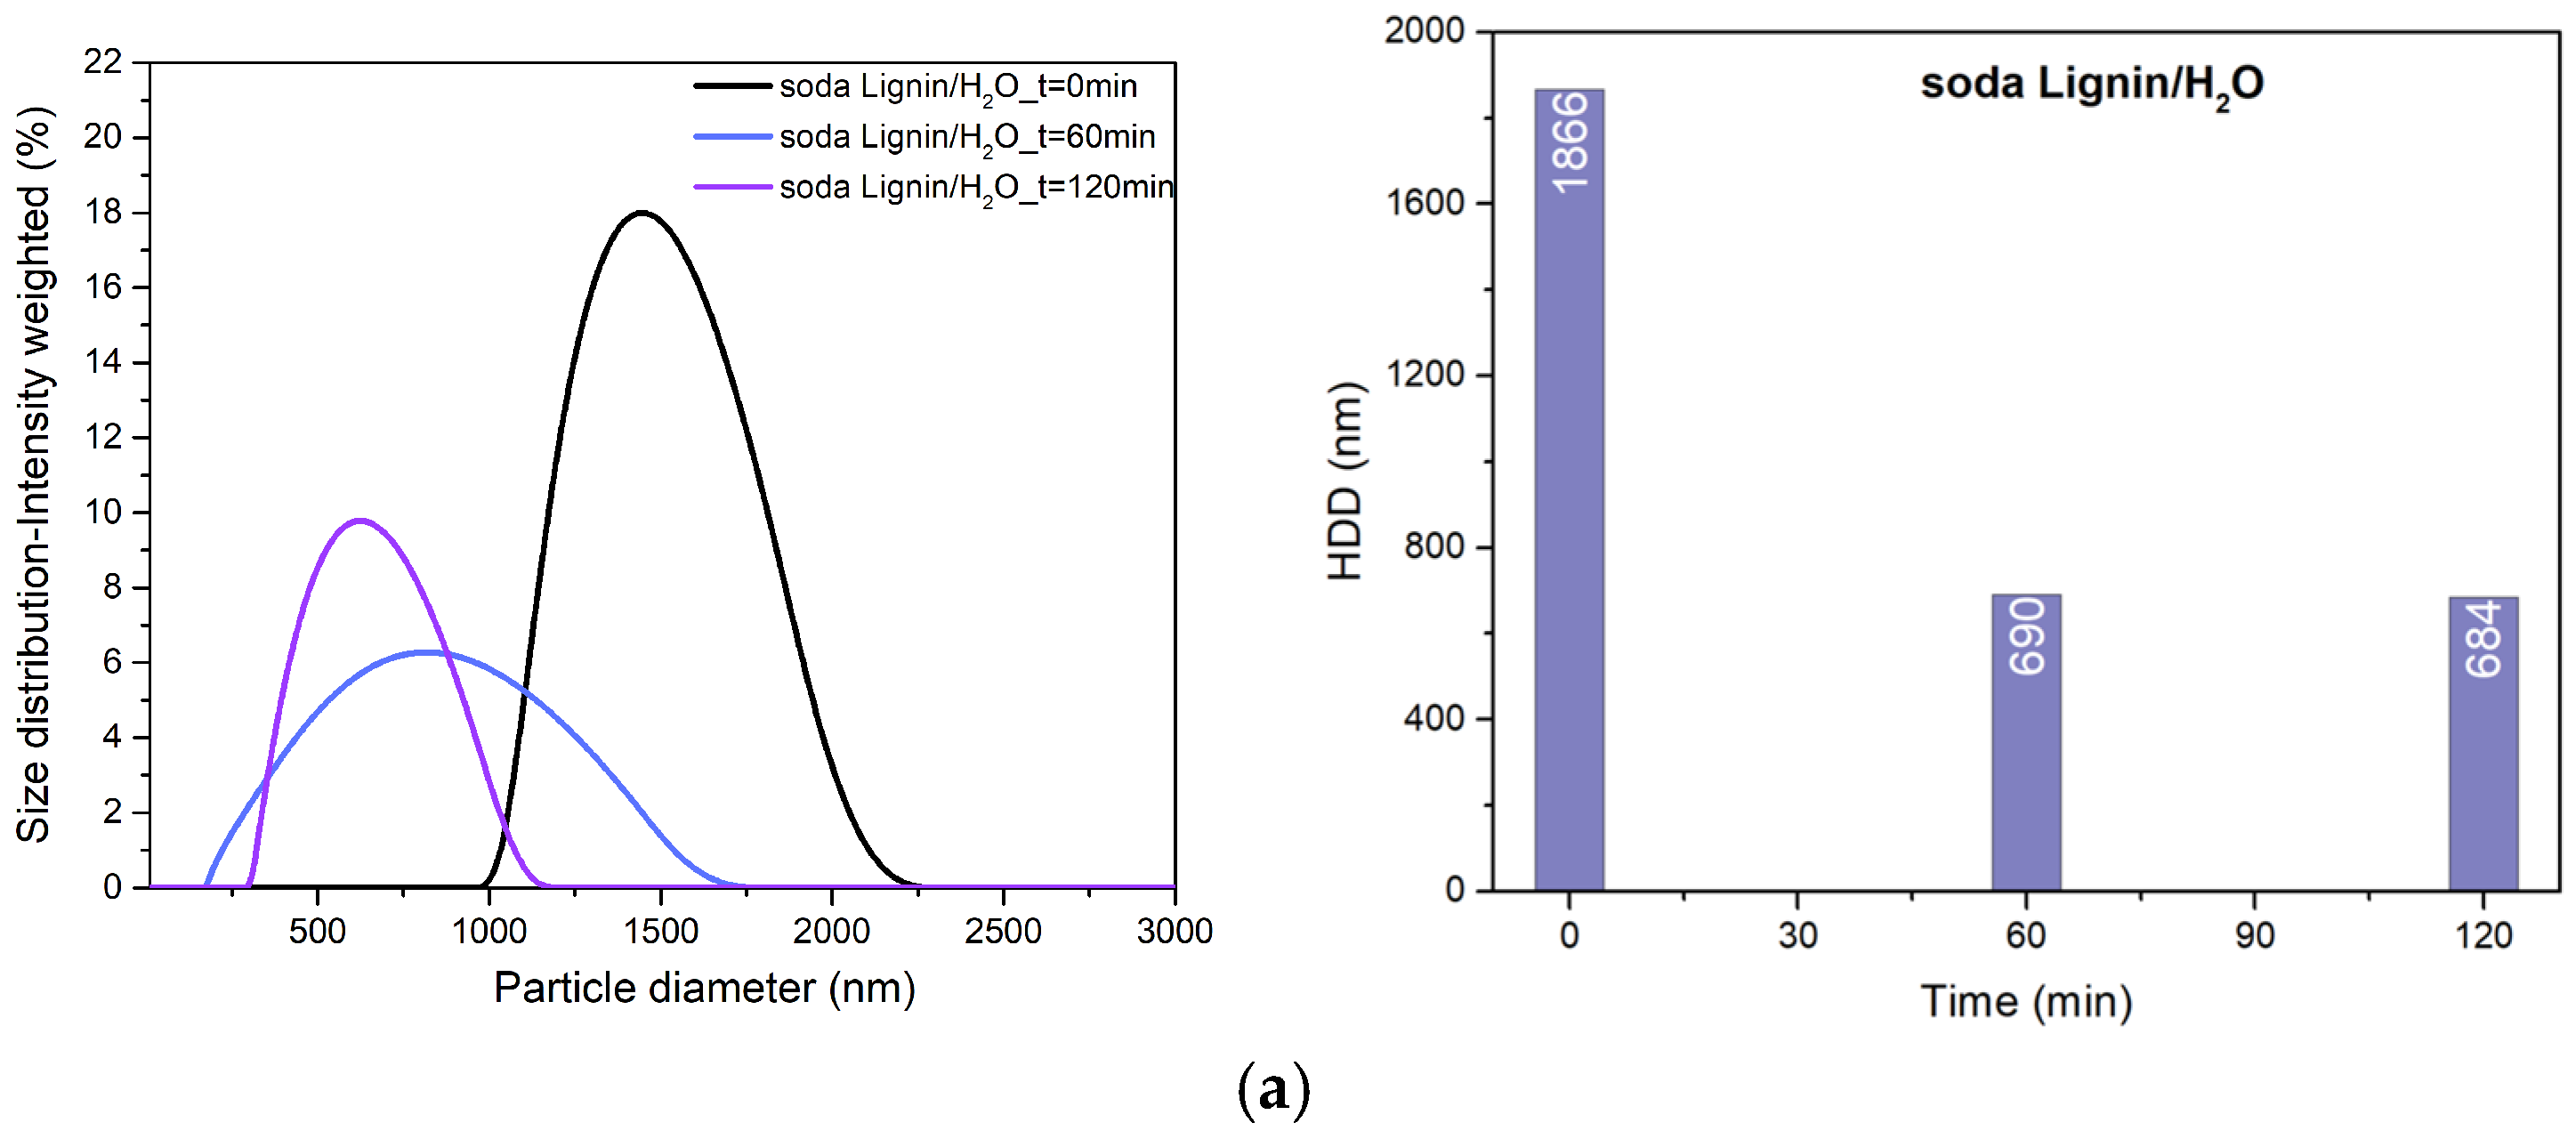
Figure 1. Particle size distribution curves of (a) soda lignin in water during 120 min of US treatment and the corresponding HDD values vs. US time, (b) MWCNTs in water during 120 min of US treatment and the corresponding HDD vs. US time.
Electronics 14 04539 g001aElectronics 14 04539 g001b
Figure 2. Particle size distribution curves of 10% and 20% MWCNTs–sL hybrids during 120 min of US treatment.
Electronics 14 04539 g002
Figure 3. Stability test of 10% MWCNTs–sL hybrid suspended in water over a 90-day period.
Electronics 14 04539 g003
Figure 4. HDD and ZP values of 10% MWCNTs–sL during stability tests over 90-day period.
Electronics 14 04539 g004
Figure 5. SEM images of starting materials: soda lignin (a,b) and MWCNTs (c,d).
Electronics 14 04539 g005
Figure 6. SEM images of the two hybrids: 10% MWCNTs–soda lignin (a,b) and 20% MWCNTs–soda lignin (c,d) hybrids.
Electronics 14 04539 g006
Figure 7. TEM images of (a) MWCNTs, (b,c) 10% MWCNTs–sL hybrid, and (d,e) 20% MWCNTs–sL hybrid.
Electronics 14 04539 g007
Figure 8. Raman spectra of 110D and 110D electrode with MWCNTs and 10% and 20% MWCNTs–sL hybrids. Vertical lines indicate the positions of the characteristic D and G Raman bands.
Electronics 14 04539 g008
Figure 9. Electrical conductivity results of MWCNTs, soda lignin, and 10% and 20% MWCNTs–sL hybrids.
Electronics 14 04539 g009
Figure 10. I-V measurements of 10% MWCNTs–sL and 20% MWCNTs–sL.
Electronics 14 04539 g010
Figure 11. Cyclic voltametric curves of bare GCE, sL/GCE, MWCNTs/GCE, 10% MWCNTs–sL/GCE and 20% MWCNTs–sL/GCE hybrids recorded in 1 mM K3[Fe(CN)]6] in 0.1 M KCl aqueous supporting electrolyte, at a scan rate of 50 mV/s: (a) sL/GCE and bare GCE at an expanded current scale and (b) all electrodes plotted together for comparison.
Electronics 14 04539 g011
Figure 12. Cyclic voltametric curves of 10% MWCNTs–sL/GCE hybrid and 20% MWCNTs–sL/GCE hybrid and MWCNTs/GCE (ac) recorded in 1 mM K3[Fe(CN)6] in 0.1 M KCl aqueous supporting electrolyte, at a scan rate of 200 mV/s, 100 mV/s, 70 mV/s, 50 mV/s, 20 mV/s, and 10 mV/s. Linear fit of Ipa and Ipc vs. scan rate 1/2 for bare and modified electrodes to estimate EASA (d).
Electronics 14 04539 g012
Table 1. HDD and ZP values of 10% and 20% MWCNTs–sL hybrids during 120 min of US treatment.
SampleUS Time (min)HDD (nm)ZP (mV)
10% MWCNTs–sL60645−23
10% MWCNTs–sL120384−25
20% MWCNTs–sL60661−20
20% MWCNTs–sL120470−21
Table 2. IG/ID intensity ratios for the 110D and 110D electrode with sL, MWCNTs, and 10% and 20% MWCNTs–sL hybrids.
Sample Name IG/ID
110D1.95
soda Lignin1.44
MWCNTs0.79
10% MWCNTs–sL1.21
20% MWCNTs–sL1.09
Table 3. The final sheet resistance values, incorporating both geometric and thickness corrections and the estimated electrical conductivity values.
Sample NameMeasured Resistance (Ω)Initial Sheet Resistance (Ω/sq)Geometric Corrected Sheet Resistance (Ω/sq)Final Sheet Resistance (Ω/sq)Estimated
Conductivity (S/cm)
10% MWCNTs–sL1.3125.9465.1555.1021.960
20% MWCNTs–sL0.5112.3162.001.9875.033
Table 4. Electroactive surface area (cm2) of bare and modified electrodes.
ElectrodeSlopeElectroactive Area (cm2)
Bare GCE3.43 × 10−50.0500
10% MWCNTs–sL/GCE4.40 × 10−40.6417
20% MWCNTs–sL/GCE7.16 × 10−41.0442
MWCNTs/GCE9.17 × 10−41.3364
Disclaimer/Publisher’s Note: The statements, opinions and data contained in all publications are solely those of the individual author(s) and contributor(s) and not of MDPI and/or the editor(s). MDPI and/or the editor(s) disclaim responsibility for any injury to people or property resulting from any ideas, methods, instructions or products referred to in the content.