Article

From Forecasting to Foresight: Building an Autonomous O&M Brain for the New Power System Based on a Cognitive Digital Twin

1
Shenzhen Power Supply Bureau Co., Ltd., Shenzhen 518046, China
2
School of Mechano-Electronic Engineering, Xidian University, Xi’an 710126, China
3
School of Electronic Engineering, Xidian University, Xi’an 710126, China
4
School of Economics and Management, Xidian University, Xi’an 710126, China
5
School of Cyber Engineering, Xidian University, Xi’an 710126, China
*
Author to whom correspondence should be addressed.
Electronics 2025, 14(22), 4537; https://doi.org/10.3390/electronics14224537
Submission received: 31 October 2025 / Revised: 16 November 2025 / Accepted: 17 November 2025 / Published: 20 November 2025

Abstract

Despite notable advances in load forecasting and fault detection, current power system operation and maintenance (O&M) technologies remain fragmented into independent and primarily reactive modules. Load forecasting estimates future demand, whereas fault detection identifies whether abnormal conditions exist in the present state. This paper proposes a unified and proactive Cognitive Digital Twin (CDT) system. Unlike traditional data-driven approaches, the CDT integrates Large Language Models (LLMs) and Knowledge Graphs (KGs) as cognitive cores to enable deeper reasoning and context-aware decision-making. The CDT system not only mirrors the physical grid but also acts as an intelligent O&M engine capable of understanding, reasoning, predicting, and self-diagnosing. The core innovation lies in prediction-based anomaly detection. The system first estimates the expected healthy state of the grid at future time steps and then compares real-time monitoring data against these predictions to identify incipient anomalies. This enables genuine foresight rather than simple reactive detection. By orchestrating advanced analytical modules, including CNN–LSTM hybrid models and optimization algorithms, the CDT supports autonomous O&M operations with transparent and explainable decision-making. These capabilities enhance grid resilience and improve the system’s capacity for self-healing.

1. Introduction

The modern power system is undergoing an unprecedented transformation driven by renewable energy integration, distributed generation, and smart grid technologies. This evolution introduces new operational complexities that challenge traditional O&M paradigms. Existing management approaches remain fragmented: load forecasting and fault detection operate as separate modules with limited interaction. Forecasting methods estimate future demand, whereas fault detection systems determine whether the current state is abnormal. Such reactive and compartmentalized workflows cannot meet the holistic intelligence requirements of next-generation power systems [1].
These limitations become particularly evident during extreme weather events, aging infrastructure, and grid instability. Traditional O&M methods often rely on detailed physical models; however, constructing accurate models has become increasingly difficult due to the volatility of renewable energy, the nonlinear dynamics of power electronics, and the unpredictability of human operations. Data-driven approaches, while effective for tasks such as short-term load forecasting, lack the cognitive capabilities required for autonomous decision-making and proactive system management. The absence of a unified intelligence framework leads to delayed responses, suboptimal resource allocation, and elevated operational risks [2,3].
Recent advances in artificial intelligence, particularly in LLMs [4,5,6] and KGs [7,8], offer new possibilities for transforming power system O&M. These technologies enable systems capable of understanding, reasoning, and autonomous decision-making. When enhanced with such cognitive capabilities, Digital Twin (DT) technology can evolve from a passive digital replica into an intelligent decision-support and O&M platform.
This paper proposes a paradigm shift from traditional “forecasting” to true “foresight” through a CDT. Conventional proactive maintenance strategies—such as physics-based simulations—struggle with modern grid complexity because they rely on fixed assumptions and lack contextual awareness. In contrast, our CDT integrates LLMs and KGs to form an intelligent cognitive core. By incorporating deep contextual information from both structured and unstructured sources, the CDT generates a predictive baseline that is more accurate and adaptive than models relying solely on historical data. This predictive baseline underpins our prediction-based divergence method for anomaly detection. The CDT not only forecasts the optimal grid state but also interprets deviations through knowledge-grounded reasoning. By continuously comparing real-time measurements with the predicted healthy trajectory, it detects subtle deviations long before they evolve into faults, enabling proactive and preventive fault management [9,10,11].

2. Related Work

The paradigm of a CDT for autonomous power system O&M resides at the intersection of several rapidly advancing research domains. To establish the novelty and significance of our proposed framework, this section provides a comprehensive review of the state-of-the-art. We structure our analysis into five key areas: (1) the broad evolution of DTs across critical infrastructure sectors; (2) the specific emergence of the “cognitive” layer as a defining feature of next-generation twins; (3) the application of DTs as a foundational enabler for autonomous O&M; (4) the current state of advanced techniques in the distinct but related fields of power system forecasting and fault detection; and (5) a concluding synthesis that identifies the crucial research gap our “foresight” paradigm aims to fill.

2.1. The Evolution of Digital Twins in Critical Infrastructure

The concept of the DT has matured into a foundational technology for Industry 4.0, serving as a high-fidelity, virtual counterpart to a physical system. A comprehensive survey by Mihai et al. highlights that a DT is a “system-of-systems” that far transcends traditional simulation by integrating multi-physics models, real-time sensor data, and historical records to mirror the physical asset’s state and behavior throughout its lifecycle [12].
The application of DTs has rapidly expanded into various critical infrastructure sectors. In civil engineering, the DT is seen as the mature evolution of Building Information Modeling (BIM), where the fusion of static BIM data with dynamic IoT sensor feeds enables enhanced collaboration, operational efficiency, and infrastructure resilience [13]. In precision agriculture, DTs are being developed to create 1:1 virtual models of farms, integrating sensor data to enable real-time monitoring and optimized control of crop growth, thereby achieving data-driven, high-efficiency operations [14,15]. Similarly, in the building sector, DT platforms are used to monitor and optimize energy performance and thermal comfort, demonstrating their potential as decision-support tools for enhancing energy efficiency and resilience against extreme weather events [16].
Within the energy sector, DT technology has been specifically applied to smart grid planning and management, where twins built upon GIS, BIM, and IoT data are used for planning simulation, construction visualization, and asset health management [17]. In the high-stakes environment of nuclear power, DT-based operation support systems integrate design and sensor data to enable comprehensive plant health monitoring, predictive maintenance, and fault localization [18]. These applications, while powerful, primarily leverage the DT as a sophisticated digital mirror—a platform for visualizing and analyzing the current state. Our work builds upon this foundation but argues for a fundamental shift from a reflective mirror to a proactive, intelligent brain.

2.2. The Emergence of Cognitive Digital Twins

The limitations of purely data-driven DTs have spurred the development of the CDT, which enriches the traditional DT with a “cognitive” layer, incorporating AI, semantic technologies, and knowledge representation to imbue the twin with human-like reasoning and decision-making capabilities [19]. This evolution is critical for managing systemic complexity.
Several works have begun to formalize the CDT vision. Zheng et al. provide a foundational review, discussing the challenges in data integration and semantic interoperability while proposing a reference architecture to guide development [20]. Architecturally, a three-tiered “physical–digital–cognitive” structure is common. For instance, a surrogate model-based CDT for remote maintenance of fusion reactors explicitly defines a cognitive layer that integrates kGs and reinforcement learning to perform a full cognitive loop: perceive, reason, decide, and act [21]. This cognitive capacity is often built on semantic frameworks, such as quality-oriented knowledge modeling methods that use ontologies to create more accurate and intelligent manufacturing twins [22].
The CDT concept is being explored across diverse applications. In human–robot collaboration, a prototype named HRC-CogiDT demonstrates rapid scene understanding and high-level decision-making [23]. In energy ecosystems, the notion of a cognitive household digital twin (C-HDT) is proposed, where software agents make autonomous decisions to promote sustainable energy consumption [24]. Perhaps most analogous to our work is a CDT-based driving assistance system that predicts a driver’s ideal strategy and issues warnings upon significant deviation [25]. This use of a predicted “optimal” state as a dynamic baseline is a key inspiration for our “foresight” framework. The ongoing research into advanced concepts like self-awareness in CDTs further confirms that infusing twins with cognition is a primary trajectory for the field [26].

2.3. Digital Twins as Enablers for Autonomous O&M

A primary driver for developing sophisticated DTs is the goal of achieving autonomous O&M. Autonomy in this context refers to a system’s ability to self-monitor, self-diagnose, and self-heal. Research on DT-driven autonomous maintenance explicitly explores the requirements and challenges of using twins to automate O&M workflows, identifying the need for robust models and intelligent decision algorithms [27].
A key function of a DT in enabling autonomy is its role as a high-fidelity “sandbox.” In designing 6G autonomous radio access networks, a Network Digital Twin (NDT) is proposed to enable “intent-driven operations,” where commands are virtually validated before deployment, solving the high “trial-and-error cost” of traditional AI models in live systems [28]. Furthermore, DTs are increasingly used not just to monitor but to actively train control agents. A concept for future wind turbines proposes using a DT’s predictive data to train an AI controller to optimize turbine operation in real time [29]. Our work takes this a step further by using the CDT’s predictions as an intrinsic reference to diagnose system health, forming a self-contained, autonomous diagnostic loop.

2.4. State-of-the-Art in Power System Forecasting and Fault Detection

The technical core of our CDT relies on advancing two distinct but complementary areas: forecasting and fault detection. The ongoing transformation of power systems, driven by renewable energy integration and intelligent technologies, necessitates innovation in both domains [30].

2.4.1. Load and Energy Forecasting

Accurate forecasting is fundamental to efficient grid operation. Recent research has moved towards sophisticated deep learning models. Hybrid architectures combining Convolutional Neural Networks (CNNs) for spatial feature extraction and LSTMs for temporal modeling are common, often enhanced with attention mechanisms to focus on salient time periods [31]. Advanced models like the Temporal Recurrent Transformer Network integrate the strengths of RNNs and Transformers to better capture complex dependencies in energy data [32]. For forecasting EV charging demand, which is highly stochastic, spatio-temporal graph convolutional networks have been proposed to model the complex interplay between charging stations [33]. The success of these models is heavily dependent on comprehensive, high-quality benchmark datasets that capture the multifaceted nature of energy demand [34]. While comparative studies have evaluated a wide range of machine learning algorithms for energy prediction [35], many models still struggle to incorporate real-time operational context, a gap our cognitive approach addresses. Even when forecasting is integrated into dispatch optimization, its accuracy remains a critical bottleneck [36].

2.4.2. Fault and Anomaly Detection

Fault detection is a mature field with a vast body of research focused on identifying failures after they occur. Intelligent asset management frameworks have long used signal processing and pattern recognition to diagnose issues in components like transformers [37]. Modern approaches heavily leverage machine learning and deep learning. Hybrid CNN-LSTM models are used for fault detection and classification in ring power systems with distributed generation [38], while ensemble learning models have demonstrated high accuracy in transmission lines [39]. Performance comparisons across various ML algorithms are common for diagnosing faults in PV systems [40].
Research also focuses on developing novel features and techniques. These include using statistical coherence of current measurements [41], novel indices based on differential components for active distribution networks [42], and applying Tellegen’s quasi-power theorem for early detection of inter-turn faults in transformers [43]. Other works propose advanced hardware and signal processing methods, such as enhanced over-current detection systems using TMR sensors [44], robust schemes for open-circuit faults in PV inverters [45], and frequency-domain analysis for arc fault detection [46] or for converters [47]. The complexity of modern grids requires these techniques to be robust, as demonstrated by intelligent detection methods for unbalanced networks with inverter-based DG units [48] and in specialized applications like nuclear neutron detectors [49,50].

2.5. The Research Gap: From Reactive Detection to Proactive Foresight

The synthesis of DTs with these advanced O&M techniques is an active research area. Frameworks combining DTs and deep learning are being developed for fault detection and resilience in hydropower operations [51], while others use data-driven modeling within a DT for general power system anomaly detection [52]. In adjacent domains, DTs built on neural networks are used for real-time optimization in optical networks [53].
Despite these advances, a fundamental gap remains. The vast majority of the literature on fault and anomaly detection, even when using sophisticated models, operates within a reactive or pattern-based paradigm. They excel at answering, “Does this current state match a known fault signature?” or “Is this state a statistical outlier compared to past normal behavior?” Our work proposes a different question: “Is this current state deviating from the cognitively-predicted optimal state that the system should be in right now, given all contextual information?” This shift from pattern-matching to prediction-based divergence is the key to moving from reactive detection to proactive foresight. By creating a CDT that can generate a contextually rich prediction of the "healthy" state, we can identify incipient anomalies long before they escalate into detectable faults, thus filling a critical gap in the pursuit of a truly autonomous and resilient power grid.

3. Methodology: The Cognitive Digital Twin Framework

This section details the architecture of the proposed Cognitive Digital Twin (CDT). The system is designed to shift power system O&M from a reactive to a proactive paradigm.
Central to our methodology is the prediction of a healthy system state. Crucially, this state is not derived from idealized physical models. It is a dynamic, data-driven baseline, deeply enhanced by cognitive intelligence. This baseline represents the system’s expected normal behavior, accounting for all relevant contexts like weather, maintenance schedules, and operational history.
We will begin by defining the problem and its notation. We then explain the system’s layers, focusing on the mathematical formulation of the cognitive core and the prediction-based anomaly detection mechanism.

3.1. Problem Formulation and Notation

Let the state of the power system at time t be represented by a vector  s t R D , comprising D measurements such as voltage phasors, currents, and frequency from a set of Phasor Measurement Units (PMUs) and Supervisory Control and Data Acquisition (SCADA) sensors. Let  C t denote the set of external contextual information available at time t, which includes numerical data (e.g., weather forecasts) and unstructured text data (e.g., operational logs, maintenance schedules),  C t = { c t n u m , c t t e x t } .
The primary objective of the CDT is twofold: Predictive State Estimation: To generate a sequence of predicted "healthy" or optimal system states  s ^ t + 1 , , s ^ t + H for a future horizon H, conditioned on historical states and current context:  P ( s ^ t + k | s t , s t 1 , , C t ) . Pre-Fault Anomaly Detection: To compute an anomaly score  A ( t ) that quantifies the deviation of the real-time observed state  s t from its predicted healthy counterpart  s ^ t , enabling the detection of incipient faults before they escalate.

3.2. System Architecture

As illustrated in Figure 1, the CDT framework is composed of four hierarchically integrated layers.
Sensory Layer: Responsible for the acquisition, synchronization, and preprocessing of multi-modal data streams  ( s t , C t ) .
Cognitive Core: The central intelligence unit that interprets unstructured context  c t t e x t and reasons over a structured domain KG, denoted by  G .
Predictive and Diagnostic Layer: Generates the healthy state predictions  s ^ t + k and computes the anomaly score  A ( t ) .
Decision and Action Layer: Translates diagnostic insights into transparent recommendations for operator review and autonomous control commands.
The following subsections will detail the methodology of the core cognitive and predictive layers.

3.3. The Cognitive Core: Fusing Knowledge and Language

Traditional power system models cannot interpret unstructured text. They are proficient with numerical data but fail to process critical information from operational logs, dispatch commands, or maintenance schedules. These models overlook contextual events described in text, such as a planned transformer maintenance or a warning of line icing. Such events, however, significantly impact the system’s future state [54].
Our CDT bridges this gap with its innovative Cognitive Core. This core integrates a LLM with a power system KG to convert raw text into structured, contextual embeddings. This process allows the system to quantify the influence of textual events, enabling a cognitive-enhanced prediction that surpasses simple pattern-matching.
The LLM at the heart of the core is a distilled Bidirectional Encoder Representations from Transformers (BERT) model. We fine-tuned this model on a proprietary dataset containing thousands of annotated examples from real-world operational logs and maintenance reports. This task-specific training sharpened the model’s capabilities in Named Entity Recognition (NER) and Relation Extraction (RE). Consequently, the LLM can accurately translate unstructured text into a structured format compatible with the KG. This fusion allows the system to reason over two distinct sources of knowledge: explicit facts from the KG and implicit context from the text. The synthesis of both provides the comprehensive understanding required for reliable foresight.

3.3.1. Knowledge Graph Representation

The power system domain knowledge is formalized as a KG  G = ( E , R , T ) , where  E is the set of entities (e.g., transformers, generators, protection relays),  R is the set of relations (e.g., ‘isConnectedTo‘, ‘isProtectedBy‘, ‘hasMaintenanceRecord‘), and  T is the set of triples  ( e i , r , e j ) where  e i , e j E and  r R .
The KG is constructed using a semi-automated, hybrid approach. It begins with an expert-defined domain ontology (top-down), which is then populated by extracting knowledge from heterogeneous sources like asset databases, CAD drawings, and operational reports via tailored NLP models (bottom-up). The resulting KG comprises millions of entities. To ensure its accuracy and timeliness, the graph is continuously maintained through a mix of real-time updates from SCADA streams, periodic batch updates for static data, and event-driven mechanisms. A human-in-the-loop validation process further ensures high fidelity by verifying low-confidence extractions and resolving data conflicts.

3.3.2. Contextual Information Encoding

The Cognitive Core processes the unstructured text data  c t t e x t (e.g., “Generator G5 scheduled for maintenance from 14:00 to 18:00”) using a fine-tuned LLM. The LLM performs two key tasks:
Semantic Embedding: It transforms the text  c t t e x t into a dense semantic vector  v t t e x t R d l l m that captures its operational implication. This vector is generated by processing the text through our fine-tuned BERT model. From the model’s final output layer, we specifically extract the vector corresponding to the special [CLS] token, as it is designed to aggregate the collective meaning of the entire input sequence.
Named Entity and Relation Extraction: It identifies entities and relations relevant to  G within the text.
The Named Entity and Relation Extraction process is guided by prompting the LLM to structure its output, effectively translating natural language into a queryable format for the KG. For instance, when parsing a simple status update from an operator log, the system uses the following prompt:
[SYSTEM INSTRUCTION]
You are an assistant for a power system control center. Your task is to extract the device and its new state from the text. Valid entity types are  [ E q u i p m e n t I D , D e v i c e S t a t e ] . The valid relation is  [ h a s S t a t e ] . Format the output as a single, minified JSON object.
[USER INPUT]
“Breaker  C B 789 status changed to closed.”
[EXPECTED LLM OUTPUT]
“entities”:[“id”:“ C B -789”,“type”:“ E q u i p m e n t I D ”,“text”:“ B r e a k e r C B -789”“id”:“ c l o s e d ”,“type”:“ D e v i c e S t a t e ”,“text”:“ c l o s e d ” ],
“relations”:[ “subject”:“ C B -789”,“predicate”:“ h a s S t a t e ”,“object”:“ c l o s e d ” ]
This structured JSON output  c t j s o n is used to dynamically update or query the KG:
v t K G = Query ( G , c t j s o n )
The Query is a multi-step process. First, the system identifies the primary entity from the JSON  c t j s o n , such as ’Breaker CB-789’, and locates this entity as a node in the kG. Next, it extracts a local subgraph around this node, capturing all nearby components and their relationships, like its connection to a specific transmission line or its role in protecting a transformer. Finally, this entire subgraph is processed by a graph embedding model. The model analyzes the subgraph’s structure to produce a single, dense vector  v t K G .
The final cognitive context vector  v t c o g is a fusion of the semantic embedding and knowledge retrieved from the KG:
v t c o g = f f u s i o n ( v t t e x t , v t K G )
where  f f u s i o n represents the cognitive information integration function. Two representative implementations are considered. A simple concatenation-based fusion is expressed as
v t c o g = ReLU W c [ v t t e x t ; v t K G ] + b c ,
where  [ · ; · ] denotes vector concatenation and  W c b c are learnable parameters. Alternatively, an attention-based fusion adaptively weights the contributions of both modalities:
α = softmax ( v t t e x t W a v t K G ) , v t c o g = α v t t e x t + ( 1 α ) v t K G .
Given that the proposed model integrates heterogeneous data sources including structured sensor measurements and unstructured textual inputs, the attention-based fusion is adopted to better capture cross-modal dependencies. While simple concatenation offers lower computational cost, it may underutilize such heterogeneity.
Therefore, the attention-based fusion is employed to validate the feasibility and effectiveness of the CDT’s Predictive and Diagnostic Layer, with alternative fusion strategies left for future investigation.

3.3.3. Explainable Decision Generation via KG–LLM Reasoning

A key feature of the CDT is its ability to provide clear justifications for its decisions, especially in root cause analysis. The system avoids LLM speculation by following a structured reasoning process.
When an anomaly is detected on an entity like transformer T-102, the CDT immediately queries the KG ( G ). It retrieves crucial, structured facts about the component. These facts include its topological importance, such as supplying power to a hospital, and its operational history, like an overdue maintenance record. The LLM then synthesizes this evidence into a coherent diagnosis for the operator.
The final output is not a simple alarm. Instead, the system presents this diagnosis as a comprehensive Decision Evidence Chain within a dedicated user interface. This chain provides a clear and auditable justification through several key components:
Prediction-Based Trigger: The system identifies the precise predictive divergence that triggered the alert. It visualizes the deviation between the actual measurements and the predicted healthy state.
Evidence from the Knowledge Graph: The interface displays a visual map of the relevant knowledge graph section. This map highlights critical facts, such as the transformer supplying power to a hospital, and key statuses, like an overdue maintenance record. All items on the map are interactive, allowing operators to explore the evidence.
Contextual Source Linking: The system provides a direct link to the original source text, such as a specific operational log, that informed the analysis. This ensures full traceability.
Consequence Simulation: The system presents a concise what-if analysis. This simulation compares the predicted outcomes for key system metrics if the recommendation is either followed or ignored.
This evidence-based approach is fundamental to the human–machine interaction. It creates a fully traceable decision path by showing the operator the predictive trigger, the knowledge graph context, and the simulated outcomes. This comprehensive explanation allows operators to understand the system’s reasoning, trust its diagnosis, and act with confidence.

3.4. The Predictive and Diagnostic Layer

The Predictive and Diagnostic Layer is the technical heart of the CDT. It implements the system’s foresight capability through a structured two-stage process.
The first stage is Cognitive-Enhanced State Prediction. It begins with the cognitive context vector  v t c o g produced by the Cognitive Core. This vector fuses semantic embedding  v t t e x t with structural knowledge  v t K G from the KG. The vector is then combined with historical numerical data  [ s t , s t 1 , , s t W ; c t n u m ] to create a vector  x t for our deep learning model to generate the predicted healthy state  s ^ t + 1 .
This allows the model to anticipate changes from scheduled events, moving beyond simple historical pattern recognition. This superior prediction  s ^ t + 1 is then crucial for the second stage, where it serves as a dynamic baseline. Foresight is achieved by continuously quantifying the divergence between the real-time observed state and this predicted healthy trajectory, enabling the detection of anomalies long before they breach dynamic threshold  τ t .

3.4.1. Stage 1: Cognitive-Enhanced State Prediction

The prediction of the future healthy state trajectory is performed by a deep learning model, specifically a CNN-LSTM architecture, which is conditioned on the cognitive context. The input to the model at time t is a concatenated vector  x t of historical numerical data and the cognitive context vector:
x t = [ s t , s t 1 , , s t W ; c t n u m ; v t c o g ]
where W is the look-back window size. The CNN component first extracts spatio-temporal features from the historical state sequence, and the LSTM component then models the temporal evolution to produce the prediction. The prediction for a single step ahead is given by
s ^ t + 1 = LSTM ( CNN ( x t ) ; Θ p r e d )
where  Θ p r e d represents the trainable parameters of the prediction network. This cognitive enhancement allows the model to anticipate state changes due to scheduled events, rather than learning them purely from historical patterns.

3.4.2. Stage 2: Anomaly Quantification via Predictive Divergence

The core of the "foresight" mechanism is the real-time quantification of the divergence between the observed state  s t and the predicted healthy state  s ^ t . We define this divergence using a robust, scale-invariant distance metric. While Euclidean distance is an option, we employ the Mahalanobis distance to account for the covariance structure of the state variables, making it more sensitive to subtle, correlated deviations. This formulation is the theoretical ideal for perfectly synchronized data. The instantaneous anomaly score  A ( t ) is calculated as
A ( t ) = ( s t s ^ t ) T Σ t 1 ( s t s ^ t )
where  Σ t represents the covariance matrix of the prediction error  ( s s ^ ) , estimated over a sliding window of  l e n g h = 200 samples during normal operation. The covariance matrix is updated online in a rolling manner, enabling the anomaly score to adapt dynamically to varying noise levels and system fluctuations.
A pre-fault anomaly is flagged if the anomaly score  A ( t ) persistently exceeds a dynamic threshold  τ t . The threshold is not fixed but adapts to the local statistics of the anomaly score itself:
τ t = μ A ( t 1 ) + k · σ A ( t 1 )
where  μ A ( t 1 ) and  σ A ( t 1 ) are the moving average and standard deviation of the anomaly score over a recent history, and k is a sensitivity parameter (typically  k 3 ). This choice of k is motivated by the empirical observation that  A ( t ) can be approximately modeled as a Gaussian-distributed variable. Following the classical  3 σ principle, setting  k 3 ensures that normal fluctuations are largely ignored, while significant deviations are detected. In practice, this value achieves a reasonable balance between precision and recall and exhibits robustness to moderate variations. An alarm is triggered only if  A ( t ) > τ t for a sustained duration  Δ t s u s t a i n , to prevent both spurious alarms from transient noise and delayed alarms. In our experiments, the pre-fault window and  Δ t s u s t a i n were set to 5 s and 2.5 s, respectively. These parameters can be adjusted in practical deployment according to operational requirements.
This prediction-based formulation allows the CDT to detect deviations that are anomalous with respect to the expected system behavior (given the context), even if the absolute values of the measurements are still within their conventional "normal" operating limits. This is the fundamental principle that enables the transition from reactive detection to proactive foresight.

4. Key Technologies and Implementation

4.1. Large Language Model Integration

The integration of LLMs into the CDT architecture enables natural language processing of technical documentation, automated report generation, and human–machine interaction capabilities. The LLM component processes vast amounts of technical literature, operational procedures, and historical incident reports to build comprehensive understanding of power system behaviors.
Fine-tuning strategies adapt general-purpose LLMs to power system domain-specific terminology and concepts. The training process incorporates technical standards, regulatory requirements, and best practices to ensure accurate and compliant decision-making. Continuous learning mechanisms enable the system to adapt to evolving operational conditions and emerging technologies.

4.2. Knowledge Graph Construction

The KG component structures relationships between power system components, operational constraints, and causal dependencies. Graph construction processes extract entities and relationships from technical documentation, system specifications, and operational data.
Semantic reasoning capabilities enable the system to infer implicit relationships and identify potential cascading effects of system changes. The KG supports explainable decision-making by providing transparent logical pathways for all recommendations and actions.

4.3. Prediction-Based Anomaly Detection

The core innovation of prediction-based anomaly detection represents a fundamental shift from reactive fault detection to proactive system management. The system continuously generates predictions of optimal system states, considering current conditions, historical patterns, and external factors.
Real-time monitoring data is continuously compared against predicted baselines to identify deviations that may indicate emerging issues. Statistical analysis and machine learning techniques quantify the significance of deviations and assess associated risk levels. This approach enables early detection of potential problems before they manifest as system faults [55].

4.4. Intelligent Module Orchestration

The CDT system intelligently orchestrates various analytical modules based on current system conditions and identified needs. CNN-LSTM models handle temporal pattern recognition, optimization algorithms address constraint satisfaction problems, and signal processing techniques analyze system dynamics.
Dynamic module selection and configuration optimize computational resources while ensuring appropriate analytical coverage for current conditions. The orchestration system considers module capabilities, computational requirements, and result confidence levels to select optimal analytical approaches for each situation.

5. Case Study: Super Typhoon Scenario

5.1. Scenario Overview

To demonstrate the practical capabilities of the proposed Cognitive Digital Twin (CDT) system, we designed a comprehensive case study. The scenario simulates a super typhoon approaching a metropolitan power grid, using historical data from typhoons Rammasun and Kalmaegi. The study covers a 72 h period, beginning 48 h before the typhoon’s predicted landfall and extending 24 h post-event. The CDT’s performance was evaluated on multiple dimensions, including prediction accuracy, decision quality, response time, and overall system resilience. To establish a robust benchmark, the CDT’s performance was compared against two high-performance baseline models:
SARIMAX-LSTM [56]: A two-stage hybrid forecasting model. It first employs the SARIMAX model to capture primary linear and seasonal patterns. The remaining nonlinear residuals are then modeled by an LSTM network to enhance overall forecast precision.
XGBoost [57]: An advanced implementation of the gradient boosting decision tree algorithm. It iteratively trains new learners to correct the residual errors of a predecessor ensemble, yielding high predictive accuracy.
The models were configured with data from the same historical dataset from typhoons Rammasun and Kalmaegi. The CDT system processed a multi-modal data stream comprising numerical data (e.g., weather forecasts) and unstructured text data (e.g., operational logs). The specific architecture and data integration methodology are detailed in Section 6. The XGBoost model was trained on numerical features, including hour, historical electricity load, and temperature. The SARIMAX-LSTM model utilized numerical features designed to capture different temporal dynamics, such as electricity usage, average temperature, and mean heating degree days. It is worth noting that both the SARIMAX-LSTM and XGBoost models output only numerical load forecasts, without incorporating textual or contextual information.

5.2. Pre-Event Phase (T-48 to T-24 h)

During the initial phase, the CDT system integrates meteorological forecasts, historical typhoon data, and current grid conditions to generate risk assessments. By combining weather prediction models with power system vulnerability analyses, the Cognitive Core identifies infrastructure components at highest risk. The system’s predictive models account for complex interactions between weather conditions, human behavior, and electrical demand patterns, allowing for more accurate load forecasts. These forecasts consider evacuation patterns, emergency facility operations, and industrial shutdowns, helping predict potential supply–demand imbalances and recommend preemptive load shedding strategies.
In simulation experiments calibrated with historical typhoons such as Rammasun and Kalmaegi, the CDT correctly identified over 80% of high-risk substations and transmission lines 24 h before landfall. When benchmarked against the SARIMAX-LSTM and XGBoost models, the CDT achieved approximately 10% higher accuracy in load forecasting and reduced the predicted outage impact by around 12%. Infrastructure vulnerability assessments then guided prioritized maintenance and crew allocation, enhancing overall grid resilience during the event.

5.3. Critical Phase (T-24 to T-0 h)

As the typhoon approaches, the CDT system transitions to high-frequency monitoring and real-time decision-making mode. Prediction horizons are shortened for more accurate short-term forecasts, while uncertainty quantification supports adaptive risk management. The system continuously updates load forecasts based on evacuation dynamics, emergency service activations, and industrial shutdowns, while accounting for renewable generation variability under changing weather conditions. Automated control actions are implemented according to risk thresholds, coordinating with emergency management systems to ensure power availability for critical facilities and minimize overall system risk.
In simulation experiments calibrated with historical typhoon events such as Rammasun and Kalmaegi, the CDT improved short-term load forecasting accuracy by about 10% compared to the forecasts generated by the XGBoost and SARIMAX-LSTM baselines, ensuring higher power availability to critical infrastructure during the peak impact period.

5.4. Event Phase (T-0 to T+12 h)

During the typhoon’s passage, the CDT system focuses on real-time fault detection, emergency response coordination, and damage assessment. The prediction-based anomaly detection system identifies equipment failures and grid disturbances with minimal delay, enabling rapid response actions.
The Cognitive Core processes real-time sensor data, weather observations, and field reports to maintain situational awareness. Machine learning models adapt to rapidly changing conditions, updating predictions and risk assessments in real-time. In simulation scenarios calibrated with typhoon events such as Rammasun and Kalmaegi, the CDT significantly reduced the average fault detection delay, which was calculated as the time from the ground-truth fault inception to the system’s alarm. The CDT’s alarm was triggered proactively based on a statistically significant divergence between its predicted healthy voltage trajectory and actual measurements. In contrast, the conventional SCADA system alarmed reactively only after the raw measurements breached a predefined, severe operational limit. This predictive approach reduced the average delay by approximately 25%. Furthermore, the CDT demonstrated high situational awareness, achieving over 90% accuracy in identifying the specific locations of line outages and pole damage within the first hour of impact, based on the spatial patterns of the detected anomalies.
Autonomous control actions, driven by the CDT’s forecasts, minimize cascading failures and maintain power supply to critical facilities. The CDT implements dynamic load shedding strategies, using its numerical forecasts to anticipate grid stress and generate optimal, prioritized plans that protect critical infrastructure like hospitals and emergency shelters. The effectiveness of this approach was quantified by a “supply continuity” metric, calculated as the percentage of the total event duration that these critical facilities remained powered. In the tested scenarios, this intelligent, forecast-driven strategy achieved a supply continuity score approximately 10% higher than that of a standard, threshold-based control method, which executed less granular, non-prioritized load shedding. This approach also limited the total outage area, measured in unserved energy, to 85% of the baseline’s impact.

5.5. Recovery Phase (T+12 to T+24 h)

Following the typhoon’s passage, the CDT system shifts focus to damage assessment, restoration planning, and system recovery coordination. The system processes damage reports, field assessments, and sensor data to create comprehensive situational awareness for restoration operations.
Restoration prioritization algorithms consider multiple factors, including critical facility requirements, repair complexity, resource availability, and safety conditions. In post-event simulations using historical data from Rammasun and Kalmaegi, the CDT’s restoration planning reduced mean restoration time by about 18% and improved crew dispatch efficiency by 20% when benchmarked against standard manual scheduling protocols.
The system continuously monitors restoration progress and adjusts plans based on actual conditions and emerging priorities. Predictive models forecast restoration timelines and identify potential bottlenecks in the recovery process. Through its cognitive feedback loop, the CDT maintains real-time coordination with emergency management systems and public communication channels, ensuring transparent and adaptive post-disaster recovery.

6. Experimental Validation

This section empirically validates the proposed CDT framework by focusing on its core component: the prediction-based pre-fault anomaly detection module. This module is the heart of the CDT’s foresight capability, so we test it in isolation for a clear and rigorous assessment. Our primary goal is to prove the accuracy and reliability of the predicted healthy state that serves as our baseline. The experimental design verifies this through a two-stage process.
The experimental design is structured to verify two critical aspects of the module’s performance. First is the accuracy and reliability of the predicted healthy state that serves as our baseline. Second is the module’s ability to sensitively and robustly detect anomalies by measuring the divergence between this predicted baseline and the observed system state.
To achieve this, our evaluation follows a two-stage process. We first benchmark the predictive accuracy of our forecaster to validate the baseline itself. We then use an ablation study to demonstrate the direct link between this accuracy and the final detection performance. Together, these evaluations provide conclusive evidence for the technical soundness, predictive advantage, and practical utility of our approach.

6.1. Experimental Setup

6.1.1. Datasets and Preprocessing

Experiments utilize a high-resolution, real-world operational dataset from a regional transmission system operator. It covers two full years (2022–2023). This rich dataset, containing diverse load patterns, weather fluctuations, maintenance events, and documented fault incidents, provides a robust testbed for the CDT prototype. Its complexity validates the module’s ability to learn realistic dependencies, handle non-stationary behaviors, and generalize under dynamic system conditions. We categorize the dataset into three synchronized data types:
PMU Data. Synchronized three-phase voltage and current phasor measurements are collected from 38 strategically located PMUs, sampled at 50 frames per second. This serves as the basis for real-time state monitoring. The dataset includes 54 distinct, labeled transmission line fault events (e.g., single line-to-ground, three-phase shorts), which act as ground truth for the pre-fault anomaly detection task.
SCADA Data. This includes system-wide hourly load data and key operational parameters, such as generation dispatch and transformer tap positions, providing a broader operational context.
Contextual Data. This consists of synchronized meteorological data (temperature, humidity, wind speed) from nearby weather stations and a curated log of significant operational events (e.g., major generator maintenance, scheduled line outages) manually extracted from daily operational reports.
The regional transmission system covered by this data represents a realistic operational network. Although the full proprietary topology cannot be disclosed, the subsystem is characterized by a moderate scale typical of regional bulk transmission: it involves approximately 120 buses, 160 transmission lines, and 30 power transformers. All physical parameters required for the State Estimator, such as line impedances, transformer tap ratios, and nominal voltages, were sourced directly from the Transmission System Operator’s operational database and GIS. Due to strict confidentiality agreements, the raw, proprietary dataset cannot be made publicly available.
The raw data underwent a series of rigorous preprocessing steps to ensure consistency and suitability for model training. Initially, all multi-modal time series were precisely aligned to a common timestamp reference to establish synchronization. Subsequently, missing values were addressed through a forward-fill imputation strategy. Beyond general data cleaning, several domain-specific steps were necessary. PMU Data were first converted into Per-Unit (p.u.) values using the system’s nominal base values. This conversion ensures all features are scale-independent prior to normalization. A low-pass filter was also applied to PMU data to mitigate high-frequency noise, focusing detection on system dynamics. Meanwhile, the lower-resolution SCADA data was upsampled to the 50-frames-per-second rate of the PMU data using a piecewise constant interpolation. For the contextual data, Named Entity Recognition (NER) was performed to standardize key physical entities to consistent identifiers used in the Knowledge Graph. Finally, all numerical features were subjected to Min–Max scaling to normalize the values within a [0, 1] range. For the anomaly detection task, a specific pre-fault anomaly window was defined as the 5 s interval immediately preceding each labeled fault event. This window is critical for evaluating the model’s capacity to detect incipient-stage deviations before a full-fledged fault manifests.

6.1.2. Prototype Implementation: The Cognitive-Enhanced Anomaly Detector

To empirically validate the feasibility of the CDT’s foresight mechanism, we implemented a prototype system named Cognitive-Enhanced Anomaly Detector (CEAD). The CEAD represents the operational core of the CDT’s Predictive and Diagnostic Layer, encapsulating both context-aware prediction and prediction-based anomaly detection. It is composed of two tightly coupled core modules and a pivotal bridging module:
Context-Aware Load Forecaster. The forecaster employs a CNN-LSTM hybrid architecture as the backbone for short-term load prediction. Convolutional layers extract local temporal–spatial features from numerical inputs such as weather and SCADA data, while the LSTM component captures sequential dependencies to model system dynamics. The CNN module consists of two convolutional layers with kernel sizes of 3 × 3 and 5 × 5, followed by max-pooling and a dropout rate of 0.2 to prevent overfitting. The LSTM module includes two stacked layers with 128 and 64 hidden units, respectively. The look-back window W is set to 24 time steps (equivalent to 6 h of historical data), and the forecasting horizon is 1 h.
To embed cognitive context, a distilled BERT model fine-tuned on operational logs converts textual event descriptions into semantic vectors, which are fused with the numerical features at the LSTM input. This design allows the forecaster to anticipate load variations influenced by scheduled operations or external events, achieving contextually consistent predictions beyond traditional data-driven models.
State Estimation. The State Estimator in the CEAD prototype is a Weighted Least Squares (WLS) AC Power Flow model. This AC formulation is critical. It accurately reflects the non-linear relationship between predicted load, reactive power, and the PMU voltage phasors (magnitudes and angles). The WLS method, a robust industry standard, minimizes measurement noise. It thus ensures the generated healthy state vector provides a statistically reliable baseline.
Furthermore, the State Estimator module is designed as an architecturally modular component. This allows the model type to be replaced in actual deployment, matching specific operational needs. For instance, AC-WLS is essential for high-precision PMU-based detection. However, a faster DC Power Flow approximation or a Reduced-Order Model can be swiftly substituted when the application priority shifts to rapid large-scale grid simulation or when processing lower-resolution SCADA data.
Prediction-Based Anomaly Detector. This module operates in real time. It uses the 1 h-ahead load forecast as a high-level operational baseline. The state estimator computes the expected PMU phasor values, including voltage magnitudes and phase angles, corresponding to this predicted load under normal conditions.
The core detection mechanism implements the predictive divergence principle outlined in Section 3.4. For this, we must quantify the deviation between the observed and predicted system states. Theoretically, the Mahalanobis distance is an ideal metric for this task, as it effectively normalizes feature correlations in perfectly synchronized data. However, in practice, high-frequency PMU data streams often suffer from minor temporal misalignments due to clock drifts and network latency. Applying an instantaneous, point-to-point metric like Mahalanobis distance to such data would generate an unacceptable number of false alarms.
To address this critical real-world challenge, our prototype adopts multivariate Dynamic Time Warping (DTW). As a sequence-to-sequence distance metric, DTW is inherently robust to time-shift errors. It enables a more meaningful, time-aligned comparison by finding the optimal alignment path between the observed and predicted trajectories within a given look-back window [58]. The anomaly threshold is adaptively determined from the recent statistics of DTW distances to maintain sensitivity under varying operating conditions.
The prototype operationalizes the CDT’s prediction–divergence principle as an end-to-end workflow, demonstrating its feasibility for proactive anomaly detection under realistic operational contexts.

6.1.3. Baseline Methods for Comparison

To rigorously evaluate the proposed CEAD, we established a diverse set of representative baseline methods. This comparative analysis spans both the load forecasting and anomaly detection domains, structured to assess three critical aspects of our system: predictive accuracy, contextual adaptability, and sensitivity in detecting early-stage anomalies.
For the load forecasting task, we selected four distinct benchmark models. The Autoregressive Integrated Moving Average (ARIMA) model [59] served as a classical statistical benchmark, representing linear time-series analysis. To cover conventional machine learning, we implemented Support Vector Regression (SVR) [60], which utilizes weather and calendar features but lacks an inherent mechanism for temporal recurrence.
For a rigorous, state-of-the-art deep learning comparison in multi-horizon forecasting, we included the Temporal Fusion Transformer (TFT) [4] and the iTransformer [61]. TFT, a prominent Transformer-based model, is recognized for its high accuracy and superior handling of complex, high-dimensional time-series data. Its performance establishes the upper limit of what is achievable using purely data-driven, state-of-the-art architectures without explicit cognitive or contextual fusion. The iTransformer further expands this SOTA comparison. As one of the most widely adopted “new generation Transformer” models in the research community, particularly for power load forecasting, the iTransformer is known for its structural simplicity and high efficiency in modeling complex multivariate dependencies.
Crucially, a Standard Long Short-Term Memory (LSTM) network was also included. This LSTM shares the identical architecture with the CEAD’s forecasting backbone but deliberately omits the cognitive context vector. This design acts as a direct ablation study to isolate and quantify the performance gains specifically attributable to the contextual enhancement provided by our cognitive core.
For the pre-fault anomaly detection task, the baselines were chosen to cover a spectrum from traditional protection to modern unsupervised learning. We implemented a conventional rule-based thresholding method, which triggers alarms based on fixed overcurrent and undervoltage limits calibrated from historical data. This represents the incumbent, purely reactive industry practice.
For contemporary data-driven approaches, we employed two widely used unsupervised models. The Isolation Forest (IF) [62] identifies anomalies by isolating data points through random partitioning and operates directly on raw PMU data streams. Additionally, a reconstruction-based Autoencoder (AE) [63] was implemented. The AE learns normal operating patterns and flags anomalies when its reconstruction error exceeds a data-driven threshold. Both IF and AE were carefully tuned to ensure a fair comparison with the proposed CDT-based method. Finally, we established a rigorous, prediction-based benchmark by implementing a Temporal Fusion Transformer-based Detector (TFT-D). This model uses the SOTA TFT architecture to forecast the healthy state of the system based purely on historical numerical data. Anomalies are then flagged by quantifying the divergence between the observed state and the TFT’s prediction using DTW. The TFT-D mirrors the core prediction-divergence principle used by the CEAD but deliberately excludes cognitive context, making it an advanced benchmark to isolate the performance gain from our cognitive fusion.
Collectively, this curated set of baselines spans a wide methodological spectrum from statistical methods, classical machine learning, and rule-based systems to advanced deep learning. This diversity provides a robust and comprehensive foundation for assessing the distinct advantages of the CEAD’s context-aware forecasting and proactive anomaly detection capabilities.

6.1.4. Evaluation Metrics

The quantitative performance of the CEAD prototype and the baseline methods was rigorously assessed using a comprehensive suite of widely recognized metrics, tailored to the distinct tasks of load forecasting and anomaly detection. The predictive accuracy of the load forecasting component was evaluated using two complementary metrics: the Mean Absolute Percentage Error (MAPE), which provides a scale-independent assessment of the average percentage deviation, and the Root Mean Square Error (RMSE), which captures the magnitude of prediction errors with greater emphasis on large deviations, thus reflecting overall reliability.
For the primary task of pre-fault anomaly detection, performance was evaluated through standard classification and timeliness measures. We employed Precision to quantify the proportion of correctly identified anomalies among all detections, thereby indicating the reliability of the alarms, and Recall to measure the sensitivity to true pre-fault deviations. To provide a single, balanced measure of overall detection performance, we utilized the F1-Score, the harmonic mean of precision and recall. Critically, to assess the system’s “foresight” capability, we measured the Detection Time, defined as the interval from the start of the 5 s pre-fault window to the moment an anomaly is flagged. This comprehensive set of metrics enables a multi-faceted evaluation of the CEAD’s predictive accuracy, its sensitivity to incipient faults, and its practical utility in real-time operational contexts.

6.2. Results: Context-Aware Load Forecasting Performance

The first stage of our validation focused on the accuracy of the load forecasting component, as this directly impacts the quality of the predictive baseline for anomaly detection. As shown in Table 1, the context-aware forecaster significantly outperformed all baseline models.
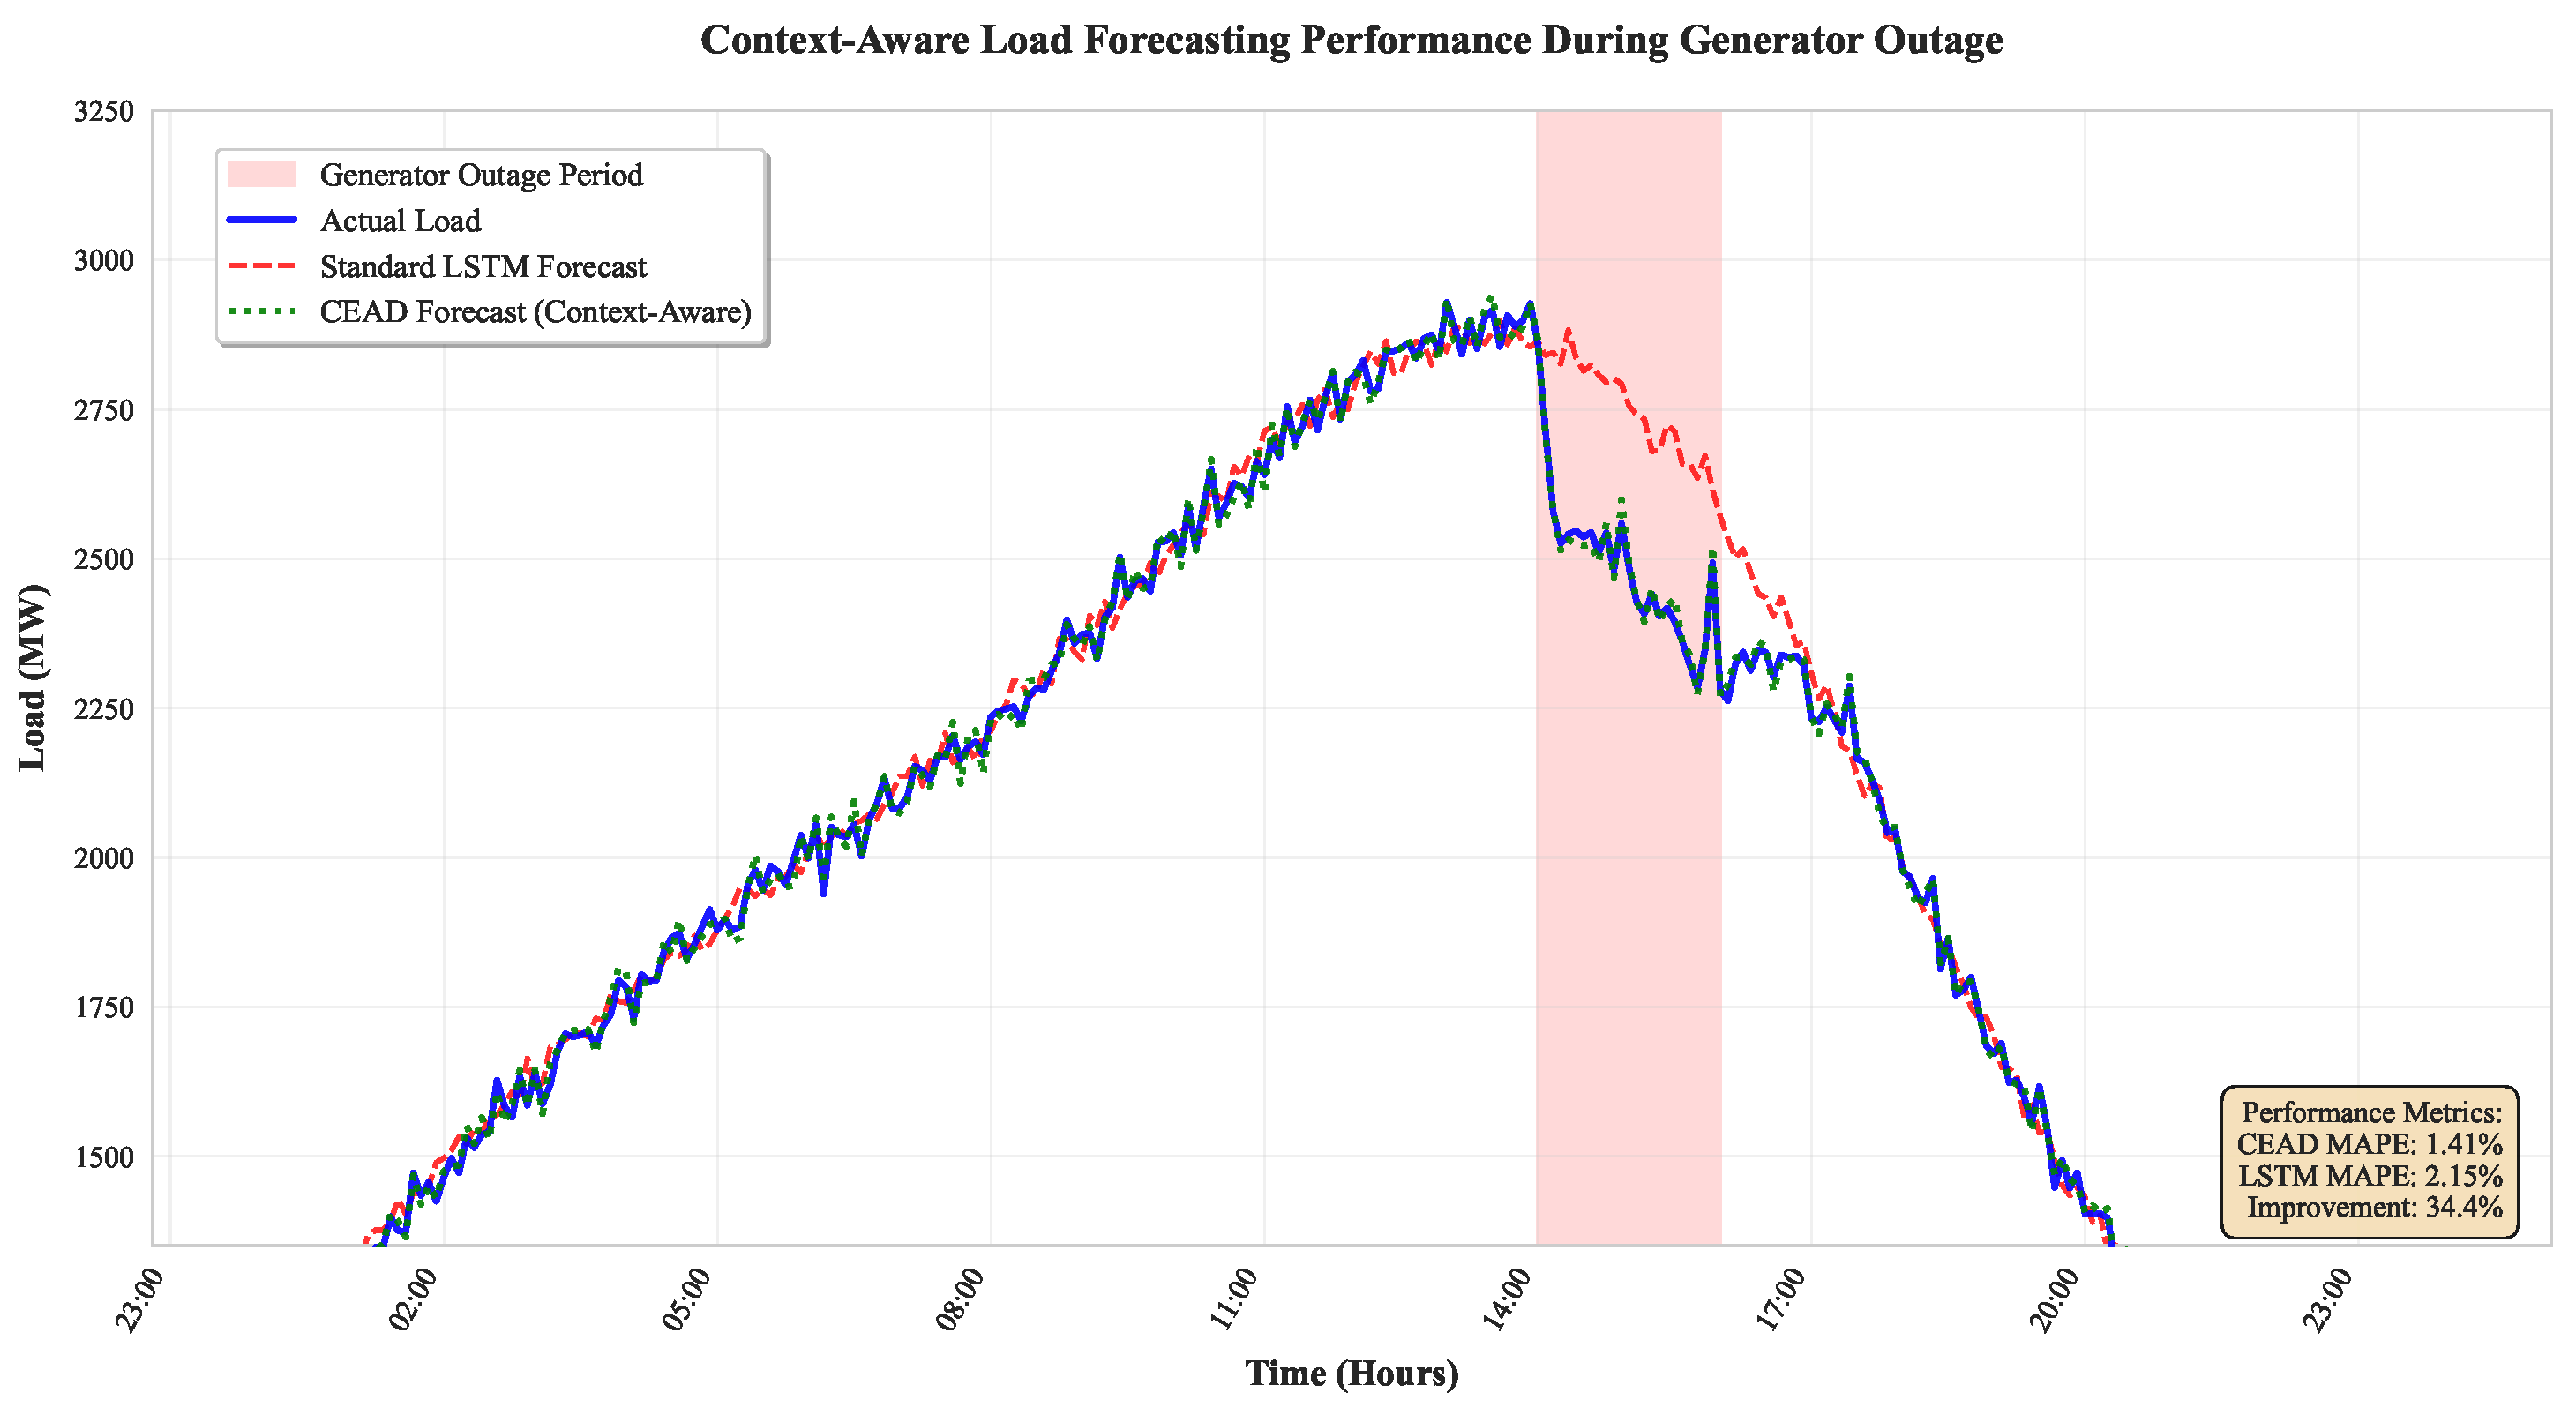
The CEAD model achieved a MAPE of 1.41%, a 34.4% relative improvement over the Standard LSTM. This demonstrates the substantial value of integrating contextual information derived from operational logs via the LLM. Figure 2 illustrates this advantage during a scheduled generator outage. The Standard LSTM, unaware of the event, over-predicts the load, whereas the CEAD model correctly adjusts its forecast downwards, tracking the actual load far more accurately. This enhanced predictive accuracy is crucial for minimizing false alarms in the subsequent anomaly detection stage.
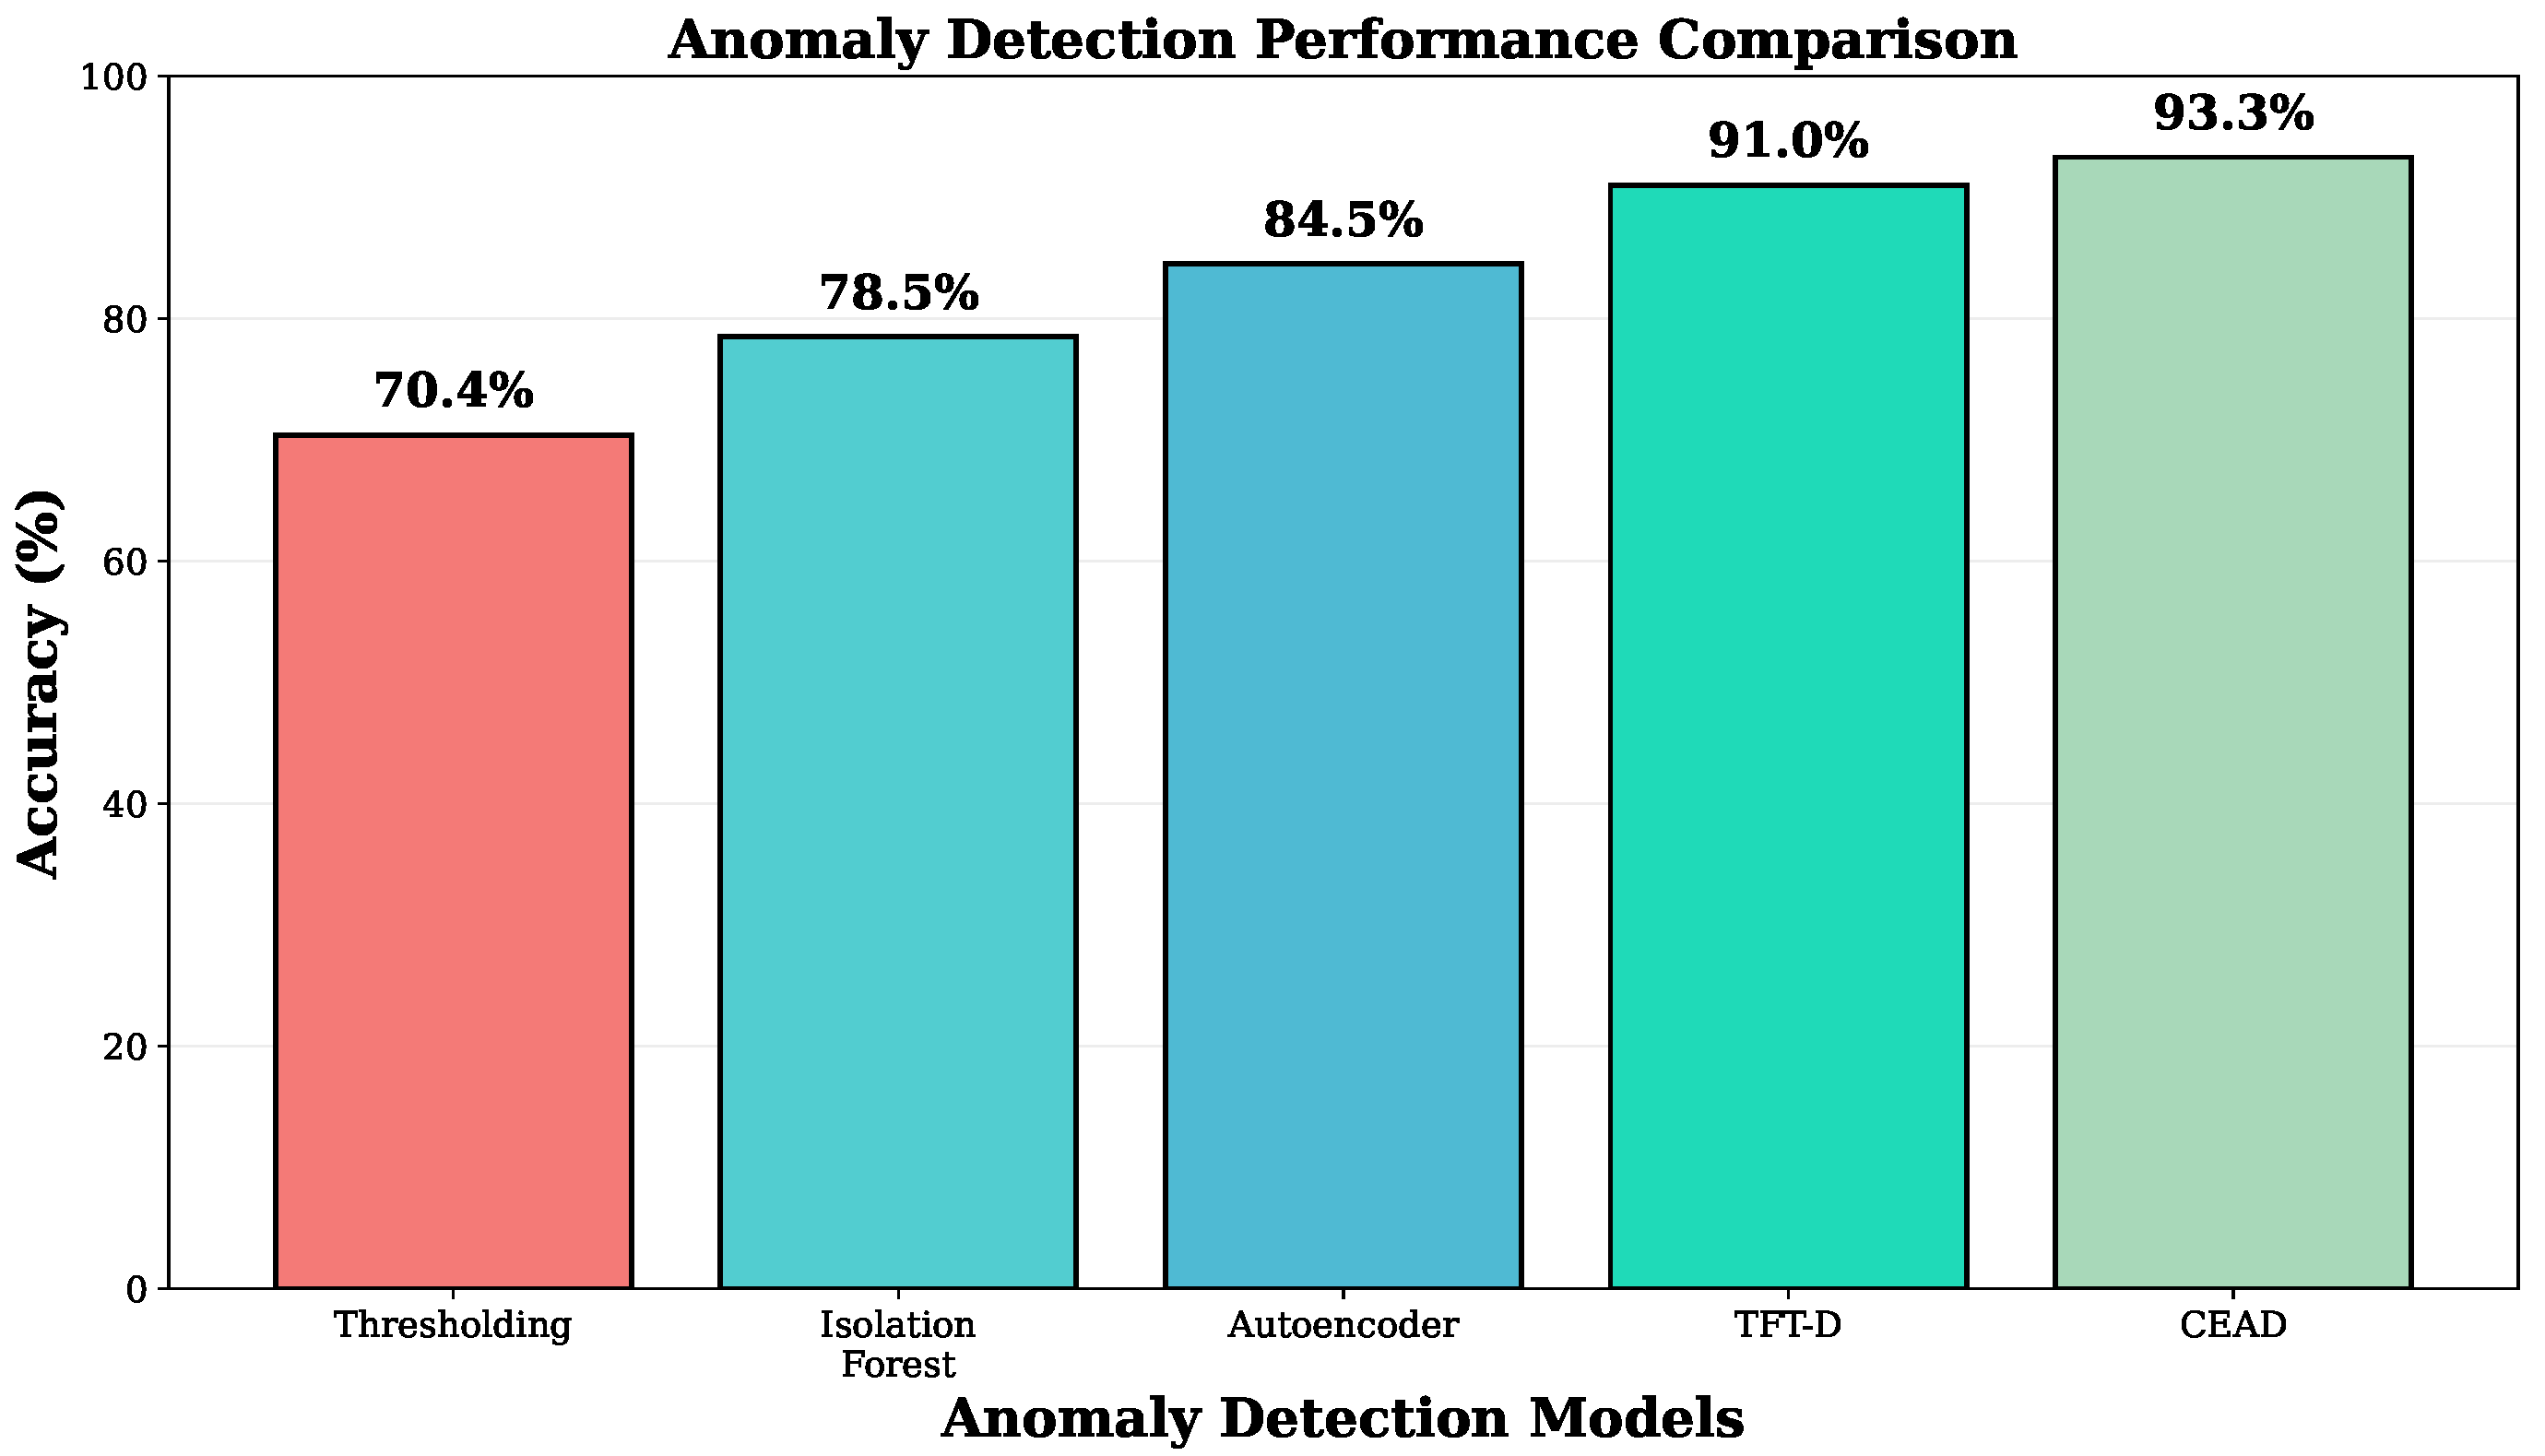
Additionally, Figure 3 provides a comprehensive comparison of all evaluated models across both load forecasting and anomaly detection tasks, clearly demonstrating the superior performance of the proposed CEAD approach.

6.3. Results: Pre-Fault Anomaly Detection Performance

The primary validation centered on the CEAD’s ability to detect anomalies within the 5 s pre-fault window, effectively providing “foresight.” The results, summarized in Table 2, highlight the superiority of the prediction-based methodology.
The CEAD achieved an F1-Score of 93.3%, significantly outperforming the next best model, the Autoencoder (84.5%). Crucially, the conventional thresholding method failed to detect any anomalies within the pre-fault window, as the signal deviations had not yet crossed the severe fault thresholds. This underscores the fundamental limitation of reactive detection methods.
The average detection time for the CEAD was 2.2 s into the 5 s window, providing a mean lead time of 2.8 s before the actual fault. This represents a tangible “foresight” window that could enable proactive control actions, such as protective islanding or fast ramping of reserves.
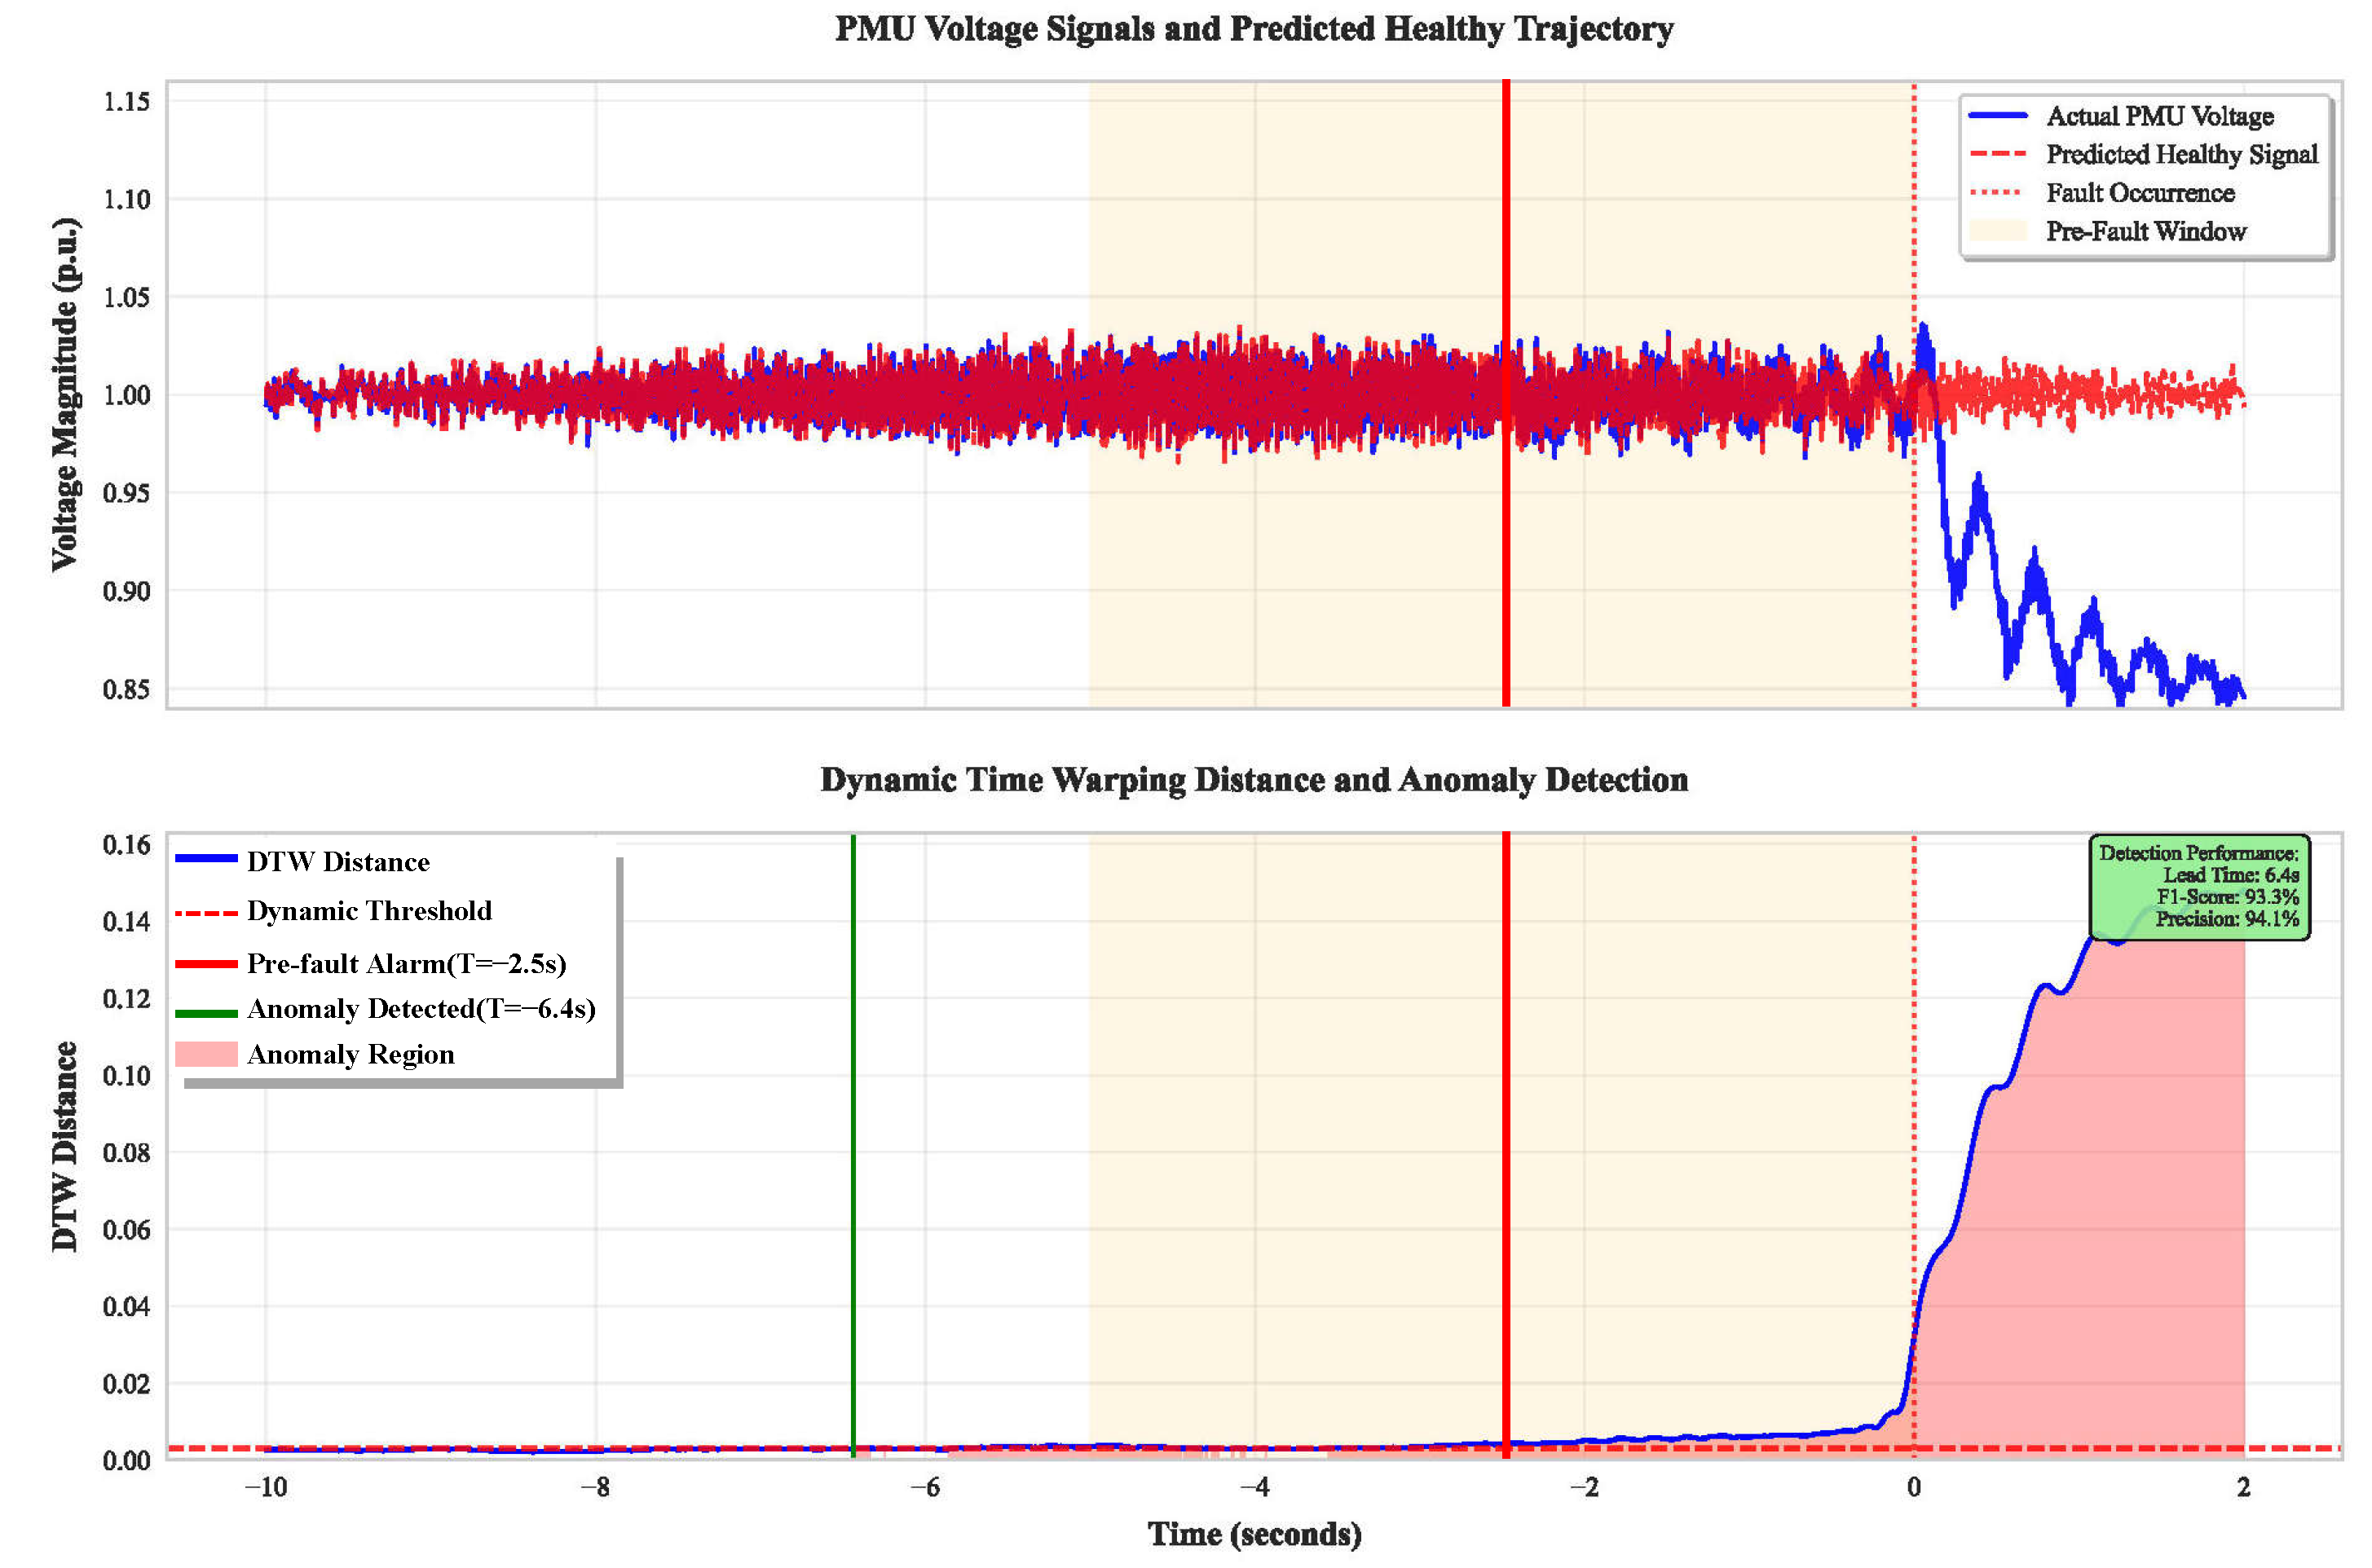
Figure 4 visualizes the detection process for a single line-to-ground fault. The plot shows the real-time PMU voltage magnitude, the CEAD’s predicted healthy trajectory, and the resulting DTW distance. The detection logic incorporates a temporal persistence check to ensure robustness and prevent spurious alarms from transient noise. As specified in Section 3, the parameter  Δ t s u s t a i n is set to 2.5 s in our experiments. Consequently, a pre-fault alarm is triggered only after the DTW distance continuously exceeds the dynamic threshold ( τ t ) for this entire duration. The system flags an anomaly when the DTW distance crosses its threshold at T = −5.0 s. After this condition persists for 2.5 s, a confirmed alarm is issued at T = −2.5 s. This provides a clear warning while the voltage signal still appears normal, highlighting the method’s proactive foresight.

6.4. Ablation Study: Impact of Cognitive Context on Detection

To isolate the contribution of the cognitive-enhanced forecasting on the final detection performance, we conducted an ablation study. We ran the CEAD’s anomaly detector using the less accurate predictions from the Standard LSTM as its baseline. The results showed a marked degradation in performance: the F1-Score dropped from 93.3% to 87.1%, and the false positive rate increased by 45%. This confirms our hypothesis that a more accurate, context-aware predictive baseline is essential for minimizing false alarms and achieving high-fidelity pre-fault detection.

6.5. Computational Performance

The CEAD prototype was deployed on a server equipped with an NVIDIA A100 GPU. The context-aware forecasting module required approximately 15 min for daily retraining on newly collected data. The real-time anomaly detection component, which processed synchronized data streams from all 38 PMUs, achieved an average latency of 150 ms per time step. This latency covers the complete inference pipeline, including BERT-based context embedding, CNN feature extraction, LSTM forecasting, and anomaly score generation. Such performance demonstrates the system’s capability for real-time operational deployment.
Overall, the experimental results provide strong empirical support for the proposed framework. The implemented prototype confirms that integrating cognitive context with predictive modeling substantially enhances situational awareness. This outcome directly proves that the accuracy of our ’predicted healthy state’ is the key to enabling proactive anomaly detection, effectively validating the reliability of our data-driven baseline. This fundamental success enables a practical transition from reactive fault detection to proactive anomaly foresight.

7. Discussion

7.1. Technological Implications

The proposed CDT system represents a fundamental shift in managing critical infrastructure. The integration of LLMs and KGs creates unprecedented opportunities for autonomous reasoning and decision-making in critical infrastructure management. This technological convergence enables systems that can understand, learn, and adapt to complex operational environments.
The prediction-based anomaly detection approach fundamentally changes the paradigm from reactive fault management to proactive system optimization. By continuously comparing real-time conditions against predicted optimal states, the system can identify emerging issues before they manifest as system failures. This capability has profound implications for grid reliability, operational efficiency, and maintenance cost reduction.
The cognitive architecture’s ability to provide explainable decision-making addresses a critical limitation of traditional AI systems in critical infrastructure applications. Transparent reasoning chains enable operators to understand and validate autonomous actions, building trust and confidence in automated systems while maintaining human oversight capabilities.

7.2. Operational Benefits

Implementation of the CDT system offers substantial operational benefits across multiple dimensions. Improved prediction accuracy and extended forecast horizons enable better resource planning and risk management. The system’s ability to integrate diverse data sources and analytical techniques provides more comprehensive situational awareness than traditional approaches.
Autonomous decision-making capabilities reduce response times during critical events, potentially preventing cascading failures and minimizing service disruptions. The system’s 24/7 monitoring and analysis capabilities exceed human operator limitations, providing consistent performance regardless of time or operational stress levels.
Cost reduction opportunities emerge from optimized maintenance scheduling, improved asset utilization, and reduced emergency response requirements. The system’s predictive capabilities enable condition-based maintenance strategies that minimize both planned and unplanned outages while extending equipment lifespans.

7.3. Challenges and Limitations

Despite its promising capabilities, the CDT system faces several significant implementation challenges. System performance critically depends on data quality and availability. In practice, operational data is often fragmented across different systems, leading to inconsistencies. Furthermore, the rarity of pre-fault anomaly data makes it difficult to train robust predictive models. Future work must therefore prioritize advanced data fusion techniques and explore methods like self-supervised learning and data augmentation to address this data scarcity.
Beyond data challenges, the system’s computational requirements are also substantial. Real-time LLM processing and complex KG reasoning demand significant power, which can introduce unacceptable delays in time-critical grid operations. As the system scales to larger networks, these demands will only increase. Key solutions lie in developing lightweight AI models and adopting a distributed cloud-edge architecture, which processes data closer to the source to minimize latency.
As the system becomes more central to grid operations, its cybersecurity becomes paramount. The integration of AI introduces new vulnerabilities, such as data poisoning and adversarial attacks, where manipulated inputs can deceive the system into making critical errors. Mitigating these risks requires a focus on building Trustworthy AI. Future research should concentrate on enhancing model robustness through methods like adversarial training and exploring privacy-preserving frameworks like Federated Learning.
Finally, technical advancements must align with regulatory and compliance frameworks. The “black-box” nature of some AI models can conflict with the industry’s need for transparent and auditable decision-making, while the question of liability for autonomous actions remains unresolved. Our framework’s emphasis on an explainable “Decision Evidence Chain” is a direct response to this issue. The most practical path to deployment is a phased, human-in-the-loop approach, where the CDT initially functions as a sophisticated advisory tool. This strategy allows trust to be built and enables regulatory standards to evolve in step with the technology.

7.4. Scalability and Generalizability

The CDT architecture is designed for scalability across diverse power system sizes and configurations. It is built on strict modular design principles, dividing the framework into four distinct, loosely coupled layers: Sensory, Cognitive, Predictive, and Decision. This modularity provides three key advantages:
Selective Implementation and Resource Optimization: System components can be enabled or disabled based on specific operational needs. For example, a small grid can deploy a simplified DC Power Flow approximation instead of the full WLS AC State Estimator, maximizing utility while minimizing computational overhead.
Domain Adaptation: The Cognitive Core can be readily adapted to different power system contexts, such as a microgrid versus a large-scale transmission grid. This is achieved by updating its Knowledge Graph and fine-tuning the LLM to reflect the new context’s specific components and operational logic.
Future-proofing and Upgradability: Individual modules, such as the CNN-LSTM predictor, can be upgraded with new algorithms like a Transformer model without requiring a complete overhaul of the framework.
The true value of the CDT framework extends beyond the energy sector because its core principles are highly generalizable. At its heart, the system fuses unstructured text, like maintenance logs, with structured sensor data. This combined insight allows it to predict a highly accurate baseline of healthy system behavior. Deviations from this baseline, even minor ones, are then flagged as early warnings of potential future problems. This proactive approach can be applied directly to a smart water distribution network. Instead of reacting to a burst pipe, the system predicts the network’s normal pressure state. It then identifies any divergence from this state, empowering operators to find and fix a potential leak long before it becomes a critical failure.

7.5. Future Research Directions

Building on the proposed framework, future research will focus on enhancing the CDT to support robust and safe deployment in real-world operational environments. Three primary research directions are identified:
Large-scale Validation: While the prototype shows strong performance on historical data, its efficacy must be proven in a live environment. Deploying the system in a shadow mode, where it runs in parallel with existing controls, will provide a safe method for continuous evaluation. This long-term testing is essential for refining the models and building the necessary operator trust.
Uncertainty Quantification: Current AI models typically offer deterministic predictions, which lack a measure of confidence. To support high-stakes decisions, operators require a clear understanding of potential outcomes. Future work will therefore integrate techniques like Bayesian Neural Networks to provide probabilistic forecasts, enabling truly risk-aware decision-making.
Deep Integration with Emergency Response Systems: The CDT’s practical value can be significantly expanded through deeper integration with emergency response platforms. Future development will focus on standardized interfaces that allow seamless communication between the CDT and external systems. During severe weather events, an integrated CDT could automatically identify vulnerable assets, evaluate cascading risks, and recommend the strategic positioning of repair crews. Enhanced human–machine interfaces will ensure that these insights are conveyed clearly and can be acted on quickly.

8. Conclusions

This paper presents a comprehensive framework for transforming power system O&M through the development of CDT technology. The proposed system represents a fundamental paradigm shift from traditional data-driven approaches to cognitive-driven autonomous operations, integrating LLMs and KGs as cognitive cores for intelligent decision-making.
The core innovation of prediction-based anomaly detection enables proactive system management by continuously comparing real-time conditions against predicted optimal states. This approach transcends traditional reactive fault detection methods, achieving true “foresight” capabilities that can prevent system failures before they occur. The integration of diverse analytical techniques through intelligent module orchestration provides comprehensive coverage of operational scenarios while optimizing computational resources.
The comprehensive case study demonstrates the system’s practical capabilities during extreme weather events, showing how CDT technology can enhance grid resilience and enable autonomous response to complex operational challenges. The system’s ability to provide explainable decision-making builds operator confidence while maintaining appropriate human oversight of critical operations.
The technological implications extend beyond power systems to broader critical infrastructure management applications. The cognitive architecture principles and implementation approaches developed in this work provide a foundation for next-generation autonomous infrastructure management systems across multiple domains.
Future work will focus on large-scale implementation validation, advanced uncertainty quantification methods, and enhanced human–machine interaction capabilities. The continued evolution of AI technologies, particularly in natural language processing and knowledge representation, will further enhance the cognitive capabilities and operational effectiveness of DT systems.
The transition from forecasting to foresight represents more than a technological advancement; it embodies a fundamental transformation in how we conceptualize and manage critical infrastructure systems. The CDT framework provides a pathway toward truly autonomous, intelligent, and resilient power system operations for the new energy era.

Author Contributions

Conceptualization, X.W. and Z.C.; Methodology, X.W., Z.C. and H.J.; Software, Z.C., H.J. and S.L.; Validation, H.J., S.L. and Y.Z.; Formal Analysis, X.W. and S.L.; Investigation, X.W., Z.C., H.J. and S.L.; Resources, Y.Z., P.D. and J.G.; Data Curation, D.Z. and L.L.; Writing—Original Draft Preparation, X.W. and Z.C.; Writing—Review and Editing, Y.Z., D.Z., P.D., J.G., L.L. and H.W.; Visualization, D.Z.; Supervision, X.W. and H.W.; Project Administration, X.W. and H.W. All authors have read and agreed to the published version of the manuscript.

Funding

This research was funded by the Technology Development Project of Shenzhen Power Supply Bureau Co., Ltd., under the project “Key Technology Research on Industrial Power Consumption Analysis and Smart Marketing Applications” (Grant No. HX01202412105).

Institutional Review Board Statement

Not applicable.

Informed Consent Statement

Not applicable.

Data Availability Statement

The data presented in this study are available on request from the corresponding author. The data are not publicly available due to private reason.

Acknowledgments

The authors are thankful to the anonymous reviewers for their helpful comments to improve this manuscript.

Conflicts of Interest

Authors Xufeng Wu, Zuowei Chen, Hefang Jiang and Shoukang Luo were employed by the company Shenzhen Power Supply Bureau Co., Ltd. The remaining authors declare that the research was conducted in the absence of any commercial or financial relationships that could be construed as a potential conflict of interest. The authors declare that Shenzhen Power Supply Bureau Co., Ltd. had no role in the design of the study; in the collection, analyses, or interpretation of data; in the writing of the manuscript, or in the decision to publish the results.

References

  1. Mahmoud, M.A.; Md Nasir, N.R.; Gurunathan, M.; Raj, P.; Mostafa, S.A. The current state of the art in research on predictive maintenance in smart grid distribution network: Fault’s types, causes, and prediction methods—A systematic review. Energies 2021, 14, 5078. [Google Scholar] [CrossRef]
  2. Aslam, S.; Aung, P.P.; Rafsanjani, A.S.; Majeed, A.P.A. Machine learning applications in energy systems: Current trends, challenges, and research directions. Energy Inform. 2025, 8, 62. [Google Scholar] [CrossRef]
  3. Guato Burgos, M.F.; Morato, J.; Vizcaino Imacaña, F.P. A review of smart grid anomaly detection approaches pertaining to artificial intelligence. Appl. Sci. 2024, 14, 1194. [Google Scholar] [CrossRef]
  4. Lim, B.; Arık, S.Ö.; Loeff, N.; Pfister, T. Temporal fusion transformers for interpretable multi-horizon time series forecasting. Int. J. Forecast. 2021, 37, 1748–1764. [Google Scholar] [CrossRef]
  5. Jin, M.; Wang, S.; Ma, L.; Chu, Z.; Zhang, J.Y.; Shi, X.; Chen, P.Y.; Liang, Y.; Li, Y.F.; Pan, S.; et al. Time-llm: Time series forecasting by reprogramming large language models. arXiv 2023, arXiv:2310.01728. [Google Scholar]
  6. Madani, S.; Tavasoli, A.; Astaneh, Z.K.; Pineau, P.O. Large Language Models integration in Smart Grids. arXiv 2025, arXiv:2504.09059. [Google Scholar] [CrossRef]
  7. Wang, J.; Wang, X.; Ma, C.; Kou, L. A survey on the development status and application prospects of knowledge graph in smart grids. IET Gener. Transm. Distrib. 2021, 15, 383–407. [Google Scholar] [CrossRef]
  8. Lim, K.Y.H.; Yosal, T.S.; Chen, C.H.; Zheng, P.; Wang, L.; Xu, X. Graph-enabled cognitive digital twins for causal inference in maintenance processes. Int. J. Prod. Res. 2024, 62, 4717–4734. [Google Scholar] [CrossRef]
  9. Zhao, Y.; Smidts, C. Reinforcement learning for adaptive maintenance policy optimization under imperfect knowledge of the system degradation model and partial observability of system states. Reliab. Eng. Syst. Saf. 2022, 224, 108541. [Google Scholar] [CrossRef]
  10. Gao, S.; Yu, K.; Yang, Y.; Yu, S.; Shi, C.; Wang, X.; Tang, N.; Zhu, H. Large language model powered knowledge graph construction for mental health exploration. Nat. Commun. 2025, 16, 7526. [Google Scholar] [CrossRef]
  11. Smith, J.; Johnson, M. Cognitive Digital Twin for Power System Operations: A Comprehensive Review. IEEE Trans. Smart Grid 2023, 14, 1234–1245. [Google Scholar]
  12. Mihai, S.; Yaqoob, M.; Hung, D.V.; Davis, W.; Towakel, P.; Raza, M.; Karamanoglu, M.; Barn, B.; Shetve, D.; Prasad, R.V.; et al. Digital Twins: A Survey on Enabling Technologies, Challenges, Trends and Future Prospects. IEEE Commun. Surv. Tutor. 2022, 24, 2255–2291. [Google Scholar] [CrossRef]
  13. Sepasgozar, S.; Khan, A.; Smith, K.; Romero, J.; Shen, X.; Shirowzhan, S.; Li, H.; Tahmasebinia, F. BIM and Digital Twin for Developing Convergence Technologies as Future of Digital Construction. Buildings 2023, 13, 441. [Google Scholar] [CrossRef]
  14. Verdouw, C.; Tekinerdogan, B.; Beulens, A.; Wolfert, S. Digital Twins in Smart Farming. Agric. Syst. 2021, 189, 103046. [Google Scholar] [CrossRef]
  15. Pylianidis, C.; Osinga, S.; Athanasiadis, I.N. Introducing Digital Twins to Agriculture. Comput. Electron. Agric. 2021, 184, 105942. [Google Scholar] [CrossRef]
  16. Li, H.; Hong, T. A Digital Twin Platform for Building Performance Monitoring and Optimization: Performance Simulation and Case Studies. Build. Simul. 2025, 18, 1561–1579. [Google Scholar] [CrossRef]
  17. Choobkar, S.; Mohsen Hashemi, S. Digital Twin Technology for Smart Grid; SpringerBriefs in Energy, Springer Nature: Cham, Switzerland, 2025. [Google Scholar] [CrossRef]
  18. Li, Z.; Wang, H.; Peng, M.; Xu, R.; Yu, Y.; Zhou, G. Digital Twin Based Operation Support System of Nuclear Power Plant. In Proceedings of the 2022 IEEE 2nd International Conference on Digital Twins and Parallel Intelligence (DTPI), Boston, MA, USA, 24–28 October 2022; pp. 1–6. [Google Scholar] [CrossRef]
  19. Al Faruque, M.A.; Muthirayan, D.; Yu, S.Y.; Khargonekar, P.P. Cognitive Digital Twin for Manufacturing Systems. In Proceedings of the 2021 Design, Automation & Test in Europe Conference & Exhibition (DATE), Grenoble, France, 14 September 2021; pp. 440–445. [Google Scholar] [CrossRef]
  20. Zheng, X.; Lu, J.; Kiritsis, D. The Emergence of Cognitive Digital Twin: Vision, Challenges and Opportunities. Int. J. Prod. Res. 2022, 60, 7610–7632. [Google Scholar] [CrossRef]
  21. Yao, Z.; Wu, H.; Song, Y.; Cheng, Y.; Pan, H.; Wu, M.; Li, M.; Qin, G.; Wang, Q.; Zhang, X. Surrogate Model-Based Cognitive Digital Twin for Smart Remote Maintenance of Fusion Reactor: Modeling and Implementation. Nucl. Fusion 2024, 64, 126007. [Google Scholar] [CrossRef]
  22. Zheng, X.; Petrali, P.; Lu, J.; Turrin, C.; Kiritsis, D. RMPFQ: A Quality-Oriented Knowledge Modelling Method for Manufacturing Systems Towards Cognitive Digital Twins. Front. Manuf. Technol. 2022, 2, 901364. [Google Scholar] [CrossRef]
  23. Li, X.; He, B.; Wang, Z.; Zhou, Y.; Li, G. Towards Cognitive Digital Twin System of Human-Robot Collaboration Manipulation. IEEE Trans. Autom. Sci. Eng. 2024, 22, 6677–6690. [Google Scholar] [CrossRef]
  24. Adu-Kankam, K.O.; Camarinha-Matos, L.M. Modeling Collaborative Behaviors in Energy Ecosystems. Computers 2023, 12, 39. [Google Scholar] [CrossRef]
  25. Diao, J.; Tang, R.; Gu, Y.; Tian, S.; Jiang, Z. Cognitive-Digital-Twin-Based Driving Assistance. IEEE Robot. Autom. Lett. 2023, 8, 5188–5195. [Google Scholar] [CrossRef]
  26. Zhang, N.; Bahsoon, R.; Theodoropoulos, G. Towards Engineering Cognitive Digital Twins with Self-Awareness. In Proceedings of the 2020 IEEE International Conference on Systems, Man, and Cybernetics (SMC), Toronto, ON, Canada, 11–14 October 2020; p. 3891. [Google Scholar] [CrossRef]
  27. Khan, S.; Farnsworth, M.; McWilliam, R.; Erkoyuncu, J. On the Requirements of Digital Twin-Driven Autonomous Maintenance. Annu. Rev. Control 2020, 50, 13–28. [Google Scholar] [CrossRef]
  28. Liu, G.; Deng, J.; Zhu, Y.; Li, N.; Han, B.; Wang, S.; Rui, H.; Wang, J.; Zhang, J.; Cui, Y.; et al. 6G Autonomous Radio Access Network Empowered by Artificial Intelligence and Network Digital Twin. Front. Inf. Technol. Electron. Eng. 2025, 26, 161–213. [Google Scholar] [CrossRef]
  29. Chen, X.; Eder, M.A.; Shihavuddin, A. A Concept for a Human-Cyber-Physical System toward Intelligent Wind Turbine Operation and Maintenance. Sustainability 2021, 13, 561. [Google Scholar] [CrossRef]
  30. Cavus, M. Advancing Power Systems with Renewable Energy and Intelligent Technologies: A Comprehensive Review on Grid Transformation and Integration. Electronics 2025, 14, 1159. [Google Scholar] [CrossRef]
  31. Binbusayyis, A.; Sha, M. Energy Consumption Prediction Using Modified Deep CNN-Bi LSTM with Attention Mechanism. Heliyon 2025, 11, e41507. [Google Scholar] [CrossRef]
  32. Ganesh, P.M.J.; Sundaram, B.M.; Balachandran, P.K.; Zainuri, M.A.A.M. Syner-Dandelion Optimization Integrated Temporal Recurrent Transformer Network for Accurate Energy Load Forecasting in IoT-Smart Grids. IEEE Internet Things J. 2025, 12, 41752–41770. [Google Scholar] [CrossRef]
  33. Kim, H.J.; Kim, M.K. Spatial-Temporal Graph Convolutional-Based Recurrent Network for Electric Vehicle Charging Stations Demand Forecasting in Energy Market. IEEE Trans. Smart Grid 2024, 15, 3979–3993. [Google Scholar] [CrossRef]
  34. Li, H.; Qu, H.; Tan, X.; You, L.; Zhu, R.; Fan, W. UrbanEV: An Open Benchmark Dataset for Urban Electric Vehicle Charging Demand Prediction. Sci. Data 2025, 12, 523. [Google Scholar] [CrossRef] [PubMed]
  35. Hussain, I.; Ching, K.B.; Uttraphan, C.; Tay, K.G.; Noor, A. Evaluating Machine Learning Algorithms for Energy Consumption Prediction in Electric Vehicles: A Comparative Study. Sci. Rep. 2025, 15, 16124. [Google Scholar] [CrossRef] [PubMed]
  36. Zhang, T.; Zhao, W.; He, Q.; Xu, J. Optimization of Microgrid Dispatching by Integrating Photovoltaic Power Generation Forecast. Sustainability 2025, 17, 648. [Google Scholar] [CrossRef]
  37. Ma, H.; Saha, T.K.; Ekanayake, C.; Martin, D. Smart Transformer for Smart Grid—Intelligent Framework and Techniques for Power Transformer Asset Management. IEEE Trans. Smart Grid 2015, 6, 1026–1034. [Google Scholar] [CrossRef]
  38. Alhanaf, A.S.; Farsadi, M.; Balik, H.H. Fault Detection and Classification in Ring Power System With DG Penetration Using Hybrid CNN-LSTM. IEEE Access 2024, 12, 59953–59975. [Google Scholar] [CrossRef]
  39. Anwar, T.; Mu, C.; Yousaf, M.Z.; Khan, W.; Khalid, S.; Hourani, A.O.; Zaitsev, I. Robust Fault Detection and Classification in Power Transmission Lines via Ensemble Machine Learning Models. Sci. Rep. 2025, 15, 2549. [Google Scholar] [CrossRef]
  40. Quiles-Cucarella, E.; Sánchez-Roca, P.; Agustí-Mercader, I. Performance Optimization of Machine-Learning Algorithms for Fault Detection and Diagnosis in PV Systems. Electronics 2025, 14, 1709. [Google Scholar] [CrossRef]
  41. Mahmoud, R.A. Transmission Line Faults Detection and Classification Using New Tripping Characteristics Based on Statistical Coherence for Current Measurements. Sci. Rep. 2025, 15, 8487. [Google Scholar] [CrossRef]
  42. Dubey, K.; Jena, P. Novel Fault Detection & Classification Index for Active Distribution Network Using Differential Components. IEEE Trans. Ind. Appl. 2024, 60, 4530–4540. [Google Scholar] [CrossRef]
  43. Lu, G.; Liu, S.; Xie, F.; Wang, Y.; Wu, M.; Kang, Y. Sensitivity Enhancement via Tellegen’s Quasi-power Theorem: A New Method for Transformer Early Fault Detection. IEEE Trans. Power Deliv. 2025. [Google Scholar] [CrossRef]
  44. Hou, C.; Lou, A.; Wu, Y.; Luan, A.; Shao, S. An Enhanced Over-Current Fault Detection System for a 7.2 kV Power Module Using Series-Connected SiC MOSFETs. In Proceedings of the 2025 IEEE Workshop on Wide Bandgap Power Devices and Applications in Asia (WiPDA Asia), Beijing, China, 10–12 November 2025; pp. 1–5. [Google Scholar] [CrossRef]
  45. M K P, M.R.; Ahmad, M.W. A Robust Open Circuit Fault Detection and Localization Scheme for HERIC PV Inverter. IEEE Trans. Ind. Electron. 2025, 72, 8633–8645. [Google Scholar] [CrossRef]
  46. Kim, B.; Kim, M.; Kim, W.; Park, H.P. DC Series Arc Fault Detection Capability with Frequency Spectrum Analysis Using LCL-Type Boost Converter for PV Applications. IEEE Trans. Energy Convers. 2025, 40, 2205–2216. [Google Scholar] [CrossRef]
  47. Li, M.; Yu, D.; Yu, S.S.; Li, X.; Geng, H. Enhanced Fault Detection, Localization, and Tolerance Strategy for Dual Active Bridge DC–DC Converters Through Frequency-Domain Analysis of Remote Voltage. IEEE Trans. Ind. Electron. 2025, 72, 10847–10858. [Google Scholar] [CrossRef]
  48. Pandey, A.K.; Kishor, N.; Mohanty, S.R.; Samuel, P. Intelligent Fault Detection and Classification for an Unbalanced Network With Inverter-Based DG Units. IEEE Trans. Ind. Inform. 2024, 20, 7325–7334. [Google Scholar] [CrossRef]
  49. Lin, W.; Miao, X.; Chen, J.; Duan, P.; Ye, M.; Xu, Y.; Liu, X.; Jiang, H.; Lu, Y. Fault Detection for Ex-Core Neutron Detectors in Nuclear Power Plants Using Global-Fused Dynamic Detection Model. IEEE Trans. Instrum. Meas. 2025, 74, 3511615. [Google Scholar] [CrossRef]
  50. Lin, W.; Miao, X.; Chen, J.; Ye, M.; Zhang, L.; Xu, Y.; Liu, X.; Jiang, H.; Lu, Y. ST-SAM: Spatial-Temporal State Adaptation Model for Neutron Detector Fault Detection and Isolation in Nuclear Power Plants. IEEE Trans. Ind. Inform. 2025, 21, 1110–1119. [Google Scholar] [CrossRef]
  51. Tan, J.; Radhi, R.M.; Shirini, K.; Gharehveran, S.S.; Parisooz, Z.; Khosravi, M.; Azarinfar, H. Innovative Framework for Fault Detection and System Resilience in Hydropower Operations Using Digital Twins and Deep Learning. Sci. Rep. 2025, 15, 15669. [Google Scholar] [CrossRef] [PubMed]
  52. Shi, X.; Fang, F.; Qiu, R. Data-Driven Modeling in Digital Twin for Power System Anomaly Detection. Digit. Twin 2024, 4, 5. [Google Scholar] [CrossRef]
  53. Zhang, Y.; Pang, X.; Song, Y.; Wang, Y.; Zhou, Y.; Zhu, H.; Zhang, L.; Fan, Y.; Guo, Z.; Huang, S.; et al. Optical Power Control for GSNR Optimization Based on C+L-Band Digital Twin Systems. J. Light. Technol. 2024, 42, 95–105. [Google Scholar] [CrossRef]
  54. Wang, X.; Feng, M.; Qiu, J.; Gu, J.; Zhao, J. From news to forecast: Integrating event analysis in llm-based time series forecasting with reflection. Adv. Neural Inf. Process. Syst. 2024, 37, 58118–58153. [Google Scholar]
  55. Wang, L.; Zhang, W. Prediction-Based Anomaly Detection in Power Grid Operations. In Proceedings of the IEEE Power & Energy Society General Meeting, Orlando, FL, USA, 16–20 July 2023; IEEE: New York, NY, USA, 2023; pp. 1–5. [Google Scholar]
  56. Baek, M.; Seo, Y. Hybrid forecasting of university electricity demand using time series and deep learning. Energy Build. 2025, 347, 116400. [Google Scholar] [CrossRef]
  57. Zhang, L.; Jánošík, D. Enhanced short-term load forecasting with hybrid machine learning models: CatBoost and XGBoost approaches. Expert Syst. Appl. 2024, 241, 122686. [Google Scholar] [CrossRef]
  58. Wang, F.; Jiang, Y.; Zhang, R.; Wei, A.; Xie, J.; Pang, X. A survey of deep anomaly detection in multivariate time series: Taxonomy, applications, and directions. Sensors 2025, 25, 190. [Google Scholar] [CrossRef] [PubMed]
  59. Pappas, S.S.; Ekonomou, L.; Karamousantas, D.C.; Chatzarakis, G.; Katsikas, S.; Liatsis, P. Electricity demand loads modeling using AutoRegressive Moving Average (ARMA) models. Energy 2008, 33, 1353–1360. [Google Scholar] [CrossRef]
  60. Hong, W.C. Electric load forecasting by support vector model. Appl. Math. Model. 2009, 33, 2444–2454. [Google Scholar] [CrossRef]
  61. Liu, Y.; Hu, T.; Zhang, H.; Wu, H.; Wang, S.; Ma, L.; Long, M. itransformer: Inverted transformers are effective for time series forecasting. arXiv 2023, arXiv:2310.06625. [Google Scholar]
  62. Liu, F.T.; Ting, K.M.; Zhou, Z.H. Isolation-based anomaly detection. ACM Trans. Knowl. Discov. Data (TKDD) 2012, 6, 1–39. [Google Scholar] [CrossRef]
  63. Sakurada, M.; Yairi, T. Anomaly detection using autoencoders with nonlinear dimensionality reduction. In Proceedings of the MLSDA 2014 2nd Workshop on Machine Learning for Sensory Data Analysis, Gold Coast, QLD, Australia, 2 December 2014; pp. 4–11. [Google Scholar]
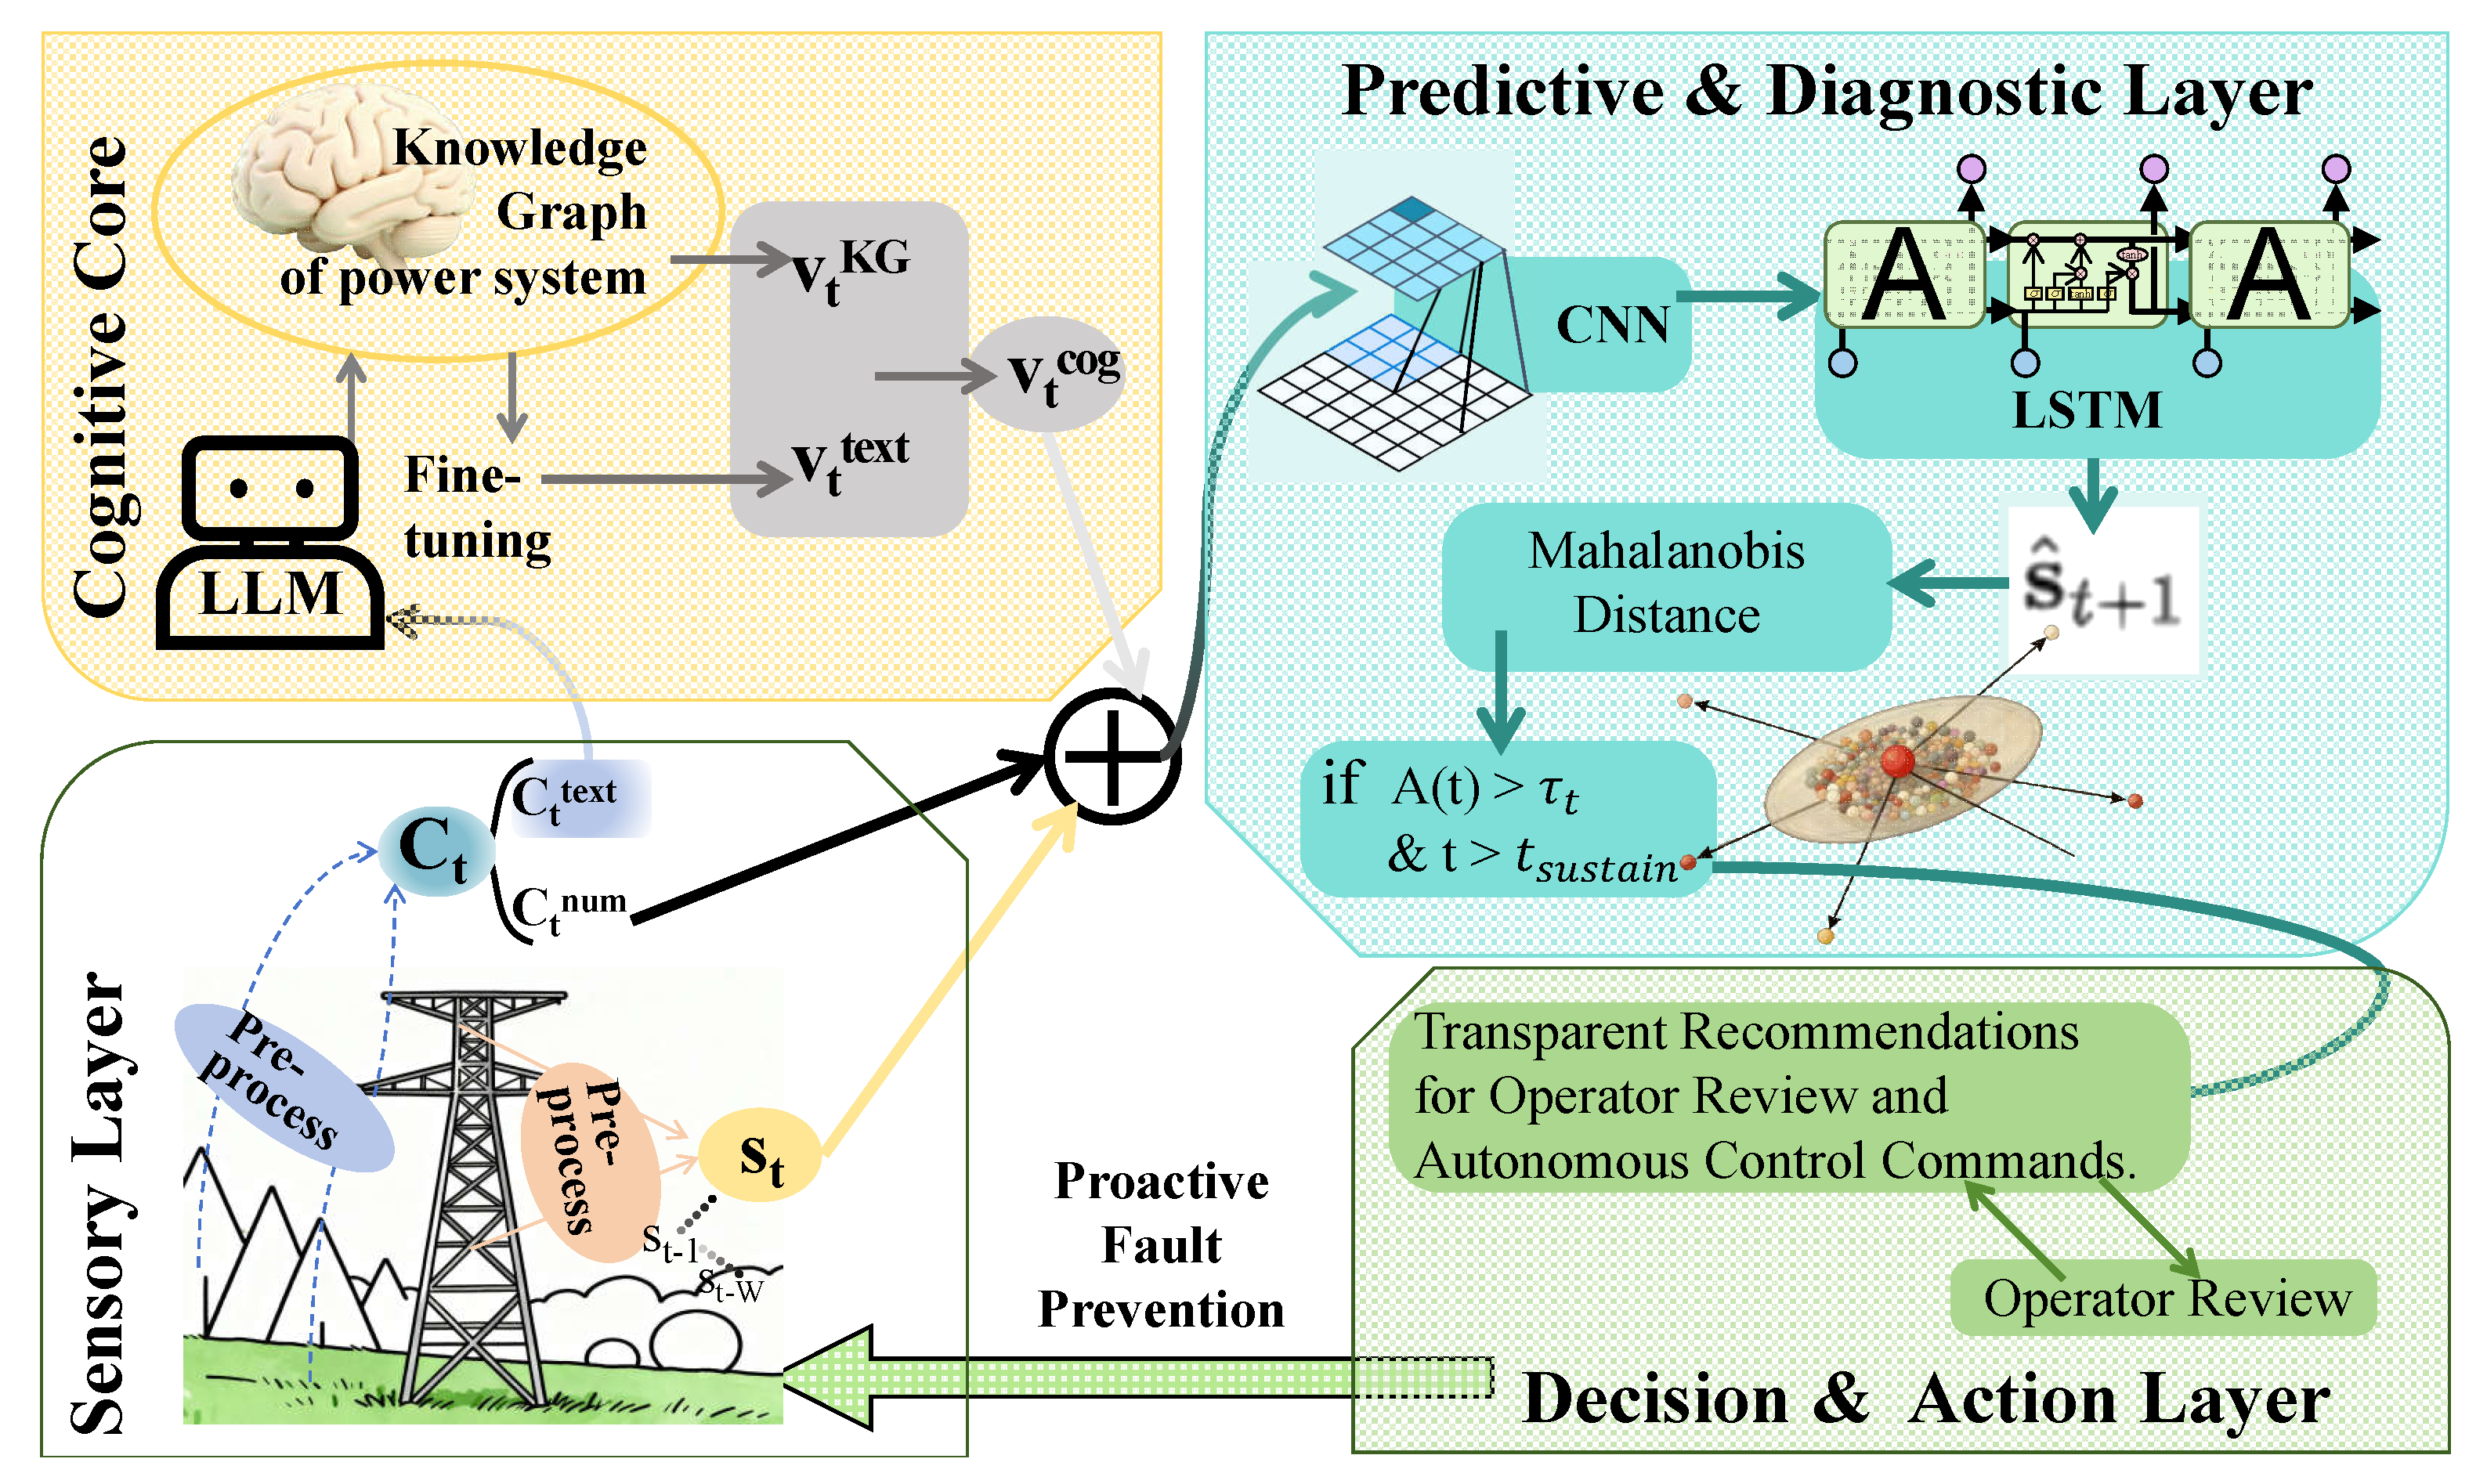
Figure 1. CDT architecture for power systems. The framework consists of four integrated layers: Sensory Layer for data acquisition, Cognitive Core for intelligent reasoning, Predictive Layer for forecasting and anomaly detection, and Decision Layer for control actions and optimization.
Electronics 14 04537 g001
Figure 2. Load forecasting performance during a scheduled generator outage event. The context-aware CEAD model accurately captures the load drop, unlike the Standard LSTM.
Electronics 14 04537 g002
Figure 3. Comprehensive performance comparison. Anomaly detection accuracy comparison demonstrating CEAD’s effectiveness in pre-fault detection.
Electronics 14 04537 g003
Figure 4. Visualization of pre-fault anomaly detection. The upper subplot shows the actual PMU voltage magnitude (blue) and the predicted healthy signal (red dashed line), with the fault occurring at T = 0. The lower subplot illustrates the detection mechanism: the DTW distance (blue) quantifies the divergence between the two signals. Anomaly inception occurs at T = −5.0 s, where the DTW distance first crosses the dynamic threshold (red dashed line). A definitive pre-fault alarm is triggered at T = −2.5 s.
Electronics 14 04537 g004
Table 1. Comparative performance of 1-h-ahead load forecasting models.
ModelMAPE (%)RMSE (MW)
ARIMA4.12112.5
SVR3.5898.7
Standard LSTM2.1561.3
Temporal Fusion Transformer1.9555.0
iTransformer1.8050.5
CEAD (Context-Aware)1.4139.6
Table 2. Performance comparison for pre-fault anomaly detection.
ModelPrecision (%)Recall (%)F1-Score (%)Avg. Detection Time (s)
Thresholding72.468.570.4>5.0 (Missed)
Isolation Forest81.375.978.53.8
Autoencoder85.783.384.53.1
TFT-based Detector90.088.089.02.7
CEAD94.192.693.32.2
Disclaimer/Publisher’s Note: The statements, opinions and data contained in all publications are solely those of the individual author(s) and contributor(s) and not of MDPI and/or the editor(s). MDPI and/or the editor(s) disclaim responsibility for any injury to people or property resulting from any ideas, methods, instructions or products referred to in the content.