Article

Enabling Super-Resolution Quantitative Phase Imaging via OpenSRQPI—A Standardized Plug-and-Play Open-Source Tool for Digital Holographic Microscopy with Structured and Oblique Illumination

Optical Imaging Research Laboratory, Department of Electrical and Computer Engineering, University of Massachusetts Dartmouth, Dartmouth, MA 02747-2300, USA
*
Author to whom correspondence should be addressed.
Electronics 2025, 14(22), 4513; https://doi.org/10.3390/electronics14224513
Submission received: 2 October 2025 / Revised: 3 November 2025 / Accepted: 11 November 2025 / Published: 19 November 2025

Abstract

Accurate and label-free quantitative phase imaging (QPI) plays a crucial role in advancing diagnostic techniques that streamline histology and diagnostic procedures by minimizing sample preparation time, resources, and requirements. Although Digital Holographic Microscopy (DHM) has become a prominent tool within QPI, its diffraction-limited resolution has hindered broader adoption of QPI-DHM. The use of structured and oblique illumination in DHM platforms has overcome the resolution limit, advancing QPI-DHM technology to super-resolution QPI. Despite demonstrated success, adoption of super-resolution DHM (SR-DHM) in clinical and biomedical research remains limited by the absence of a standardized reconstruction algorithm capable of delivering quantitatively accurate, distortion-free super-resolved phase images. This work presents OpenSRQPI, the first standardized computational framework for super-resolution phase reconstruction in DHM systems, whether using structured or oblique illumination. Through its intuitive graphical user interface (GUI) and minimal parameter requirements, OpenSRQPI reduces the technical barrier for non-experts, making super-resolution QPI broadly accessible, enabling new studies of live-cell dynamics, subcellular structure, and tissue morphology.

1. Introduction

Quantitative Phase Imaging (QPI) has established itself as a transformative tool across a wide spectrum of disciplines, particularly in biology [1,2,3,4], biomedical research [5,6,7,8,9,10,11], and material science [12,13,14,15,16], for its ability to non-invasively measure optical path length differences in transparent samples. Altogether, QPI bridges basic and translational research by enabling quantitative analysis of structure–function relationships in both living systems and engineered materials.
Among the various QPI techniques [17,18,19,20,21], digital holographic microscopy (DHM) stands out for its ability to simultaneously capture amplitude and phase information in a single image, enabling real-time, label-free imaging of dynamic biological processes without the need for mechanical scanning or sequential acquisitions [18,22,23,24]. Thereby, DHM is ideal for live-cell imaging and high-throughput applications thanks to its rapid acquisition and reconstruction. Beyond its three-dimensional (3D) reconstruction capability, DHM is compatible with a variety of optical configurations and can be integrated into dual- and multi-modal platforms [25], providing a comprehensive understanding of complex biological and physical phenomena.
Despite its many advantages, DHM is fundamentally limited in spatial resolution by the diffraction limit [26], constraining its ability to resolve subcellular structures smaller than approximately half the wavelength of light. To overcome this barrier, techniques such as Structured Illumination (SI) and Oblique Illumination (OI) have been successfully integrated with DHM to achieve super-resolved quantitative phase imaging (SR-QPI) beyond the diffraction limit [27,28,29,30,31]. While OI-DHM leverages the angle-dependent information encoded by tilted wavefronts to retrieve high-frequency content, SI-DHM modulates the illumination pattern into periodic patterns. Although these approaches extend the system’s compact support in the frequency domain, thereby improving resolution, their performance depends critically on the computational framework—including frequency filtering, demodulation, phase compensation, and image fusion. Each of these steps can introduce artifacts, phase inaccuracies, or resolution loss if not properly optimized. Moreover, the lack of standardized, user-friendly software has limited the broader adoption of SR-DHM methods across the broader biomedical, biological, and material research communities.
To address this gap, we introduce OpenSRQPI—an open-access, GUI-based computational platform for super-resolution reconstruction in QPI using both structured and oblique illumination. The novelty of our contribution lies in providing the first standardized and accessible framework dedicated to SR-QPI in DHM. By integrating all required steps—filtering, demodulation, phase compensation, and spectral fusion—into a physics-based, user-friendly interface, OpenSRQPI ensures reproducibility, preserves quantitative accuracy, and lowers the barrier for non-specialists. The platform serves as a benchmark tool for consistent evaluation of SR-QPI performance across different imaging conditions, enabling the broader translation of SR-QPI into biomedical and metrological applications. Due to the fundamental differences in data characteristics, transfer functions, and reconstruction objectives, existing fluorescence SIM tools [32,33,34] are not directly applicable to QPI. A detailed discussion of these differences is provided in Section S1 of the Supplementary Document.
While deep-learning-based methods for image restoration and super-resolution—such as the Super-Resolution Convolutional Neural Network [35] and optimization-based models like the adaptive half-quadratic function with local structure tensor weighted bilateral total variation (BTV) [36]—have demonstrated remarkable performance in intensity-based imaging, they are not directly applicable to DHM with structured or oblique illumination, where the goal is super-resolved phase reconstruction. Recent studies have applied deep learning to enhance SIM reconstructions [37,38,39,40] and to model the relationship between spatial and Fourier domains in complex samples under oblique illumination using the Joint Spatial–Fourier Channel Attention Network (JSFCAN) [41]. However, the JSFCAN model has not yet been evaluated for its QPI capability. The proposed OpenSRQPI framework provides an end-to-end, interpretable, and physics-grounded platform that reconstructs super-resolved quantitative phase and thickness maps directly from raw DHM images. As a benchmark tool, OpenSRQPI produces standardized datasets that can serve as a foundation for training and validating future deep-learning-based SR-QPI methods. By integrating physics-based principles with data-driven strategies, the proposed framework enhances methodological transparency and reproducibility, providing a critical platform for evaluating and comparing emerging learning-based SR-QPI approaches, such as JSFCAN, or more recent hybrid deep-learning frameworks [42] that combine convolutional neural networks with Transformer architectures to exploit cross-layer feature interaction for improved SR-QPI reconstruction.

2. OpenSRQPI Tool

The OpenSRQPI tool has been implemented in MATLAB R2025a using App Designer. The OpenSRQPI architecture follows a modular, event-driven design that separates the graphical interface, data management, and computational engine into distinct layers. The GUI layer handles all user interactions and communicates with a back-end numerical core composed of independent function modules, each dedicated to specific tasks such as Fourier operations, phase unwrapping, demodulation, and spectral fusion. This layered design not only improves maintainability and scalability but also facilitates rapid updates, integration of new reconstruction algorithms, and interoperability with other MATLAB-based imaging frameworks. The software requires the Optimization Toolbox, Global Optimization Toolbox, and Image Processing Toolbox and does not depend on GPU acceleration. The complete source code and executable version are freely available on GitHub—find the link in the Supplemental Material Section. The tool has also been compiled into a standalone executable using the MATLAB Compiler, so Windows users without a MATLAB license can run it by installing the free MATLAB Runtime. Two demonstration videos are available on YouTube, and a detailed user manual describing installation, GUI navigation, and example workflows is provided in the Supplemental Document. These resources ensure that the tool is readily available to the community and can be reliably adopted for both educational and research purposes.
The main file, OPEN_SR_QPI_APP.mlapp, defines the user interface and handles data management, while the computational tasks are delegated to a collection of modular MATLAB functions (e.g., FT.m, IFT.m, phase_unwrap.m, functions_evaluation.m, vortexCompensation.m, LegendreCompensation.m). Application state is maintained in App properties, where user inputs (e.g., pixel size, wavelength, filtering +1 region, number of images) and intermediate results (e.g., the compensated complex field) persist across callbacks. Figure 1 shows the overall workflow of the OpenSRQPI tool, which consists of six main modules: (1) input, (2) preprocessing, (3) demodulation, (4) phase compensation, (5) phase map reconstruction, and (6) visualization/export. Whereas all six modules are executed for SI-DHM, module 3 is skipped in the OI-DHM processing since the spectra of the +1 term in OI-DHM holograms are uniquely defined. This modular design allows each step to be tested independently of the GUI, ensuring reproducibility since identical holograms processed with the same parameters yield consistent results.
At its core, the reconstruction process isolates the +1 spectral order in the hologram, performs blind demodulation (for SI-DHM), compensates and centers the object spectra, and finally fuses them into a super-resolved quantitative phase map. Below, there is a description of each step of the processing pipeline (Figure 1) that the program executes:
  • Spectral Filtering for both SI- and OI-DHM: The first operation is the isolation of the +1 term in the hologram spectrum using a two-step strategy in which, firstly, a rectangular filter crops the quarter of the spectrum containing the +1 order as identified by the user earlier, and, secondly, a circular filter isolates the object spectrum frequencies. The circular filter is automatically determined using MATLAB’s findcircles function and applied to a binary spectrum generated with a threshold TH = mean + 0.8·STD, where the mean and standard deviation (STD) are estimated from a 60 × 60-px2 corner region representing the noise background of the Fourier transform. This threshold formula was empirically determined through testing with both noiseless and noisy simulated holograms. In all simulated cases, the compact support of the diffracted orders was clearly defined, and the selected threshold consistently isolated the correct spectral components. However, in experimental holograms—particularly at higher illumination angles—the visibility of the compact support decreases, and the current thresholding approach may not always ensure optimal isolation of the desired spectral region. Future releases of OpenSRQPI will address this limitation by incorporating a more robust, unsupervised spatial-filtering algorithm capable of reliably identifying and isolating spectral terms under varying illumination and noise conditions.
  • Blind Demodulation for SI-DHM mode: This demodulation step is based on the generalized SI-DHM framework, which automatically demodulates each laterally shifted object spectrum independently of the other without prior knowledge of the phase shifts between the recorded holograms [43]. The selection of the correct phase shift to properly decouple the two laterally shifted spectra is based on the minimization of a cost function that quantifies the ratio of the residual order’s magnitude to the total magnitude (sum of expected and residual orders), which is defined in Ref. [43], using MATLAB’s built-in particleswarm algorithm. Iterative Particle Swarm Optimization is a population-based stochastic optimization algorithm in which a set of candidate solutions (i.e., particles) move through the search space guided by both their own experience and the collective knowledge of the swarm. Each particle updates its velocity and position based on three components: its current momentum, the best solution it has found so far, and the best solution identified by any particle in the swarm. Through an iterative process, the swarm converges toward optimal or near-optimal solutions. The optimization options of the particleswarm algorithm are a swarm size (set to 4), a maximum number of iterations allowed (set to 500), and a termination tolerance on the cost function (set to 10−8 a.u.). The swarm size is 4 since a small swarm is sufficient to explore the 1D bounded search space domain. The maximum number of iterations is 500, balancing convergence reliability and computational cost. The termination tolerance of 10−8 a.u. is adopted to provide a strict convergence criterion since small angular deviations in the estimated phase shift can lead to significant phase errors in the reconstructed holograms. The optimal phase shift ranges between 0 and 2π, preventing the optimizer from exploring non-physical values. The rest of the parameters (i.e., inertia weight, cognitive/social coefficients, and velocity limits) remain at MATLAB’s standard settings. Because demodulation performance depends strongly on the data quality, the algorithm incorporates a verification stage to confirm the uniqueness of the demodulated laterally shifted replica before proceeding with the processing pipeline.
  • Phase compensation: The centering of the maximum peak in the laterally shifted object spectra to the zero frequency has been implemented using the high-order vortex-Legendre phase compensation [44], improving phase compensation accuracy (i.e., spatial invariance on the phase values) while maintaining computational efficiency. The order and mode of the Legendre polynomial to be compensated should be defined before starting the processing.
  • Spectral Normalization and Fusion: The next step focuses on combining the centered object spectra into an SR spectrum. Whereas the combination of these spectra is the direct summation in fluorescence-based SIM, in QPI, this process should be carefully implemented since each individual spectrum has its own and different dynamic range. This means that each individual spectrum should be normalized before summation, ensuring super-resolved QPI measurements. More details on the effects of this normalization are found in Ref. [45], where the QPI capability of the reconstructed SR phase distribution is analyzed and compared, both with and without normalizing each demodulated spectrum. Normalization ensures balance, but overlapping spectral content across angles can still distort frequency weighting. To address this, the combined SR spectrum is multiplied pixel-wise by a weighting mask, which is automatically generated to equalize the spectral content [31]. The inverse Fourier transform of this product provides the spatial complex SR distribution, from which the quantitative phase map can be directly obtained by computing the angle of this complex field. This resultant phase map retains QPI integrity while achieving resolution enhancement beyond the diffraction limit.
Both the reconstructed SR phase data and its spectrum are accessible through visualization tools embedded in the GUI. Users can simultaneously examine the quantitative sample thickness (in μm) and phase (in rad) map. Each panel features calibrated color bars to aid interpretation, while interactive controls allow users to adjust views and assess reconstruction quality. Beyond visualization, the application allows users to save all relevant outputs—including figures, numerical results, and metadata—so that reconstructions can be fully documented and reused for further analysis. Part of the metadata is an estimate of the lateral-resolution improvement based on the compact support of the SR spectrum relative to that of a single laterally shifted spectrum. Both SI and OI extend the system’s compact support in the frequency domain, thereby increasing the recoverable spatial frequencies and, consequently, the lateral resolution. Therefore, the measurement of the SR compact support’s extension provides an equivalent and direct measure of resolution improvement.
The design of OpenSRQPI ensures a transparent, user-guided workflow in which every stage of the reconstruction remains visible and controllable through the interface. However, any error in the processing steps can lead to erroneous reconstructed SR phase maps, which are most readily detected by inspecting the SR spectrum. For example, incorrect demodulation introduces additional peaks into the demodulated spectra and thus into the SR spectrum, appearing as high-frequency fringes in the reconstructed phase/thickness map. Under ideal conditions, the SR spectrum displays a symmetric “flower-like” pattern. Deviations from this symmetry—such as distorted or uneven petals—indicate errors in filtering and/or compensation. In noisy datasets, the +1 filtering step may fail to capture all spatial frequencies, producing petals of reduced size. In summary, the number of petals, their symmetry, their relative size, and the presence of spurious peaks within them serve as key indicators of reconstruction quality in the OpenSRQPI tool.
The computational performance of the OpenSRQPI framework was evaluated on a workstation equipped with a 13th Gen Intel® Core™ i9-13900K processor (3.00 GHz). For SI-DHM processing, the total memory usage reached 247.4 MB, of which 199.0 MB corresponded to the demodulation stage. The overall processing time for SI-DHM, including user interaction (uploading images and entering parameters), was 77.3 s, with demodulation alone requiring approximately 7 s. For OI-DHM processing, the total memory consumption was 178.5 MB, and the total execution time, including user input, was 22.6 s. All tests were performed using simulated images of size 1024 × 1024 pixels, with a total of six images per mode (six oblique angles for OI-DHM and three angles with two phase-shifted images per angle for SI-DHM).

3. Results

This section assesses the OpenSRQPI tool’s capability to produce super-resolved QPI images for DHM systems operating in either oblique illumination (OI) or structured illumination (SI) modes. Section S3 of the Supplemental Document presents a quantitative comparison between the OpenSRQPI tool and our original script-based implementation, confirming that OpenSRQPI delivers reproducible and high-fidelity SR-QPI reconstructions without requiring direct access to code-level details. In this section, we first examine the performance of OpenSRQPI for OI-DHM under ideal and noisy conditions, quantifying phase accuracy and robustness. We then analyze the performance of SI-DHM processing across different modulation frequencies and illumination angles to determine how these parameters affect the achievable super-resolution and quantitative phase fidelity. This structured progression—from OI-DHM validation to noise analysis and finally to SI-DHM parameter evaluation—provides a coherent framework for interpreting the results presented in Figure 2, Figure 3 and Figure 4.
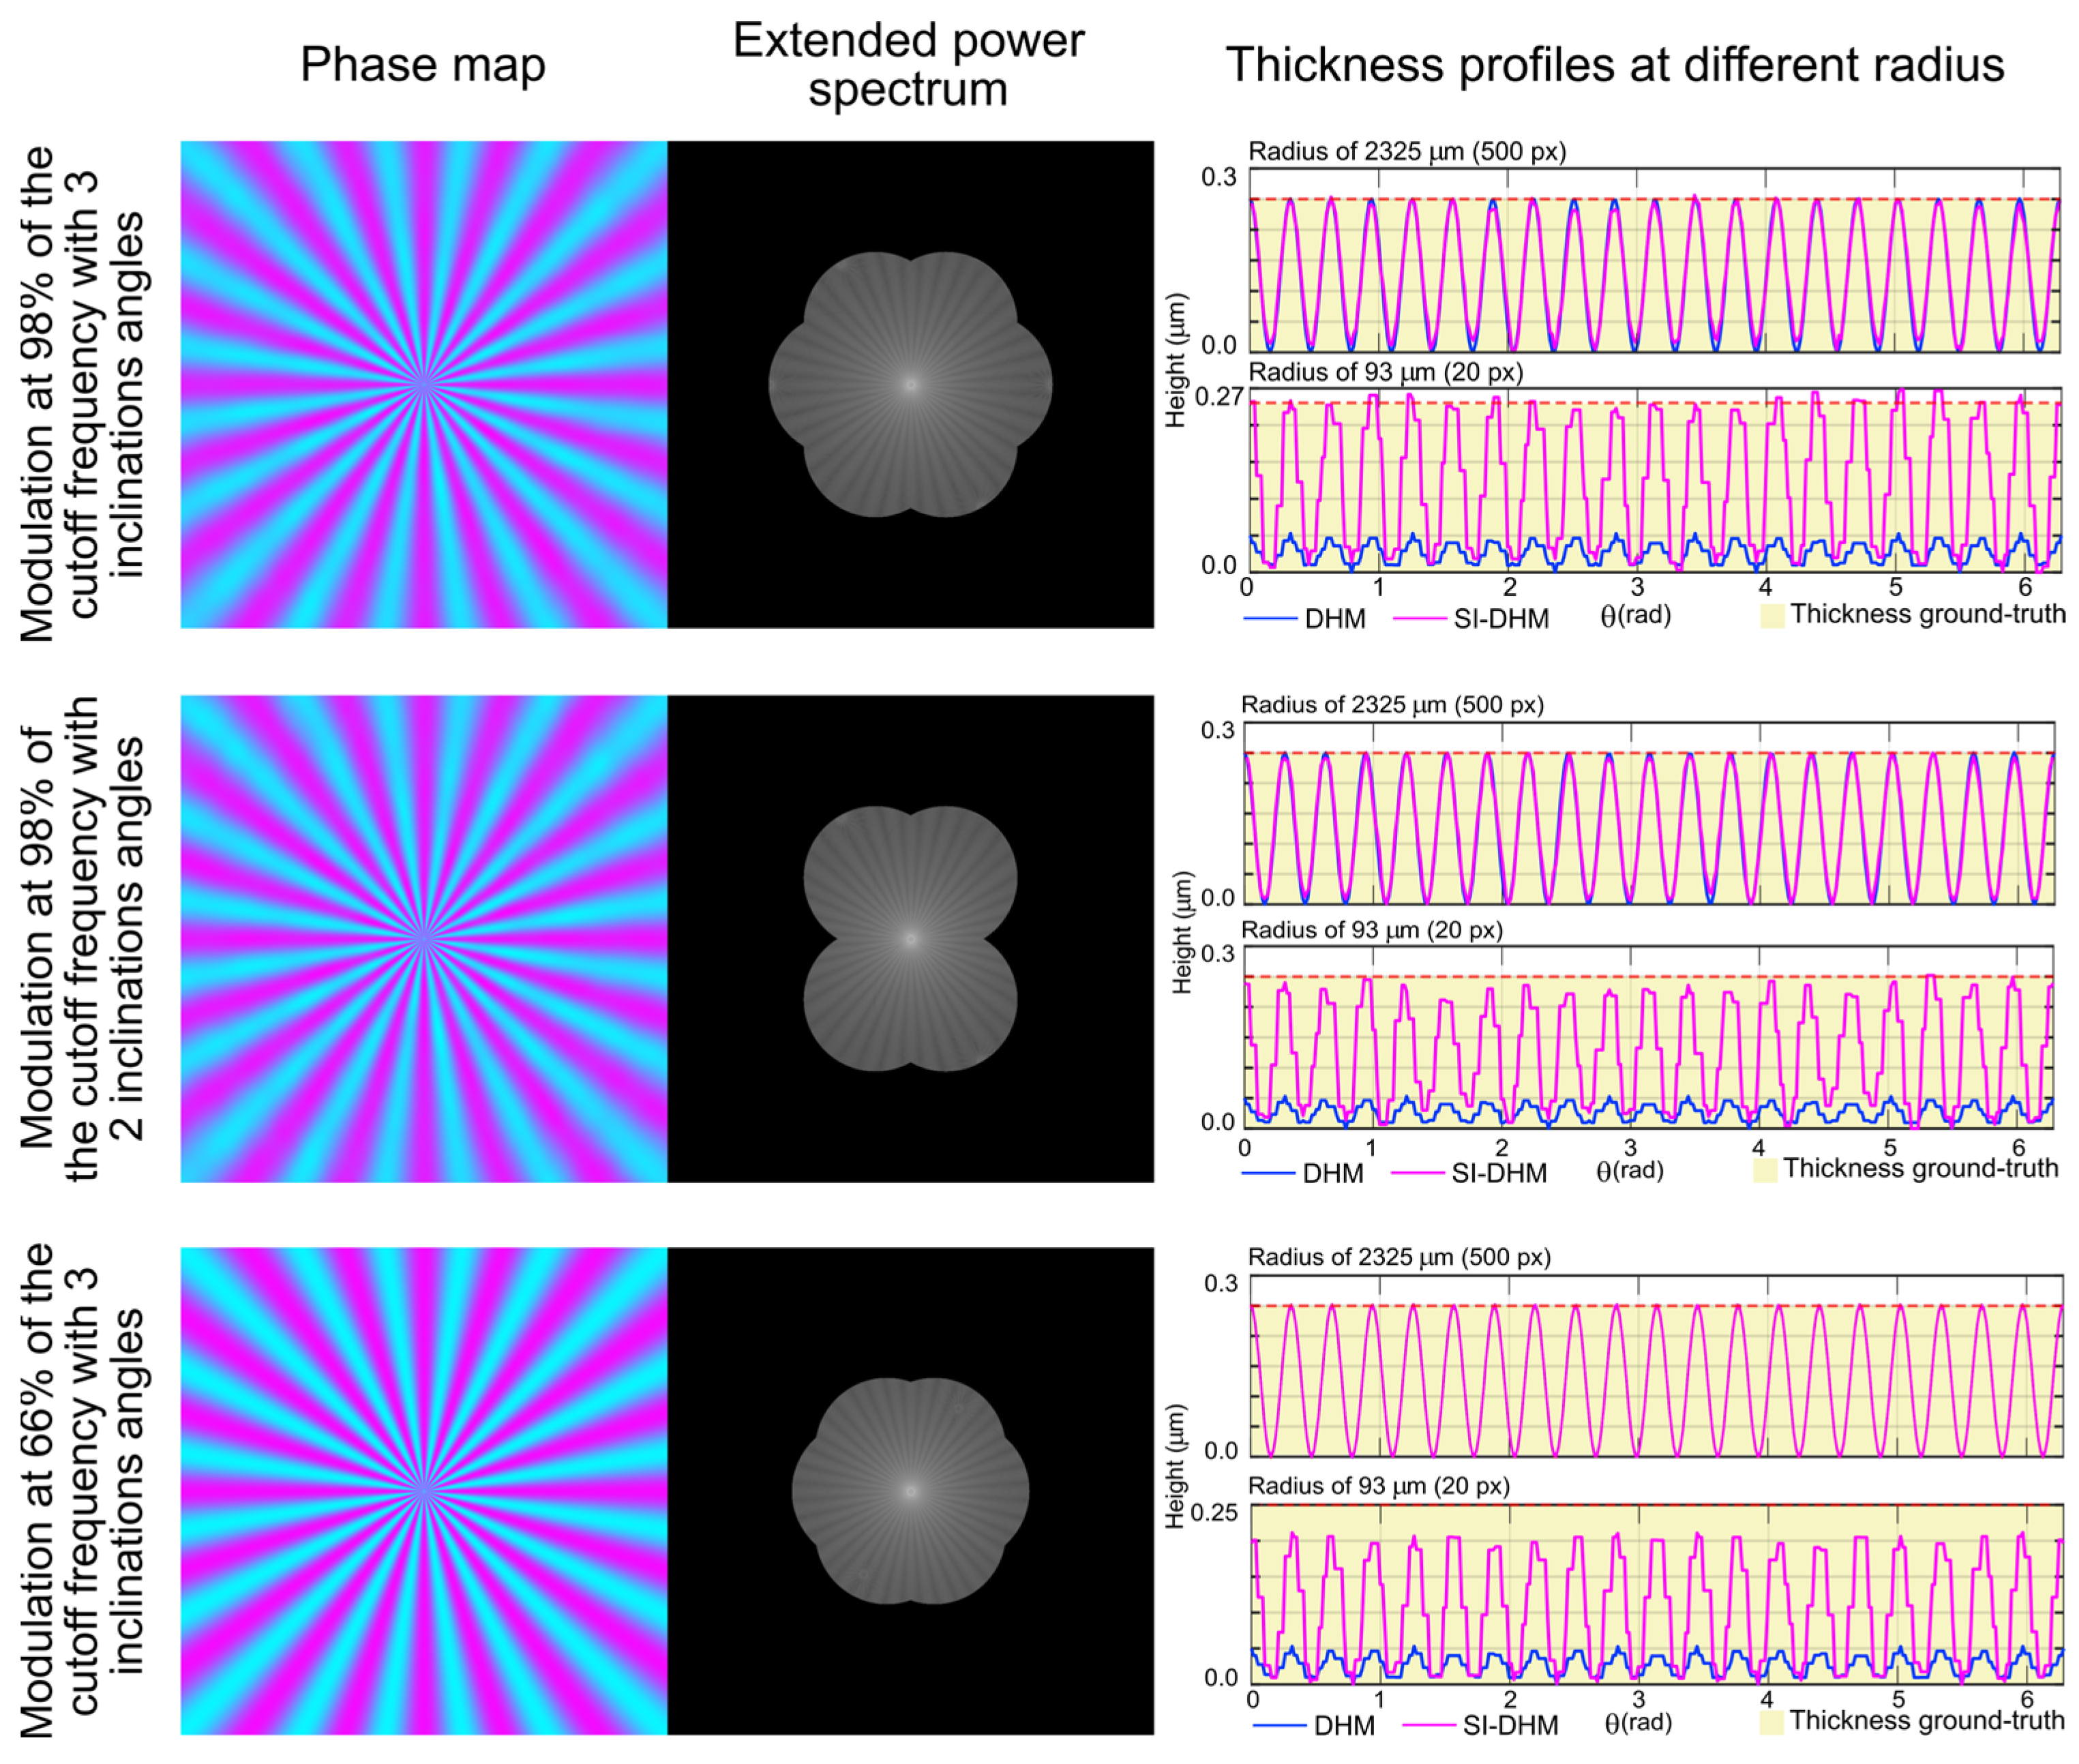
Figure 2 demonstrates the app’s performance for the OI-DHM processing in generating super-resolved and quantitative phase and thickness maps using a noiseless dataset. The app automatically detects the carrier frequencies of the OI-DHM holograms and reconstructs the complex field without requiring manual parameter adjustments, enabling direct quantitative phase and thickness retrieval with extended spectral coverage. Quantitative thickness profiles, extracted from the saved thickness maps using MATLAB, provide a direct means of evaluating reconstruction accuracy against the known ground truth. To provide a complete validation of the OpenSR QPI tool, the app is evaluated for two different modulation frequencies of the SI pattern (i.e., um = 0.98uc and um = 0.66uc, where uc is the cutoff frequency of the native DHM system) and different numbers of orientation angles of the OI pattern.
The two top panels in Figure 2 compare the SR improvement and QPI capability when um = 0.98uc for six (top panel) and four (middle panel) orientation angles of the oblique illumination. Clearly, the higher the number of OI orientation angles, the more the extended power spectrum exhibits a more isotropic angular coverage for the high spatial frequencies. Consequently, the reconstructed SR thickness profiles (magenta) closely follow the ground truth value (shadow region) at different radii, demonstrating both the SR improvement and QPI capability. The native DHM system, however, cannot accurately reconstruct quantitative thickness values at small radii. If the number of oblique illuminations decreases, the angular coverage of the extended power spectrum becomes more anisotropic, minimally affecting the resolution improvement in particular directions. Conversely, reducing the modulation frequency of the oblique illumination restricts the lateral coverage of the extended power spectrum, limiting the SR capability of the OI-DHM system.
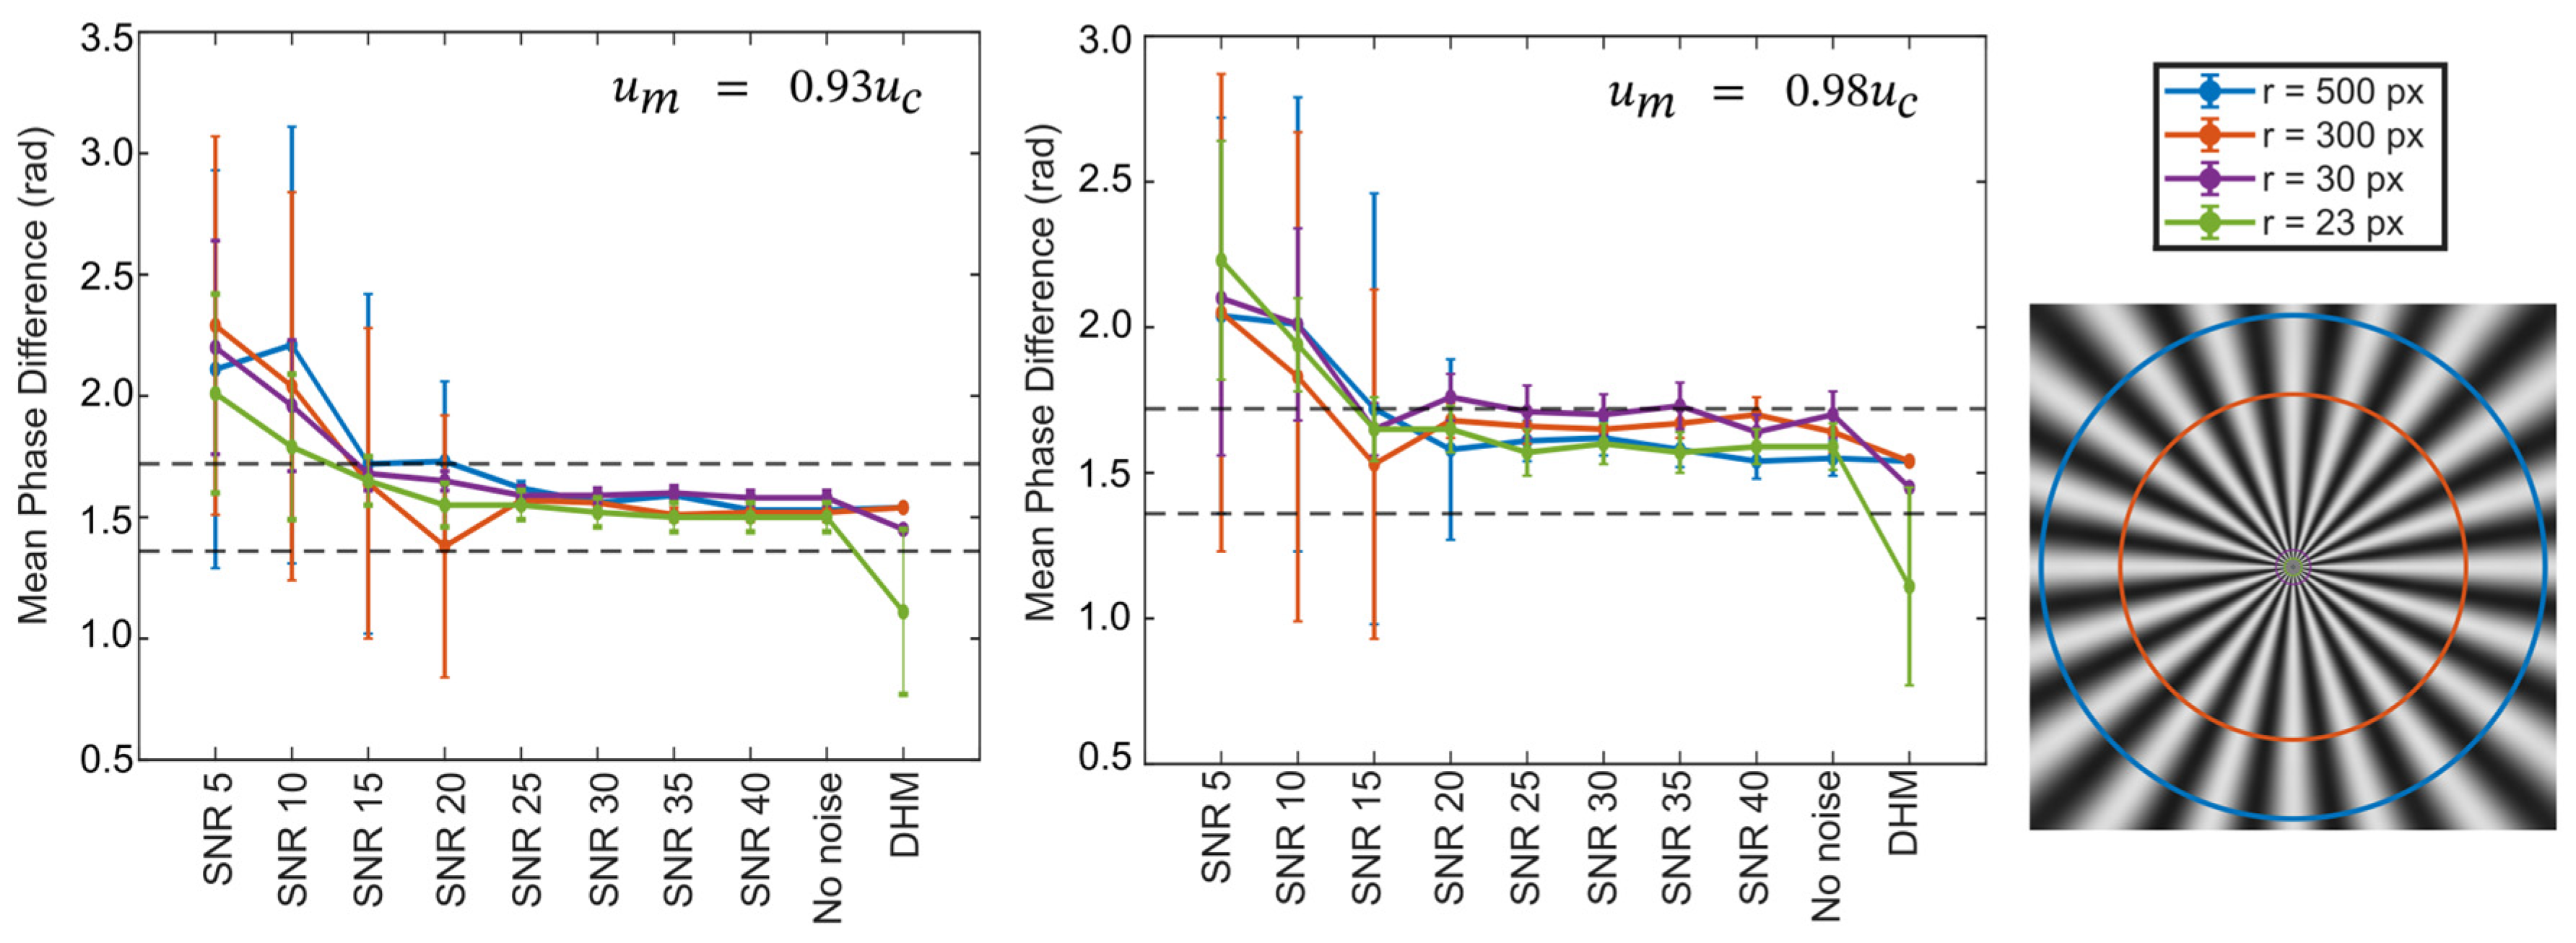
To finalize the analysis of the OpenSRQPI app for OI-DHM, we investigate the sensitivity of the proposed OpenSRQPI to noisy conditions in OI-DHM. Speckle noise in DHM originates from random phase fluctuations of the complex optical field, as described by Goodman’s statistical model [46]. For this study, additive white Gaussian noise was introduced as a first-order approximation of this random phase behavior using the MATLAB built-in function awgn. This simplification captures the random-phase perturbations induced by speckle, while enabling controlled simulations and quantitative evaluation of the reconstruction pipeline. While this does not fully reproduce the spatially correlated nature of experimental speckle, it provides a reproducible baseline for evaluating algorithm robustness under noisy phase conditions. Figure 3 shows the performance of the tool for noisy conditions, comparing the measured phase values (mean ± standard deviation) at different SNR values for different radii (i.e., frequency). For this study, the true phase value is φ =   1.535 rad, corresponding to a thickness of 250 nm, a source’s wavelength of 532 nm, a sample’s refractive index n s = 1.52 , and a refractive index of the surrounding medium n i m = 1 . Figure 3 also illustrates the intrinsic phase sensitivity of the DHM technique (±0.18 rad), consistent with typical sensitivity values reported in the literature [47]. Variations within this dashed-line interval (ground-truth phase ± sensitivity) fall within the inherent uncertainty of the instrument and therefore cannot be considered experimentally detectable. At a radius of 23 px, significant deviations are observed for native DHM reconstructions, as this distance lies beyond the diffraction limit and thus yields unreliable data. Based on the reported DHM sensitivity, reconstructed phase values at SNR ≥ 20 dB agree with the ground-truth within experimental error, providing accurate QPI measurements independently of the modulation frequency of the oblique illumination. In contrast, reconstructed phase values at SNR < 20 dB fall outside the acceptable range, in some cases exceeding the 5% error threshold. Overall, these results indicate that OpenSRQPI can reliably process OI-DH data with an SNR higher than 15 dB, enabling accurate phase retrieval under realistic noisy conditions. Note that this simplified model does not capture all coherent artifacts, and thus, the simulated SNR values may not exactly match those observed in experimental data. Nonetheless, the reconstruction methods implemented in OpenSRQPI—including blind demodulation [43,48] and spectrum centering [44]—have been previously validated using experimental DHM datasets, demonstrating consistent performance under realistic imaging conditions. In practice, OpenSRQPI remains robust as long as the compact support of the hologram is clearly visible, which defines the effective limit of reliable SNR for reconstruction.
Finally, the results in Figure 4 evaluate OpenSRQPI for SI-DHM processing under two different modulation frequencies of the SI pattern (i.e., um = 0.98uc and um = 0.66uc) and different numbers of orientation angles of the SI pattern. To quantify these results, we measured the mean and standard deviation of the reconstructed thickness values at two different radii. At a large radius (R = 500 pixels), the measured thickness values are 0.257 ± 0.007 µm for um = 0.98uc and three orientation angles (top panel in Figure 4), 0.254 ± 0.010 µm for um = 0.98uc and two orientation angles (middle panel in Figure 4), and 0.253 ± 0.001 µm for um = 0.66uc and three orientation angles (bottom panel in Figure 4). These reconstructed thickness values are in close agreement with the ground-truth value set to 0.250 µm, confirming the accuracy of the QPI approach. At a smaller radius (R = 20 pixels), the measured thickness values at um = 0.98uc for three orientation angles (0.255 ± 0.011 µm) and two orientation angles (0.257 ± 0.015 µm) remain in agreement with the ground truth. Nonetheless, at um = 0.66uc and three orientation angles, the measured thickness drops to 0.210 ± 0.004 µm, indicating reduced accuracy. This deviation is expected since reducing the modulation frequency of the SI pattern restricts the lateral coverage of the extended power spectrum, limiting the SR capability of the SI-DHM system. In other words, frequencies near the diffraction limit of the system (i.e., set to a radius of 20 pixels) for um = 0.66uc are not transferred to the system’s compact support, making measurements in this region unreliable. Additionally, the accuracy of the measured thickness is dependent on the number of SI orientation angles since the thickness for only two SI orientation angles exhibits larger standard deviations, indicating a loss of isotropy in the extended power spectrum.
Similarly to the results obtained for OI-DHM under noisy conditions, the OpenSRQPI tool demonstrates comparable robustness for noisy SI-DHM processing. The only distinction between the two modes is the demodulation of the components, which has previously been shown to perform reliably at SNR levels below 15 dB [48]. In addition, we tested the performance of the OpenSRQPI tool for experimental SI-DHM holograms for um = 0.23uc recorded using a coupled Mach-Zehnder SI-DHM system [43]. After unwrapping the reconstructed phase map using a third-party unwrapping algorithm outside the OpenSRQPI tool, the manually reconstructed and OpenSRQPI-reconstructed phase maps are similar—the vertical element 8-5 of the USAF target is resolvable in both images, consistent with the resolution improvement for the native DHM system (i.e., minimum resolvable element 8-4). In addition, the quantitative phase values also agree within the experimental error, being equal to 1.10 ± 0.13 rad for the manual reconstruction and 1.00 ± 0.10 rad for the OpenSRQPI reconstruction. The only significant difference between the reconstructed experimental images is that the resolution of the manually (i.e., original script-based) reconstructed phase map is slightly better than the one provided by OpenSRQPI. This difference arises from the spatial filtering of the +1 term from the hologram spectrum. Whereas the user manually selects the +1 term within the script-based implementation, the compact support automatically detected using the threshold formula by OpenSRQPI is slightly smaller, cropping some high spatial frequencies and, therefore, leading to a reconstructed image with slightly worse resolution improvement. Future work will be focused on further assessing the experimental performance of the OpenSR tool and the approach to automatically select the +1 term within the hologram spectrum.
Quantitative estimation of the lateral resolution improvement provided by OpenSRQPI is obtained from the relative expansion of the compact spectral support in the reconstructed super-resolved (SR) spectrum relative to the native DHM system. This metric directly reflects the underlying physical principle of structured and oblique illumination, in which the illumination frequency and angle shift higher spatial frequencies of the object into the system’s passband, thereby extending the recoverable range of spatial frequencies. The measured extension of the compact support corresponds to a 1.98× improvement in lateral resolution for a modulation frequency of um = 0.98uc and 1.67× for um = 0.66uc, independent of the illumination mode. These enhancement factors are consistent with theoretical predictions for both structured and oblique illumination DHM and are directly derived from the measurable increase in spectral bandwidth. This quantitative agreement explains the improved resolvability of fine features in the star target with a 20 px radius at um = 0.98uc, as shown in Figure 2 and Figure 4.

4. Discussion

OpenSRQPI fills a critical gap in the QPI field by providing the first standardized, open-access platform for super-resolution reconstruction in DHM using either structured or oblique illumination. Unlike fluorescence-based SIM tools, no equivalent resource has existed for phase imaging, where reconstruction accuracy is vital for quantitative analysis. By automating complex steps such as carrier/modulation frequency detection, demodulation, spectral normalization, and weighted spectrum fusion, the OpenSRQPI minimizes the need for expert user intervention, ensuring reproducibility and lowering the entry barrier for biomedical and clinical researchers. Our results demonstrate that the proposed app consistently produces accurate super-resolved phase and thickness maps, regardless of the illumination features (i.e., modulation frequency and orientation). Both SI- and OI-DHM reconstructed phase images show clear resolution improvements over conventional DHM, with isotropic high-frequency coverage providing the best agreement with the ground truth thickness values.
At present, we have identified seven limitations of the OpenSRQPI framework. First, the compiled executable of OpenSRQPI is currently available only for Windows systems. Future work will be developing a Python-based version to enhance community engagement and interoperability with existing computational imaging frameworks. Second, at present, OpenSRQPI does not support automated analysis of large datasets because its current implementation processes each dataset individually. This limitation will be addressed by incorporating iterative (loop-based) or parallelized batch processing. Third, the reported improvement factor in lateral resolution, based on the increase in compact support of the SR spectrum relative to a single compact support, is sensitive to the noise level and the precision of compact-support determination. This spectral-domain estimation should ideally be complemented by spatial-domain quantitative metrics. Quantitative approaches for estimating the resolution improvement depend strongly on the sample structure. For example, calibrated phase targets with sharp edges allow estimation of the minimum resolvable element or derivative-based profiles, whereas biological specimens with filamentary features require alternative strategies. Because these analyses are inherently sample-specific, they are best performed externally using tools such as MATLAB or ImageJ. Nonetheless, future releases of OpenSRQPI will incorporate such quantitative modules to enable automated resolution analysis while maintaining the tool’s focus on standardized reconstruction and physics-based spectral assessment. Fourth, the present version does not perform phase unwrapping, which may lead to inaccurate thickness measurements if the SR phase map remains wrapped. While an unwrapping module will be included in future releases, users can, in the meantime, export the SR phase map and apply third-party algorithms before providing quantitative measurements. Fifth, the SI- and OI-DHM holograms currently must be square due to the implementation of vortex–Legendre phase compensation, which corrects high-order aberration terms [45]. Sixth, the compact support of the +1 diffraction order is determined through a threshold (TH) parameter based on noise statistics. While effective for simulated and high-SNR experimental data, this parameter may fail for noisy datasets. To address this, a future release of the OpenSRQPI will introduce a pre-visualization step allowing users to interactively refine the TH for more accurate filtering of the +1 term. Alternatively, we will also explore an adaptive thresholding strategy to better accommodate data with varying SNR levels. Seventh, the demodulation step may occasionally fail with experimental data, leaving residual SI patterns in the SR phase map. This limitation is not unique to OpenSRQPI, but rather inherent to SI demodulation when phase-shift quality is degraded. To mitigate this, we provide user input for validating demodulation accuracy and repeating the step when needed. Finally, the OpenSRQPI tool has not yet been tested for sample drift. Because that drift may occur during long acquisitions, in both OI-DHM and SI-DHM, this effect is expected to be minimal since the camera exposure time is typically very short and the acquisition process is fast, reducing the likelihood of significant sample displacement. Nonetheless, if drift occurs, it can be numerically corrected as a preprocessing step using correlation-based alignment methods in the spatial or Fourier domain prior to inputting the data into the OpenSRQPI tool.
In summary, OpenSRQPI provides the QPI community with a reproducible and accessible platform for SR-QPI reconstruction, lowering computational barriers. By accelerating the adoption of super-resolved label-free phase imaging across applications ranging from live-cell studies to high-resolution tissue morphometry, OpenSRQPI is poised to become a widely adopted standard for quantitative phase analysis beyond the diffraction limit. We recognize that further limitations may emerge, and we are committed to working closely with the community to enhance the framework’s robustness and usability.

Supplementary Materials

The following supporting information can be downloaded at: https://www.mdpi.com/article/10.3390/electronics14224513/s1. A supplemental file provides a manual to use the OpenSRQPI tool. Two demonstration videos have been made publicly available on YouTube to guide non-specialists in biomedical laboratories: www.youtube.com/watch?v=maJru9mbTF8 and www.youtube.com/watch?v=KBJkqVI6yAE.

Author Contributions

Conceptualization, S.O.-V. and A.D.; methodology, S.O.-V. and A.D.; software, S.O.-V. and A.S.; validation, S.O.-V., A.S. and A.D.; investigation, S.O.-V., A.S. and A.D.; data curation, S.O.-V.; writing—original draft preparation, S.O.-V. and A.D.; writing—review and editing, A.D.; visualization, S.O.-V., A.S. and A.D.; supervision, A.D.; project administration, A.D.; funding acquisition, A.D. All authors have read and agreed to the published version of the manuscript.

Funding

This research was funded by the National Science Foundation (2042563 and 2404769) and the University of Massachusetts Dartmouth.

Data Availability Statement

The simulated dataset and the OpenSRQPI app are freely available on GitHub: github.com/OIRL/OpenSRQPI (accessed on 5 October 2025).

Acknowledgments

Alan Scheider acknowledges funding from the Office of Undergraduate Research at the University of Massachusetts Dartmouth, allowing him to work on this project during the summer.

Conflicts of Interest

The authors declare no conflicts of interest.

Abbreviations

The following abbreviations are used in this manuscript:
2DTwo-Dimensional
3D Three-Dimensional
DHMDigital Holographic Microscope
FTFourier Transform
GUIGraphical User Interface
OIOblique Illumination
QPIQuantitative Phase Imaging
SIStructured Illumination
SIMStructured Illumination Microscopy

References

  1. Aknoun, S.; Yonnet, M.; Djabari, Z.; Graslin, F.; Taylor, M.; Pourcher, T.; Wattellier, B.; Pognonec, P. Quantitative Phase Microscopy for Non-Invasive Live Cell Population Monitoring. Sci. Rep. 2021, 11, 4409. [Google Scholar] [CrossRef]
  2. Nguyen, T.L.; Pradeep, S.; Judson-Torres, R.L.; Reed, J.; Teitell, M.A.; Zangle, T.A. Quantitative Phase Imaging: Recent Advances and Expanding Potential in Biomedicine. ACS Nano 2022, 16, 11516–11544. [Google Scholar] [CrossRef]
  3. Wang, R.; Wang, Z.; Millet, L.; Gillette, M.U.; Levine, A.J.; Popescu, G. Dispersion-Relation Phase Spectroscopy of Intracellular Transport. Opt. Express 2011, 19, 20571–20579. [Google Scholar] [CrossRef] [PubMed]
  4. Lee, K.; Kim, K.; Jung, J.; Heo, J.; Cho, S.; Lee, S.; Chang, G.; Jo, Y.; Park, H.; Park, Y. Quantitative Phase Imaging Techniques for the Study of Cell Pathophysiology: From Principles to Applications. Sensors 2013, 13, 4170–4191. [Google Scholar] [CrossRef]
  5. Liu, Y.; Uttam, S. Perspective on Quantitative Phase Imaging to Improve Precision Cancer Medicine. J. Biomed. Opt. 2024, 29, S22705. [Google Scholar] [CrossRef] [PubMed]
  6. Jung, J.; Matemba, L.E.; Lee, K.; Kazyoba, P.E.; Yoon, J.; Massaga, J.J.; Kim, K.; Kim, D.-J.; Park, Y. Optical Characterization of Red Blood Cells from Individuals with Sickle Cell Trait and Disease in Tanzania Using Quantitative Phase Imaging. Sci. Rep. 2016, 6, 31698. [Google Scholar] [CrossRef]
  7. Kim, Y.; Shim, H.; Kim, K.; Park, H.; Jang, S.; Park, Y. Profiling Individual Human Red Blood Cells Using Common-Path Diffraction Optical Tomography. Sci. Rep. 2014, 4, 6659. [Google Scholar] [CrossRef] [PubMed]
  8. Kim, G.; Jo, Y.; Cho, H.; Min, H.; Park, Y. Learning-Based Screening of Hematologic Disorders Using Quantitative Phase Imaging of Individual Red Blood Cells. Biosens. Bioelectron. 2019, 123, 69–76. [Google Scholar] [CrossRef]
  9. Song, G.; Steelman, Z.A.; Finkelstein, S.; Yang, Z.; Martin, L.; Chu, K.K.; Farsiu, S.; Arshavsky, V.Y.; Wax, A. Multimodal Coherent Imaging of Retinal Biomarkers of Alzheimer’s Disease in a Mouse Model. Sci. Rep. 2020, 10, 7912. [Google Scholar] [CrossRef]
  10. Polanco, E.R.; Moustafa, T.E.; Butterfield, A.; Scherer, S.D.; Cortes-Sanchez, E.; Bodily, T.; Spike, B.T.; Welm, B.E.; Bernard, P.S.; Zangle, T.A. Multiparametric Quantitative Phase Imaging for Real-Time, Single Cell, Drug Screening in Breast Cancer. Commun. Biol. 2022, 5, 794. [Google Scholar] [CrossRef]
  11. Marzi, A.; Eder, K.M.; Barroso, Á.; Kemper, B.; Schnekenburger, J. Quantitative Phase Imaging as Sensitive Screening Method for Nanoparticle-Induced Cytotoxicity Assessment. Cells 2024, 13, 697. [Google Scholar] [CrossRef] [PubMed]
  12. de Groot, P.J.; Deck, L.L.; Su, R.; Osten, W. Contributions of Holography to the Advancement of Interferometric Measurements of Surface Topography. Light Adv. Manuf. 2022, 3, 258–277. [Google Scholar] [CrossRef]
  13. Ferraro, P.; Grilli, S.; Alfieri, D.; De Nicola, S.; Finizio, A.; Pierattini, G.; Javidi, B.; Coppola, G.; Striano, V. Extended Focused Image in Microscopy by Digital Holography. Opt. Express 2005, 13, 6738–6749. [Google Scholar] [CrossRef]
  14. Yu, Z.; Chen, W.; Liu, J.; Zhang, J.; Guo, Y.; Gu, H.; Dong, Z.; Nie, L.; Jiang, H.; Deng, H.; et al. Characterizing Lateral Distribution of Complex Refractive Index Based on Quantitative Amplitude-Phase Imaging (QAPI). Opt. Lasers Eng. 2025, 194, 109199. [Google Scholar] [CrossRef]
  15. Kemper, B.; Bally, G. von Digital Holographic Microscopy for Live Cell Applications and Technical Inspection. Appl. Opt. 2008, 47, A52–A61. [Google Scholar] [CrossRef] [PubMed]
  16. Zhou, Y.; Cao, Z.; Yu, S. A Review on Optical Characterization of Refractive Index in Photonic Related Devices and Applications. J. Phys. D Appl. Phys. 2024, 57, 483002. [Google Scholar] [CrossRef]
  17. Wang, Z.; Millet, L.; Mir, M.; Ding, H.; Unarunotai, S.; Rogers, J.; Gillette, M.U.; Popescu, G. Spatial Light Interference Microscopy (SLIM). Opt. Express 2011, 19, 1016–1026. [Google Scholar] [CrossRef]
  18. Cuche, E.; Bevilacqua, F.; Depeursinge, C. Digital Holography for Quantitative Phase-Contrast Imaging. Opt. Lett. 1999, 24, 291–293. [Google Scholar] [CrossRef]
  19. Popescu, G.; Ikeda, T.; Dasari, R.R.; Feld, M.S. Diffraction Phase Microscopy for Quantifying Cell Structure and Dynamics. Opt. Lett. 2006, 31, 775–777. [Google Scholar] [CrossRef]
  20. Ou, X.; Horstmeyer, R.; Yang, C.; Zheng, G. Quantitative Phase Imaging via Fourier Ptychographic Microscopy. Opt. Lett. 2013, 38, 4845–4848. [Google Scholar] [CrossRef]
  21. Streibl, N. Phase Imaging by the Transport Equation of Intensity. Opt. Commun. 1984, 49, 6–10. [Google Scholar] [CrossRef]
  22. Javidi, B.; Carnicer, A.; Anand, A.; Barbastathis, G.; Chen, W.; Ferraro, P.; Goodman, J.W.; Horisaki, R.; Khare, K.; Kujawinska, M.; et al. Roadmap on Digital Holography [Invited]. Opt. Express 2021, 29, 35078–35118. [Google Scholar] [CrossRef]
  23. Yu, X.; Hong, J.; Liu, C.; Kim, M.K. Review of Digital Holographic Microscopy for Three-Dimensional Profiling and Tracking. Opt. Eng. 2014, 53, 112306. [Google Scholar] [CrossRef]
  24. Marquet, P.; Depeursinge, C.; Magistretti, P.J. Review of Quantitative Phase-Digital Holographic Microscopy: Promising Novel Imaging Technique to Resolve Neuronal Network Activity and Identify Cellular Biomarkers of Psychiatric Disorders. Neurophotonics 2014, 1, 20901. [Google Scholar] [CrossRef]
  25. Tahara, T.; Quan, X.; Otani, R.; Takaki, Y.; Matoba, O. Digital Holography and Its Multidimensional Imaging Applications: A Review. Microscopy 2018, 67, 55–67. [Google Scholar] [CrossRef] [PubMed]
  26. Sánchez-Ortiga, E.; Doblas, A.; Saavedra, G.; Martínez-Corral, M.; Garcia-Sucerquia, J. Off-Axis Digital Holographic Microscopy: Practical Design Parameters for Operating at Diffraction Limit. Appl. Opt. 2014, 53, 2058–2066. [Google Scholar] [CrossRef] [PubMed]
  27. Hussain, A.; Mudassar, A.A. Optical Super Resolution Using Tilted Illumination Coupled with Object Rotation. Opt. Commun. 2015, 339, 34–40. [Google Scholar] [CrossRef]
  28. Mico, V.; Zalevsky, Z.; García-Martínez, P.; García, J. Superresolved Imaging in Digital Holography by Superposition of Tilted Wavefronts. Appl. Opt. 2006, 45, 822–828. [Google Scholar] [CrossRef]
  29. Ma, Y.; Wen, K.; Liu, M.; Zheng, J.; Chu, K.; Smith, Z.J.; Liu, L.; Gao, P. Recent Advances in Structured Illumination Microscopy. J. Phys. Photonics 2021, 3, 024009. [Google Scholar] [CrossRef]
  30. Yaghoubi, S.H.S.; Ebrahimi, S.; Dashtdar, M. Structured Illumination in Fresnel Biprism-Based Digital Holographic Microscopy. Opt. Lasers Eng. 2022, 159, 107215. [Google Scholar] [CrossRef]
  31. Sánchez-Ortiga, E.; Martínez-Corral, M.; Saavedra, G.; Garcia-Sucerquia, J. Enhancing Spatial Resolution in Digital Holographic Microscopy by Biprism Structured Illumination. Opt. Lett. 2014, 39, 2086–2089. [Google Scholar] [CrossRef]
  32. Müller, M.; Mönkemöller, V.; Hennig, S.; Hübner, W.; Huser, T. Open-Source Image Reconstruction of Super-Resolution Structured Illumination Microscopy Data in ImageJ. Nat. Commun. 2016, 7, 10980. [Google Scholar] [CrossRef] [PubMed]
  33. Křížek, P.; Lukeš, T.; Ovesný, M.; Fliegel, K.; Hagen, G.M. SIMToolbox: A MATLAB Toolbox for Structured Illumination Fluorescence Microscopy. Bioinformatics 2016, 32, 318–320. [Google Scholar] [CrossRef]
  34. Cao, R.; Li, Y.; Chen, X.; Ge, X.; Li, M.; Guan, M.; Hou, Y.; Fu, Y.; Xu, X.; Leterrier, C. Open-3DSIM: An Open-Source Three-Dimensional Structured Illumination Microscopy Reconstruction Platform. Nat. Methods 2023, 20, 1183–1186. [Google Scholar] [CrossRef] [PubMed]
  35. Dong, C.; Loy, C.C.; He, K.; Tang, X. Image Super-Resolution Using Deep Convolutional Networks. IEEE Trans. Pattern Anal. Mach. Intell. 2015, 38, 295–307. [Google Scholar] [CrossRef] [PubMed]
  36. Liu, S.; Wang, M.; Huang, Q.; Liu, X. Robust Multi-Frame Super-Resolution Based on Adaptive Half-Quadratic Function and Local Structure Tensor Weighted Btv. Sensors 2021, 21, 5533. [Google Scholar] [CrossRef]
  37. Jin, L.; Liu, B.; Zhao, F.; Hahn, S.; Dong, B.; Song, R.; Elston, T.C.; Xu, Y.; Hahn, K.M. Deep Learning Enables Structured Illumination Microscopy with Low Light Levels and Enhanced Speed. Nat. Commun. 2020, 11, 1934. [Google Scholar] [CrossRef]
  38. Song, L.; Liu, X.; Xiong, Z.; Ahamed, M.; An, S.; Zheng, J.; Ma, Y.; Gao, P. Super-Resolution Reconstruction of Structured Illumination Microscopy Using Deep-Learning and Sparse Deconvolution. Opt. Lasers Eng. 2024, 174, 107968. [Google Scholar] [CrossRef]
  39. Chen, Y.; Liu, Q.; Zhang, J.; Ye, Z.; Ye, H.; Zhu, Y.; Kuang, C.; Chen, Y.; Liu, W. Deep Learning Enables Contrast-Robust Super-Resolution Reconstruction in Structured Illumination Microscopy. Opt. Express 2024, 32, 3316–3328. [Google Scholar] [CrossRef]
  40. Liu, T.; Liu, J.; Li, D.; Tan, S. Bayesian Deep-Learning Structured Illumination Microscopy Enables Reliable Super-Resolution Imaging with Uncertainty Quantification. Nat. Commun. 2025, 16, 5027. [Google Scholar] [CrossRef]
  41. Zhang, Q.; Liang, C.; Tang, M.; Yang, X.; Lin, M.; Han, Y.; Liu, X.; Yang, Q. Alternative Deep Learning Method for Fast Spatial-Frequency Shift Imaging Microscopy. Opt. Express 2023, 31, 3719–3730. [Google Scholar] [CrossRef]
  42. Huo, Y.; Gang, S.; Guan, C. FCIHMRT: Feature Cross-Layer Interaction Hybrid Method Based on Res2Net and Transformer for Remote Sensing Scene Classification. Electronics 2023, 12, 4362. [Google Scholar] [CrossRef]
  43. Obando-Vásquez, S.; Castaneda, R.; Restrepo, R.; Trujillo, C.; Doblas, A. Generalized Computational Framework for Phase Image Reconstruction in Structured Illumination Digital Holographic Microscopy. Opt. Express 2025, 33, 16454–16467. [Google Scholar] [CrossRef]
  44. Ortega, K.; Restrepo, R.; Padilla-Vivanco, A.; Castaneda, R.; Doblas, A.; Trujillo, C. Intricate Quantitative Phase Imaging via Vortex-Legendre High-Order Phase Compensation. Opt. Lasers Eng. 2025, 195, 109318. [Google Scholar] [CrossRef]
  45. Schenider, A.; Obando-Vasquez, S.; Doblas, A. SI-QPI-Stitcher—A User-Friendly Computational Tool to Stitch the Super-Resolved Spectral Components for Accurate Quantitative Phase Imaging (QPI) in Digital Holographic Microscopy (DHM) with Structured Illumination (SI). Proc. SPIE 2025, 13604, Optics and Photonics for Information Processing XIX, 136040U. [Google Scholar]
  46. Goodman, J.W. Statistical Optics; John Wiley & Sons: Hoboken, NJ, USA, 2015; ISBN 1119009456. [Google Scholar]
  47. Obando-Vásquez, S.; Lopera, M.J.; Restrepo, R.; Trujillo, C. Comparative Analysis of Digital Holographic Microscopy and Digital Lensless Holographic Microscopy for Quantitative Phase Imaging. Opt. Contin. 2024, 3, 309–323. [Google Scholar] [CrossRef]
  48. Doblas, A.; Buitrago-Duque, C.; Robinson, A.; Garcia-Sucerquia, J. Phase-Shifting Digital Holographic Microscopy with an Iterative Blind Reconstruction Algorithm. Appl. Opt. 2019, 58, G311–G317. [Google Scholar] [CrossRef] [PubMed]
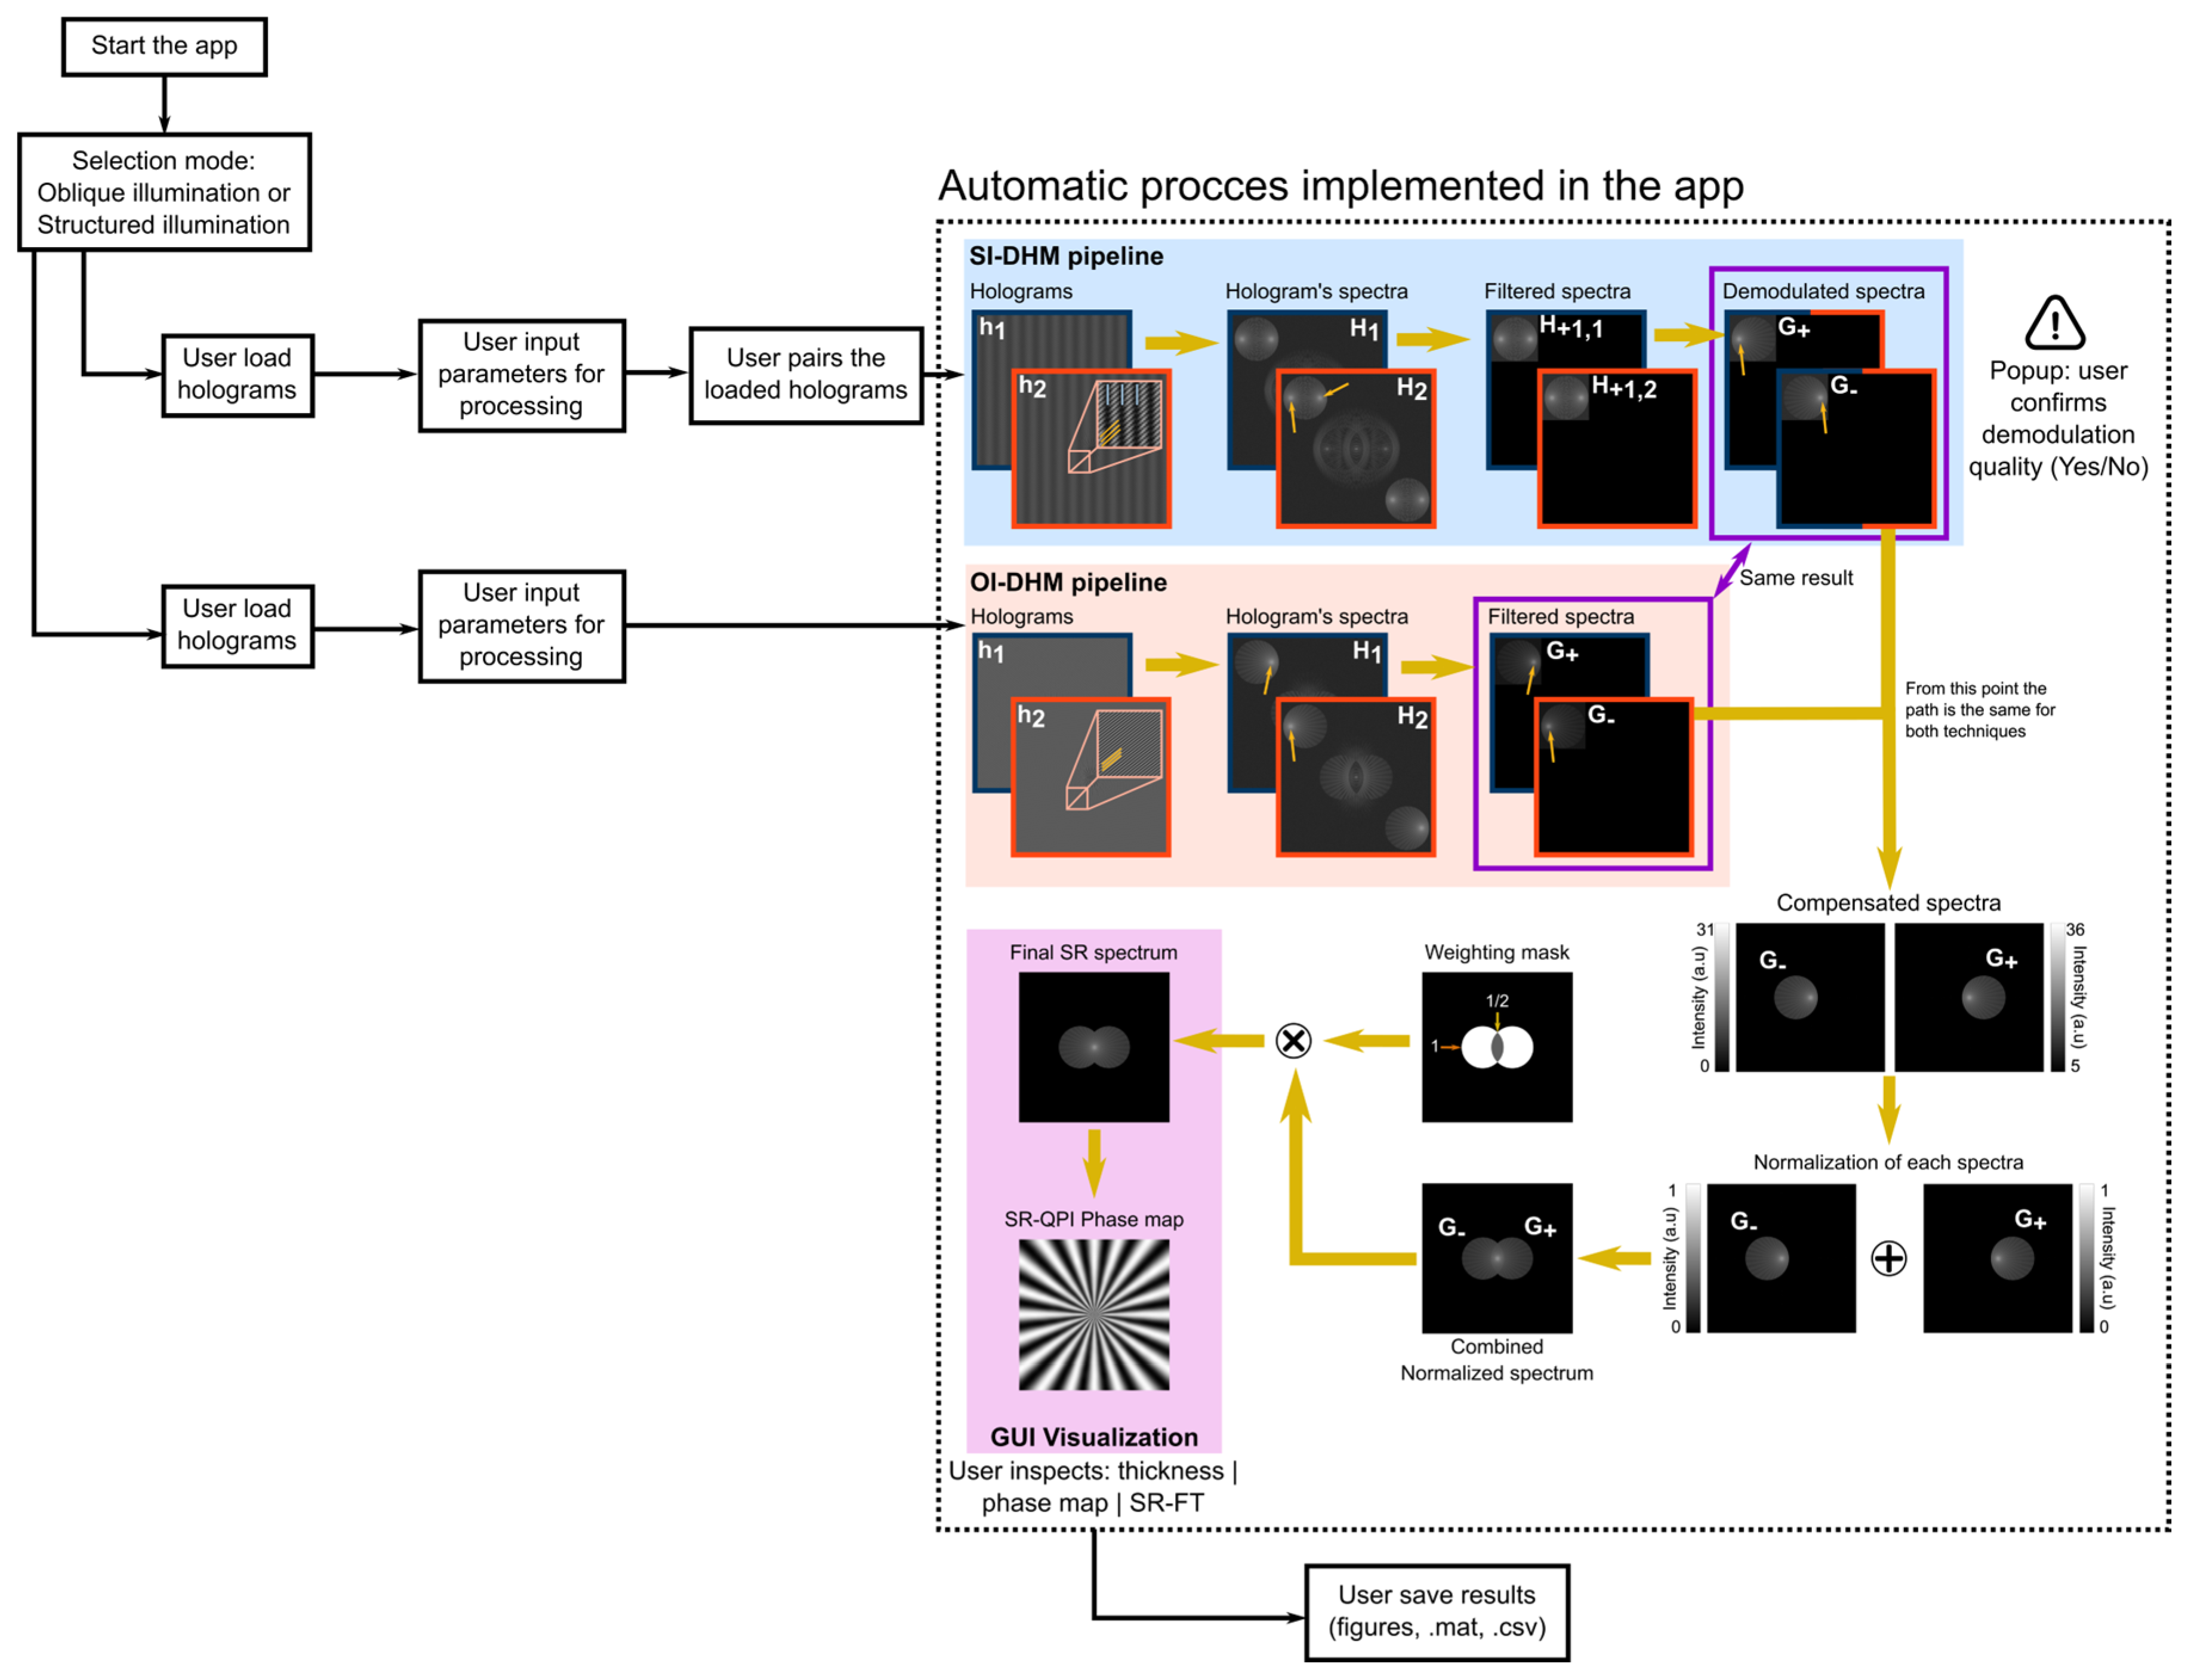
Figure 1. Flowchart of the computational pipeline for reconstructing the SR QPI phase image in SI-DHM and OI-DH.
Electronics 14 04513 g001
Figure 2. Evaluation of the SR improvement and QPI capability for the OI-DHM system compared to the native DHM system with um = 0.98uc (top two panels) and um = 0.66uc (last panel), where uc is the cutoff frequency of the native DHM system.
Electronics 14 04513 g002
Figure 3. Evaluation of the OpenSRQPI tool for reconstructing accurate phase measurements in OI-DHM mode for different noise levels and two different lateral modulation frequencies of the oblique illumination. The ground truth phase value is equal to 1.535 rad. The dashed lines illustrate the phase sensitivity of a typical DHM system [46].
Electronics 14 04513 g003
Figure 4. Evaluation of the SR improvement and QPI capability for the SR-DHM system compared to the native DHM system with um = 0.98uc (top two panels) and um = 0.66uc (last panel), where uc is the cutoff frequency of the native DHM system.
Electronics 14 04513 g004
Disclaimer/Publisher’s Note: The statements, opinions and data contained in all publications are solely those of the individual author(s) and contributor(s) and not of MDPI and/or the editor(s). MDPI and/or the editor(s) disclaim responsibility for any injury to people or property resulting from any ideas, methods, instructions or products referred to in the content.