Article

FreqSpatNet: Frequency and Spatial Dual-Domain Collaborative Learning for Low-Light Image Enhancement

1
School of Information Science and Engineering, Shenyang Ligong University, Shenyang 110159, China
2
Science and Technology Development Corporation, Shenyang Ligong University, Shenyang 110159, China
3
State Key Laboratory of Robotics, Shenyang Institute of Automation, Chinese Academy of Sciences, Shenyang 110016, China
4
University of Chinese Academy of Sciences, Beijing 100049, China
*
Author to whom correspondence should be addressed.
Electronics 2025, 14(11), 2220; https://doi.org/10.3390/electronics14112220
Submission received: 14 April 2025 / Revised: 26 May 2025 / Accepted: 27 May 2025 / Published: 29 May 2025

Abstract

Low-light images often contain noise due to the conditions under which they are taken. Fourier transform can reduce this noise in frequency while preserving the image detail embedded in the low-frequency components. Existing low-light image-enhancement methods based on CNN frameworks often fail to extract global feature information and introduce excessive noise, resulting in detail loss. To solve the above problems, we propose a low-light image-enhancement framework and achieve detail restoration and denoising by using Fourier transform. In addition, we design a dual-domain enhancement strategy, which cooperatively utilizes global frequency-domain feature extraction to improve the overall brightness of the image and the amplitude modulation of the spatial-domain convolution operation to perform local detail refinement to improve the quality of the image by suppressing noise, enhancing the contrast, and preserving the texture at the same time. Extensive experiments on low-light datasets show that our results outperform mainstream methods, especially in maintaining natural color distributions and recovering fine-grained details under extreme lighting conditions. We adopted two evaluation indicators, PSNR and SSIM. Our method improved the PSNR by 4.37% compared to the Restormer method and by 1.76% compared to the DRBN method.

1. Introduction

Low-light image enhancement presents a challenging task in computer vision due to degraded visual inputs caused by low-light environments, low-end imaging devices, and adverse weather conditions, resulting in images with low contrast, color distortion, and significant noise artifacts [1,2]. Such degradation severely impedes downstream vision-based applications, including autonomous driving [3], object detection [4,5], and medical imaging [6]. Efficient low-light image enhancement plays a crucial role in improving the robustness of mission-critical areas [7,8].
The problem of enhancing low-light images is inherently ill-posed, and numerous approaches have been suggested to tackle this issue. Conventional approaches employ histogram equalization [9] and gamma correction [10], where histogram equalization redistributes pixel intensities to achieve uniform distribution for contrast improvement. In contrast, gamma correction adjusts the brightness through non-linear pixel value transformations. Though these traditional techniques enhance contrast and luminance, they frequently suffer from over-enhancement or inadequate adjustment, often neglecting illumination factors and introducing color distortion and detail blurring. Methods grounded in Retinex theory [11] optimize the illumination maps, and most of the research has focused on refining illumination maps to improve image brightness and contrast. However, this method often amplifies the noise, which harms the enhancement results. The advent of deep learning has spawned CNN-based architectures like KinD [12], ZeroDCE [13], URetinex-Net [14], and DCC-Net [15], which learn brute-force mappings from low-light to normal-light images but often produce noisy outputs with compromised details. Wang et al. [16] integrated Retinex theory with CNNs in Retinex-Net, implementing separate decomposition and illumination enhancement networks. While this framework achieves superior color restoration under decomposition constraints, it sacrifices significant structural details during enhancement.
Transformer models have demonstrated extensive applications in natural language processing. Dosovitskiy et al. pioneered the adaptation of transformer architectures to visual tasks with Vision Transformer (ViT) [17], achieving remarkable results. Subsequent works extended transformer applications to image super-resolution enhancement [18], introducing specialized components such as multi-head transformed attention (MDTA) modules and gated feed-forward networks (GFN). Cai et al. [19] first leveraged transformers for low-light image enhancement, proposing an illumination-guided multi-head self-attention (IG-MSA) mechanism that directs attention computation using illumination features, facilitating cross-region interactions across varying exposure levels to suppress noise without artifact generation, albeit occasionally introducing color deviations. Ultra-high-definition (UHD) low-light enhancement targets 4K+ resolution images, prioritizing the preservation of fine-grained details (e.g., textures, edges), whereas conventional methods primarily optimize global brightness and contrast. Wang et al. [20] pioneered transformer-based UHD low-light enhancement via axis-wise multi-head self-attention and cross-layer attention fusion blocks (CAFB), effectively boosting luminance but inducing overexposure in bright regions. While transformers excel at capturing global dependencies, their heavy reliance on massive network parameters significantly escalates computational complexity.
Recently, certain low-light image-enhancement techniques based on Fourier analysis [21,22] have delved into the properties of frequency-domain data. These methods achieve low-light image enhancement and improve brightness, but these methods are subject to certain constraints, including significant computational demands, restricted noise reduction capabilities, and inadequate detail restoration. Subsequently, Wang et al. [23] proposed the FourLLIE network, which enhances image brightness by adjusting the size of the amplitude component in the Fourier domain. While it improves brightness and recovers details in low-light images, the restored images exhibit overly bright colors.
To solve these problems, we designed a frequency–space joint low-light image-enhancement network (FreqSpatNet). Unlike the Restormer network, the Restormer network uses the transformer model to extract global information, but there are problems, such as an insufficient recovery of local details and high computational complexity. Our method adopts Fourier transform. The frequency-domain information captures the global structure and spectral features, while the spatial-domain information enhances the local details and contrast. Unlike the FourLLIE network, we adopt the Restormer network model framework. The FourLLIE network handles the frequency and space modules separately, while our network integrates the frequency and space domains into a unified framework, using a single input–output pipeline to ensure a tight coupling between frequency and space processing. This enables frequency and spatial information to flow within the same network and reinforce each other. By deeply fusing frequency and spatial information, our method can enhance low-light images more naturally while retaining finer details, thus providing a more comprehensive low-light image-enhancement solution.
This paper presents three principal contributions as follows: (1) We propose a new architecture for low-light image enhancement, named FreqSpatNet, which is grounded in a high-resolution image restoration framework to preserve structural fidelity. (2) We develop a dual-domain enhancement strategy that synergistically leverages Fourier transform for global frequency-domain feature extraction and spatial-domain convolutional operations for local detail refinement, enabling simultaneous noise suppression, contrast enhancement, and texture preservation. (3) Extensive experiments on mainstream low-light datasets show that our approach achieves state-of-the-art performance in both qualitative and quantitative terms; in particular, it outperforms the state-of-the-art methods in maintaining natural color distributions and recovering fine-grained details under extreme lighting conditions.

2. Related Work

2.1. Low-Light Image Enhancement

Low-light image enhancement can be divided into traditional low-light image-enhancement algorithms and deep learning-based low-light image-enhancement algorithms. Traditional low-light image-enhancement algorithms include histogram equalization [4] and Retinex theory-based low-light image enhancement [6]. Histogram equalization enhances low-light images by performing operations on the image histogram to expand the dynamic range of the image. Traditional Retinex model-based methods decompose the observed image into a reflectance map and an illumination map for separate processing. Subsequently, a series of innovative explorations were conducted based on this theory. For example, the Single Scale Retinex (SSR) algorithm, which employs a single-scale surround function, was proposed. As research progressed, issues such as detail blurring and halo artifacts in SSR-enhanced images gradually emerged. To address these problems, researchers introduced the Multi-Scale Retinex algorithm. Although traditional low-light image-enhancement algorithms can improve image brightness and contrast, they may also lead to overexposure, increased noise, color distortion, and other issues.
Deep learning-based low-light image-enhancement methods utilize deep neural network models to learn and extract features from images, thereby enhancing low-light images. Among various models, Convolutional Neural Networks (CNNs) [24] and transformer models have garnered significant attention. Wang et al. proposed a two-stage Retinex-based method called Retinex-Net [11]. Inspired by Retinex-Net, Zhang et al. [7] introduced the “Lighten the Darkness” algorithm, which improves the ability to handle uneven illumination, offers more effective noise suppression, and achieves higher computational efficiency and adaptability. However, in practice, simultaneously capturing low-light and normal-light images is highly challenging. Therefore, Guo et al. [8] designed a lightweight light-enhancement curve approximation network and employed a no-reference loss function to enhance low-light images. Existing low-light image-enhancement techniques struggle with visual quality and often prove ineffective in unknown complex scenarios. To address this issue, Long et al. proposed a novel Self-Calibrated Illumination (SCI) [25] learning framework for fast, flexible, and robust image brightening in real-world low-light conditions. However, this method overlooks the role of structural information modeling in low-light regions for enhancement, leading to suboptimal results.
Moreover, CNN-based methods often fail to capture global information. Transformer models have gradually been applied to the field of low-light image enhancement. Alexandru Brateanu and a team of researchers [26] introduced a lightweight transformer-based network called LYT-Net. Xu et al. [27] combined the transformer model with ResNet to create a generative adversarial network for low-light image enhancement. Wang et al. [28] employed the compressed attributes of low-light imagery within a transformer-based methodology for improvement purposes. However, these methods did not consider Fourier frequency information. In recent years, researchers have explored Fourier frequency information for low-light image enhancement. Tan et al. [29] employed a fast Fourier transform adjustment module to eliminate blur and restore texture details. By extracting global information in the frequency domain, their method achieves lower complexity compared to transformer models while adeptly utilizing the global characteristics of Fourier frequency information.

2.2. Fourier Frequency Information

In recent years, Fourier frequency information has been applied to low-light image enhancement. Yu et al. [30] utilized Fourier frequency information for image dehazing. Xue et al. [31] employed CLIP and Fourier frequency information to guide wavelet diffusion for low-light enhancement. Zhou et al. [32] further explored the relationship between the spatial and frequency domains. However, some methods neglect spatial-domain information, while others use the spatial and frequency domains independently. In contrast, our proposed fusion of the spatial and frequency domains can provide more accurate enhancement results [33,34].

3. Proposed Algorithm

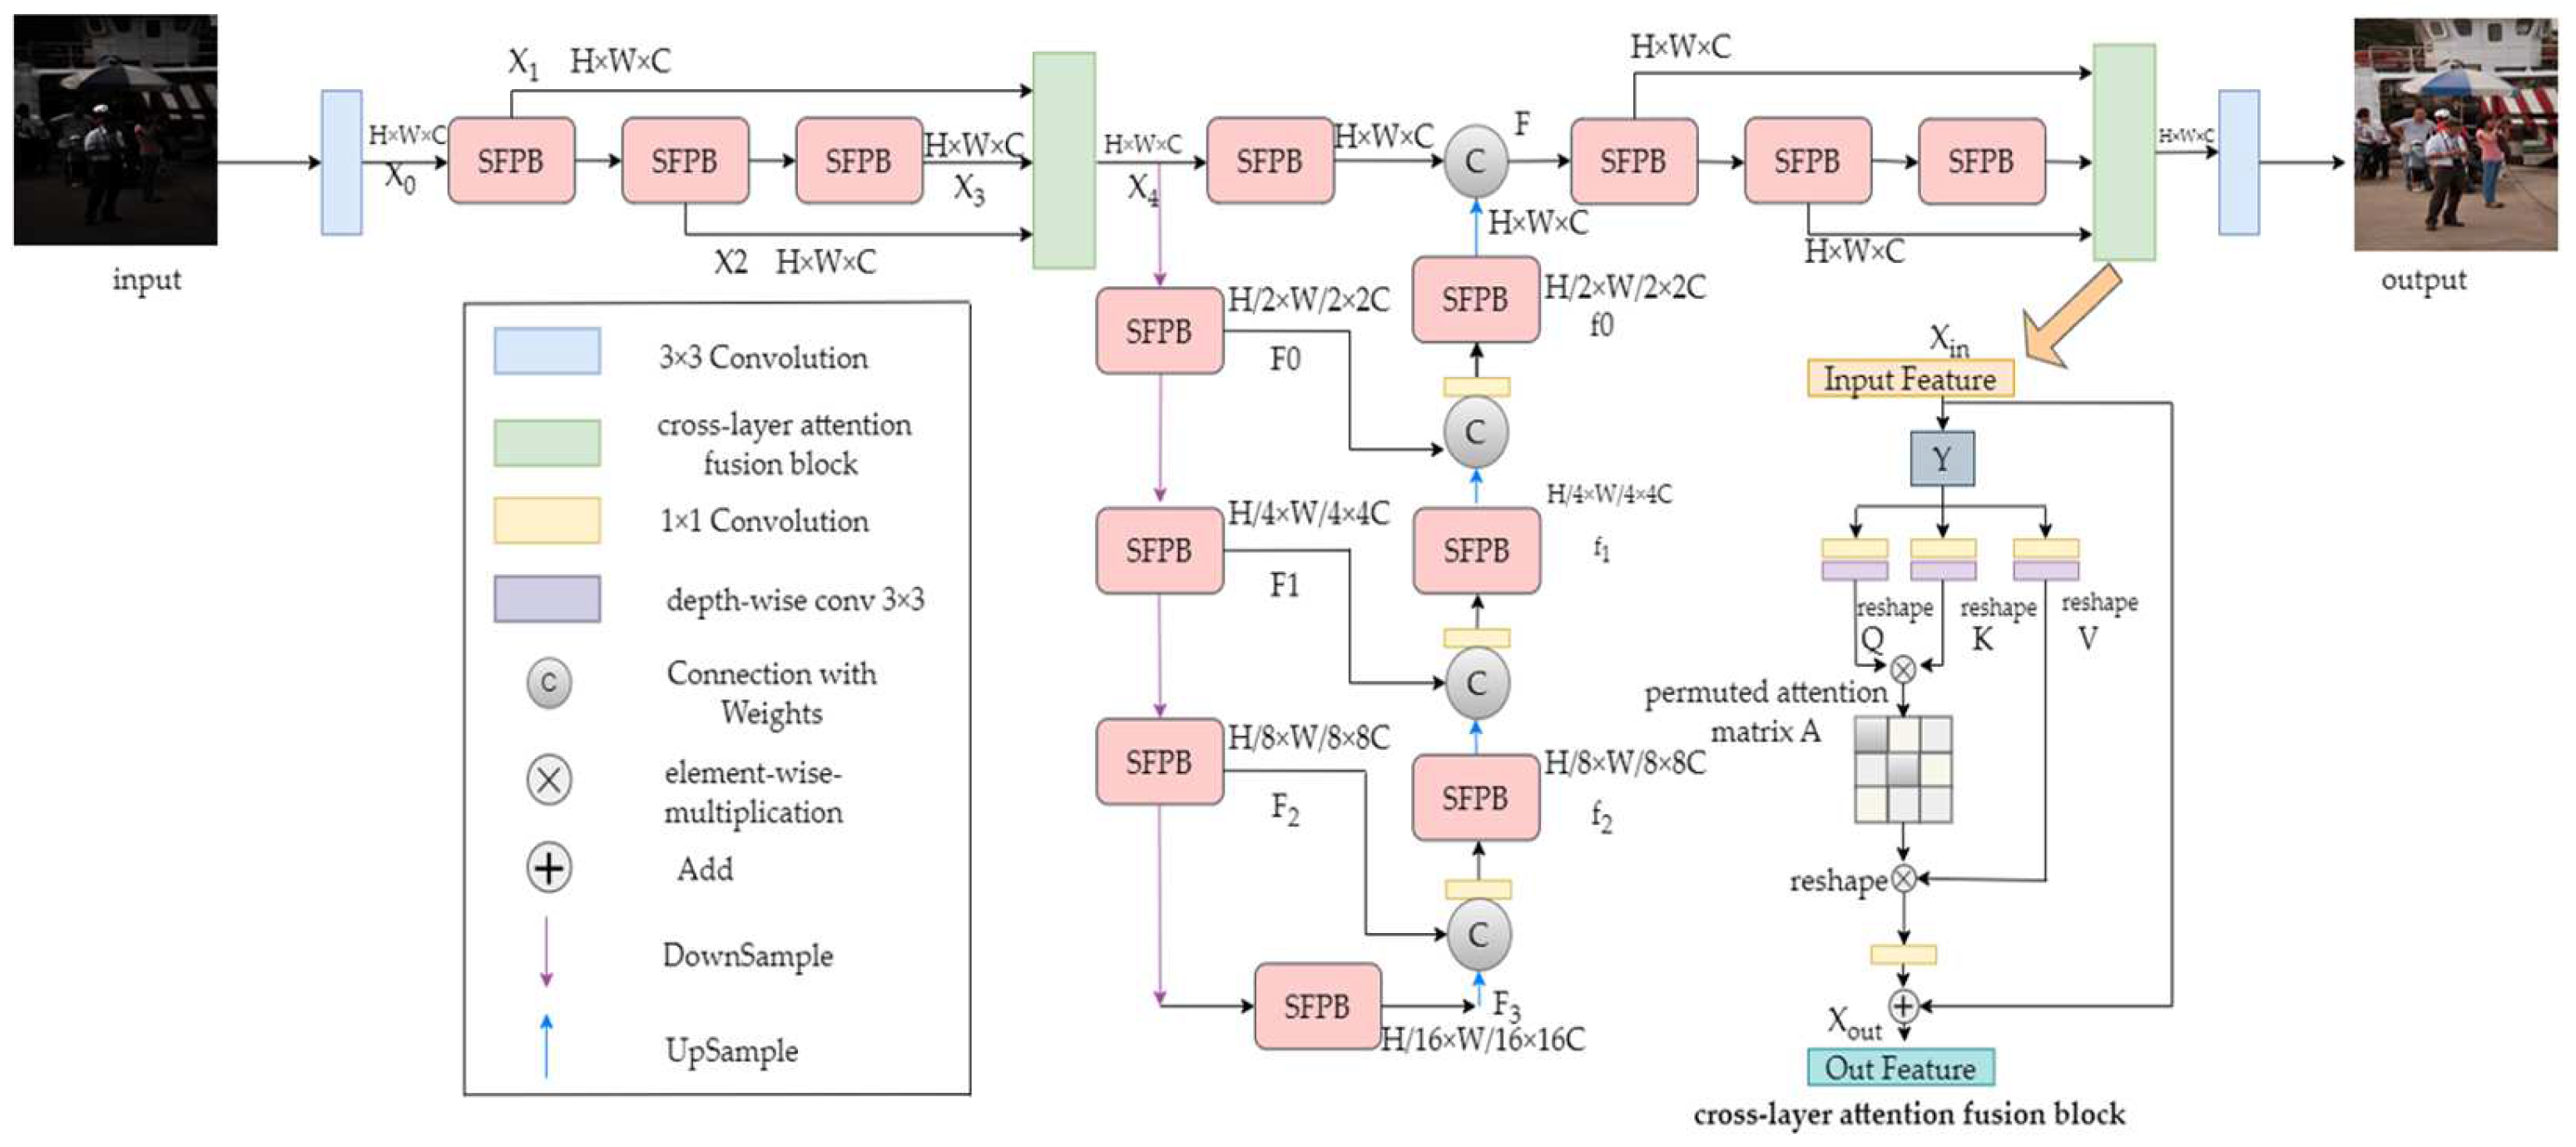
3.1. Network Architecture

As illustrated in Figure 1, the overall framework adopts a hierarchical encoder–decoder architecture inspired by Restormer [18]. Given a low-light input image I ∈ RH×W×3, FreqSpatNet first employs a 3 × 3 convolutional layer to obtain preliminary features denoted as X0. These features are sequentially processed by three Spatial-Frequency Parallel Blocks (SFPBs) to generate intermediate features X1,X2,X3 ∈ RH×W×3. The outputs are then transformed into enhanced features X4 via a cross-layer attention fusion block [17]. The encoder comprises four stages, each integrating a downsampling layer followed by progressively increasing SFPB modules, where the i-th stage feature Fi ∈ RH/2i×W/2i×2iC (for i = 0,1,2,3) is hierarchically abstracted.
The decoder, initialized with the low-resolution latent feature F3, reconstructs high-resolution representations through three stages, each combining an upsampling layer and multiple SFPB modules, producing features fi ∈ RH/2i×W/2i×2iC (for i = 0,1,2). In order to reduce information loss in the encoder and improve feature reconstruction in the decoder, multi-scale feature fusion is achieved through the use of weighted skip connections and 1 × 1 convolution layers. The latent feature F from the decoder undergoes successive refinement via three SFPB modules and a cross-layer attention fusion block, resulting in the generation of ultimate enhanced features. A terminal 3 × 3 convolutional layer synthesizes the enhanced output image, achieving balanced brightness restoration, noise suppression, and detail preservation.

3.2. Fourier Frequency Information

Fourier frequency information refers to the frequency components extracted from time-domain or spatial-domain signals via Fourier transform. Given an input image x with dimensions H × W, its two-dimensional c F(u,v) is mathematically defined as:
F ( u , v ) = x = 0 H 1 y = 0 W 1 f ( x , y ) e j 2 π ( u x H + v y W )
where u and v are coordinates in the frequency domain, f(x, y) represents the image in the spatial domain, where x and y signify the positional coordinates of the pixels, while j symbolizes the imaginary unit. F(u,v) is a set of complex numbers that can be represented in the following manner.
F ( u , v ) = R ( F ( u , v ) ) + j I ( F ( u , v ) )
where R(F(u,v)) denotes the real component, I(F(u,v)) represents the imaginary component. Fourier frequency information decomposes the complex spectrum F(u,v) in Fourier space into two distinct components: amplitude and phase. The expressions for the magnitude component A(F(u,v)) and the phase component P(F(u,v)) are as follows.
A ( F ( u , v ) ) = | F ( u , v ) | = R ( F ( u , v ) ) 2 + I ( F ( u , v ) ) 2
P ( F ( u , v ) ) = F ( u , v ) = tan 1 ( I ( F ( u , v ) ) R ( F ( u , v ) ) )

3.3. SFPB

The SFPB architecture is depicted in Figure 2. The SFPB module consists of two branches. The upper branch is for local enhancement in the spatial domain, and the lower branch is for global enhancement in the frequency domain. In the spatial domain, apply a 3 × 3 convolution to the input, and then extract features through the LeakyReLU activation function. Next, perform a 3 × 3 convolution on the extracted features, and add the obtained result to the input feature X to obtain feature X1. In the frequency domain, perform a Fourier transform on the input to extract the amplitude and phase components. Apply two 1 × 1 convolutional layers with the LeakyReLU activation function to these two elements. Ultimately, these two components are converted back into the spatial domain through the inverse Fourier transform. Apply a 3 × 3 convolution to the obtained features and add the obtained result to the input feature X to obtain X2. Use 1 × 1 convolution to combine the results of the two branches to generate the final output. Given X ∈ RH×W×C, the complete SFPB expression is as follows:
X 1 = X + W 3 × 3 ( max ( α W 3 × 3 X , W 3 × 3 X ) )
F ( u , v ) = F { f ( x , y ) } f ( x , y ) = F 1 { W 1 × 1 L Re L U ( W 1 × 1 A ( u , v ) ) e j W 1 × 1 L Re L U ( W 1 × 1 p ( u , v ) }
X 2 = X + W 3 × 3 f ( x , y )
o u t p u t = W 1 × 1 ( X 1 , X 2 )
where, W1×1 and W3×3 represent the 1 × 1 convolution and 3 × 3 convolution, respectively, α is a small positive constant, and F and F 1 denote the Fourier transform and inverse Fourier transform, respectively.

3.4. Cross-Layer Attention Fusion Block

The architecture of the Cross-Layer Attention Fusion Module is shown in Figure 1. We reshape the input feature Xin ∈ RH×W×C into Y ∈ RHW×C, followed by a 1 × 1 convolution to integrate a pixel-wise cross-channel context. Subsequently, by using a 3 × 3 deep convolution, Q, K, and V are obtained. Next, we reshape the keys and queries to generate a transposed attention matrix A of dimensions RC×C through their dot-product interaction. The process is defined as follows:
X o u t = W 1 × 1 A t t e n t i o n ( Q ^ ,   K ^ ,   V ^ )   +   Y
A t t e n t i o n ( Q ^ ,   K ^ ,   V ^ ) = V ^ s o f t m a x (   Q ^ K ^ / α )
where Xout and Y represent the output and input feature maps, respectively. Q ^   R H ^ W ^ × C , K ^ R C × H W , V ^ R H W × C is made up of the original size R H ^ × W ^ × C ^ RH×W×C after rework. α is a learnable scaling parameter. The query, key, and value vectors are split into multiple heads, and in each head, the query vector is a dot product with a key vector and is divided by a scaling factor. Then, the softmax function is used to obtain the attention weights.

4. Experimental Results

4.1. Experimental Environment and Datasets

The hardware environment for the experiments in this paper is based on training conducted on an RTX 3090Ti. The deep learning framework uses PyTorch version 1.8, with the Adam optimizer and an initial learning rate set to 1 × 10 4 .
The LOL-v2-Synthetic [35] and MIT-Adobe-FiveK [36] datasets are used for training. The LOL-v2-Synthetic dataset comprises low-light images that have been synthesized utilizing a particular algorithm, derived from high-resolution images captured under standard lighting conditions. The LOL-v2-Synthetic dataset contains a training set of 900 pairs of low-light/normal-light images and a test set of 100 pairs of low-light/normal-light images. The MIT-Adobe-FiveK dataset includes 5000 high-quality raw digital photos (typically stored in RAW format), with each original image having five versions optimized in different ways, totaling 25,000 images. The MIT-Adobe-FiveK dataset contains a training set of 4500 pairs of low-light/normal-light images and a test set of 500 pairs of low-light/normal-light images.

4.2. Evaluation Metrics

This study employs two evaluation criteria: The Peak Signal-to-Noise Ratio (PSNR) [37] and Structural Similarity Index (SSIM) [38] to achieve a quantitative analysis. The PSNR is commonly used to evaluate the differences between an image that has been compressed, transmitted, or processed and the original image. A greater PSNR rating suggests reduced degradation and enhanced visual quality upon reconstruction. The formula for the PSNR is as follows:
P S N R = 10 log 10 ( M A X I 2 M S E ) M S E = 1 m n i = 0 m 1 j = 0 n = 1 [ I ( i , j ) K ( i , j ) ] 2
where MAXI represents the maximum possible pixel value of the image, and m and n denote the height and width of the image, respectively. I(i,j) and K(i,j) are the pixel values of the image at position (i,j). The Structural Similarity Index (SSIM) serves as a quantitative measure to evaluate the resemblance between two images, taking into account luminance, contrast, and structural data. The Structural Similarity Index (SSIM) measurement fluctuates between −1 and 1, where a value of 1 signifies that that the two images are completely consistent in structure, and a value of −1 indicates that the two images are completely opposite in structure. The equation for SSIM is presented below:
S S I M ( x , y ) = ( 2 μ x μ y + C 1 ) ( 2 σ x y + C 2 ) ( μ x 2 + μ y 2 + C 1 ) ( σ x 2 + σ y 2 + C 2 )
where μ x is the mean of the reference image x, and μ y is the mean of the evaluated image y. σ x 2 represents the variance of x, σ y 2 represents the variance of y, and σ x y denotes the covariance between x and y. C1 and C2 are two constants that are introduced to avoid division by zero.

4.3. Comparative Experiment

To verify the enhancement effectiveness of the proposed method, it is compared with state-of-the-art (SOTA) methods, including DeepUPE, Retinex-Net, RUAS, KinD, and Restormer. As shown in Table 1, the proposed method achieves better results on the LOL-v2-synthetic and MIT-Adobe-FiveK datasets. On the lol-v2 synthetic dataset, this method improved the PSNR by 0.33% and 1.76%, respectively, compared with the FourLLIE and DRBN methods, which ranked second and third. On the MIT-Adobe-FiveK dataset, this method improved the PSNR by 0.11% and 0.39%, respectively, compared with the LLFormer and FourLLIE methods, which ranked second and third. The experimental results demonstrate that the proposed method provides superior enhancement results. The visualized enhancement results are shown in the figure below, with detailed regions highlighted by red bounding boxes.
As shown in Figure 3, on the LOL-v2 -synthetic dataset, the enhancement results of the DCC, SCI, URetinex-Net, and LLFormer methods are generally significantly darker. The enhancement results of the PairLIE method show obvious noise [47,48]. The buildings and trees in the distance were not restored as clearly as by our method. In Figure 4, the DCC method is generally dark, the walls of the SCI and LLFormer methods have obvious exposure, and the URetinex-Net and PairLIE methods have obvious noise. In contrast, the result of the proposed method is visually the closest to the truth on the ground. As shown in Figure 5 and Figure 6, on the MIT-Adobe-FiveK dataset, the overall effect of the DCC method is rather dark. The Zero-IG method shows overexposure in enhancement. The URetinex-Net and SCI methods show a mismatch with the true color of the ground and the presence of noise. The PairLIE method contains a large amount of noise. However, the proposed method produces enhanced results that are visually closest to the true value.
This study also assesses the effectiveness of our approach by utilizing the no-reference quality index NIQE on the MEF [49], LIME [39], NPE [50], VV [51], and DICM [52] datasets. The findings are presented in Table 2, featuring visual comparisons in Figure 7 and Figure 8.
As shown in Figure 7, the DCC, RUAS, SCI, and Zero-IG methods exhibit obvious overexposure on bird feathers. The enhancement results of the PairLIE and LLFormer methods introduce a large amount of noise. As shown in Figure 8, the results restored by the DCC method are generally too dark. The RUAS, SCI, LLFormer, and Zero-IG methods show that there is obvious overexposure in the red box, as shown in the figure. The PairLIE method also has a problem of excessive noise. In contrast, the method proposed in this paper has significantly better visual effects, can effectively remove noise, restore details, and avoid overexposure.
Finally, we verified the computational complexity of our method. Table 3 shows the average values of the model parameters, FLOPs.

4.4. Ablation Study

Two datasets were utilized to conduct ablation experiments, aiming to assess the performance of the SFPB module, the cross-layer attention fusion module, and the effectiveness of the fusion module. The Fourier space module is denoted as FB, the space module as SB, the cross-layer attention fusion module as CAFB, and our fusion method as OF. Among them, w/o F represents the removal of the Fourier space module, w/o S represents the removal of the space module, w/o CAFB represents the removal of the cross-layer attention fusion module, and w/o OF represents the replacement of our fusion method with additive fusion. The experimental outcomes presented in Table 4 indicate that the performance indicators of our method are higher than those of other combinations.
To study the influence of network width and depth, we performed controlled experiments by progressively expanding the width (channel capacity) and depth (encoder layers) of the SFPB module. Three network configurations, with the dimensions 16, 32, and 48, were implemented and evaluated on the LOL-v2 synthetic benchmark. As shown in Table 5, the 16-dimensional variant achieves the second-highest PSNR (28.74 dB) and SSIM (0.893) scores while requiring minimal computational resources: 23% fewer FLOPs, 41% fewer parameters, and a 19% faster inference time compared to larger configurations. Given its near-optimal enhancement quality coupled with significantly reduced computational complexity, we select the 16-dimensional architecture as our final design for practical deployment.

5. Discussion

Although our proposed low-light image enhancement method has achieved improvements in both visual quality and performance, it still has certain limitations, which we will further discuss below. As shown in Figure 9, our method achieves superior recovery fidelity in high-brightness regions, avoiding over-enhancement and overexposure in bright areas while delivering better contrast and saturation in the enhanced images. In contrast, methods such as SCI, URetinex-Net, Zero-IG, and LLFormer exhibit overexposure in high-brightness regions, and the PairLIE method produces unnatural restoration results. However, our method struggles to clearly recover small background details, such as tiny signs and trees, and provides insufficient enhancement for extremely dark regions in localized low-light areas. This is because our approach primarily prioritizes preserving contrast at the expense of brightness enhancement in the very dark regions of locally underlit images. In the future, we will explore more effective solutions to address these limitations.

6. Conclusions

In this paper, we used the Fourier transform to extract global information and spatial-domain techniques to capture local information for low-light-level image enhancement. Increasing the amplitude component’s size to improve the image’s brightness effectively solves the problem of low-illumination image detail loss, noise removal, and color distortion. The qualitative results show that the brightness adjustment in this paper is well processed, avoids overexposure or underexposure, and can also effectively suppress noise and restore image details, which can be used to improve the image quality. Thanks to the effective use of Fourier’s frequency information, the results obtained in this paper are closer to the ground truth than those obtained by other methods.

Author Contributions

Conceptualization, Y.G.; Methodology, Y.G. and M.L.; Software, M.L.; Writing—original draft, M.L.; Writing—review and editing, Y.G., X.C., X.W. and X.L.; funding acquisition, X.C. All authors have read and agreed to the published version of the manuscript.

Funding

This research was supported in part by the Youth Innovation Promotion Association of the Chinese Academy of Sciences under Grant 2022196, in part by the General Talents Project for Scientific Research grant of the Educational Department of Liaoning Province (LJ212410144062), and in part by the Research Support Program for Inviting High-Level Talents grant of Shenyang Ligong University (1010147001201).

Data Availability Statement

The original contributions presented in this study are included in the article. Further inquiries can be directed to the corresponding author.

Conflicts of Interest

The authors declare no conflicts of interests.

References

  1. Wu, B.; Wang, S.; Lu, Y.; Yi, Y.; Jiang, D.; Qiao, M. A New Pallet-Positioning Method Based on a Lightweight Component Segmentation Network for AGV Toward Intelligent Warehousing. Sensors 2025, 25, 2333. [Google Scholar] [CrossRef] [PubMed]
  2. Syed, T.N.; Zhou, J.; Lakhiar, I.A.; Marinello, F.; Gemechu, T.T.; Rottok, L.T.; Jiang, Z. Enhancing Autonomous Orchard Navigation: A Real-Time Convolutional Neural Network-Based Obstacle Classification System for Distinguishing ‘Real’ and ‘Fake’ Obstacles in Agricultural Robotics. Agriculture 2025, 15, 827. [Google Scholar] [CrossRef]
  3. Li, G.F.; Yang, Y.; Qu, X.D.; Cao, D.P.; Li, K.Q. A deep learning based image enhancement approach for autonomous driving at night. Knowl.-Based Syst. 2021, 213, 106617. [Google Scholar] [CrossRef]
  4. Wang, X.D.; Chen, X.A.; Wang, F.F.; Xu, C.L.; Tang, Y.D. Image Recovery and Object Detection Integrated Algorithms for Robots in Harsh Battlefield Environments. In International Conference on Intelligent Robotics and Applications; Springer: Singapore, 2023; pp. 575–585. [Google Scholar]
  5. Wang, X.D.; Chen, X.A.; Ren, W.H.; Han, Z.; Fan, H.J.; Tang, Y.D.; Liu, L.Q. Compensation Atmospheric Scattering Model and Two-Branch Network for Single Image Dehazing. IEEE Trans. Emerg. Top. Comput. Intell. 2024, 8, 2880–2896. [Google Scholar] [CrossRef]
  6. Hounsfield, G.N. Computed medical imaging. Science 1980, 22, 22–28. [Google Scholar] [CrossRef]
  7. Wang, F.F.; Chen, X.A.; Wang, X.D.; Ren, W.H.; Tang, Y.D. Research on Object Detection Methods in Low-light Conditions. In International Conference on Intelligent Robotics and Applications; Springer: Singapore, 2023; pp. 564–574. [Google Scholar]
  8. Wang, X.D.; Ren, W.H.; Chen, X.A.; Fan, H.J.; Tang, Y.D.; Han, Z. Uni-YOLO: Vision-Language Model-Guided YOLO for Robust and Fast Universal Detection in the Open World. In Proceedings of the 32nd ACM International Conference on Multimedia (MM’ 24), Melbourne, VIC, Australia, 28 October–1 November 2024; Association for Computing Machinery: New York, NY, USA; pp. 1991–2000. [Google Scholar]
  9. Tan, S.F.; Isa, N.A.M. Exposure based multi-histogram equalization contrast enhancement for non-uniform illumination images. IEEE Access 2019, 7, 70842–70861. [Google Scholar] [CrossRef]
  10. Wang, Z.G.; Liang, Z.H.; Liu, C.L. A realtime image processor with combining dynamic contrast ratio enhancement and inverse gamma correction for pdp. Displays 2009, 30, 133–139. [Google Scholar] [CrossRef]
  11. Land, E.H. The retinex theory of color vision. Sci. Am. 1977, 237, 108–129. [Google Scholar] [CrossRef]
  12. Zhang, Y.H.; Zhang, J.W.; Guo, X.J. Kindling the darkness: A practical low-light image enhancer. In Proceedings of the 27th ACM International Conference on Multimedia, Nice, France, 21–25 October 2019; pp. 1632–1640. [Google Scholar]
  13. Guo, C.; Li, C.; Guo, J.; Loy, C.C.; Hou, J.; Kwong, S.; Cong, R. Zero-reference deep curve estimation for low-light image enhancement. In Proceedings of the IEEE Conference on Computer Vision and Pattern Recognition, Seattle, WA, USA, 21–23 June 2020; pp. 1780–1789. [Google Scholar]
  14. Wu, W.; Weng, J.; Zhang, P.; Wang, X.; Yang, W.; Jiang, J. Uretinex-net: Retinex based deep unfolding network for low-light image enhancement. In Proceedings of the IEEE Conference on Computer Vision and Pattern Recognition, New Orleans, LA, USA, 18–24 June 2022; pp. 5901–5910. [Google Scholar]
  15. Zhang, Z.; Zheng, H.; Hong, R.C.; Xu, M.L.; Yan, S.C.; Wang, M. Deep color consistent network for low-light image enhancement. In Proceedings of the IEEE Conference on Computer Vision and Pattern Recognition, New Orleans, LA, USA, 18–24 June 2022; pp. 1889–1898. [Google Scholar]
  16. Wei, C.; Wang, W.; Yang, W.; Liu, J. Deep retinex decomposition for low-light enhancement. In Proceedings of the 29th British Machine Vision Conference, Newcastle, UK, 3–6 September 2018; BMVA Press: Durham, UK, 2018; Volume 14, pp. 155–167. [Google Scholar]
  17. Dosovitskiy, A.; Beyer, L.; Kolesnikov, A.; Weissenborn, D.; Zhai, X.; Unterthiner, T.; Dehghani, M.; Minderer, M.; Heigold, G.; Gelly, S.; et al. An image is worth 16x16 words: Transformers for image recognition at scale. arXiv 2020, arXiv:2010.11929. [Google Scholar]
  18. Zamir, S.W.; Arora, A.; Khan, S.; Hayat, M.; Khan, F.S. Restormer: Efficient transformer for high-resolution image restoration. In Proceedings of the IEEE Conference on Computer Vision and Pattern Recognition, New Orleans, LA, USA, 19–20 June 2022. [Google Scholar]
  19. Cai, Y.H.; Bian, H.; Lin, J.; Wang, H.Q.; Radu Timofte Zhang, Y.L. Retinexformer: One-stage retinexbased transformer for low-light image enhancement. In Proceedings of the IEEE/CVF International Conference on Computer Vision, Paris, France, 2–6 October 2023. [Google Scholar]
  20. Wang, T.; Zhang, K.H.; Shen, T.R.; Luo, W.H.; Bjorn Stenger Lu, T. Ultra-high-definition low-light image enhancement: A benchmark and transformer-based method. In Proceedings of the AAAI Conference on Artificial Intelligence, Washington, DC, USA, 7–14 February 2023; Volume 37, pp. 2654–2662. [Google Scholar]
  21. Huang, J.; Liu, Y.J.; Zhao, F.; Yan, K.Y.; Zhang, J.H.; Huang, Y.K.; Zhou, M.; Xiong, Z.W. Deep Fourier-Based Exposure Correction Network with Spatial-Frequency Interaction. In European Computer Vision Association; Springer: Berlin/Heidelberg, Germany, 2022; pp. 163–180. [Google Scholar]
  22. Li, C.Y.; Guo, C.L.; Zhou, M.; Liang, Z.X.; Zhou, S.C.; Feng, R.C.; Chen, C.L. Embedding Fourier for Ultra-High-Definition Low-Light Image Enhancement. arXiv 2023, arXiv:2302.11831. [Google Scholar]
  23. Wang, C.; Wu, H.; Jin, Z. Fourllie: Boosting low-light image enhancement by fourier frequency information. In Proceedings of the 31st ACM International Conference on Multimedia, Ottawa, ON, Canada, 29 October–3 November 2023; pp. 7459–7469. [Google Scholar]
  24. Fang, X.; Li, Q.; Li, Q.; Ding, K.; Zhu, J. Exploiting Graph and Geodesic Distance Constraint for Deep Learning-Based Visual Odometry. Remote Sens. 2022, 14, 1854. [Google Scholar] [CrossRef]
  25. Ma, L.; Ma, T.; Liu, R.; Fan, X.; Luo, Z. Toward fast, flexible, and robust low-light image enhancement. In Proceedings of the Conference on Computer Vision and Pattern Recognition, New Orleans, LA, USA, 11–15 June 2022. [Google Scholar]
  26. Brateanu, A.; Balmez, R.; Avram, A.; Orhei, C.; Ancuti, C. LYT-NET: Lightweight YUV Transformer-based Network for Low-light Image Enhancement. IEEE Signal Process. Lett. 2024, 32, 2065–2069. [Google Scholar] [CrossRef]
  27. Xu, L.; Hu, C.; Zhang, B.; Wu, F.; Cai, Z. Swin Transformer and ResNet Based Deep Networks for Low-light Image Enhancement. Multimed. Tools. Appl. 2024, 83, 26621–26642. [Google Scholar] [CrossRef]
  28. Wang, W.; Jin, Z. CAPformer: Compression-Aware Pre-trained Transformer for Low-Light Image Enhancement. In Proceedings of the IEEE International Conference on Multimedia and Expo, Niagara Falls, ON, Canada, 15–19 July 2024; pp. 1–6. [Google Scholar]
  29. Tan, J.; Pei, S.; Qin, W.; Fu, B.; Li, X.; Huang, L. Wavelet-based mamba with fourier adjustment for low-light image enhancement. In Proceedings of the Asian Conference on Computer Vision, Hanoi, Vietnam, 8–12 December 2024; pp. 3449–3464. [Google Scholar]
  30. Yu, H.; Zheng, N.; Zhou, M.; Huang, J.; Xiao, Z.; Zhao, F. Frequency and spatial dual guidance for image dehazing. In Proceedings of the 2022 European Conference on Computer Vision, Tel Aviv, Israel, 23–27 October 2022; Springer: Berlin/Heidelberg, Germany, 2022; pp. 181–198. [Google Scholar]
  31. Xue, M.L.; He, J.H.; He, Y.Y.; Liu, Z.P.; Wang, W.H.; Zhou, M.L. Low-light image enhancement via clip-fourier guided wavelet diffusion. arXiv 2024, arXiv:2401.03788. [Google Scholar]
  32. Yu, H.; Huang, J.; Zhao, F.; Gu, J.; Loy, C.C.; Meng, D.; Li, C. Deep fourier up-sampling. In Advances in Neural Information Processing Systemsl; Curran Associates, Inc.: New York, NY, USA, 2022; Volume 35, pp. 22995–23008. [Google Scholar]
  33. Wang, Z.; Tao, H.; Zhou, H.; Deng, Y.; Zhou, P. A content-style control network with style contrastive learning for underwater image enhancement. Multimedia. Syst. 2025, 31, 60. [Google Scholar] [CrossRef]
  34. Chen, X.; Tao, H.; Zhou, H.; Zhou, P.; Deng, Y. Hierarchical and progressive learning with key point sensitive loss for sonar image classification. Multimed. Syst. 2024, 30, 380. [Google Scholar] [CrossRef]
  35. Yang, W.; Wang, W.; Huang, H.; Wang, S.; Liu, J. Sparse gradient regularized deep retinex network for robust low-light image enhancement. IEEE Trans. Image Process. 2021, 30, 2072–2086. [Google Scholar] [CrossRef]
  36. Bychkovsky, V.; Paris, S.; Chan, E.; Durand, F. Learning photographic global tonal adjustment with a database of input/output image pairs. In Proceedings of the IEEE Conference on Computer Vision and Pattern Recognition, Colorado Springs, CO, USA, 6–13 November 2011; pp. 97–104. [Google Scholar]
  37. Cui, Z.; Li, K.; Gu, L.; Su, S.; Gao, P.; Jiang, Z.; Qiao, Y.; Harada, T. You Only Need 90K Parameters to Adapt Light: A Light Weight Transformer for Image Enhancement and Exposure Correction. In Proceedings of the British Machine Vision Conference, London, UK, 21–24 November 2022. [Google Scholar]
  38. Wang, Z.; Bovik, A.C.; Sheikh, H.R.; Simoncelli, E.P. Image quality assessment: From error visibility to structural similarity. IEEE Trans. Image Process. 2004, 13, 600–612. [Google Scholar] [CrossRef]
  39. Guo, X.; Li, Y.; Ling, H. Lime: Low-light image enhancement via illumination map estimation. IEEE Trans. Image Process. 2016, 26, 982–993. [Google Scholar] [CrossRef]
  40. Jiang, Y.F.; Gong, X.Y.; Liu, D.; Cheng, Y.; Fang, C.; Shen, X.H.; Yang, J.C.; Zhou, P.; Wang, Z.Y. Enlightengan: Deep light enhancement without paired supervision. IEEE Trans. Image Process. 2021, 30, 2340–2349. [Google Scholar] [CrossRef]
  41. Wang, R.X.; Zhang, Q.; Fu, C.H.; Shen, X.Y.; Zheng, W.S.; Jia, J.Y. Underexposed photo enhancement using deep illumination estimation. In Proceedings of the Conference on Computer Vision and Pattern Recognition, Long Beach, CA, USA, 15–20 June 2019; pp. 6842–6850. [Google Scholar]
  42. Xu, K.; Yang, X.; Yin, B.C. Learning to restore low-light images via decomposition-and-enhancement. In Proceedings of the Conference on Computer Vision and Pattern Recognition, Seattle, WA, USA, 13–19 June 2020; pp. 2278–2287. [Google Scholar]
  43. Yang, W.H.; Wang, S.Q.; Fang, Y.M.; Wang, Y.; Liu, J.Y. Band representation-based semi-supervised low-light image enhancement: Bridging the gap between signal fidelity and perceptual quality. TIP 2021, 30, 3461–3473. [Google Scholar] [CrossRef] [PubMed]
  44. Liu, R.S.; Ma, L.; Zhang, J.A.; Fan, X.; Luo, Z.X. Retinex-inspired unrolling with cooperative prior architecture search for low-light image enhancement. In Proceedings of the Conference on Computer Vision and Pattern Recognition, Nashville, TN, USA, 20–25 June 2021; pp. 10556–10565. [Google Scholar]
  45. Fu, Z.; Yang, Y.; Tu, X.; Huang, Y.; Ding, X.; Ma, K.K. Learning a simple low-light image enhancer from paired low-light instances. In Proceedings of the IEEE/CVF Conference on Computer Vision and Pattern Recognition, Vancouver, BC, Canada, 18–22 June 2023; pp. 22252–22261. [Google Scholar]
  46. Shi, Y.Q.; Liu, D.; Zhang, L.G.; Tian, Y.; Xia, X.Z.; Fu, X.J. ZERO-IG: Zero-shot illumination-guided joint denoising and adaptive enhancement for low-light images. In Proceedings of the IEEE/CVF Conference on Computer Vision and Pattern, Seattle, WA, USA, 17–21 June 2024; pp. 3015–3024. [Google Scholar]
  47. Ji, S.; Xu, S.; Xiao, N.; Cheng, X.; Chen, Q.; Jiang, X. Boosting the Performance of LLIE Methods via Unsupervised Weight Map Generation Network. Appl. Sci. 2024, 14, 4962. [Google Scholar] [CrossRef]
  48. Huang, J.; Lu, P.; Sun, S.; Wang, F. Multimodal Sentiment Analysis in Realistic Environments Based on Cross-Modal Hierarchical Fusion Network. Electronics 2023, 12, 3504. [Google Scholar] [CrossRef]
  49. Yao, K.; Jiang, G.; Yu, M.; Chen, Y.; Cui, Y.; Jiang, Z. Quality assessment for multi-exposure fusion light field images with dynamic region segmentation. Digit. Signal Process. 2024, 154, 104666. [Google Scholar] [CrossRef]
  50. Chulwoo, L.; Chul, L.; Chang, S.K. Contrast enhancement based on layered difference representation of 2D histograms. IEEE Trans. Image Process. 2013, 22, 5372–5384. [Google Scholar]
  51. Vonikakis, V.; Kouskouridas, R.; Gasteratos, A. On the evaluation of illumination compensation algorithms. Multimed. Tools Appl. 2018, 77, 9211–9231. [Google Scholar] [CrossRef]
  52. Wang, S.; Zheng, J.; Hu, H.M.; Li, B. Naturalness preserved enhancement algorithm for non-uniform illumination images. IEEE Trans. Image Process. 2013, 22, 3538–3548. [Google Scholar] [CrossRef]
Figure 1. FreqSpatNet overall architecture diagram.
Electronics 14 02220 g001
Figure 2. SFPB module architecture diagram.
Electronics 14 02220 g002
Figure 3. The comparison results between the proposed method and the mainstream method on the LOL-v2-synthetic dataset.
Electronics 14 02220 g003
Figure 4. Visualization results of the proposed method compared with mainstream methods on the LOL-v2-synthetic dataset.
Electronics 14 02220 g004
Figure 5. The comparison results between the proposed method and the mainstream method on the MIT-Adobe-FiveK dataset.
Electronics 14 02220 g005
Figure 6. Visualization results of the proposed method compared with mainstream methods on the MIT-Adobe-FiveK dataset.
Electronics 14 02220 g006
Figure 7. A visual comparison with current state-of-the-art methods on the NPE dataset.
Electronics 14 02220 g007
Figure 8. A visual comparison with current state-of-the-art methods on the DICM dataset.
Electronics 14 02220 g008
Figure 9. Visual comparison of different methods on the VV dataset.
Electronics 14 02220 g009
Table 1. A quantitative comparison between the LOL-v2-synthetic dataset and the MIT-Adobe-FiveK dataset. The top-ranking outcomes are depicted in crimson, while the second-best results are illustrated in azure.
MethodLOL-v2-SyntheticMIT-Adobe-FiveK
PSNRSSIMPSNRSSIM
LIME [39]16.880.77617.790.826
RetinexNet [16]17.130.79812.690.644
EnGAN [40]16.570.73415.010.768
KinD [12]13.290.57817.170.696
DeepUPE [41]15.080.62318.780.822
FIDE [42]15.200.61317.170.696
DRBN [43]23.220.92715.950.704
RUAS [44]16.550.6529.530.610
DCC [15]18.350.79013.750.618
SCI [25]22.200.88716.290.795
URetinex-Net [14]22.890.89514.100.734
Restormer [18]21.410.83021.200.812
PairLIE [45]19.070.79410.550.642
FourLLIE [23]24.650.91925.180.908
LLFormer [20]24.600.92025.460.906
Zero-IG [46]14.830.72118.330.588
Ours24.980.92225.570.910
Table 2. The NIQE outcomes for the MEF, LIME, NPE, VV, and DICM datasets showcase the most outstanding results, which are denoted in crimson, while the second-best performances are indicated in azure.
MethodsMEFLIMENPEVVDICMAVG
LIME [39]4.4474.1553.7962.7503.0013.630
RetinexNet [16]4.4084.3613.9433.8164.2094.147
KinD [12]4.8194.7724.1753.8353.6144.194
DRBN [43]4.8694.5623.9213.6714.3694.278
RUAS [44]5.4355.3227.1984.9877.3066.050
DCC [15]4.5934.4243.7033.2833.7043.941
SCI [25]3.6084.4634.1245.3124.5194.405
URetinex-Net [14]4.2314.6944.0283.8514.7744.316
Restormer [18]3.8154.3653.7293.7953.9643.934
PairLIE [45]4.0634.5824.1843.5724.0334.087
FourLLIE [23]4.3624.4023.9093.1683.3743.907
Zero-IG [46]3.5284.2332.4633.5764.2253.605
Ours3.4964.1503.4723.6623.0703.570
Table 3. Quantitative comparison in terms of parameters, FLOPs.
MethodsRetinexNetKinDDRBNRUASURetinex-NetEnGANRestormerLLFormerOurs
Params (M)0.8388.5400.5770.0010.3608.36726.13324.5234.291
FLOPs (G)148.5436.5742.410.28233.0972.61144.2522.5212.11
Table 4. Ablation experiments.
Ablation ModuleLOL-v2-SyntheticMIT-Adobe-5k
PSNRSSIMPSNRSSIM
w/o F24.150.91524.220.908
w/o S18.500.75519.210.826
w/o CAFB23.880.91924.370.907
w/o OF23.250.91024.100.825
Ours24.980.92225.570.910
Table 5. “Deeper vs. Wider” analysis.
DimFLOPsParamsPSNRSSIMTime
1612.11 G4.291 M24.980.9220.045 s
3220.56 G4.571 M24.990.9200.082 s
4830.24 G5.661 M24.910.9240.114 s
Disclaimer/Publisher’s Note: The statements, opinions and data contained in all publications are solely those of the individual author(s) and contributor(s) and not of MDPI and/or the editor(s). MDPI and/or the editor(s) disclaim responsibility for any injury to people or property resulting from any ideas, methods, instructions or products referred to in the content.

