Article

Study on Threshold Voltage Drift for SiC MOSFET Under Avalanche Stress

1
Huafeng Test & Control Technology (Tianjin) Co., Ltd., Tianjin 300457, China
2
Ningbo Daxin Semiconductor Co., Ltd., Ningbo 315400, China
3
Beijing Huafeng Test & Control Technology Co., Ltd., Beijing 100094, China
4
School of Integrated Circuits, Tsinghua University, Beijing 100084, China
5
College of Electronic and Information Engineering, Shandong University of Science and Technology, Qingdao 266590, China
6
Institute of Microelectronics of Chinese Academy of Sciences, Beijing 100029, China
*
Author to whom correspondence should be addressed.
Electronics 2025, 14(22), 4511; https://doi.org/10.3390/electronics14224511
Submission received: 26 September 2025 / Revised: 6 November 2025 / Accepted: 13 November 2025 / Published: 18 November 2025

Abstract

In this article, a dedicated testing system is developed to realize low-delay threshold voltage (VTH) characteristic testing of silicon carbide (SiC) MOSFET devices after an avalanche stress. The developed low-delay testing system enables VTH detection within milliseconds after the avalanche, facilitating the study of VTH drift behavior under different gate-source turn-off voltages (VGS-OFF) and repeated avalanche events. Experimental results of 1200 V commercial devices indicate that after a single avalanche stress, VTH drifts positively by about 0.11 V when VGS-OFF is 0 V. However, if the avalanche stress is monitored at a negative bias of VGS-OFF, VTH exhibits a negative drift. The drift increases as a more negative gate bias is applied. When VGS-OFF reaches 6 V, the VTH drift saturates at approximately −0.226 V. After repeated avalanche cycles, the threshold drift does not saturate until VGS-OFF is −10 V. Furthermore, verification shows that the VTH drift is minimized when VGS-OFF is −3 V. The absolute value of VTH drift shows a non-monotonic variation with avalanche cycles: it starts to increase with the number of avalanche cycles, reaching a peak at approximately 1000 cycles, and further increasing the avalanche cycles. The magnitude of the drift gradually decreases after reaching a peak. TCAD simulations reveal that this phenomenon could be attributed to the ionization of donor/acceptor traps at the SiC/SiO2 interface and the consequent modulation of channel hole concentration. After excitation by electric fields of varying intensities, the ionization of acceptor and donor traps undergoes differential changes, consequently leading to a non-monotonic drift in threshold voltage.

1. Introduction

Silicon carbide metal-oxide-semiconductor field-effect transistors (SiC MOSFET) have demonstrated great potential in high-voltage and high-power applications, including new energy generation, electric vehicles, and industrial power supplies, attributing to their high breakdown voltage, low on-state resistance, and exceptional high-temperature performance [1,2,3,4,5]. However, in practical applications, SiC MOSFETs often face the challenge of dynamic avalanche stress, particularly during the switching process of inductive loads. When the energy stored in the inductor is unable to be promptly discharged, the device may enter a non-clamped inductive switching (UIS) state, leading to instantaneous high-voltage and high-current surges. This avalanche stress has been demonstrated to cause instantaneous breakdown failure [6,7,8,9] and drift of device parameters including threshold voltage (VTH) and on-state resistance (RDS(on)), which in turn severely impact the safe operation of the device [10,11,12].
The industry has conducted extensive and in-depth research on the single-pulse or repetitive avalanche capability of SiC MOSFET under various stress conditions. Additionally, studies have reported on the degradation of device parameters caused by single or repeated avalanche events [9,10,11,12]. However, existing research is subject to several limitations: (1) a considerable delay between the parameter detection after avalanche and the actual avalanche results in the impracticality of achieving low-latency, high-precision quantitative detection after avalanche; (2) the research has not explored the impact of the gate turn-off voltage (VGS-OFF) on VTH drift during the avalanche stress. In this study, a novel one-stop post-avalanche VTH drift testing system has been developed. It facilitates a low-latency rapid detection of VTH within less than 10 ms after avalanche stress and enables the implementation of various VGS-OFF during the avalanche stress process.
A dedicated testing system was developed using the STS8200 test platform from Beijing Huafeng Test & Control Technology Co., Ltd., Beijing, China. By optimizing the test circuit control method, this system has been proved to achieve microsecond-level avalanche stress pulse-width control, and millisecond-level delay on VTH measurement after the avalanche. Corresponding analyses on Wolfspeed’s commercial C3M0040120K1 planar SiC MOSFET (Wolfspeed is a leading U.S.-based manufacturer of silicon carbide (SiC) semiconductors) were performed based on the simulations and empirical test results obtained from this system. The analysis revealed the impact of gate turn-off voltages during avalanche stress on the VTH drift of SiC MOSFET, as well as the effect of avalanche cycles on VTH drift. This study provides a lower-latency detection method for studying the VTH drift of SiC MOSFET after avalanche stress. The physics behind the different VTH drift behavior after various VGS-OFF was studied with the aid of TCAD simulations.

2. Low-Latency VTH Drift Test

It is widely acknowledged that UIS is considered one of the extreme stress conditions that power devices encounter in power electronics applications. During the on-state of the device, the energy within the circuit is stored in the inductor. When the device turns off, the stored energy is transferred directly to the device. It results in an avalanche breakdown and forces the device to absorb and dissipate the energy from the inductor. After an avalanche stress, VTH drift may occur. Severe VTH drift significantly increases the risks of the application including direct bridge arm transmission and uneven current distribution in parallel. Therefore, it is imperative to characterize the threshold drift swiftly and precisely.
The test system developed in this study realizes one-stop testing of avalanche application and VTH detection, enabling rapid switching with millisecond-level delay. All test data in this paper were obtained under a controlled ambient temperature (25 °C), and the threshold voltage (VTH) was extracted using the constant drain current criterion with IDS at 10 mA. The test sequence diagram in Figure 1 illustrates this method. It begins with a measurement of VTH from t0 to t1, recorded as VTH-1. An avalanche is then applied from t2 to t4. After the avalanche event and a delay of several milliseconds (t4 to t5), another VTH test is performed from t5 to t6, and the VTH value after the avalanche is recorded as VTH-2. The system then automatically calculates the threshold drift (ΔVTH = VTH-2 − VTH-1) before and after the avalanche stress. A precise control over the avalanche current and energy can be achieved by controlling the time tpulse = t3 − t2 during the test. Additionally, the system can support multiple avalanche modes, as illustrated in Figure 2, which demonstrates the timing diagram of the low-latency VTH drift test system for multiple avalanches. This system can achieve low-latency rapid VTH drift tests after multiple avalanche stress cycles through timing control.
The main circuit topology of the functional unit tested in this study is illustrated in Figure 3. In order to prevent interference from different functional units, the system controls the rapid disconnection of the avalanche loop and the VTH test loop by installing multiple control switches with fast power devices. These switches are named K1~K5. The system employs a combination of high-speed solid-state relays (K1, K3, K4) for fast, isolated switching in the measurement circuits, and silicon IGBTs (K2, K5) to handle the high current in the avalanche stress path. During the initial threshold voltage (VTH-1) test, K2, K4, K5 are disconnected, while K1 and K3 are connected, so the gate and drain of the device are short-circuited. A fixed current is applied to the drain source of the device under test (DUT) through a current source, and the voltage difference between the drain and source is measured. The threshold voltage measurement was performed with the platform’s high-precision source measurement unit (SMU), featuring a resolution of 16-bit and an accuracy of ±0.05%, ensuring that the measured drifts are significantly above the measurement uncertainty. After the VTH-1 test, K1 and K3 are disconnected, and K2, K4, K5 are connected simultaneously, switching the circuit to the avalanche stress test mode. The switching sequence is governed by the platform’s central controller, ensuring synchronization with nanosecond-level jitter. The overall delay between the avalanche stress and the subsequent measurement is controlled with millisecond-level precision. The gate of the DUT is regulated by the driver controller, precisely controlling the timing process from t2 to t4 to apply the avalanche stress with millisecond-level accuracy. After the application of avalanche stress, K2, K4, K5 are disconnected, and K1, K3 are connected back, switching the circuit back to the threshold voltage test mode for the VTH-2 test.

3. Experimental Results and Analysis

This study selected the C3M0040120K1 device from Wolfspeed for testing and research. The nominal voltage specification of the device is 1200 V, and the typical value of RDS(on) at room temperature is 40 mΩ. All devices were initially characterized to record the pre-stress threshold voltage, which showed minimal variation (±0.1 V) across the fresh samples. Moreover, each data point in the article represents the average value obtained from five devices. All experimental waveforms were acquired using an oscilloscope with a bandwidth of 8 GHz and an ultra-high sampling rate of 25 GS/s, along with a high-precision probe. The voltage probes have a bandwidth of 100 MHz and an accuracy of ±2%, and the current probe has a bandwidth of 30 MHz and an accuracy of ±1%. (The ringing and noise observed on the waveforms are characteristic phenomena of high-speed switching during avalanche breakdown.)

3.1. Single Avalanche Threshold Drift Test

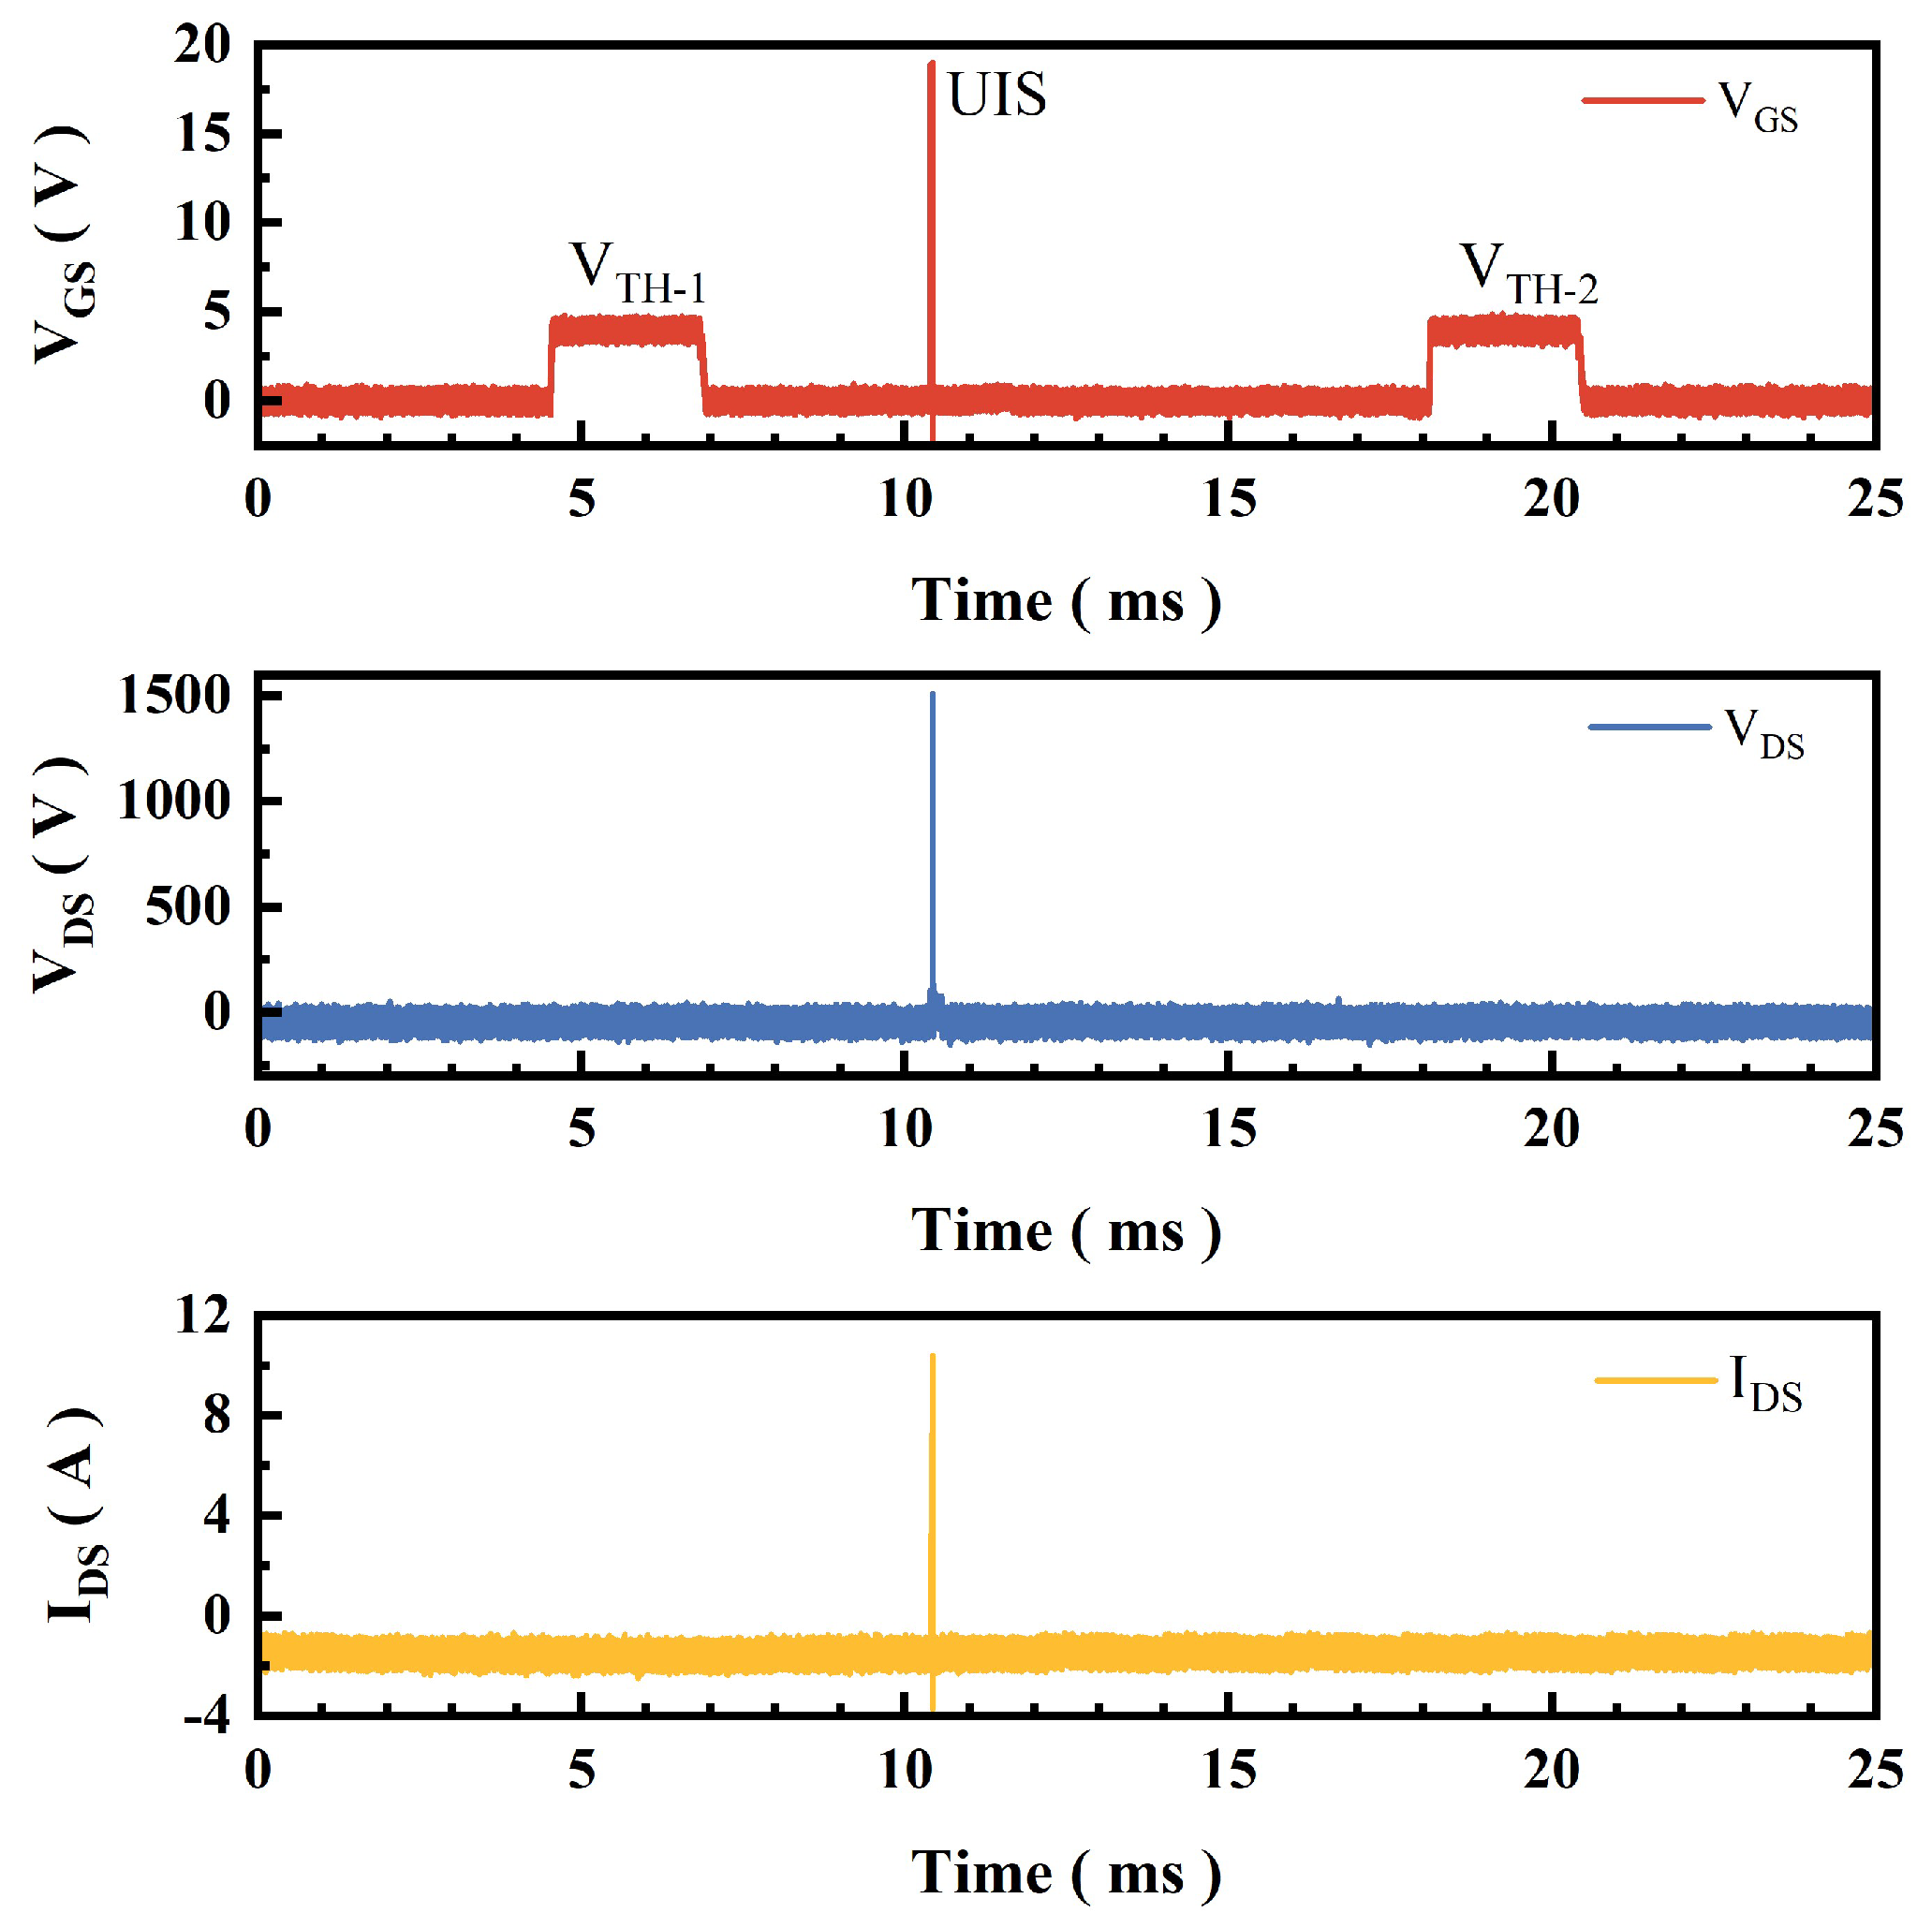
As shown in Figure 4, a single avalanche stress low-delay threshold drift test is conducted on the device. It demonstrates the actual VGS, VDS, IDS waveforms captured from this test. Two threshold voltage tests and a single avalanche stress application have been completed in one stop. Figure 5 magnifies the waveforms of VGS, VDS, and IDS at the avalanche stage. In the experiment, the avalanche test conditions were as follows: the initial VDS was 50 V, the energy storage inductor was 100 μH, the charging time of the energy storage inductor was 30 μs, the gate turn-on voltage was 18 V, and the avalanche current at the avalanche moment was 10.8 A.
The test system can apply different VGS-OFF to the device during the avalanche stress phase. VGS-OFF at 0 V, −3 V, −6 V, and −10 V were tested on the fresh samples that had not been subject to prior avalanche stress. Table 1 summarizes the VTH drift tests at the 8 ms delay time after a single avalanche stress at different VGS-OFF conditions. When VGS-OFF is 0 V, ΔVTH is positive, indicating forward drift of the threshold voltage. When VGS-OFF is negative, ΔVTH is negative, indicating reverse drift of the threshold voltage. As VGS-OFF decreases, ΔVTH shifts from positive to negative. When the gate voltage reaches VGS-OFF = −6 V, the threshold drift ΔVTH tends to saturate.
This system is capable of conducting a VTH test at any delay time after an avalanche test. A series of tests of the threshold voltage was conducted with various delay times of 8 ms, 1 s, 2 s, 10 s, 30 s, 100 s after avalanche stress to characterize the recovery of the threshold voltage after avalanche stress. The variation curve of VTH with time after the avalanche is shown in Figure 6. Table 1 presents the threshold voltage drift under different gate turn-off voltages for single avalanche stress. The maximum positive ΔVTH observed was +0.11 V at VGS-OFF = 0 V, and the negative ΔVTH saturated at approximately −0.226 V for VGS-OFF ≤ −6 V after a single avalanche. Regardless of VGS-OFF, as time after the avalanche increases, ΔVTH gradually approaches zero, indicating that the threshold drift of the device is gradually recovering. During the avalanche, the closer VGS-OFF is to 0 V, the smaller the threshold drift is.

3.2. Multiple Avalanche Threshold Drift Test

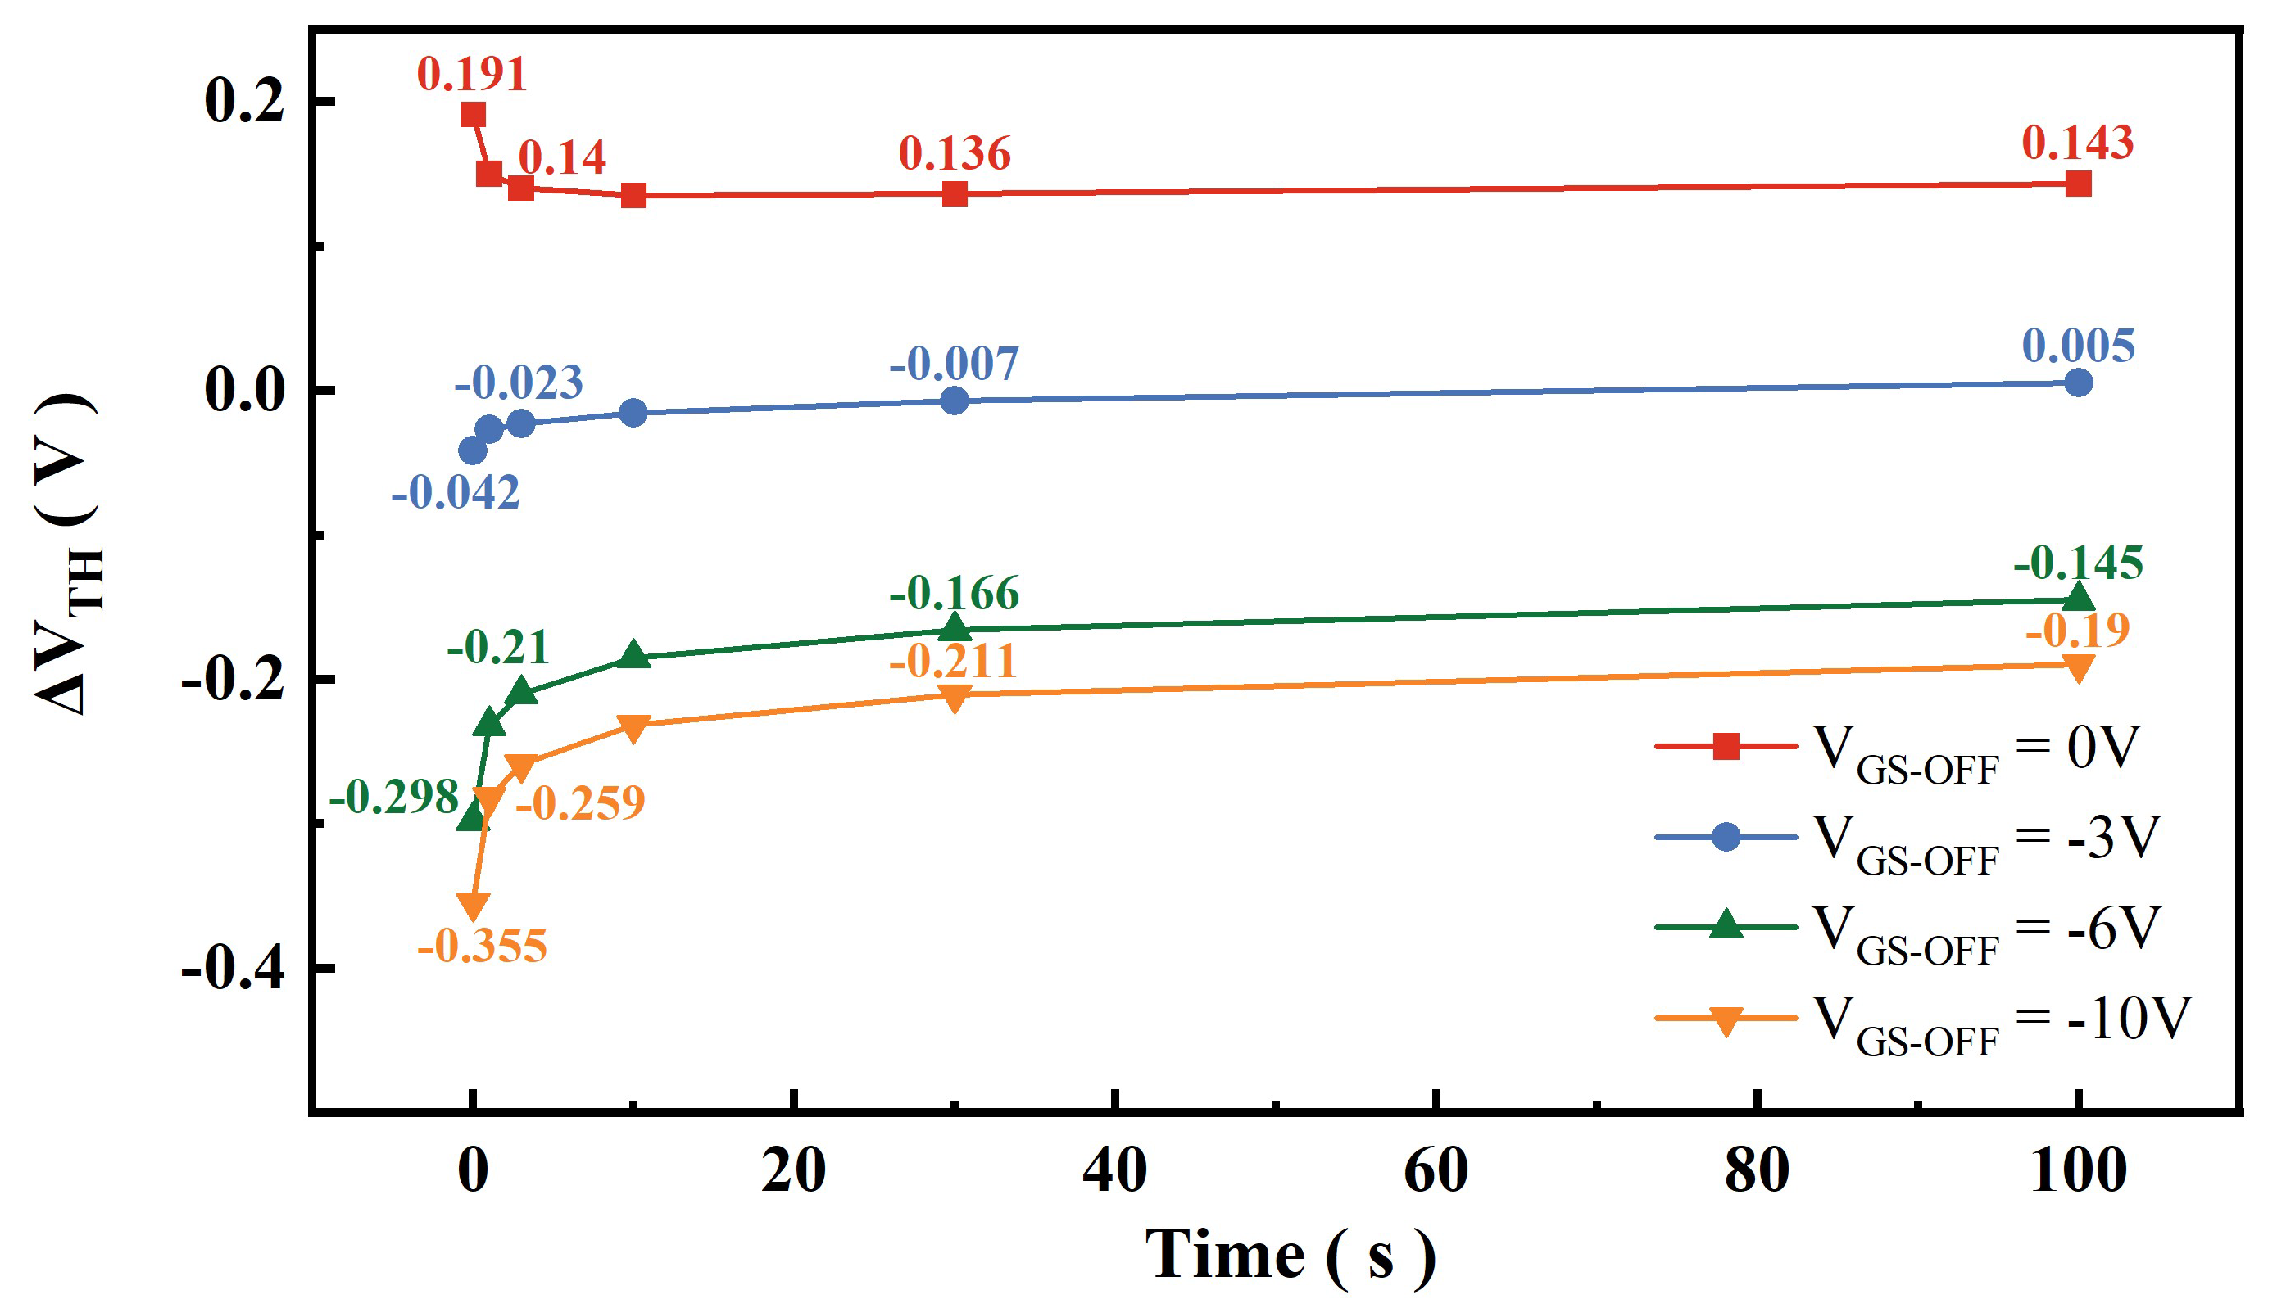
Based on the results of a single avalanche, the influence of repeated stress cycles was studied to understand the cumulative effect. Table 2 presents the results of the threshold drift test at 8 ms delay time after 1000 avalanche stress cycles under different VGS-OFF conditions. The variation in ΔVTH with time after 1000 avalanches is shown in Figure 7. The results show a trend similar to single avalanche stress test. When VGS-OFF is 0 V, the threshold voltage drifts positively. When VGS-OFF is negative, the threshold voltage drifts negatively. However, under the same test conditions, the absolute value of ΔVTH (|ΔVTH|) for most devices increases. When VGS-OFF = −6 V, the threshold drift does not saturate, and as VGS-OFF decreases, |ΔVTH| is still increasing. The trend of ΔVTH changes over time after the avalanche stress is consistent with that observed after the single avalanche stress test.
To further study the threshold drift trend after the avalanche stress cycles, tests after the avalanche stress cycles ranging from 1 to 5000 cycles were conducted on the device. The threshold drift of different avalanche times with VGS-OFF at 0 V and −6 V are presented in Figure 8. As the number of avalanche stress cycles increases, the amplitude of |ΔVTH| begins to decrease after reaching a peak at 500–1000 cycles, gradually approaching 0 V.

3.3. Mechanism Analysis

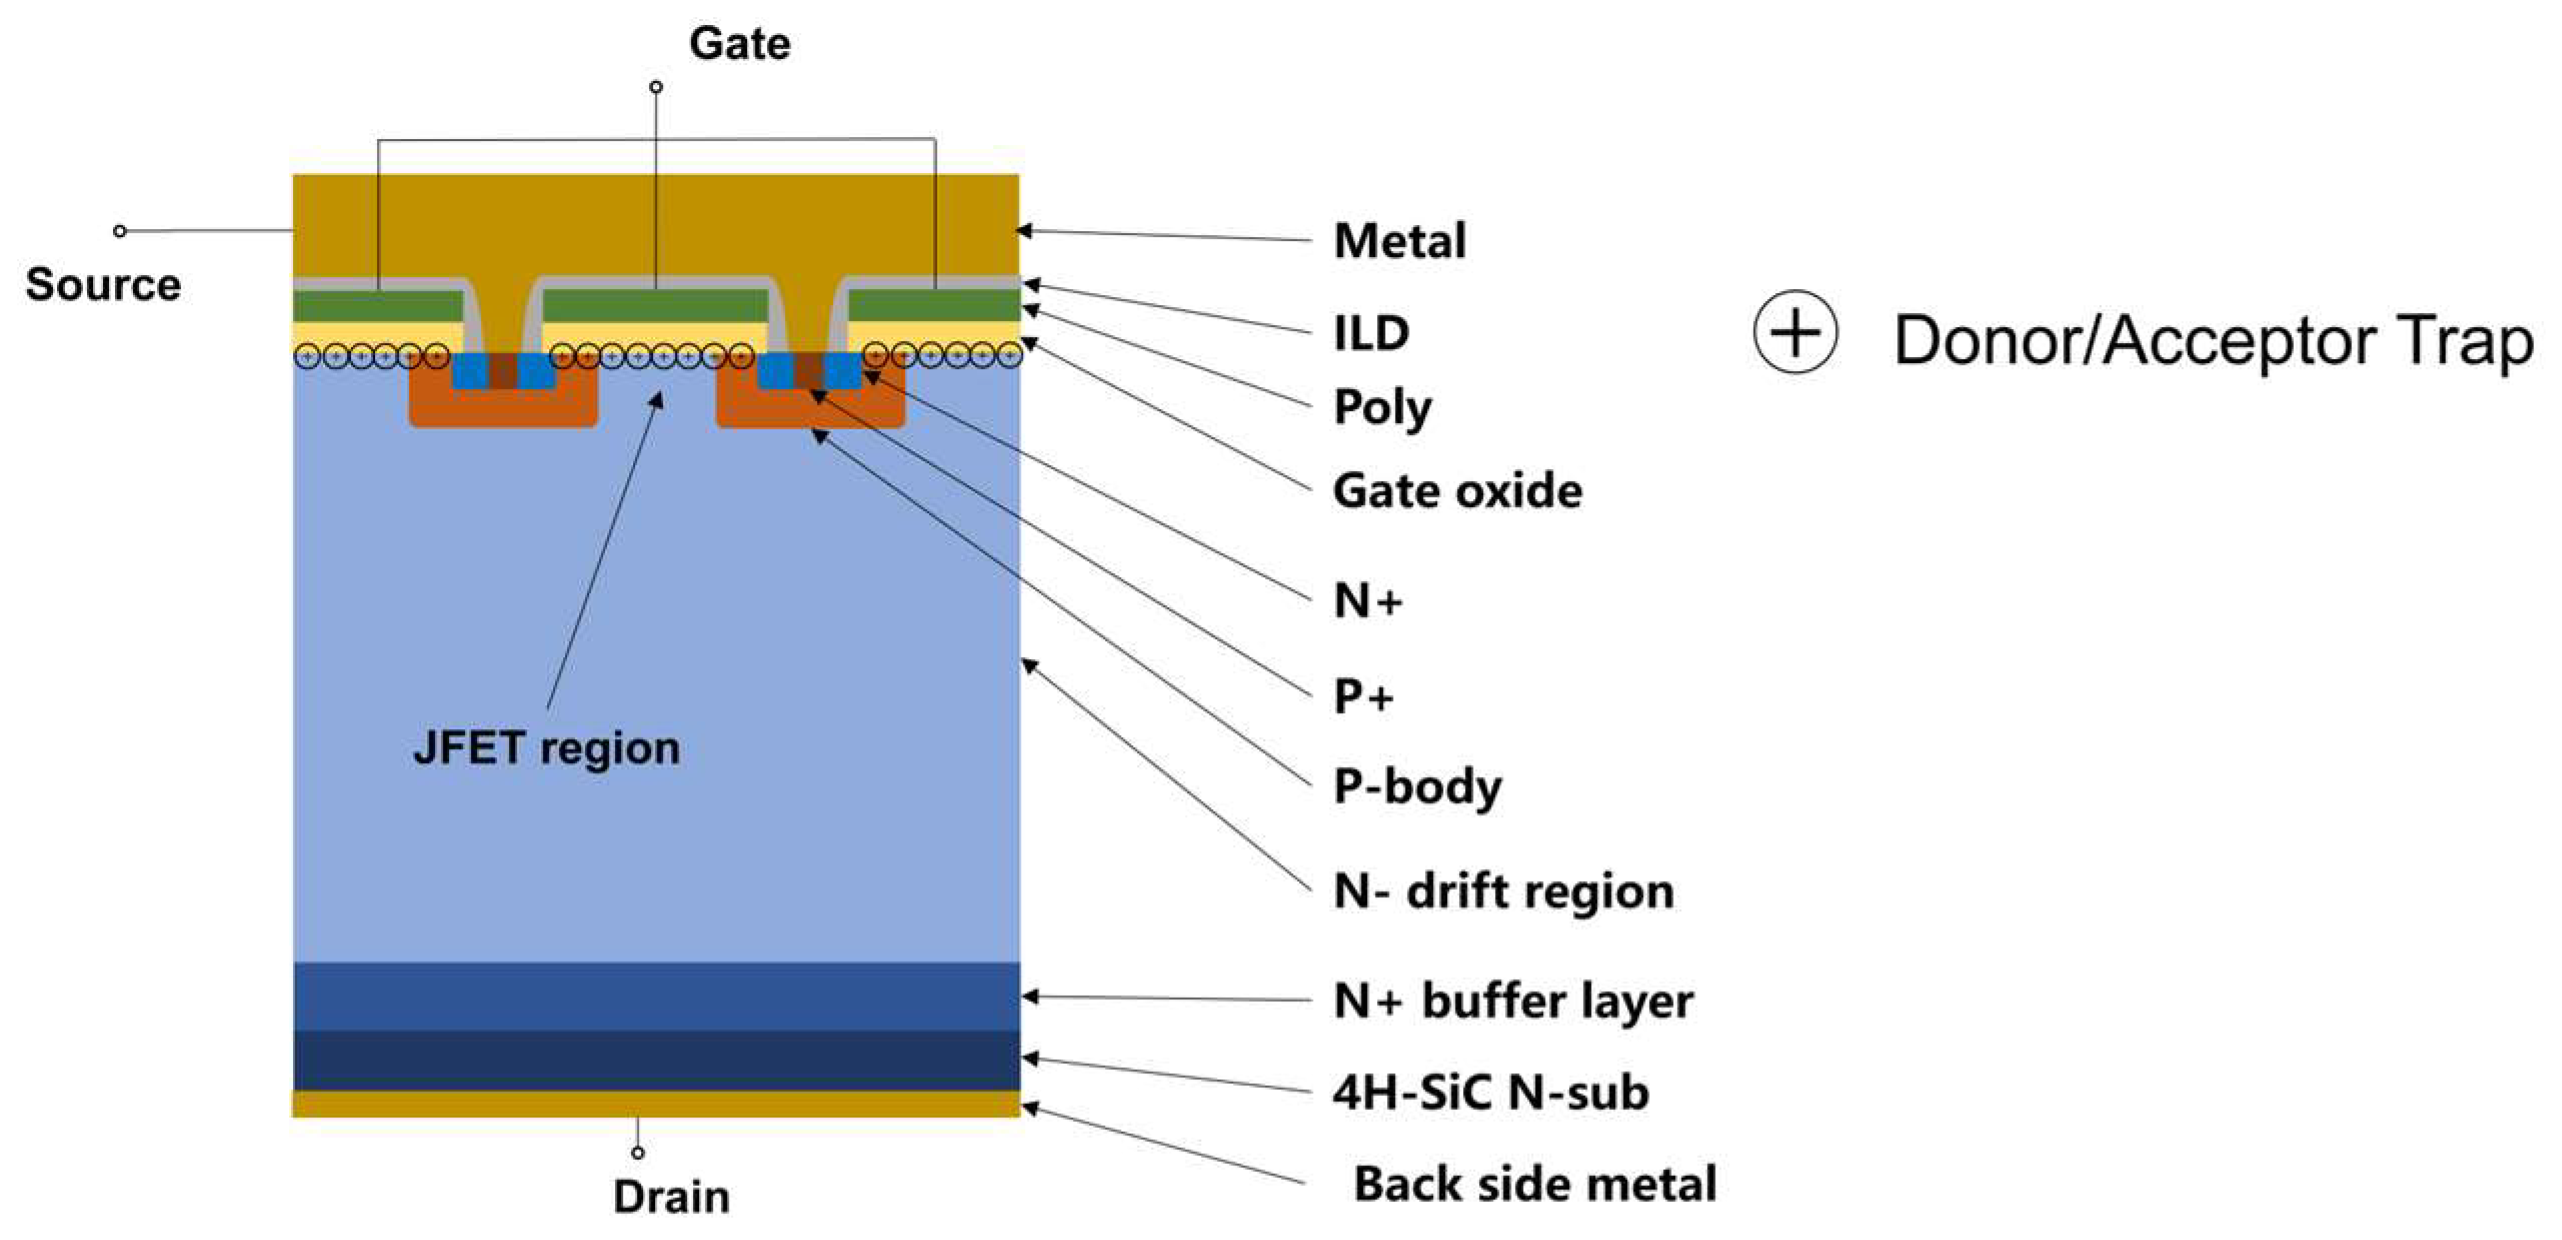
As proposed by Wei et al. [9], although a high-current density breakdown occurs at the p-n junction during avalanche breakdown, the primary cause of VTH drift is not the avalanche current flowing through the p-n junction. Instead, it could be attributed to the elevated electric field in the gate oxide during the avalanche. Under the influence of a strong electric field, the high-density acceptor or donor traps near the gate oxide ionize, forming negative or positive centers. After the removal of avalanche stress, the ionized traps near the gate oxide induce a drift of the threshold voltage of the device [13,14,15,16]. Figure 9 shows a schematic diagram of a planar SiC MOSFET. The internal structure of the device is described based on the different dielectrics or dopant impurities. Additionally, potential traps of either donor-type or acceptor-type are marked at the interface between the gate oxide and SiC.
A large number of acceptor-type and donor-type traps exist at the SiC/SiO2 interface [13,14,15,16]. During the stress phase, the deep-level acceptor traps release holes under a strong electric field, therefore generating negative space charges in the SiC/SiO2 interface. The hole trap emission rate (ep) can be expressed by (1) [17,18],
e p = σ p v p N V e E T E V k T
in which σp represents the capture cross-section of acceptor-type traps, vp denotes the thermal velocity of holes, NV stands for the valence band state density, and ET represents the energy level of acceptor-type traps.
During the recovery phase, these negatively charged acceptor-type traps begin to capture holes from the valence band, regaining neutrality. The hole trap capture rate (cp) can be expressed as (2) [17,18],
c p = σ p v p p = σ p v p N V e E F E V k T
in which p is the hole concentration, and EF − EV is the difference between the Fermi level and the valence band.
As demonstrated in (1) and (2), the hole emission rate is closely related to the energy levels of the trap states, while the hole capture rate is closely linked to the Fermi level (i.e., the concentration of holes in the valence band). The capture rate increases with rising temperature, indicating that the higher the temperature, the shorter the recovery process of ionized trap states. A similar trend applies to donor-type traps.
Under a certain electrical stress, traps would be ionized. The acceptor-types release holes, forming negative charge centers. These negative charge centers reduce the gate bias voltage, so a higher gate voltage to turn on the channel compared to the initial state is required. Consequently, VTH shifts in the positive direction. In contrast, the donor traps release electrons, forming positive charge centers that elevate the gate bias voltage, allowing the channel to be turned on with a lower gate voltage, i.e., a negative VTH shift.
Figure 10 shows the electric field distribution of the planar SiC MOSFET during avalanche breakdown. Avalanche simulation was conducted using a commercial TCAD software Synopsis Sentaurus (2019 version), with the gate-off voltage of the avalanche device set to VGS-OFF = 0 V. When the avalanche occurs, a high electric field is present not only at the p-n junction but also within the gate oxide layer. This electric field of up to 3 MV/cm can effectively trigger trap ionization, causing a threshold voltage drift.
Figure 11 extracts the electric field in the X-direction at the center of the gate oxide layer in planar devices during the avalanche from the center of the JFET to the right in the X-direction up to the boundary of the gate oxide near the active region. The electric field curve demonstrates that, under negative bias gate voltage conditions, the electric field at the center of the gate oxide is stronger, resulting in a stronger electric field at the SiC/SiO2 interface. Higher VGS-OFF negative bias during turn-off triggers a stronger electric field both inside the gate oxide and at the SiC/SiO2 interface.
Previous research has illustrated that the traps’ energy level parameters at the SiC/SiO2 interface are relatively complex, making quantitative studies difficult [13,14,15,16]. The model constructed in this study is primarily used for trend simulation research on threshold voltage drift after the avalanche. In TCAD simulation, an acceptor trap with an energy level of EC-0.68 eV and a donor trap with an energy level of EV + 0.68 eV were established at the SiC/SiO2 interface. The interface trap concentration for both types of traps is 2 × 1012 cm−2, and the capture cross-sections for electrons and holes are both set to 1 × 10⁻¹⁶ cm2 [19,20,21]. Based on the above settings, threshold voltage drift simulations under single avalanche stress were conducted for both VGS-OFF = 0 V and VGS-OFF = −6 V. The hole charge concentration within 0.5 μm depth under the gate oxide at the channel center position was extracted at the initial state, and 10 ms, 1 s, and 100 s after the avalanche. The hole concentration below the gate oxide in the channel significantly affects the VTH. Under single-variable conditions, a higher VTH is associated with a higher hole concentration and vice versa.
Figure 12 plots the hole concentration distribution within a 0.5 μm range around the channel center before and after avalanche stress with VGS-OFF = 0 V. It could be observed that the hole concentration increases at the 10 ms moment after the avalanche occurs, and gradually recovers toward the initial state with time. After the avalanche stress is removed, the hole concentration in the channel increases, leading to a positive VTH drift. Over time, the channel concentration gradually recovers to its initial state, causing the VTH to also return to its original value. The recovery rate of hole concentration from 10 ms to 1 s is significantly faster than from 1 s to 100 s, indicating that the VTH recovers more quickly during the initial stage after the stress is removed. The device testing results have shown a faster threshold recovery at the initial stage after the avalanche stress is removed, which aligns with the simulation results. During the early recovery, the ionized trap concentration is higher, resulting in a higher capture rate as per (2), thereby accelerating the recovery rate. Devices with larger drifts exhibit faster VTH recovery, as greater drift indicates a higher ionized trap concentration, leading to a faster recovery rate.
The hole concentration distribution within a 0.5 μm range around the channel center before and after avalanche stress with VGS-OFF = −6 V is presented in Figure 13. Simulation results reveal that within the range of 0.02 μm below the lower surface of the gate oxide, the hole concentration maintains a trend of rapid increase after avalanche stress and then gradually decreases over time. This reflects the influence of interface trapped charges on the surface potential. However, beyond 0.06 μm from the lower surface of the gate oxide, the hole concentration significantly decreases 10 ms after the avalanche event. Subsequently, the concentration of holes gradually increased as time went on. The hole concentration is more aligned with the doping concentration in the P-base region at positions farther from the lower surface of the gate oxide. Consequently, the concentration at positions above 0.06 μm below the lower surface of the gate oxide exerts a more significant impact on the VTH results. The trend of hole concentration first decreasing and then increasing will lead to a corresponding initially decreasing then increasing trend of VTH. As demonstrated in Figure 13, the recovery of hole concentration is faster within 10 ms to 1 s, and slower within 1 s to 100 s, which corresponds to the actual test trend of VTH. In the early recovery stage, the ionized trap concentration is higher, leading to a faster recovery rate.
The hole concentration distribution within a range of 0.5 μm on the surface of the channel center at 10 ms after the avalanche with different VGS-OFF is presented in Figure 14 with VGS-OFF of −1 V, −2 V, −3 V, −4 V, −5 V, −6 V, −10 V. It can be seen from the curve that as the negative bias voltage at the gate increases during the avalanche stress process, the hole concentration at the center of the channel continuously decreases at 10 ms after the avalanche. When the turn-off negative bias voltage reaches VGS-OFF = −4 V, the hole concentration no longer decreases. Within the range of VGS-OFF from −4 V to −10 V, the hole concentration on the surface of the channel remains relatively constant. In the actual single avalanche test results, the threshold drift results of the turn-off gate voltage −6 V and −10 V are identical, which aligns with simulation results. This occurs because the trap concentration is fixed; once the traps are fully ionized, the drift amplitude of the VTH no longer increases.
Simulation results confirmed that the simultaneous existence of acceptor and donor traps at the SiC/SiO2 interface will cause the same device to have different VGS-OFF during an avalanche, resulting in distinct threshold drift trends. Previous reports hypothesize that different electric field intensities can lead to different ionization effects in donor–acceptor traps [13,14,15,16], resulting in different dominant trap ionization effects, which in turn diverges the VTH drift. Simulation results from Figure 11 show that when the device is turned off with different VGS-OFF, significant changes occur in the electric field at the gate oxide interface. Notably, the experimental data in Figure 7 indicate that a VGS-OFF of approximately −3 V results in minimal VTH drift, suggesting a balance between the ionization of acceptor and donor traps under this specific bias condition. The test and simulation results in this study further validate previous hypothesis.
From the threshold drift results of 10 ms after 1000 avalanche stress cycles in the test, under the same test conditions, the VTH drift amount slightly increases, and the threshold drift amount does not reach saturation when VGS-OFF = −6 V. This may be due to multiple avalanches, and local high temperatures are formed within the device. The superimposed electric field stress of the avalanches causes the tunneling current to break the Si-O bond when flowing through the gate oxide, thus creating new traps [13,14,15,16]. This further altered the threshold drift, but the overall trend remained consistent with a single avalanche.
Threshold drift test results of 8 ms after 1 to 5000 avalanche stress cycles demonstrate that the absolute value of the threshold voltage drift of the device peaks around 1000 cycles and then gradually decreases. This could be attributed to effective heat accumulation in the device during the accumulative avalanche events [22]. As demonstrated in Formula (2) at high temperature, the trapping rate of carriers by the trap will increase significantly, which leads to a faster recovery speed of the device after the removal of electrical stress, consequently resulting in a decrease in the absolute value of the threshold voltage drift of the device.
In practical applications, however, the drive circuit does not actively apply a turn-off bias voltage as large as VGS-OFF = −10 V under normal operating conditions. Nevertheless, during the operation of SiC MOSFET, drastic changes in voltage and current can easily lead to issues such as crosstalk between the main circuit and the drive circuit, causing ringing in the drive voltage. At this point, negative bias voltage may hit over −10 V. Therefore, the large-amplitude negative bias voltage test research in this study is of practical significance for safe operation in device applications.

4. Conclusions

This work provides a new evaluation tool and a testing procedure to facilitate the study of the reliability degradation of SiC MOSFETs under extreme conditions. This study achieved VTH measurement with a millisecond-level delay time after avalanche tests, and different VGS-OFF have been applied to the device during the avalanche. A high electric field is observed at the SiC/SiO2 interface during the avalanche stress, and this electric field significantly intensifies under the negative VGS-OFF. Electric fields of various intensities excite the acceptor trap and donor trap with distinct ionization trends, thereby causing the device to exhibit threshold drift with different trends. During single avalanche tests, when VGS-OFF ≤ −6 V, the negative ΔVTH gradually saturates, and its non-monotonic drift with the number of avalanche cycles peaks at approximately 1000 cycles. The conclusions of this study provide clear guidance for device manufacturers and circuit designers. For device manufacturers, the correlation between VGS-OFF, avalanche stress, and threshold voltage drift offers key feedback for process optimization. For circuit designers, a moderate negative bias voltage can effectively suppress the long-term drift of threshold voltage while ensuring noise immunity, which is conducive to formulating new bias strategies that balance switching reliability and long-term stability.

Author Contributions

Conceptualization, L.C. and H.Z.; methodology, H.Z. and P.Y.; software, C.F. and H.L.; validation, H.Z., C.F. and L.C.; formal analysis, H.Z., R.Z., S.Y. and L.C.; investigation, C.F. and P.Y.; resources, L.C., H.L., S.Y. and H.Z.; data curation, C.F., H.L., S.Y. and H.Z.; writing—original draft preparation, C.F., H.Z. and L.C.; writing—review and editing, C.F., H.Z. and L.C.; supervision, L.C.; R.Z. and P.Y.; project administration, L.C., H.Z. and H.L. All authors have read and agreed to the published version of the manuscript.

Funding

This research received no external funding.

Data Availability Statement

Data are contained within the article.

Conflicts of Interest

Author Haitao Zhang is an employee of Huafeng Test & Control Technology (Tianjin) Co., Ltd. and Ningbo Daxin Semiconductor Co., Ltd. Huipeng Liu, Su Yan, Lin Cai, and Chen Fan are employees of Beijing Huafeng Test & Control Technology Co., Ltd. The remaining authors declare that the research was conducted in the absence of any commercial or financial relationships that could be construed as a potential conflict of interest. The paper reflects the views of the scientists and not the company.

References

  1. Tanimoto, Y.; Saito, A.; Matsuura, K.; Kikuchihara, H.; Jurgen Mattausch, H.; Miura-Mattausch, M.; Kawamoto, N. Power-Loss Prediction of High-Voltage SiC-mosfet Circuits with Compact Model Including Carrier-Trap Influences. IEEE Trans. Power Electron. 2016, 31, 4509–4516. [Google Scholar] [CrossRef]
  2. Wei, J.; Zhang, M.; Jiang, H.; Wang, H.; Chen, K.J. Dynamic Degradation in SiC Trench MOSFET With a Floating P-Shield Revealed With Numerical Simulations. IEEE Trans. Electron. Devices 2017, 64, 2592–2598. [Google Scholar] [CrossRef]
  3. Ouaida, R.; Berthou, M.; Leon, J.; Perpina, X.; Oge, S.; Brosselard, P.; Joubert, C. Gate Oxide Degradation of SiC MOSFET in Switching Conditions. IEEE Electron. Device Lett. 2014, 35, 1284–1286. [Google Scholar] [CrossRef]
  4. Vobecký, J. The Current Status of Power Semiconductors. Facta Univ. Ser. Electron. Energ. 2015, 28, 193–203. [Google Scholar] [CrossRef]
  5. Shi, Y.; Xie, R.; Wang, L.; Shi, Y.; Li, H. Switching Characterization and Short-Circuit Protection of 1200 V SiC MOSFET T-Type Module in PV Inverter Application. IEEE Trans. Ind. Electron. 2017, 64, 9135–9143. [Google Scholar] [CrossRef]
  6. Wang, Z.; Shi, X.; Tolbert, L.M.; Wang, F.; Liang, Z.; Costinett, D.; Blalock, B.J. Temperature-Dependent Short-Circuit Capability of Silicon Carbide Power MOSFETs. IEEE Trans. Power Electron. 2016, 31, 1555–1566. [Google Scholar] [CrossRef]
  7. Fayyaz, A.; Romano, G.; Castellazzi, A. Body Diode Reliability Investigation of SiC Power MOSFETs. Microelectron. Reliab. 2016, 64, 530–534. [Google Scholar] [CrossRef]
  8. Lelis, A.J.; Green, R.; Habersat, D.B.; El, M. Basic Mechanisms of Threshold-Voltage Instability and Implications for Reliability Testing of SiC MOSFETs. IEEE Trans. Electron. Devices 2015, 62, 316–323. [Google Scholar] [CrossRef]
  9. Wei, J.; Liu, S.; Li, S.; Fang, J.; Li, T.; Sun, W. Comprehensive Investigations on Degradations of Dynamic Characteristics for SiC Power MOSFETs Under Repetitive Avalanche Shocks. IEEE Trans. Power Electron. 2019, 34, 2748–2757. [Google Scholar] [CrossRef]
  10. Fayyaz, A.; Yang, L.; Riccio, M.; Castellazzi, A.; Irace, A. Single Pulse Avalanche Robustness and Repetitive Stress Ageing of SiC Power MOSFETs. Microelectron. Reliab. 2014, 54, 2185–2190. [Google Scholar] [CrossRef]
  11. Castellazzi, A.; Fayyaz, A.; Yang, L. Characterization of High-Voltage SiC MOSFETs under UIS Avalanche Stress. In Proceedings of the 7th IET International Conference on Power Electronics, Machines and Drives (PEMD 2014), Manchester, UK, 8–10 April 2014; Institution of Engineering and Technology: Manchester, UK, 2014; p. 1.5.02. [Google Scholar]
  12. Liu, S.; Sun, W.; Qian, Q.; Gu, C.; Huang, Y.; Bai, S.; Chen, G.; Huang, R.; Tao, Y.; Liu, A. Investigations on Degradation and Optimization of 1.2kV 4H-SiC MOSFET under Repetitive Unclamped Inductive Switching Stress. In Proceedings of the 2015 IEEE 27th International Symposium on Power Semiconductor Devices & IC’s (ISPSD), Hong Kong, China, 10–14 May 2015; IEEE: Hong Kong, China, 2015; pp. 205–208. [Google Scholar]
  13. Shi, L.; Qian, J.; Jin, M.; Bhattacharya, M.; Houshmand, S.; Yu, H.; Shimbori, A.; White, M.H.; Agarwal, A.K. Gate Oxide Reliability in Silicon Carbide Planar and Trench Metal-Oxide-Semiconductor Field-Effect Transistors Under Positive and Negative Electric Field Stress. Electronics 2024, 13, 4516. [Google Scholar] [CrossRef]
  14. Yen, C.-T.; Hung, C.-C.; Hung, H.-T.; Lee, C.-Y.; Lee, L.-S.; Huang, Y.-F.; Hsu, F.-J. Negative Bias Temperature Instability of SiC MOSFET Induced by Interface Trap Assisted Hole Trapping. Appl. Phys. Lett. 2016, 108, 012106. [Google Scholar] [CrossRef]
  15. Qian, J.; Shi, L.; Jin, M.; Bhattacharya, M.; Yu, H.; White, M.H.; Agarwal, A.K.; Shimbori, A.; Liu, T.; Zhu, S. Investigation of the Electron Trapping in Commercial Thick Silicon Dioxides Thermally Grown on 4H-SiC under the Constant Current Stress. In Proceedings of the 2024 IEEE International Reliability Physics Symposium (IRPS), Grapevine, TX, USA, 14–18 April 2024; IEEE: Grapevine, TX, USA, 2024; pp. 1–6. [Google Scholar]
  16. Qian, J.; Shi, L.; Jin, M.; Bhattacharya, M.; Shimbori, A.; Yu, H.; Houshmand, S.; White, M.H.; Agarwal, A.K. Modeling of Charge-to-Breakdown with an Electron Trapping Model for Analysis of Thermal Gate Oxide Failure Mechanism in SiC Power MOSFETs. Materials 2024, 17, 1455. [Google Scholar] [CrossRef] [PubMed]
  17. Zhang, H.; Kang, X.; Zheng, Y.; Wu, H.; Wei, K.; Liu, X.; Ye, T.; Jin, Z. Investigation on Dynamic Characteristics of AlGaN/GaN Lateral Schottky Barrier Diode. Micromachines 2021, 12, 1296. [Google Scholar] [CrossRef] [PubMed]
  18. Xu, Y.; Li, Z.; Yang, X.; Shi, L.; Zhang, P.; Cao, X.; Nie, J.; Wu, S.; Zhang, J.; Feng, Y.; et al. Migration of Carbon from Ga Sites to N Sites in GaN: A Combined PAS and Hybrid DFT Study. Jpn. J. Appl. Phys. 2019, 58, 090901. [Google Scholar] [CrossRef]
  19. Maresca, L.; Matacena, I.; Riccio, M.; Irace, A.; Breglio, G.; Daliento, S. Influence of the SiC/SiO2 SiC MOSFET Interface Traps Distribution on CV. Measurements Evaluated by TCAD Simulations. IEEE J. Emerg. Sel. Top. Power Electron. 2021, 9, 2171–2179. [Google Scholar] [CrossRef]
  20. Majdi, S.; Gabrysch, M.; Suntornwipat, N.; Burmeister, F.; Jonsson, R.; Kovi, K.K.; Hallén, A. High-Temperature Deep-Level Transient Spectroscopy System for Defect Studies in Wide-Bandgap Semiconductors. Rev. Sci. Instrum. 2019, 90, 063903. [Google Scholar] [CrossRef] [PubMed]
  21. Buffolo, M.; Favero, D.; Marcuzzi, A.; De Santi, C.; Meneghesso, G.; Zanoni, E.; Meneghini, M. Review and Outlook on GaN and SiC Power Devices: Industrial State-of-the-Art, Applications, and Perspectives. IEEE Trans. Electron. Devices 2024, 71, 1344–1355. [Google Scholar] [CrossRef]
  22. Wei, Z.; Wei, J.; Fu, H.; Huang, L.; Tian, Y.; Cao, J.; Zhu, X.; Sun, J.; Liu, H.; Wang, Q.; et al. Suppression Effect of Split-Gate Structure on Repetitive Avalanche Stress Induced Degradation for SiC MOSFETs. IEEE Trans. Electron. Devices 2024, 71, 6596–6603. [Google Scholar] [CrossRef]
Figure 1. One-stop VTH drift test timing diagram for a single avalanche stress.
Electronics 14 04511 g001
Figure 2. One-stop VTH drift test system timing diagram for multiple avalanche events.
Electronics 14 04511 g002
Figure 3. Topological diagram of the one-stop threshold drift test unit.
Electronics 14 04511 g003
Figure 4. Overall waveform of single avalanche stress low-delay threshold drift test.
Electronics 14 04511 g004
Figure 5. The magnified waveform diagram of the avalanche stage.
Electronics 14 04511 g005
Figure 6. Variation curve of ΔVTH with time after the single avalanche ends.
Electronics 14 04511 g006
Figure 7. Variation curve of ΔVTH with time after 1000 avalanche events ends.
Electronics 14 04511 g007
Figure 8. Threshold drift of different avalanche cycles with VGS-OFF = 0 V and VGS-OFF = −6 V.
Electronics 14 04511 g008
Figure 9. Schematic diagram of planar SiC MOSFET structure.
Electronics 14 04511 g009
Figure 10. Electric field overall distribution and local magnification diagram of planar SiC MOSFET during avalanche breakdown.
Electronics 14 04511 g010
Figure 11. Electric field distribution curves in the center of the gate oxide during avalanche breakdown at VGS-OFF = 0 V and VGS-OFF = −6 V (the leftmost side represents the center of the JFET region, while the right side shows the boundary of the gate oxide near the active region).
Electronics 14 04511 g011
Figure 12. Hole concentration distribution within a 0.5 μm range around the channel center before and after avalanche stress with VGS_OFF = 0 V.
Electronics 14 04511 g012
Figure 13. Hole concentration distribution within a 0.5 μm range around the channel center before and after avalanche stress with VGS_OFF = −6 V.
Electronics 14 04511 g013
Figure 14. Hole concentration distribution within a range of 0.5 μm on the surface of the channel center at 10 ms after avalanche stress with different VGS-OFF.
Electronics 14 04511 g014
Table 1. VTH drift under different VGS-OFF for single avalanche stress.
VGS-OFF
(V)
VTH-1
(V)
VTH-2
(V)
ΔVTH
(V)
02.7732.8830.110
−32.7342.658−0.075
−62.7622.542−0.220
−102.7952.569−0.226
Table 2. VTH drift under different VGS-OFF for 1000 avalanche stress cycles.
VGS-OFF
(V)
VTH-1
(V)
VTH-2
(V)
ΔVTH
(V)
02.6832.8730.191
−32.6772.636−0.042
−62.7882.490−0.298
−102.8242.470−0.355
Disclaimer/Publisher’s Note: The statements, opinions and data contained in all publications are solely those of the individual author(s) and contributor(s) and not of MDPI and/or the editor(s). MDPI and/or the editor(s) disclaim responsibility for any injury to people or property resulting from any ideas, methods, instructions or products referred to in the content.