Abstract
Electromagnetic scattering analysis is inherently complex and plays a crucial role in both civilian and military applications. A primary objective in analyzing scattering problems is to achieve accurate results while minimizing computational cost. In this study, a novel high-frequency technique, called Triangular Ray Tube Tracing (TRTT), is proposed for calculating the Radar Cross-Section (RCS) of electrically large objects. Unlike conventional ray-based methods, TRTT employs triangular ray tubes (TRTs) with frequency-independent resolution, which significantly reduces the computational burden while maintaining accuracy. The method also accounts for multiple reflections and shadowing effects based on the geometry of the target. To validate the approach, computational steps and results obtained using TRTT are compared in detail with the classical Shooting and Bouncing Ray (SBR) method, which requires frequency-dependent ray density. The proposed method demonstrates substantial advantages in terms of efficiency, scalability, and frequency-independence, particularly for electrically large targets.
1. Introduction
In RCS calculations, obtaining accurate results as fast as possible is the main challenge. When the methods developed for RCS calculation are categorized into two groups, high-frequency techniques use optical approximations while low-frequency techniques aim to solve Maxwell’s equations with controllable accuracy.
Low-frequency methods include Finite Differences (FDs), the Finite Element Method (FEM), and the Method of Moments (MoM). When the electrical size of the target is large, it can be assumed that the electromagnetic waves at microwave frequencies start behaving in accordance with the laws of optics. In this case, high-frequency techniques such as Geometric Optics (GO), Physical Optics (PO), the Geometric Theory of Diffraction (GTD), the Physical Theory of Diffraction (PTD), and the Uniform Theory of Diffraction (UTD) are used [1].
In high-frequency techniques, reflection, shadowing, and diffraction effects can be included in the calculation. The Shooting and Bouncing Ray (SBR) method is one of the widely used high-frequency techniques to calculate the RCS of structures whose dimensions are quite large in comparison to the wavelength [2]. In the SBR method, approximately 10 rays per wavelength are launched toward the target. When the frequency increases, the number of rays increases proportionally to the square of the frequency, i.e., O. Hence, the computation time and memory usage increases proportional to the square of the frequency. There are studies on eliminating this limiting factor. Some reduce the computational burden of ray–surface intersection tests [3], and others try to reduce the number of ray tubes [4,5]. In recent years, studies on reducing the computation time with parallel programming and GPU usage have also gained popularity [6,7]. However, O’s computational complexity remains the main hurdle of ray tracing methods.
Ray tubes play an important role in the development of ray tracing-based methods in electromagnetic scattering problems. Specifically, the circular ray tubes used in classical methods complicate the calculation of intersections with the surface. Chan and colleagues’ [8] work eliminated the gap and overlap problem in the aperture region by using triangular ray tubes in lens antenna analysis, developing closed-form solutions that separate the TE and TM components. However, this approach is essentially limited to antenna and lens applications. In a subsequent study [9], integrating triangular ray tubes into the SBR method solved the “empty tube” problem and improved accuracy and computational speed, particularly in the first scattering step. However, this method is not an independent solution but a derivative of the existing SBR approach. The BART method [10] analytically determines light and shadow regions by tracing polygonal ray tubes in forward and backward directions and successfully models high-order scattering in target–rough surface interactions. However, this approach has a heavier structure due to the complexity of the computational steps. While these studies have made valuable contributions to different aspects of RCS analysis, there is still a gap in the literature regarding frequency independent and computationally efficient ray-based methods. The method proposed in this paper is designed to fill this gap and provides a scalable and frequency-independent solution.
In this study, a novel method called Triangular Ray Tube Tracing (TRTT) was developed as an independent method, distinct from all previous studies. Thanks to its frequency-independent structure, it eliminates both gap and overlap issues, achieving a continuous field distribution. Furthermore, it does not limit itself to the first scattering step but ensures geometric accuracy across all scattering sequences. It operates with a simple ray tracing algorithm without requiring complex structures such as forward–backward tracing during the calculation process. In these respects, TRTT offers a more general and practical solution compared to previous approaches in the literature. In addition, TRTT is proposed for calculating RCSs with reduced computational workload and significantly shorter computation time. Unlike conventional methods that employ circular cross-section rays [4,10], the TRTT method employs triangular ray tubes (TRTs), which offer frequency-independent resolution due to their fixed size and number across all frequencies. The frequency dependence of RCS is taken into account by evaluating the PO integrals by the Radon Transform interpretation, which supports the frequency-independent computational load of the method [11].
This paper introduces the TRTT method through a detailed comparison with the well-known SBR method across all computational steps. To this end, the ray generation, propagation, and RCS computation procedures are described in Section 2. Section 3 discusses the programming architecture for ray tracing and the triangle–triangle intersection algorithm based on a novel clipping technique. In Section 4, numerical results for various geometries are presented and validated through comparison with established simulation tools.
2. A Comparative Description of the Algorithm
The TRTT calculation steps can be categorized under three main headings. In the first step, the target geometry is loaded and ray tubes called ‘mother rays’ are formed for the electric field to be launched towards this geometry. In the second step, the ray tubes are traced according to the GO rules. New ray tubes called ‘child rays’ are created from the intersecting and non-intersecting parts of the mother ray tubes with the geometry triangles. The new information for each child ray tube is calculated and the tracing is continued until the ray tubes do not intersect the geometry triangles anymore. In the last step, RCS is calculated for all polarizations with the ray triangles interacting with the geometry triangles. These three steps will be explained next.
2.1. Creating Mother Rays
In the RCS calculation, the target geometry, frequency, polarization of the incident electromagnetic field, type of the RCS (monostatic or bistatic), incidence direction, and observation direction are the inputs. It will be assumed that in both the SBR and TRTT methods, the target geometry file consists of triangles. In order to minimize the number of rays in the SBR method and the size of the mother rays in the TRTT method, the smallest bounding box enclosing the target geometry is created (Figure 1). A radiation plane touching the bounding box is created in the desired incident wave direction, . The projections of the bounding box corners on the radiation plane are used for creating the smallest window called the ‘ray launch window’. The electromagnetic field that illuminates the target geometry is sent as rays from this ray launch window. The rays carry field information such as propagation direction and polarization.
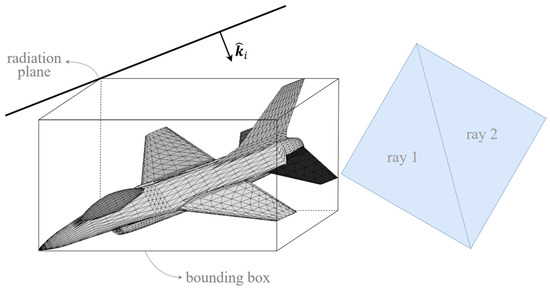
Figure 1.
Bounding box, radiation plane, and mother rays on the radiation plane.
In the SBR method, the rays are in the form of straight lines and at least 10 rays must be sent per wavelength. When the frequency increases, the number of rays that must be sent increases proportionally to the square of frequency. This is a limiting factor and the calculation time increases in proportion to the square of the frequency, i.e., O. The computational difference between the TRTT method and the SBR method starts in this step. In the TRTT method, as shown in Figure 1, two triangles are obtained from the diagonal of the rectangular beam window. These two triangles are called “mother rays” or “mother TRTs”. Each TRT is defined as a ray with a triangular cross-section determined by the bounding box of the target geometry. These geometric parameters remain constant across all frequencies, ensuring that the number of TRTs is not proportional to frequency. Also, regardless of the target geometry, only two ray rubes are sent from the ray window to cover the geometry. These provide frequency independence in RCS calculation.
The incident rays in the SBR method and the ray tubes in the TRTT method carry electric field information. The incident electric field is defined as follows:
where is the intensity of the electric field, is the polarization vector, is the propagation vector, and is the wavenumber.
2.2. Ray Tracing and Analyses
In the SBR and TRTT methods, the rays behave like planar waves and each ray is launched and traced on the geometry. In the SBR method, the interaction between a ray and a geometry triangle yields a point. There are different methods for finding which geometry triangle each ray will intersect, such as sorting the geometry triangles closest to the ray or looking at the intersection of the ray with all geometry triangles and selecting the geometry triangle at the shortest distance. One of the computational methods used for finding the ray–triangle intersection is presented in [12]. The rays created in the ray window and the intersection of the intersecting rays with other geometry triangles are traced until the intersection is finished.
In the TRTT method, the geometry triangles that possibly intersect with a mother ray are identified. Then these geometry triangles are sorted with respect to their distance to the starting plane of the mother ray. The so-called Z-buffer method is used to sort the geometry triangles and this method is described in detail in Section 3.1. The intersection of the geometry triangles that are likely to intersect with the mother ray is controlled by the ‘triangle–triangle clipping algorithm’. The clipping algorithm is described in Section 3.2.
In the SBR method, the ray and the geometry triangle either intersect or do not intersect. However, in the TRTT method, since the ray has a triangular cross-sectional area, one part of the ray may partially intersect a geometry triangle. When the interaction between the ray and the geometry triangle is calculated, the intersecting and non-intersecting regions are determined and dubbed as the ‘internal polygon’ and the ‘external polygon’, respectively. These regions are triangulated again to form the so-called ‘child rays’. Once the computations with the mother rays are completed, the child rays are added to the mother ray list and they are traced until no more child rays are produced. Programming-wise, this procedure can be efficiently handled by defining a ‘mother ray queue’ and adding each newly formed child ray to the end of this queue.
For rays intersecting a geometry triangle in the SBR method and for child rays intersecting a geometry triangle in the TRTT method, the ray propagation direction, polarization, and number of intersections change. If the ray and the ray tube intersect a triangle, it is reflected according to Snell’s Laws. The incidence angle, , between the ray propagation direction and the surface normal of the geometry triangle is equal to the reflection angle, , between the propagation direction of the reflected ray and (Figure 2).
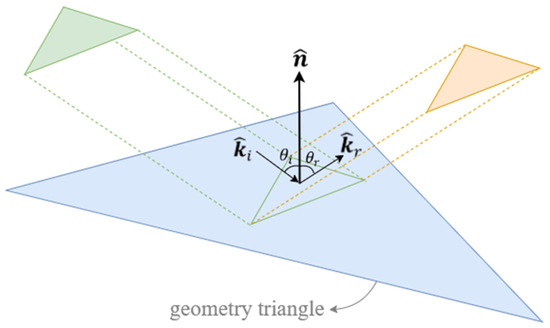
Figure 2.
Incident and bouncing ray tube.
The direction of propagation of the reflected ray tube is calculated as follows:
When a ray interacts with a geometry triangle, its polarization has to be handled carefully. The polarization of the reflected ray depends on the geometry triangle information. The conventions for the parallel and perpendicular polarizations related to the propagation directions of the rays and the normal of the geometry triangle are shown in Figure 3.
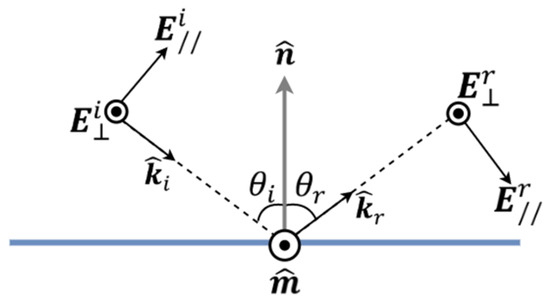
Figure 3.
Polarization of the incident and reflected waves.
The polarization of the incident electric field ray tube may be expressed as
where and . Then the polarization of the reflected ray tube can be calculated as follows [2]:
where , and, further, and are the reflection coefficients for the perpendicular and parallel polarizations, respectively [13].
To reduce computational cost, a bounce number can be associated with each ray tube. The mother rays start traveling with zero bounces. The number of bounces of a child ray produced through an internal polygon is always one more than that of its mother. However, if the child ray is produced through an external polygon, its bounce number is kept the same as that of its mother. The maximum number of bounces is set to 10 for each ray. After 10 bounces, the contribution of a ray to the RCS is negligible [2].
These steps are followed until all ray tubes in the queue are completed. Each ray tube that interacts with the geometry is included in the RCS calculation.
2.3. The RCS Calculation
The RCS calculation is performed with the electric field scattered from the geometry and the electric field incident on the geometry as follows:
The incident electric field is the electric field defined in the ray launch window. The scattered electric field is calculated by the contribution of the ray tubes interacting with the geometry triangles. In the SBR method, the scattered electric field is calculated by the ‘Exit Ray Tube Integration’ [2]. In the TRTT method, the scattered electric field is calculated by Equation (6) presented in the Radon Transform Interpretation [11]. The different propagation distances of the rays create a phase difference between the rays. In Equation (6) of [11], the phase difference between the ray tubes is not taken into account. The addition of phase synchronization to the scattered electric field is written as follows:
where N is the number of ray tubes contributing to the scattered field. The term is the Fourier transform of the triangular function of the ray tube in the time domain. In (6), the phase synchronization, which is explained in detail in Section 3.3, is accomplished by the term. The scattered field expression and subsequent RCS computations are performed for perfectly electrically conducting (PEC) surfaces, where surface currents are assumed to be confined to the outer boundary of the target.
3. Technical and Implementation Details
In the previous section, the general TRTT method was described through comparisons with the SBR method. However, several implementation details that are specific to the TRTT method need to be unveiled. The first of these special details is how a possible intersection between a TRT and a geometry triangle is decided, as well as the use of the Z-buffer technique. The second detail is efficient determination of the internal and external polygons resulting from a TRT–triangle clipping. And the last one is how the contribution of each TRT to the scattered field has to be phase-synchronized. These topics will be explained next.
3.1. Computational Aspects
When a TRT propagates toward the geometry triangles, the triangles that are likely to intersect with the TRT need to be determined. To accomplish this, the projections of the ray triangle vertices onto the plane enclosing the geometry triangle are calculated using the direction of propagation. If a projection of a ray triangle vertex is inside the geometry triangle, the triangles are likely to intersect (Figure 4). There are two exceptions to this rule. First, if the direction of propagation of the TRT and the normal of the geometry triangle are perpendicular to each other, no intersection is possible. Second, if the area of the triangle created by the vertices of the ray triangle projected onto the geometry triangle is zero (or very close to zero), this ray will be assumed to not contribute to the RCS and will be ignored.
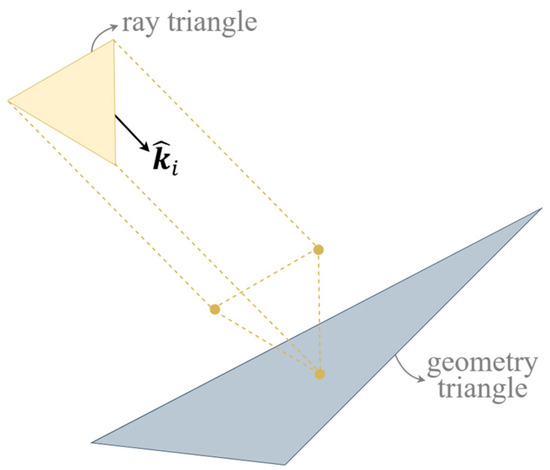
Figure 4.
Intersection probability of ray triangle.
Among the possible intersecting triangles, the intersection of the ray tube with the nearest geometry triangle is to be identified. To start tracing with the geometry triangle that is closest to the ray triangle is the most important step to take shadowing into account. The Z-buffer method is used to sort the geometry triangles according to the ray triangles. In the Z-buffer method, the maximum and minimum distances between the vertices of the ray triangle and the vertices of the geometry triangle are calculated. The geometry triangle with the smallest minimum distance is the closest. If both geometry triangles have the same minimum distance, the geometry triangle with the smaller maximum distance is the closest.
The interaction between the geometry triangles and the ray tube is analyzed using the clipping algorithm described next in Section 3.2. If the ray tube intersects with the nearest geometry triangle, the next step of forming child rays is accomplished using that geometry triangle. If there is no intersection, the intersection with the next closest geometry triangle is analyzed. Finding the triangles that are likely to intersect with the TRT among the geometry triangles and sorting these triangles is a way to take into account shadowing in ray tracing.
3.2. The Clipping Algorithm
The intersection between a ray tube and a geometry triangle is identified with the developed ‘clipping algorithm’. The clipping algorithm identifies the intersecting region between two triangles as the ‘internal polygon’ and the non-intersecting region as the ‘external polygon’. With this algorithm, the fast triangle–triangle intersection algorithm tests the intersection of two triangles in the same plane without the need for examining any special cases. The input to the algorithm is a pair of triangles. One of the triangles is taken as the base triangle. The base triangle is always defined by the region , and in the barycentric system [14]. The vertex coordinates of the other triangle, T2, in the barycentric system are calculated based on the base triangle using the pseudoinverse matrix. This transformation is shown in Figure 5.
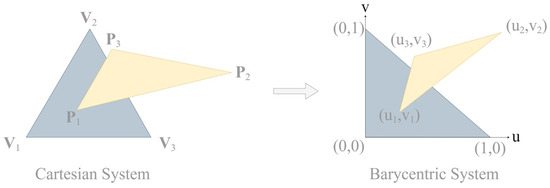
Figure 5.
Two-triangle transformation from Cartesian system to barycentric system.
In the barycentric system, the base triangle is an isosceles right triangle with the right-angled corner at the origin. Each edge of the base triangle divides the uv-plane into two half-spaces. Of these two half-spaces, the space enclosing the base triangle is called the (+) side and the other half-space is called the (−) side, as seen in Figure 6.
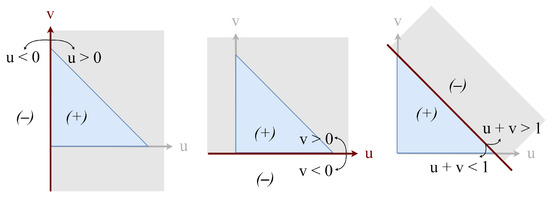
Figure 6.
Sides of the base triangle.
The clipping algorithm starts by assuming that the internal polygon is T2. Then, the algorithm loops over each edge of the base triangle and clips out the part of the internal polygon that lies outside. This is accomplished by performing the following steps for each edge of the base triangle. All the vertices of the internal polygon are looped over, and if the vertex of interest is on the (+) side, then that vertex is kept on the internal point list; otherwise, the calculation identifies the internal and external points for a given vertex–edge pair. If a vertex of T2 is on the (−) side with respect to the edge of the base triangle, the intersection points are found with the line–line intersect.
The steps of clipping algorithm are shown in Figure 7.
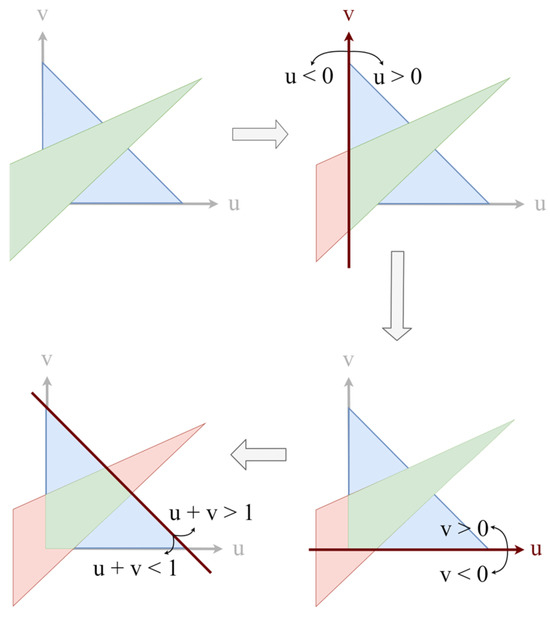
Figure 7.
An example of clipping algorithm steps. Base triangle is blue, internal polygon in each step is green, and external polygon is red.
All triangles on the (+) side of the base triangle and the points of intersection with the base triangle edge and internal and external polygons are determined. After the intersection calculation is completed, the polygons are converted from barycentric coordinates to Cartesian coordinates.
The internal and external polygons are triangulated. All triangles are added to the ray queue as ‘child rays’ and tracing is continued.
3.3. The Phase Synchronization
The contribution of each ray tube bouncing off the target and contributing to the scattered electric field is calculated by (6), given in [11]. The derivation in [11] assumes that the zero phase point of the incident field is at the origin. In other words, it assumes the time of arrival of the incident field is zero at the origin. However, the start of the TRTT simulation (i.e., zero time) is when the incident plane wave is launched from the ray launch window. In other words, the zero phase point is any point in the ray launch window. Therefore, (w), given in [11], should be corrected by a factor of
where is the travel distance of the ray tube calculated as follows. At the start of the ray tracing, a vertex of the mother ray triangle is called the base vertex (). A child triangle is created when the mother ray intersects a geometry triangle. The propagation distance between and the vertex of the child triangle which is closest to is calculated as . Also, the propagation distance from to the origin is calculated. Both and are recorded as the attributes of the child ray tube. If the child ray tube does not intersect another geometry triangle (single bounce), the length used for the RCS calculation is . Otherwise, and are calculated. The calculation of and for a simple geometry is shown in Figure 8. The that is to be used in (7) is the of the last bounce.
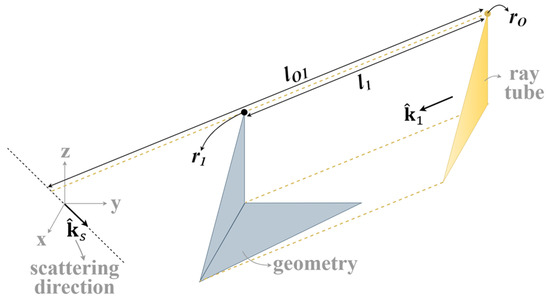
Figure 8.
and for a single-bounce case.
In multiple bounces, the phase synchronization that occurs during ray tube tracing is carefully considered. The monostatic RCS for the two cubes in Figure 9 was calculated in two different ways, with and without phase synchronization calculation. As can be seen in Figure 9, the results demonstrate that phase synchronization has a negligible effect at single-bounce angles but becomes essential for accurate RCS prediction in multiple-bounce regions.
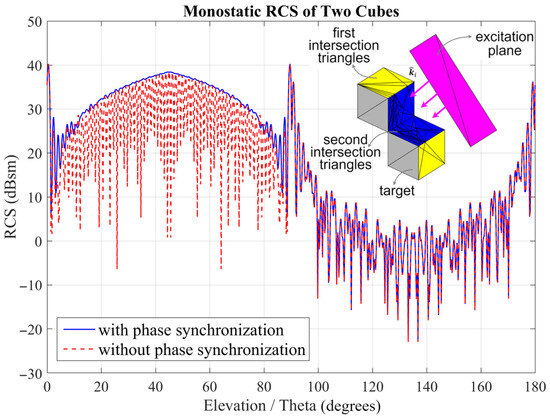
Figure 9.
Monostatic RCS of two cubes ( [0°, 180°] and 90°) computed with and without phase synchronization using the TRTT method.
4. Numerical Results
The TRTT method described thus far was implemented in C++ and used for RCS calculations. The calculated RCS results are compared with RCS values calculated using the SBR method in the commercial electromagnetic software program CST Studio Suite [15]. Calculations were performed with the two programs on the same computer to provide equal bases for timing comparisons.
The first example is the target shown in the phase synchronization analysis, which consists of two cubes with sides of 1 m and a common edge. The operating frequency was 5 GHz and the monostatic RCS calculation was performed with theta polarization for the angles [0°, 180°] and . The RCS results for the two cubes obtained with TRTT and CST-SBR are given in Figure 10. The results show excellent agreement across the full angular range, confirming the accuracy of TRTT for frequency-independent RCS computation. At 5 GHz, the RCS computation time for the two cubes was 187 s with the TRTT method and 46 s with CST-SBR.
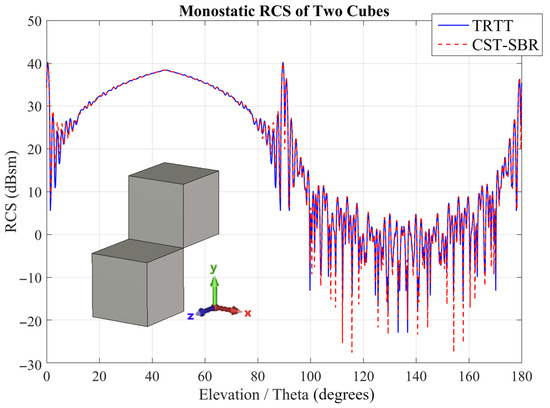
Figure 10.
Monostatic RCS of two cubes ( 90°, f = 5 GHz) obtained using TRTT and CST-SBR methods.
As another example, plane wave scattering from a trihedral corner reflector is considered. The side length of the trihedral is 0.3 m and its orientation is shown in Figure 11. The frequency was 10 GHz and the calculation was performed with theta (vertical) polarization. Monostatic RCS was calculated for the angles = 90° and [0°, 180°]. The RCS results for the trihedral with TRTT and a comparison with CST-SBR results are given in Figure 11. The RCS peak values obtained with TRTT and CST show a very good agreement. However, some discrepancies are observed at levels 50 dB below the peak value. These differences may be due to numerical noise, mesh-induced discretization errors, and solver-specific approximations in regions where the scattered power is very low. Since the effect of such low RCS values is negligible in practical applications, these deviations do not affect the validity of TRTT method.
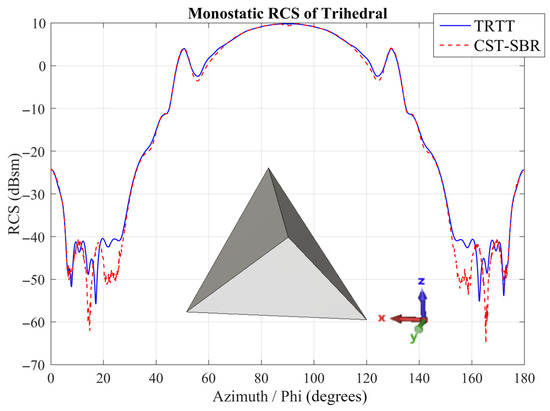
Figure 11.
Monostatic RCS of trihedral ( 90° and [0°, 180°]) computed using TRTT and CST-SBR.
In order to compare the computation time between TRTT and CST, a target consisting of two cubes was selected. Monostatic RCS calculation was performed at 5 GHz, 10 GHz, 17 GHz, and 24 GHz for the angles [0°, 180°] and . The RCS computation times for these cases are compared in Table 1. All computations were performed on the same workstation equipped with an Intel Core i7-1065G7 CPU (1.3 GHz), 16 GB of RAM, and no GPU acceleration. Both CST-SBR and TRTT implementations were executed in single-thread mode to ensure a fair benchmarking environment.

Table 1.
Comparison of computational times for the two-cube and flat-plate targets obtained using TRTT and CST-SBR methods under identical hardware conditions.
In RCS computations, each approach has its own advantages and limitations. While the SBR method represents the electric field by generating discrete rays, the TRTT method employs triangular ray tubes to achieve frequency-independent RCS calculation. Consequently, whereas the SBR method involves ray–triangle intersections, TRTT requires triangle–triangle intersections, which is inherently more costly. At lower frequencies, the SBR method is typically faster because the number of rays generated and intersected per wavelength is smaller. In contrast, the TRTT method performs triangle–triangle intersections that cover the entire surface regardless of frequency. As frequency increases, the number of rays to be traced in the SBR method grows proportionally, while the number of triangular ray tubes in TRTT remains constant, revealing the computational advantage of the proposed method. As expected, the computation time does not change for the TRTT method, exemplifying that the computation time is frequency-independent. Again, as expected, for the SBR method, the computation time increases with frequency. To show that the savings in computation time do not affect the accuracy of the results, the monostatic RCS values obtained by TRTT and CST at 10 GHz, 17 GHz and 24 GHz are shown in Figure 12, Figure 13 and Figure 14. Clearly, accuracy is not sacrificed.
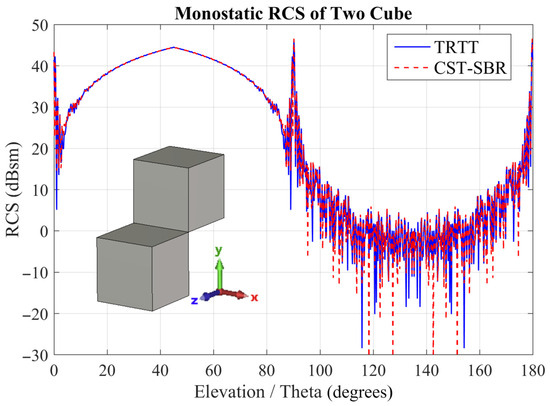
Figure 12.
Monostatic RCS of two cubes ( 90°, f = 10 GHz) computed using TRTT and CST-SBR methods.
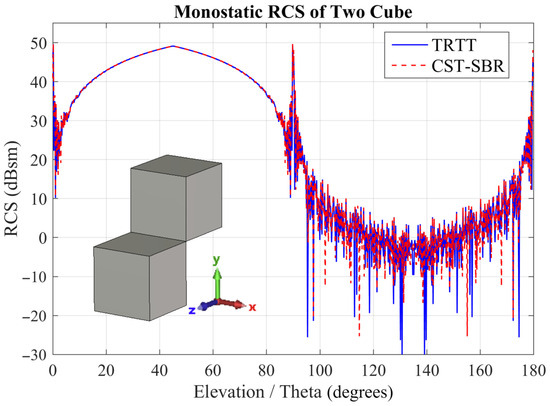
Figure 13.
Monostatic RCS of two cubes ( 90°, f = 17 GHz) computed using TRTT and CST-SBR methods.
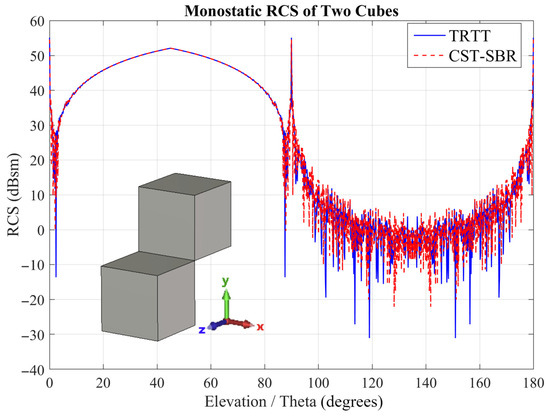
Figure 14.
Monostatic RCS of two cubes ( 90°, f = 24 GHz) computed using TRTT and CST-SBR methods.
As a more realistic example, scattering with a 21.4 m plane model was analyzed. The frequency was 10 GHz and the calculation was performed with theta (vertical) polarization. The monostatic RCS was calculated for the angles [90°, 180°] and . The calculated RCS results are compared with the CST results and the code used for “A Simple and Efficient SBR Implementation for RCS Calculation” [16]. The RCS results and comparisons for the jet with TRTT are shown in Figure 15.
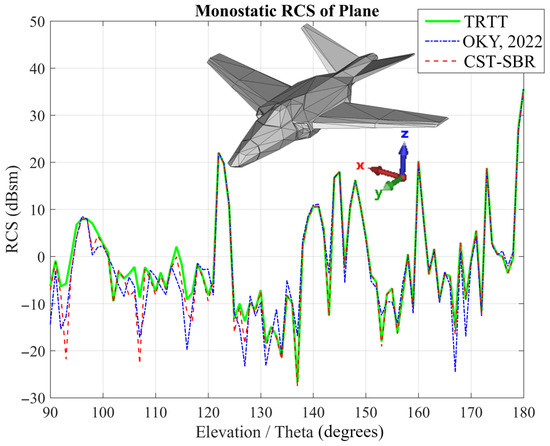
Figure 15.
Monostatic RCS of jet plane ( [90°, 180°] and ) (10 GHz) computed using TRTT, CST-SBR, and method of Tulgar et al. [16].
As shown in Figure 15, the angles where the three different results are in complete agreement are in the majority. In addition, the results show very good agreement at the peak RCS values. At some angles, the three results do not agree with each other. This disagreement occurs at approximately 30 dB below the highest RCS value. The three approaches show excellent agreement at the majority of angles and near RCS peaks, with minor discrepancies (~30 dB below the maximum) attributed to numerical precision and solver-specific approximations. In the RCS comparison, it can be observed that the three solutions either are in complete agreement or, at levels at least 30 dB below the RCS peak, all deviate from each other to a similar extent. Between 90° and 135°, where the discrepancies are observed, the front wings of the aircraft geometry extend ahead of the tail section. In this angular range, the tail appears very thin, and some of the point rays in the SBR method miss this region, resulting in lower RCS values. This effect is mainly due to shadowing and thin-feature limitations inherent in the SBR method, where the resolution is insufficient to capture scattering from small or partially obscured surfaces. Beyond 135°, the wings no longer shadow the tail, and both shadowing and thin-feature effects disappear, leading to an excellent agreement between the RCS results of all methods.
5. Conclusions
In this paper, TRTT, a frequency-independent RCS calculation method, is introduced and analyzed in detail. The computational steps of the TRTT method are compared with the classical SBR method. In the SBR method, since the number of rays sent to the target increases with frequency, the computation time increases at high frequencies. In the TRTT method, only two ‘mother rays’ are sent to the geometry, thus providing a frequency-independent structure. The use of TRTs necessitates triangle–triangle intersection calculations to analyze the interactions with the target surface. Thanks to the clipping algorithm, these interactions are successfully realized without the need to control degenerate cases. RCS calculations are performed with a Radon Transform interpretation specially developed for the triangular tube structure. In the case of multiple reflections, the path difference between the rays is considered with the concept of phase synchronization. The method was validated by simulations with different geometries and frequencies using commercially available software. The results show that the TRTT method yields good accuracy while using much lower computational resources, independent of the analysis frequency. This makes the method a promising solution for the RCS analysis of electrically large structures.
In future work, the TRTT formulation will be extended to include frequency-dependent reflection and transmission coefficients, enabling accurate RCS analysis of dielectric, magnetic, and lossy materials in addition to PEC surfaces. As TRTT is formulated within the GO–PO framework, diffraction effects are not explicitly modeled but can be incorporated in future extensions using asymptotic diffraction theories such as the UTD and GTD. Furthermore, future research will focus on enhancing the TRTT method to extract scattering centers and to perform high-precision benchmarking against classical SBR implementations. These developments are expected to further improve the versatility and accuracy of TRTT in complex electromagnetic scattering scenarios.
Author Contributions
Conceptualization, F.D. and A.A.E.; Formal analysis, F.D. and A.A.E.; Investigation, M.G.; Methodology, M.G., F.D. and A.A.E.; Project administration, F.D. and A.A.E.; Software, M.G. and A.A.E.; Supervision, F.D. and A.A.E.; Validation, M.G.; Visualization, M.G.; Writing—original draft, M.G.; Writing—review & editing, F.D. and A.A.E. All authors have read and agreed to the published version of the manuscript.
Funding
This research was supported by TUBITAK grant number 119C032.
Data Availability Statement
The data supporting the findings of this study are not publicly available due to ongoing development of a commercial software based on the TRTT method. No external datasets were generated or used.
Conflicts of Interest
All authors declare that the research was conducted in the absence of any commercial or financial relationships that could be construed as a potential conflict of interest.
References
- Knott, E.F.; Shaeffer, J.F.; Micheal, T.T. Radar Cross Section; Scitech Publishing: Raleigh, NC, USA, 2004; pp. 524–545. [Google Scholar]
- Ling, H.; Chou, R.-C.; Lee, S.-W. Shooting and Bouncing Rays: Calculating the RCS of an Arbitrarily Shaped Cavity. IEEE Trans. Antennas Propag. 1989, 37, 194–205. [Google Scholar] [CrossRef]
- Dikmen, F.; Ergin, A.; Sevgili, A.L.; Terzi, B. Implementation of an efficient shooting and bouncing rays scheme. Microw. Opt. Technol. Lett. 2010, 52, 2409–2413. [Google Scholar] [CrossRef]
- Tao, Y.B.; Lin, H.; Bao, H.J. Adaptive Aperture Partition in Shooting and Bouncing Ray Method. IEEE Trans. Antennas Propag. 2011, 59, 3347–3357. [Google Scholar] [CrossRef]
- Suk, S.; Seo, T.; Park, H.; Kim, H. Multiresolution grid algorithm in the SBR and its application to the RCS calculation. Microw. Opt. Technol. Lett. 2001, 29, 394–397. [Google Scholar] [CrossRef]
- Tao, Y.; Lin, H.; Bao, H. GPU-Based Shooting and Bouncing Ray Method for Fast RCS Prediction. IEEE Trans. Antennas Propag. 2010, 58, 494–502. [Google Scholar]
- Wei, Y.; Tian, D.; Li, J.; Wang, J.; Chai, S.; Guo, L. Efficient GPU Implementation of the Time-Domain Shooting and Bouncing Rays Method on Electrically Large Complex Target. Waves Random Complex Media 2022, 35, 4741–4760. [Google Scholar] [CrossRef]
- Chan, K.K.; Rao, S.; Morin, G.; Tang, M. Triangular Ray-Tube Analysis of Dielectric Lens Antennas. IEEE Trans. Antennas Propag. 1997, 45, 1277–1285. [Google Scholar] [CrossRef]
- Jia, J.; Liub, J.; Maa, Y. Triangular ray tubes in electromagnetic scattering calculation using shooting and bouncing ray (SBR). Optics 2016, 127, 3117–3120. [Google Scholar] [CrossRef]
- Xu, F.; Jin, Y.-Q. Bidirectional Analytic Ray Tracing for Fast Computation of Composite Scattering from Electric-Large Target Over a Randomly Rough Surface. IEEE Trans. Antennas Propag. 2009, 57, 1495–1505. [Google Scholar] [CrossRef]
- Bölükbaş, D.; Ergin, A.A. A Radon Transform Interpretation of the Physical Optics Integral. Microw. Opt. Technol. Lett. 2005, 44, 284–288. [Google Scholar] [CrossRef]
- Möller, T.; Trumbore, B. Fast, Minimum Storage Ray/Triangle Intersection. J. Graph. Tools 1997, 2, 21–28. [Google Scholar] [CrossRef]
- Balanis, C.A. Advanced Engineering Electromagnetics; John Wiley & Sons: Mississauga, ON, Canada, 1989. [Google Scholar]
- Held, M. ERIT: A collection of efficient and reliable intersection tests. J. Graph. Tools 1997, 2, 25–44. [Google Scholar] [CrossRef]
- Systèmes, D. CST Studio Suite 2024, Computer Simulation Technology, Version: 2021.05 (28 June 2021); Computer Simulation Technology: Darmstadt, Germany, 2024; Available online: https://www.3ds.com/products-services/simulia/products/cst-studio-suite/ (accessed on 25 June 2025).
- Tulgar, O.; Durgut, K.; Ergin, A.A. A simple and efficient SBR implementation for RCS calculation using target scaling. IEEE Trans. Antennas Propag. 2022, 70, 3680–3687. [Google Scholar] [CrossRef]
Disclaimer/Publisher’s Note: The statements, opinions and data contained in all publications are solely those of the individual author(s) and contributor(s) and not of MDPI and/or the editor(s). MDPI and/or the editor(s) disclaim responsibility for any injury to people or property resulting from any ideas, methods, instructions or products referred to in the content. |
© 2025 by the authors. Licensee MDPI, Basel, Switzerland. This article is an open access article distributed under the terms and conditions of the Creative Commons Attribution (CC BY) license (https://creativecommons.org/licenses/by/4.0/).