1. Introduction
Diabetes mellitus and cardiovascular disease (
CVD) are leading contributors to morbidity and mortality and share overlapping pathophysiology and risk profiles [
1,
2]. Early identification of individuals at elevated risk—particularly at the time of hospital admission—can facilitate timely prevention and targeted follow-up. Electronic Health Records (EHRs) enable such risk stratification at scale. In particular, the
MIMIC-IV hospital module provides structured demographics, diagnoses, procedures, laboratory tests, medications, microbiology, and administrative events suitable for building and evaluating prognostic models.
While prior work has explored increasingly complex architectures, clinical deployment often benefits from compact models that are transparent, calibration-aware, and easy to maintain. Moreover, downstream decisions consume probabilities at task-specific thresholds, making probability calibration and threshold-dependent utility analysis as important as raw discrimination. In this study we therefore focus on a leakage-safe, end-to-end pipeline for predicting incident diabetes within 365 days of an index admission, using two strong, interpretable baselines: logistic regression and random forest. The pipeline couples admission-time features with patient-level splitting, post hoc calibration (Platt and isotonic), decision curve analysis, and model explanations.
Our contributions are threefold. First, we develop and release a reproducible pipeline that enforces temporal and patient-level leakage guards, standardizes preprocessing, and attaches post hoc probability calibration and decision-analytic evaluation. Second, we benchmark calibrated logistic regression against a calibrated random forest on MIMIC-IV for the task of predicting incident diabetes at 365 days, reporting ROC/PR discrimination, reliability, and threshold-wise net benefit. Third, we provide transparent explanations via SHAP summaries for logistic regression and permutation importance analyses, highlighting clinically plausible risk factors.
Guided by the data and methods used here, we reformulate the research questions as follows.
RQ1:Within a leakage-safe pipeline using only information available at or before admission, which calibrated baseline—logistic regression or random forest—achieves superior discrimination for predicting incident diabetes at 365 days (AUROC/AUPRC)?
RQ2: To what extent does post hoc calibration improve probability quality and translate into higher net benefit across clinically plausible decision thresholds, as assessed by reliability diagrams and decision curve analysis?
RQ3: Which predictors most strongly influence risk estimates, and are these influences clinically coherent, as quantified by SHAP summaries for logistic regression and permutation importance for both models?
Beyond this introduction,
Section 2 reviews relevant background.
Section 3 describes the pipeline and presents the empirical results on
MIMIC-IV.
Section 4 interprets the findings and their clinical implications, and
Section 5 presents the related work. Finally,
Section 6 outlines limitations and future work.
3. Model and Experiments
This study uses the
MIMIC-IV database [
4,
5,
6], a large, freely accessible critical care resource containing anonymized demographics, laboratory results, prescriptions, diagnoses, procedures, microbiology, and administrative events from Beth Israel Deaconess Medical Center. We operated on the hospital module and used the tables
patients,
admissions,
transfers,
diagnoses_icd,
procedures_icd,
pharmacy,
prescriptions,
microbiologyevents,
labevents, and the dictionaries
d_icd_diagnoses,
d_icd_procedures,
d_labitems. The code used in the models and experiments is available at
https://github.com/EBarbierato/Deployable-Machine-Learning-on-MIMIC-IV (accessed on 7 November 2025).
All preprocessing and modeling were conducted with strict temporal and subject-level guards. We first created patient-level partitions (
) in proportions
to avoid cross-partition contamination; no subject appears in more than one split. Index (admission) time
was harmonized per patient, and all feature construction used only data with timestamps
(temporal guard), as formalized in
Section 2. All learned transformers were fit on training only and applied forward to validation and test without refitting.
3.1. Feature Engineering and Temporal Filtering
We constructed admission-time features covering: demographics; admission characteristics and prior-encounter aggregates (e.g., cumulative length of stay before index); counts of diagnoses/procedures; summaries of common lab measurements; coarse medication-exposure indicators; and microbiology flags. Categorical variables were one-hot encoded (rare levels pooled). For numeric features we applied light outlier handling (winsorization at the 1st/99th percentiles) and transforms for heavy-tailed counts. Missingness was handled by SimpleImputer—mean for numeric features and most-frequent for categoricals—fit on training only and applied to validation/test.
Preprocessing consists of distinct pipelines: for logistic regressionwe standardized all numeric features with computed on training only, then concatenated with one-hot encoded categoricals. For random forest we used the same imputed one-hot design but no scaling (tree-based models are impurity-based and do not require normalization). This separation avoids unnecessary transformations for RF while preserving well-conditioned inputs for LR.
3.2. Model Selection, Training, and Calibration
We trained two single-task baselines for diab_incident_365d.
To ensure a fair comparison and avoid under/overfitting, each model was selected by an inner cross-validation conducted on training data only (validation and test were held out until after selection):
Logistic Regression (LR). Search over , penalty = L2, solver = lbfgs/liblinear (chosen by convergence), with class_weight = balanced.
Random Forest (RF). Search over , , , , bootstrap, with class_weight=balanced_subsample.
For both models we used stratified 5-fold CV on with the selection metric set to AUROC (primary), recording AUPRC as a secondary criterion (tie-breaker). After selecting hyperparameters, we refit the model on and evaluated it on to choose a probability calibrator.
On
we fit Platt scaling and isotonic regression and selected the mapping that minimized the Brier score (
Section 2). The chosen calibrator was then frozen and applied to
. Threshold-dependent analyses (decision curves) are reported directly on calibrated probabilities without committing to a single operating point.
3.3. Evaluation Figures
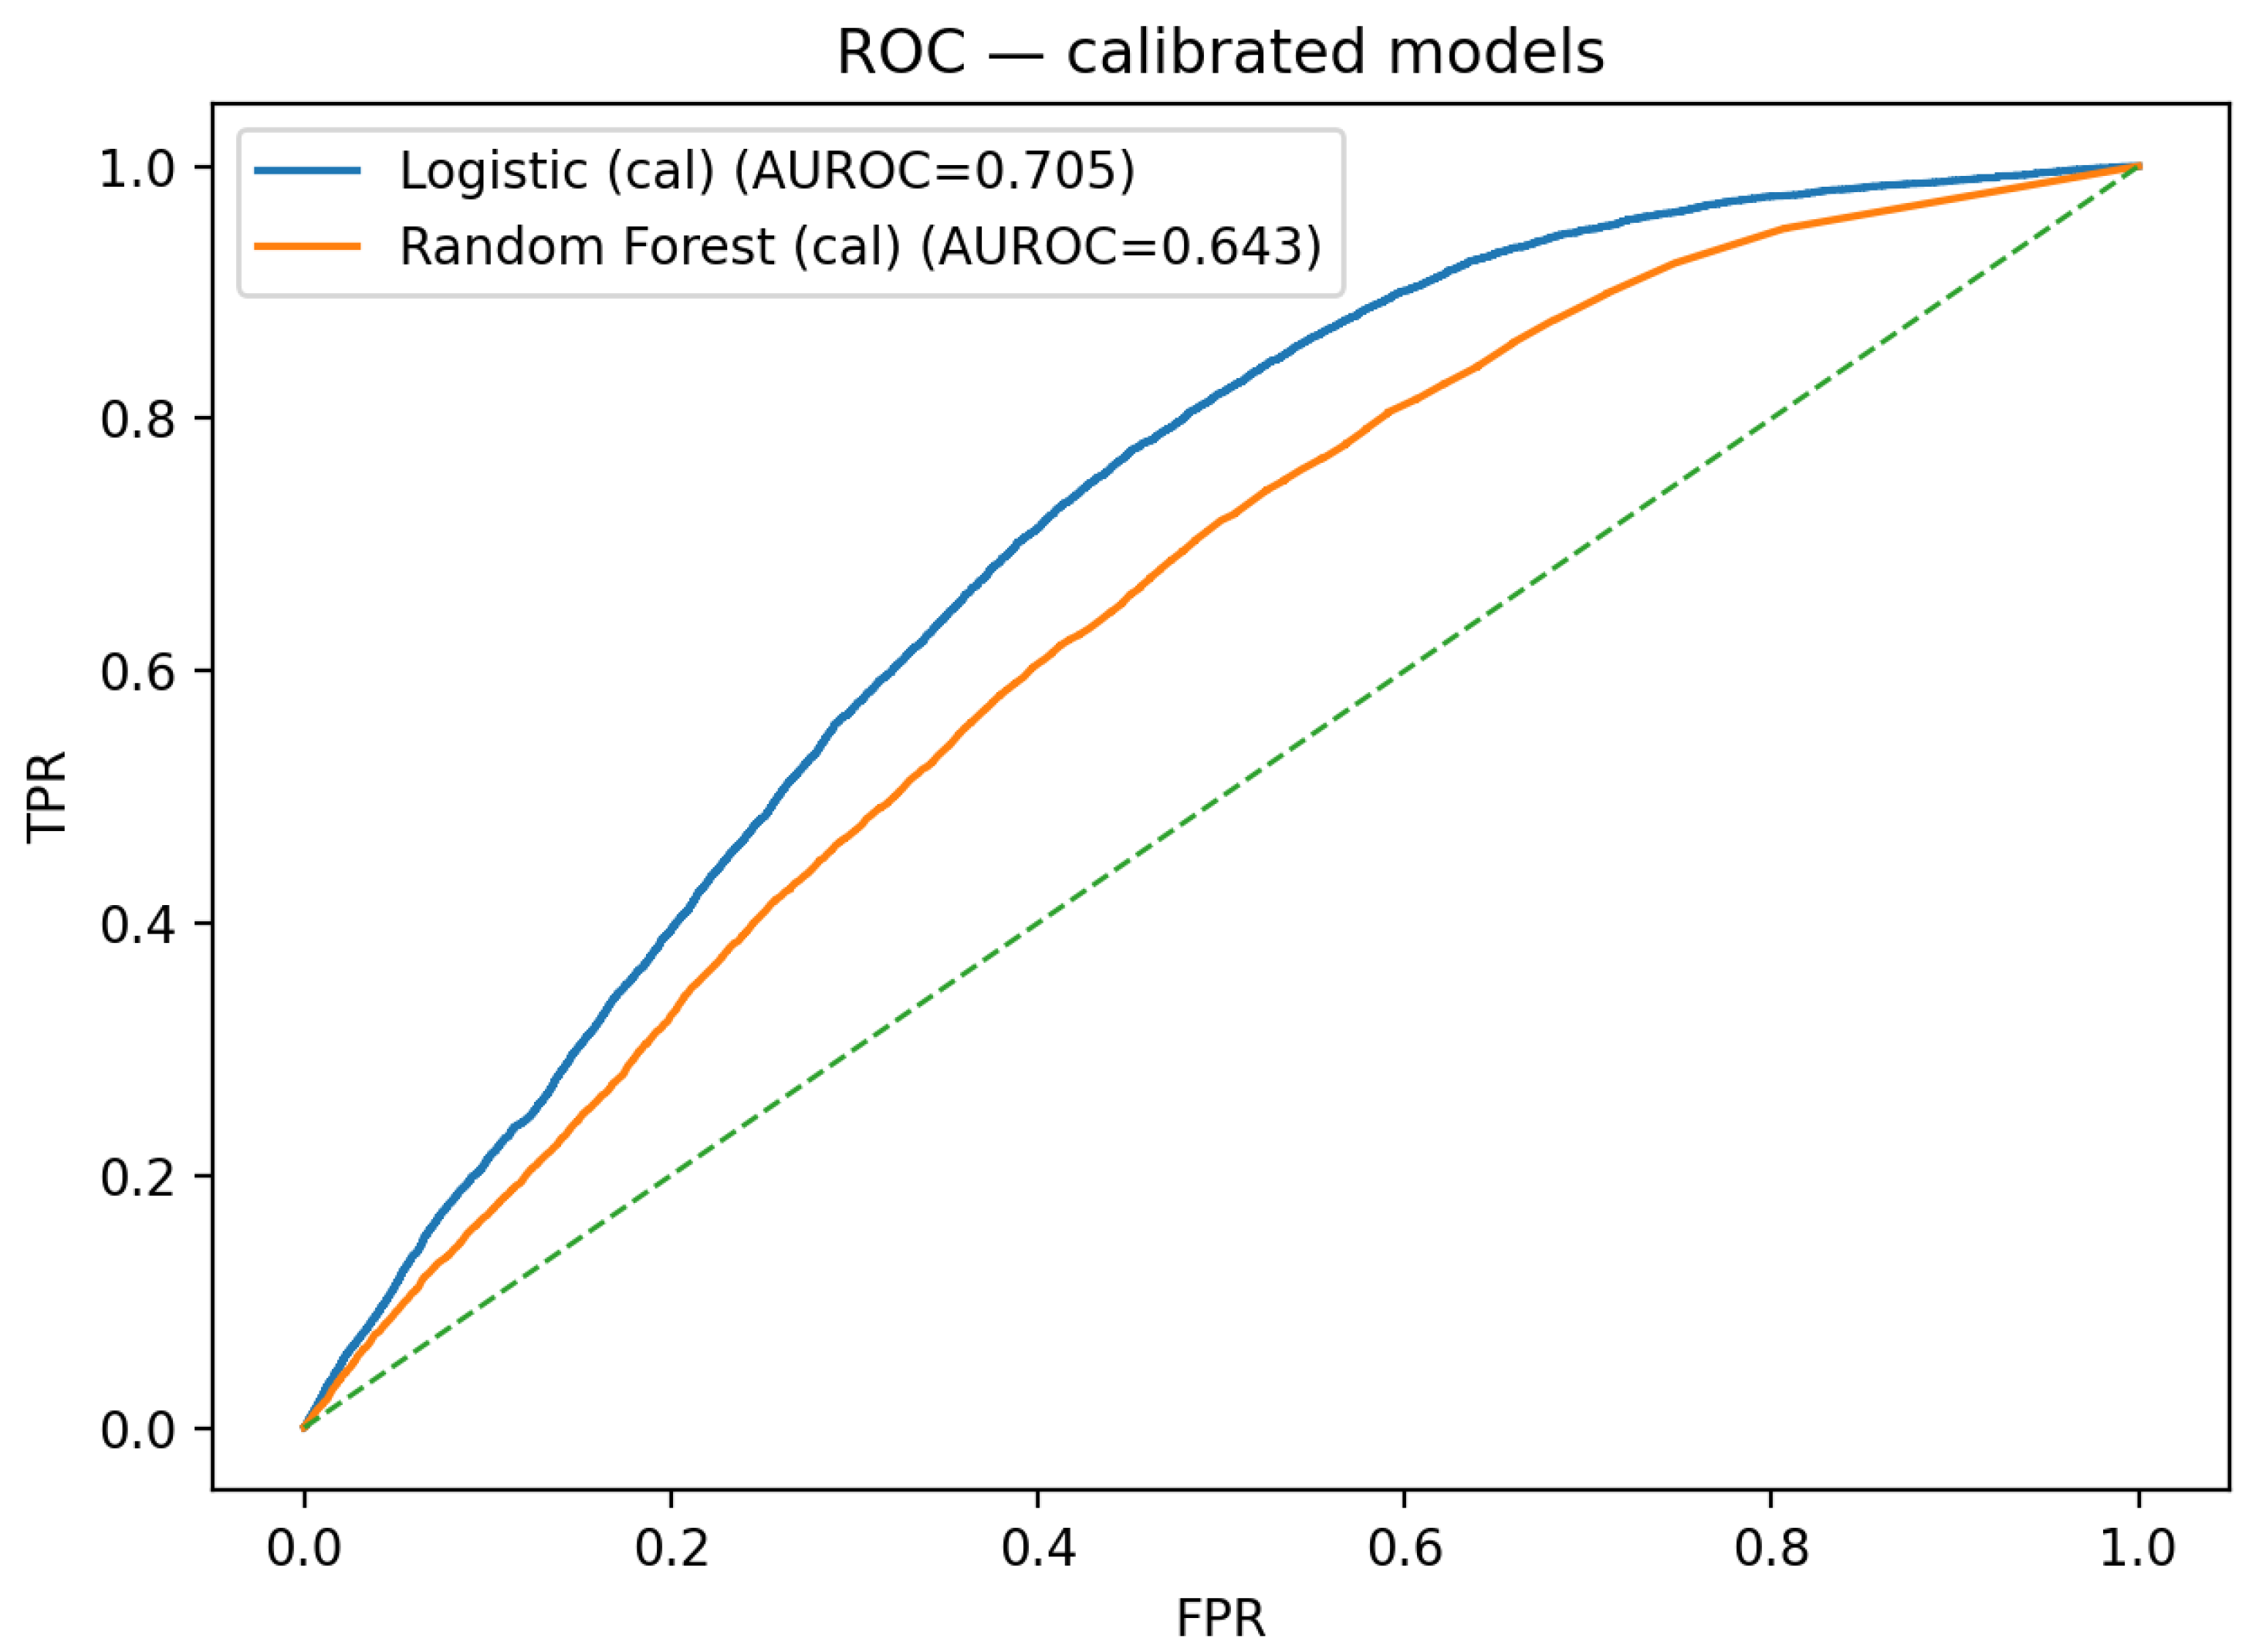
Test-set discrimination is summarized by the calibrated ROC overlay in
Figure 1 and by the calibrated precision–recall overlay in
Figure 2.
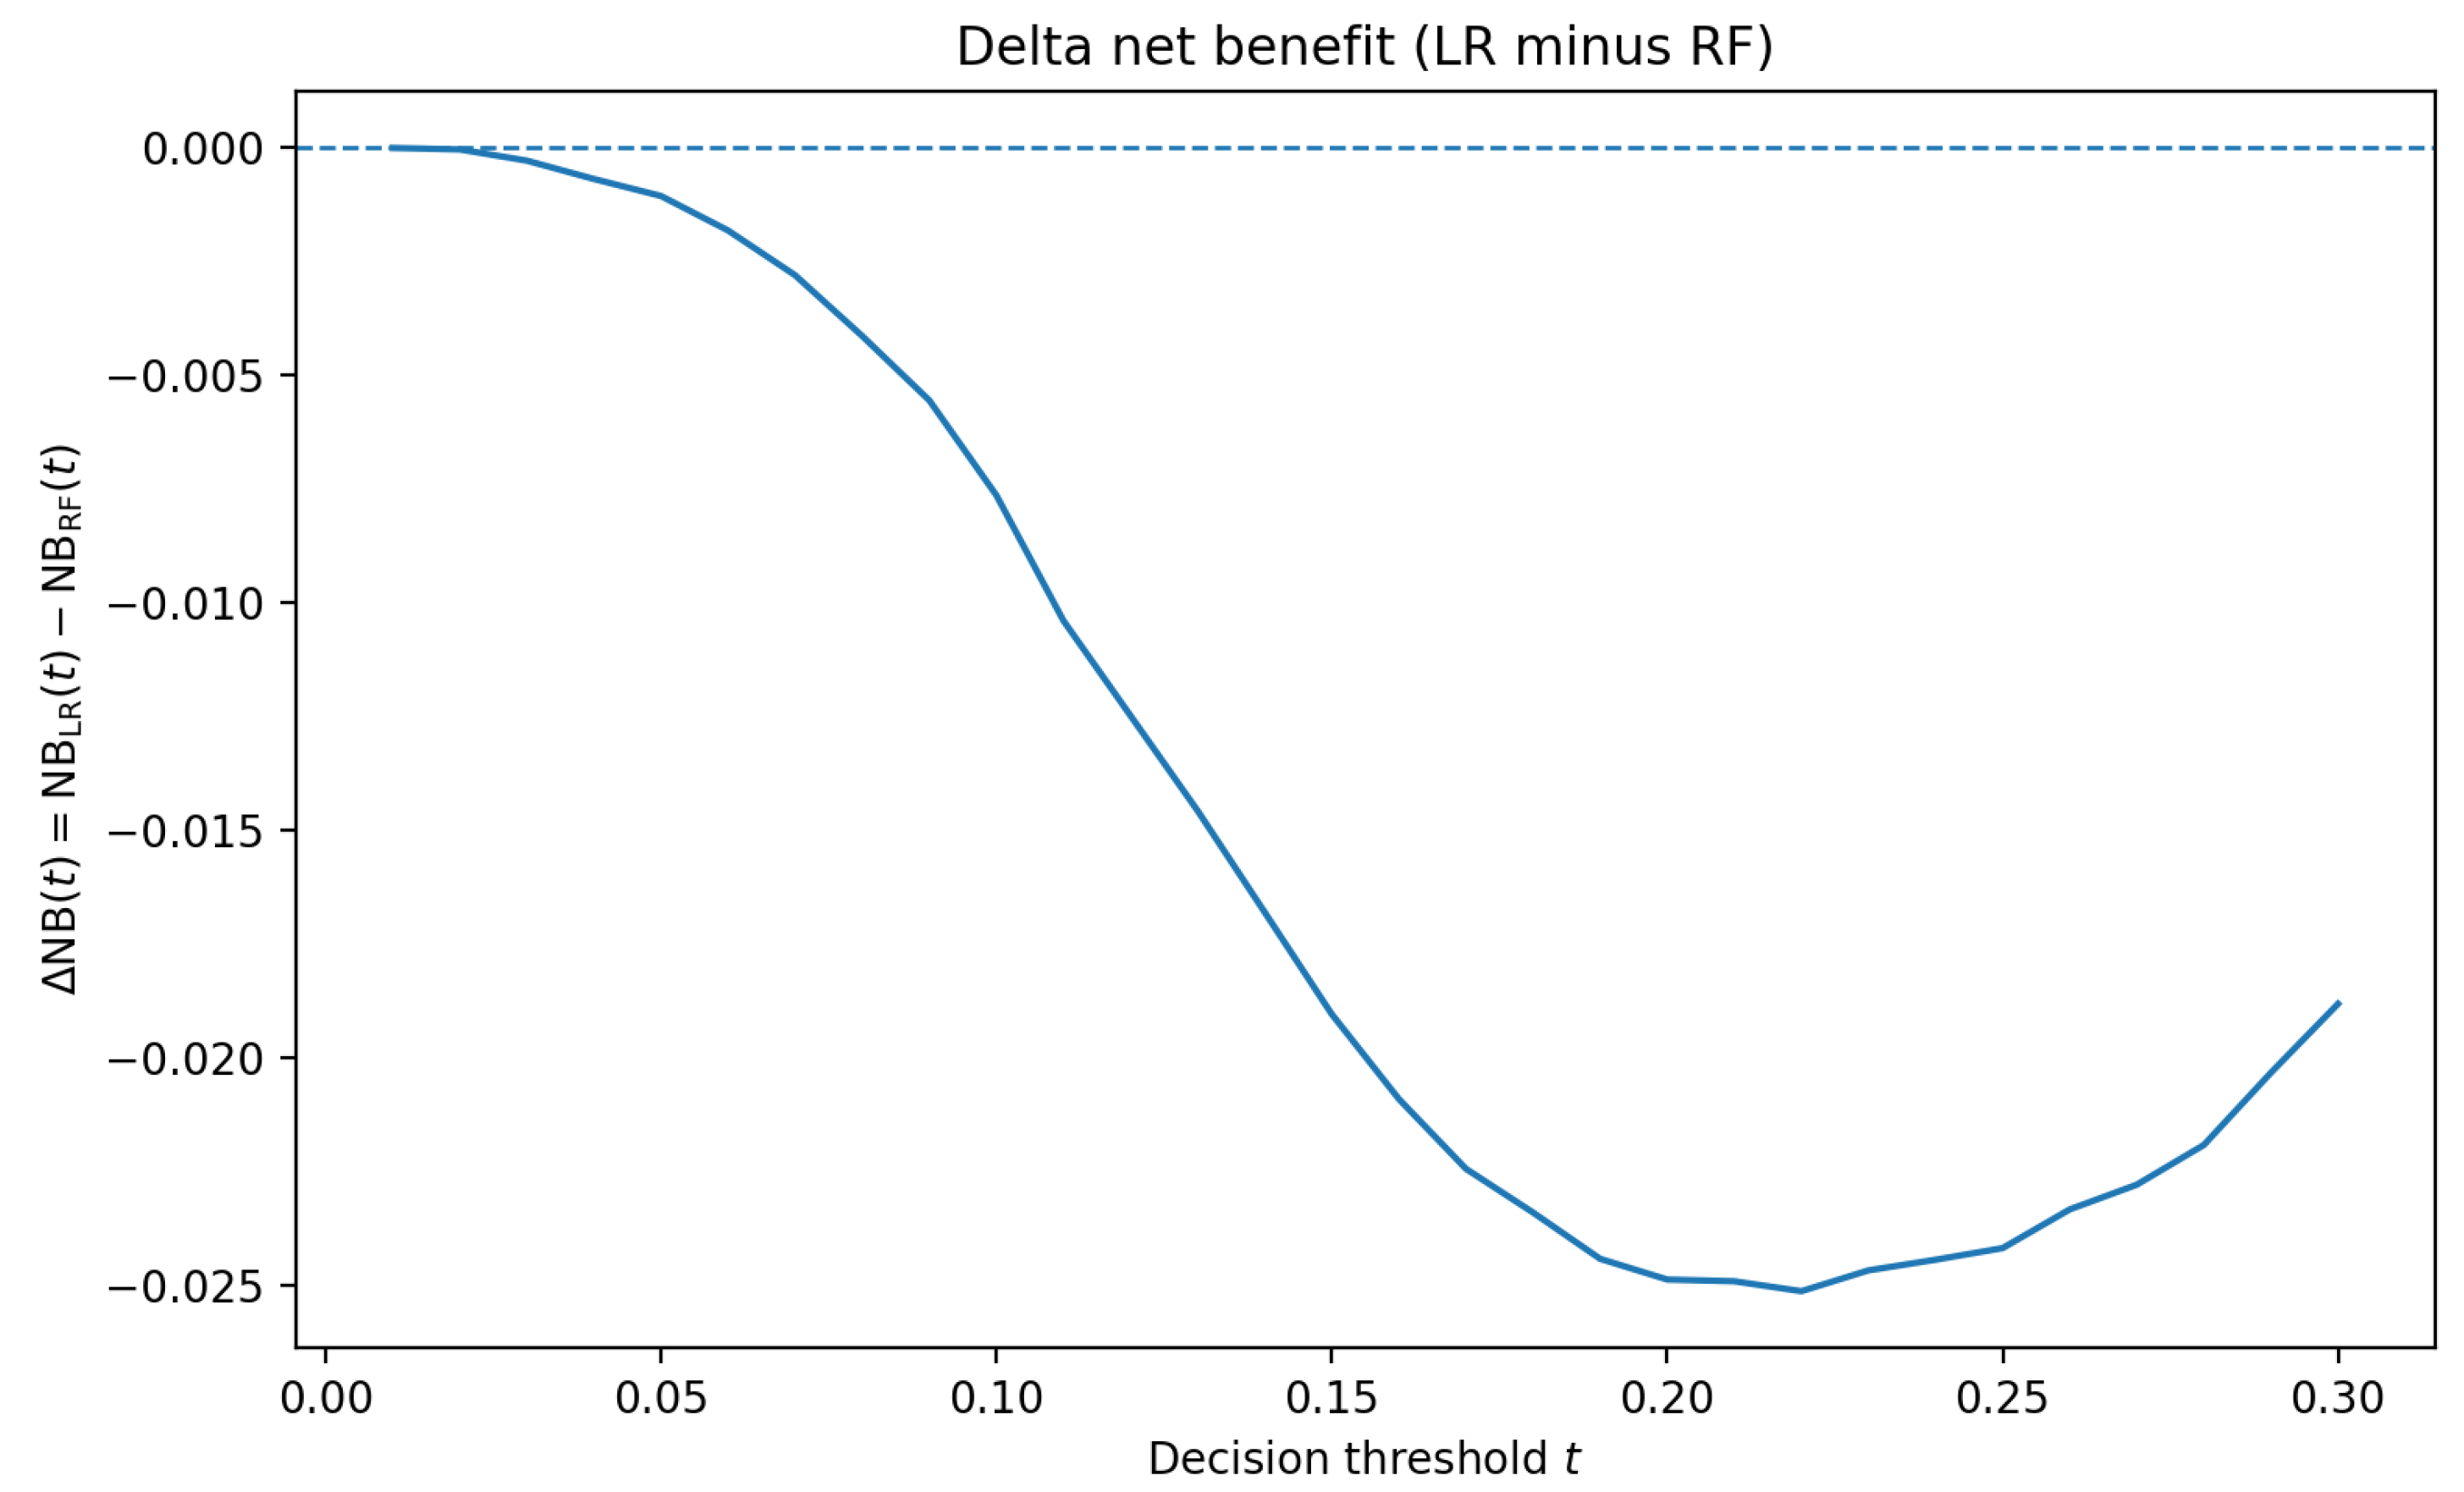
Decision-curve analysis indicates modest, threshold-dependent utility for both calibrated models. To avoid duplicating nearly identical curves,
Figure 3 reports the delta net benefit
The delta stays close to zero across clinically plausible thresholds, with RF slightly higher at very low and mid thresholds (e.g., (t = 0.05) and ()), and LR competitive elsewhere. The small absolute magnitudes are consistent with a compact admission-time feature set and underscore that threshold selection should be guided by local costs and prevalence rather than assuming a uniform winner.
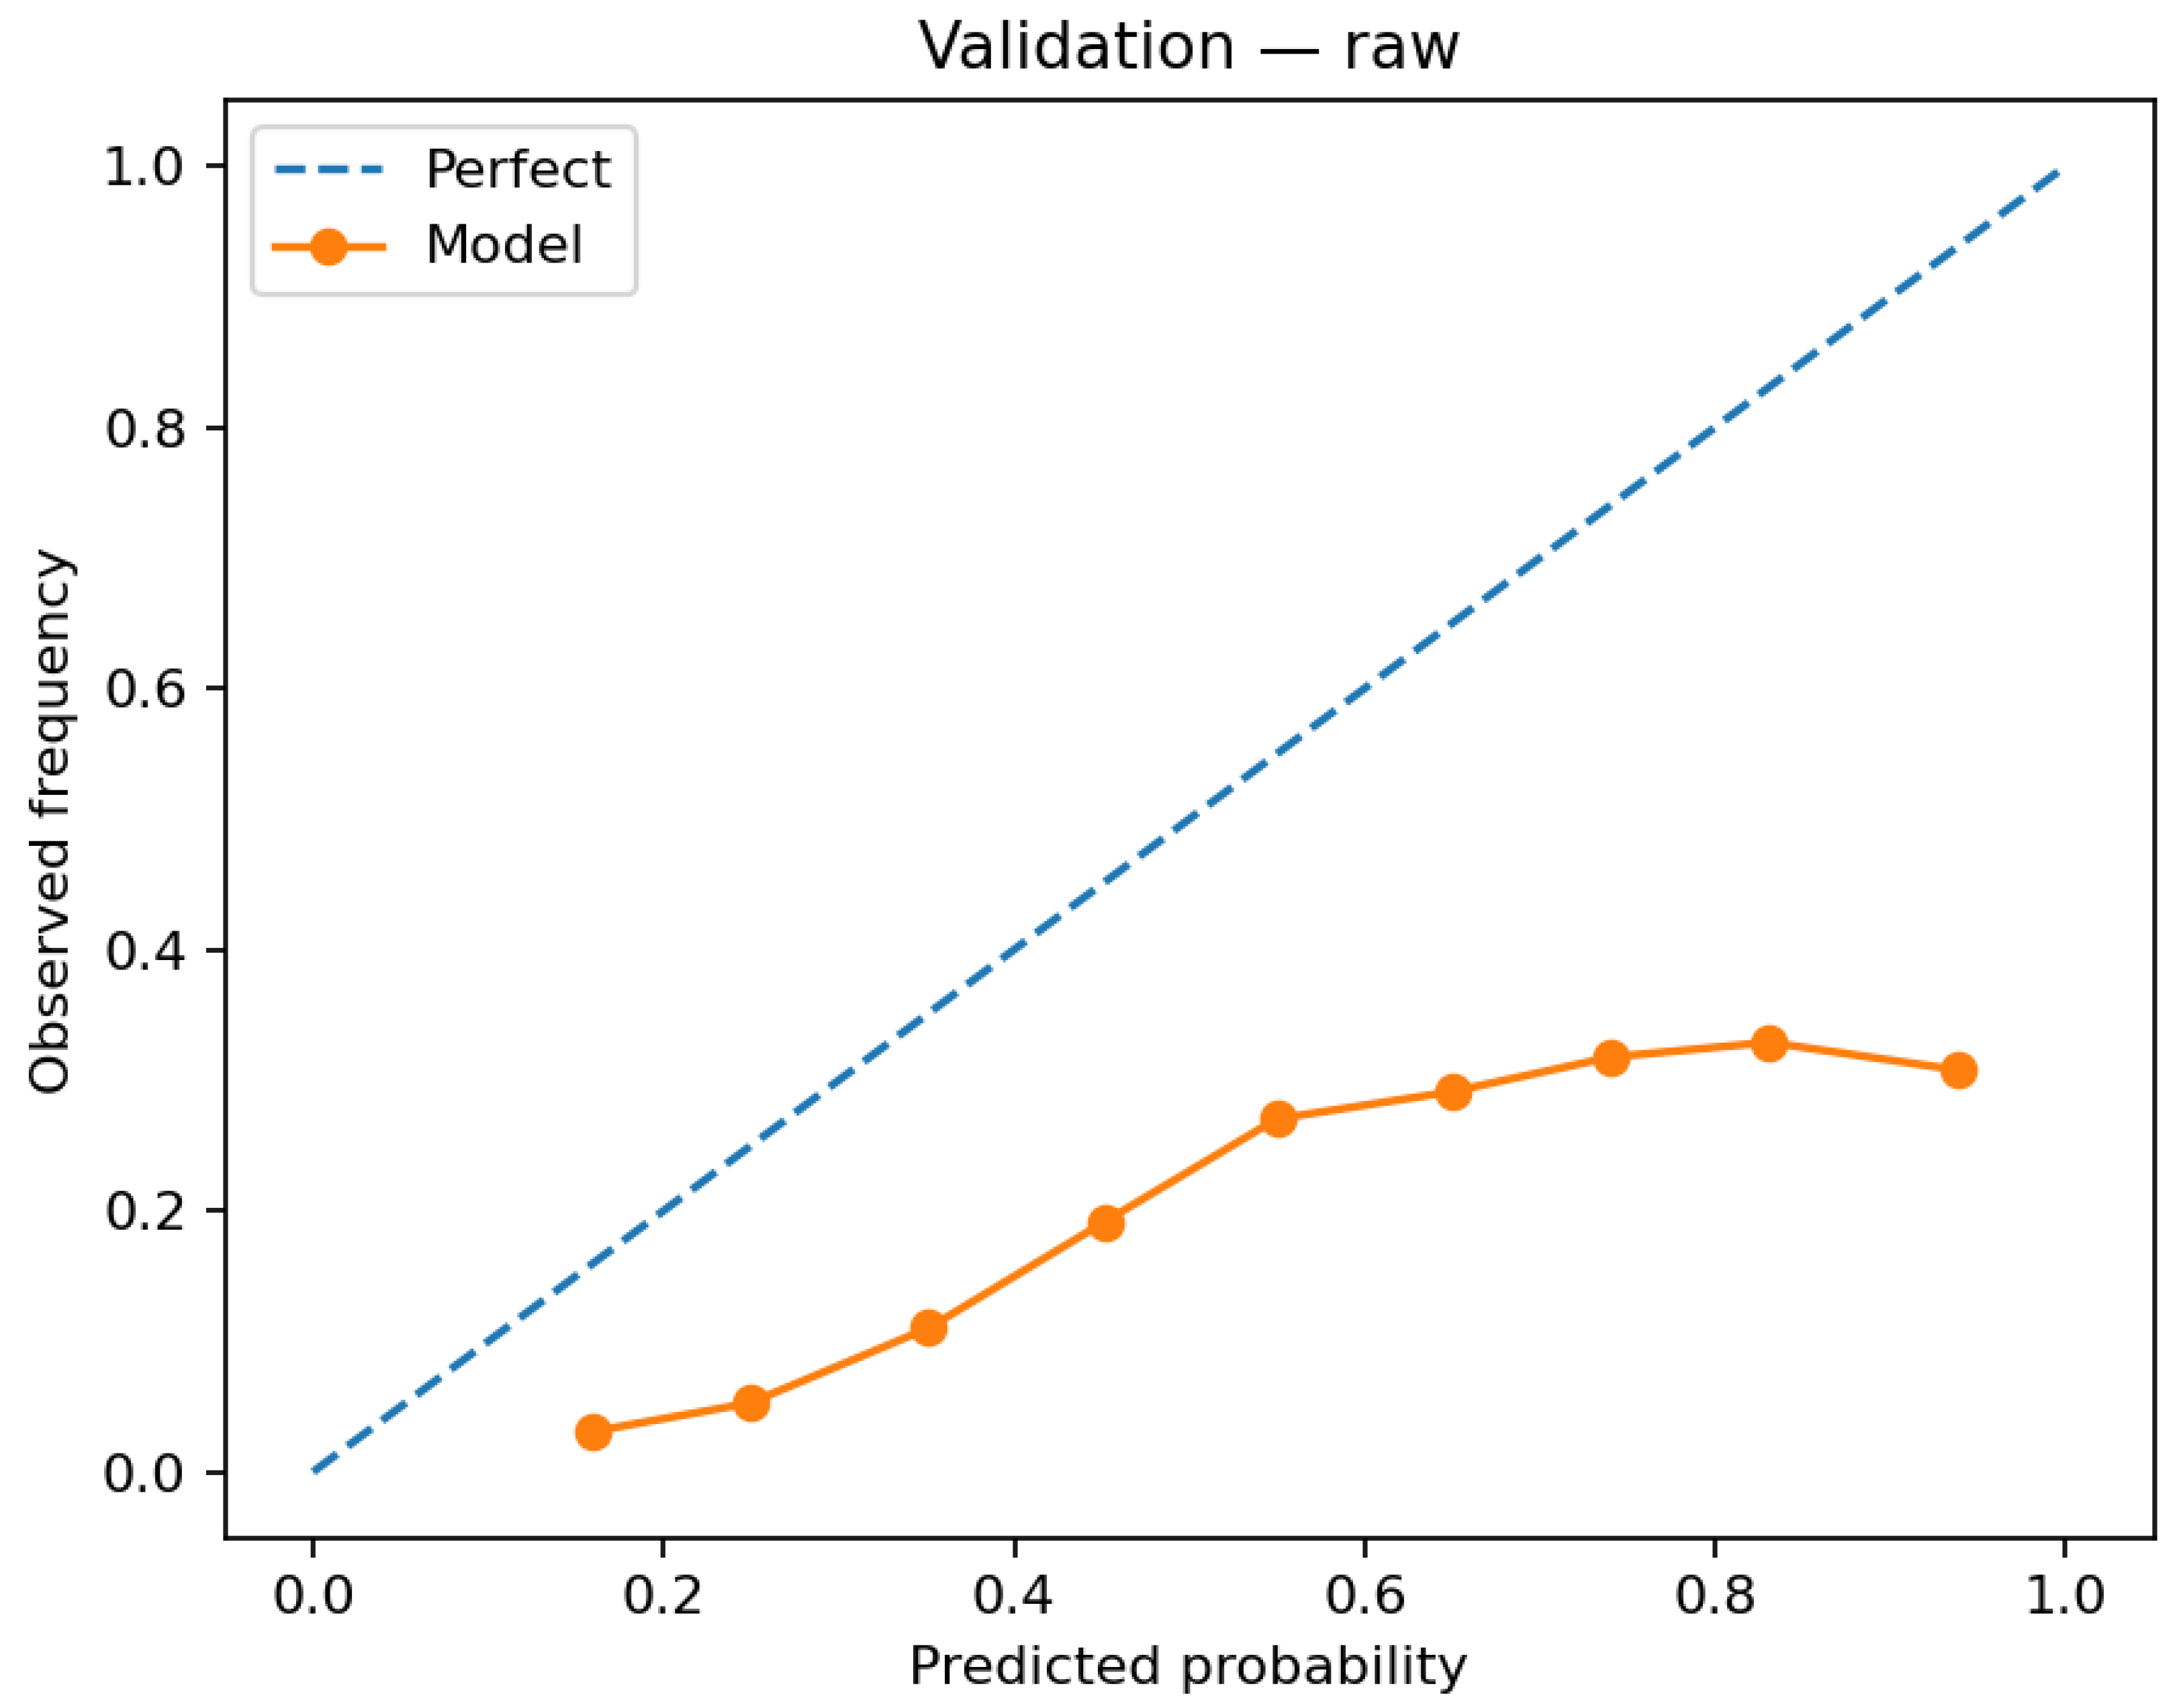
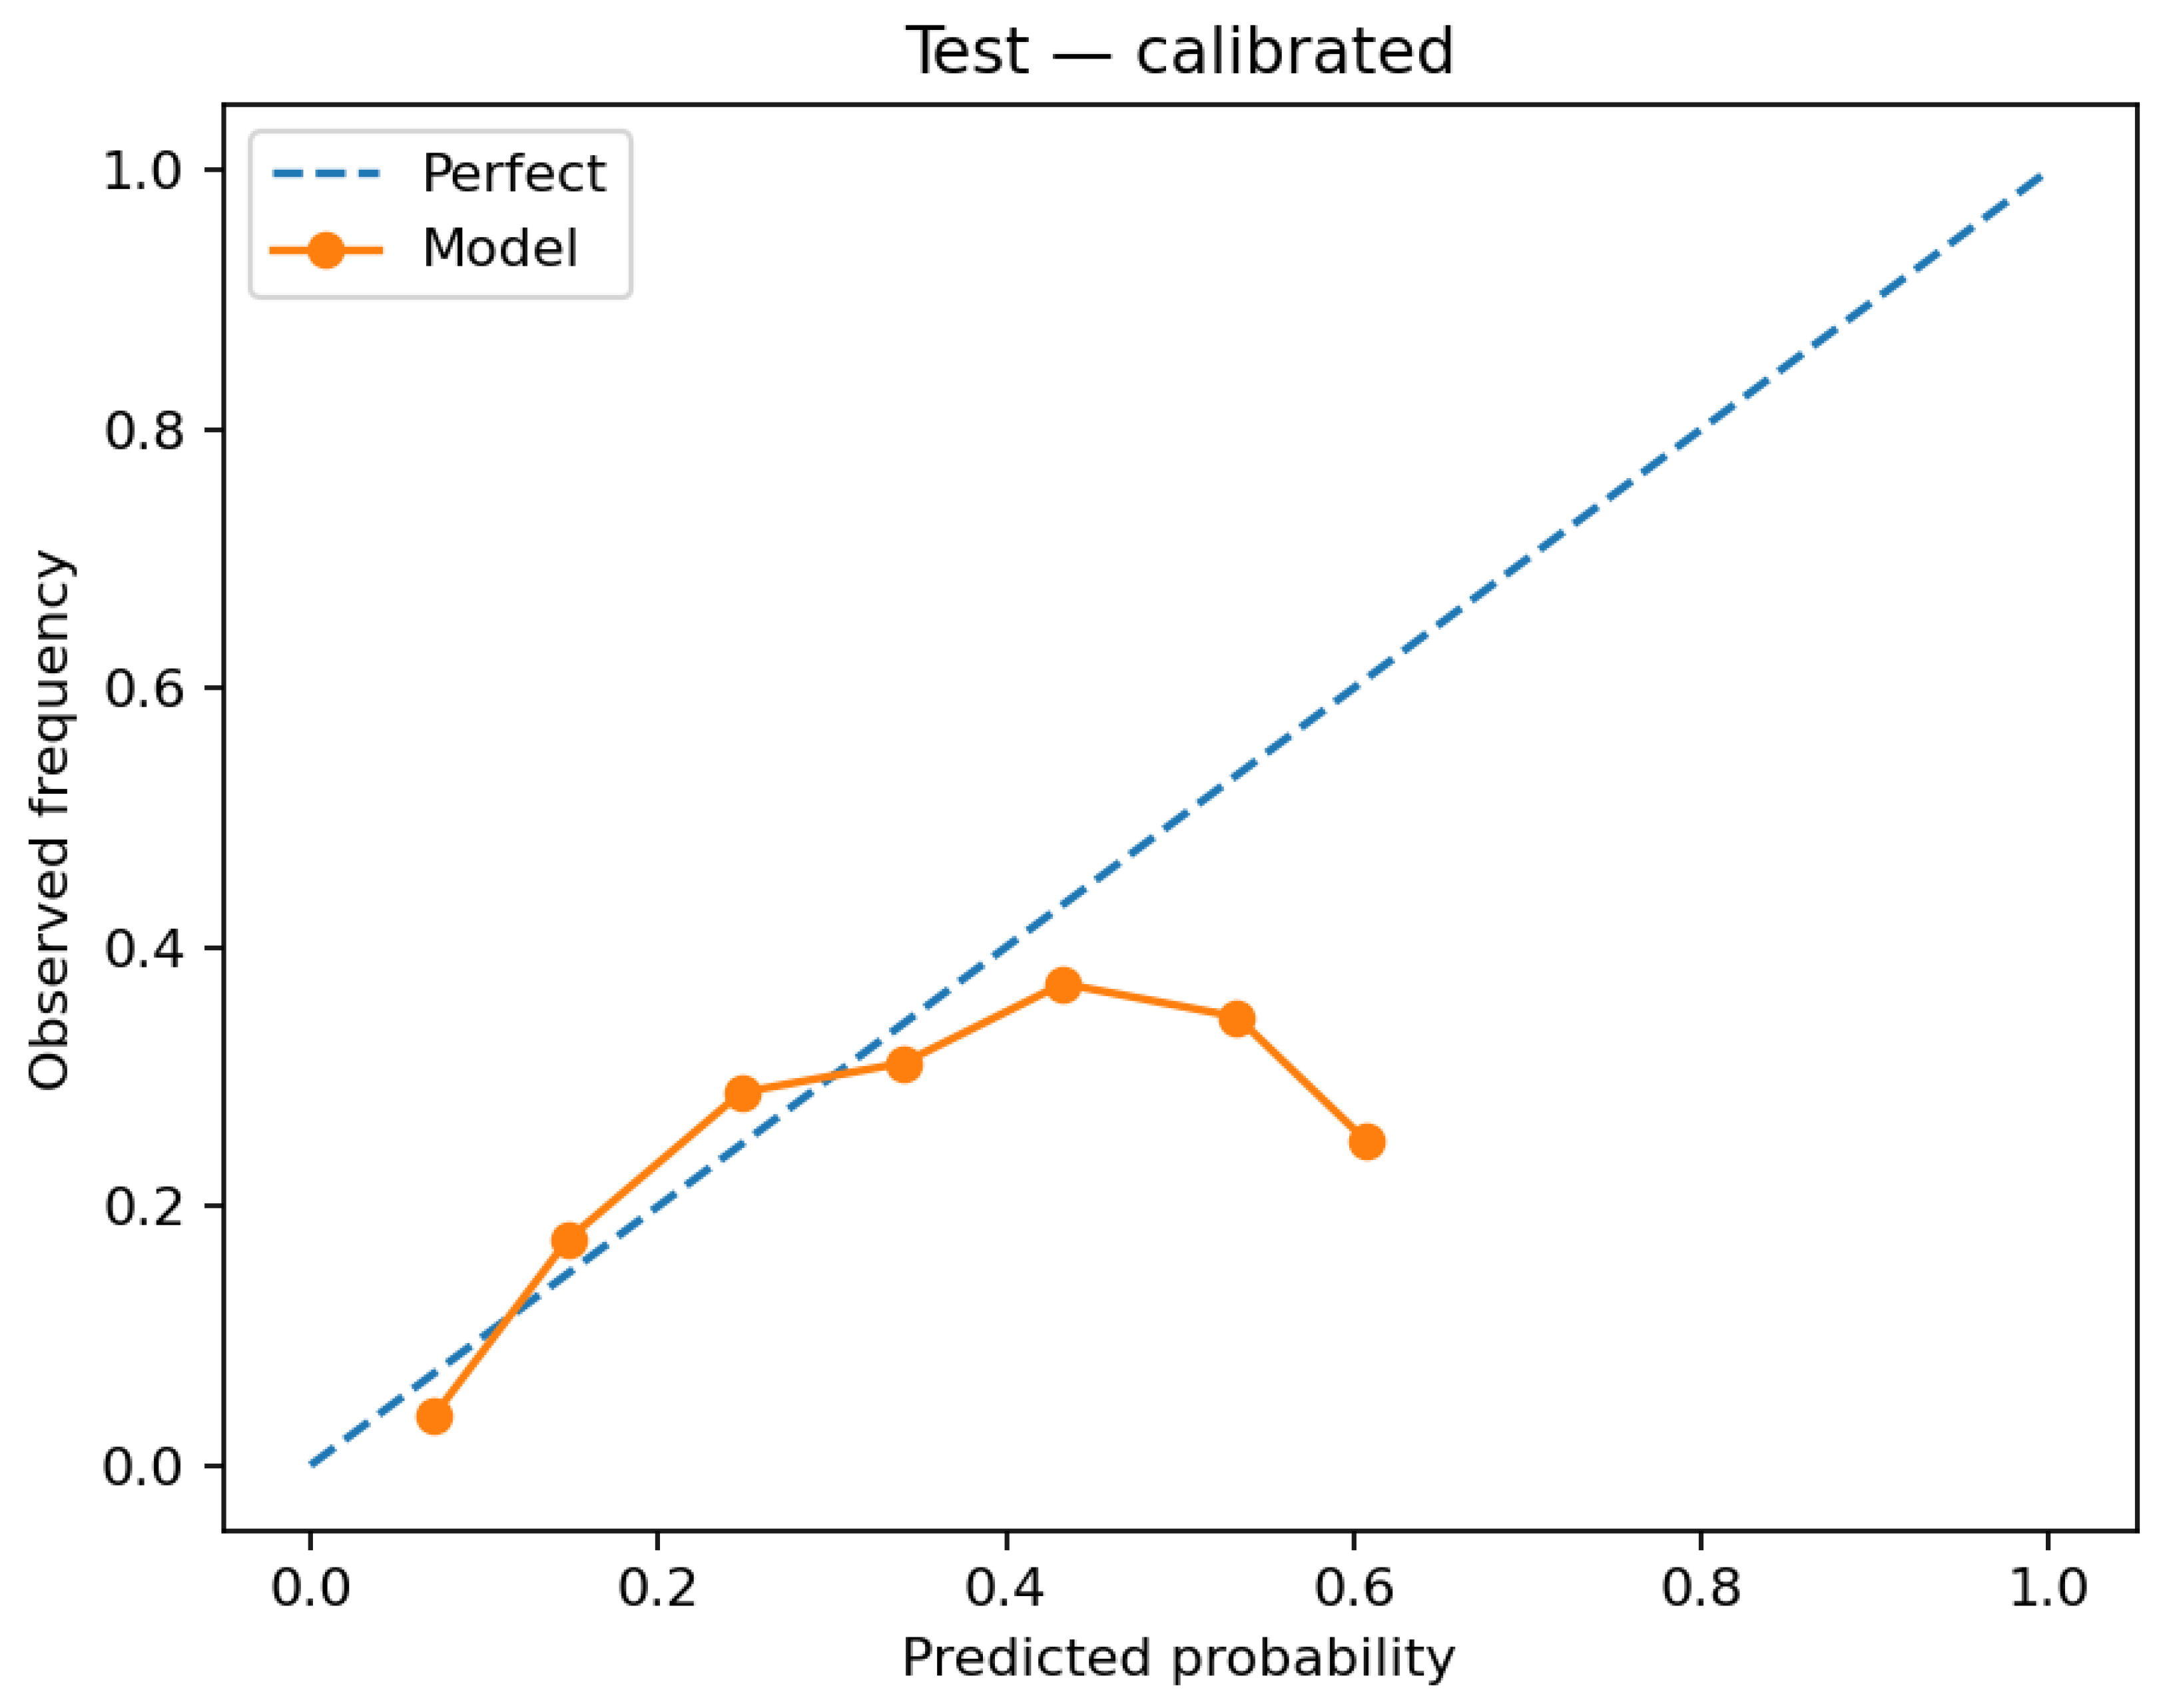
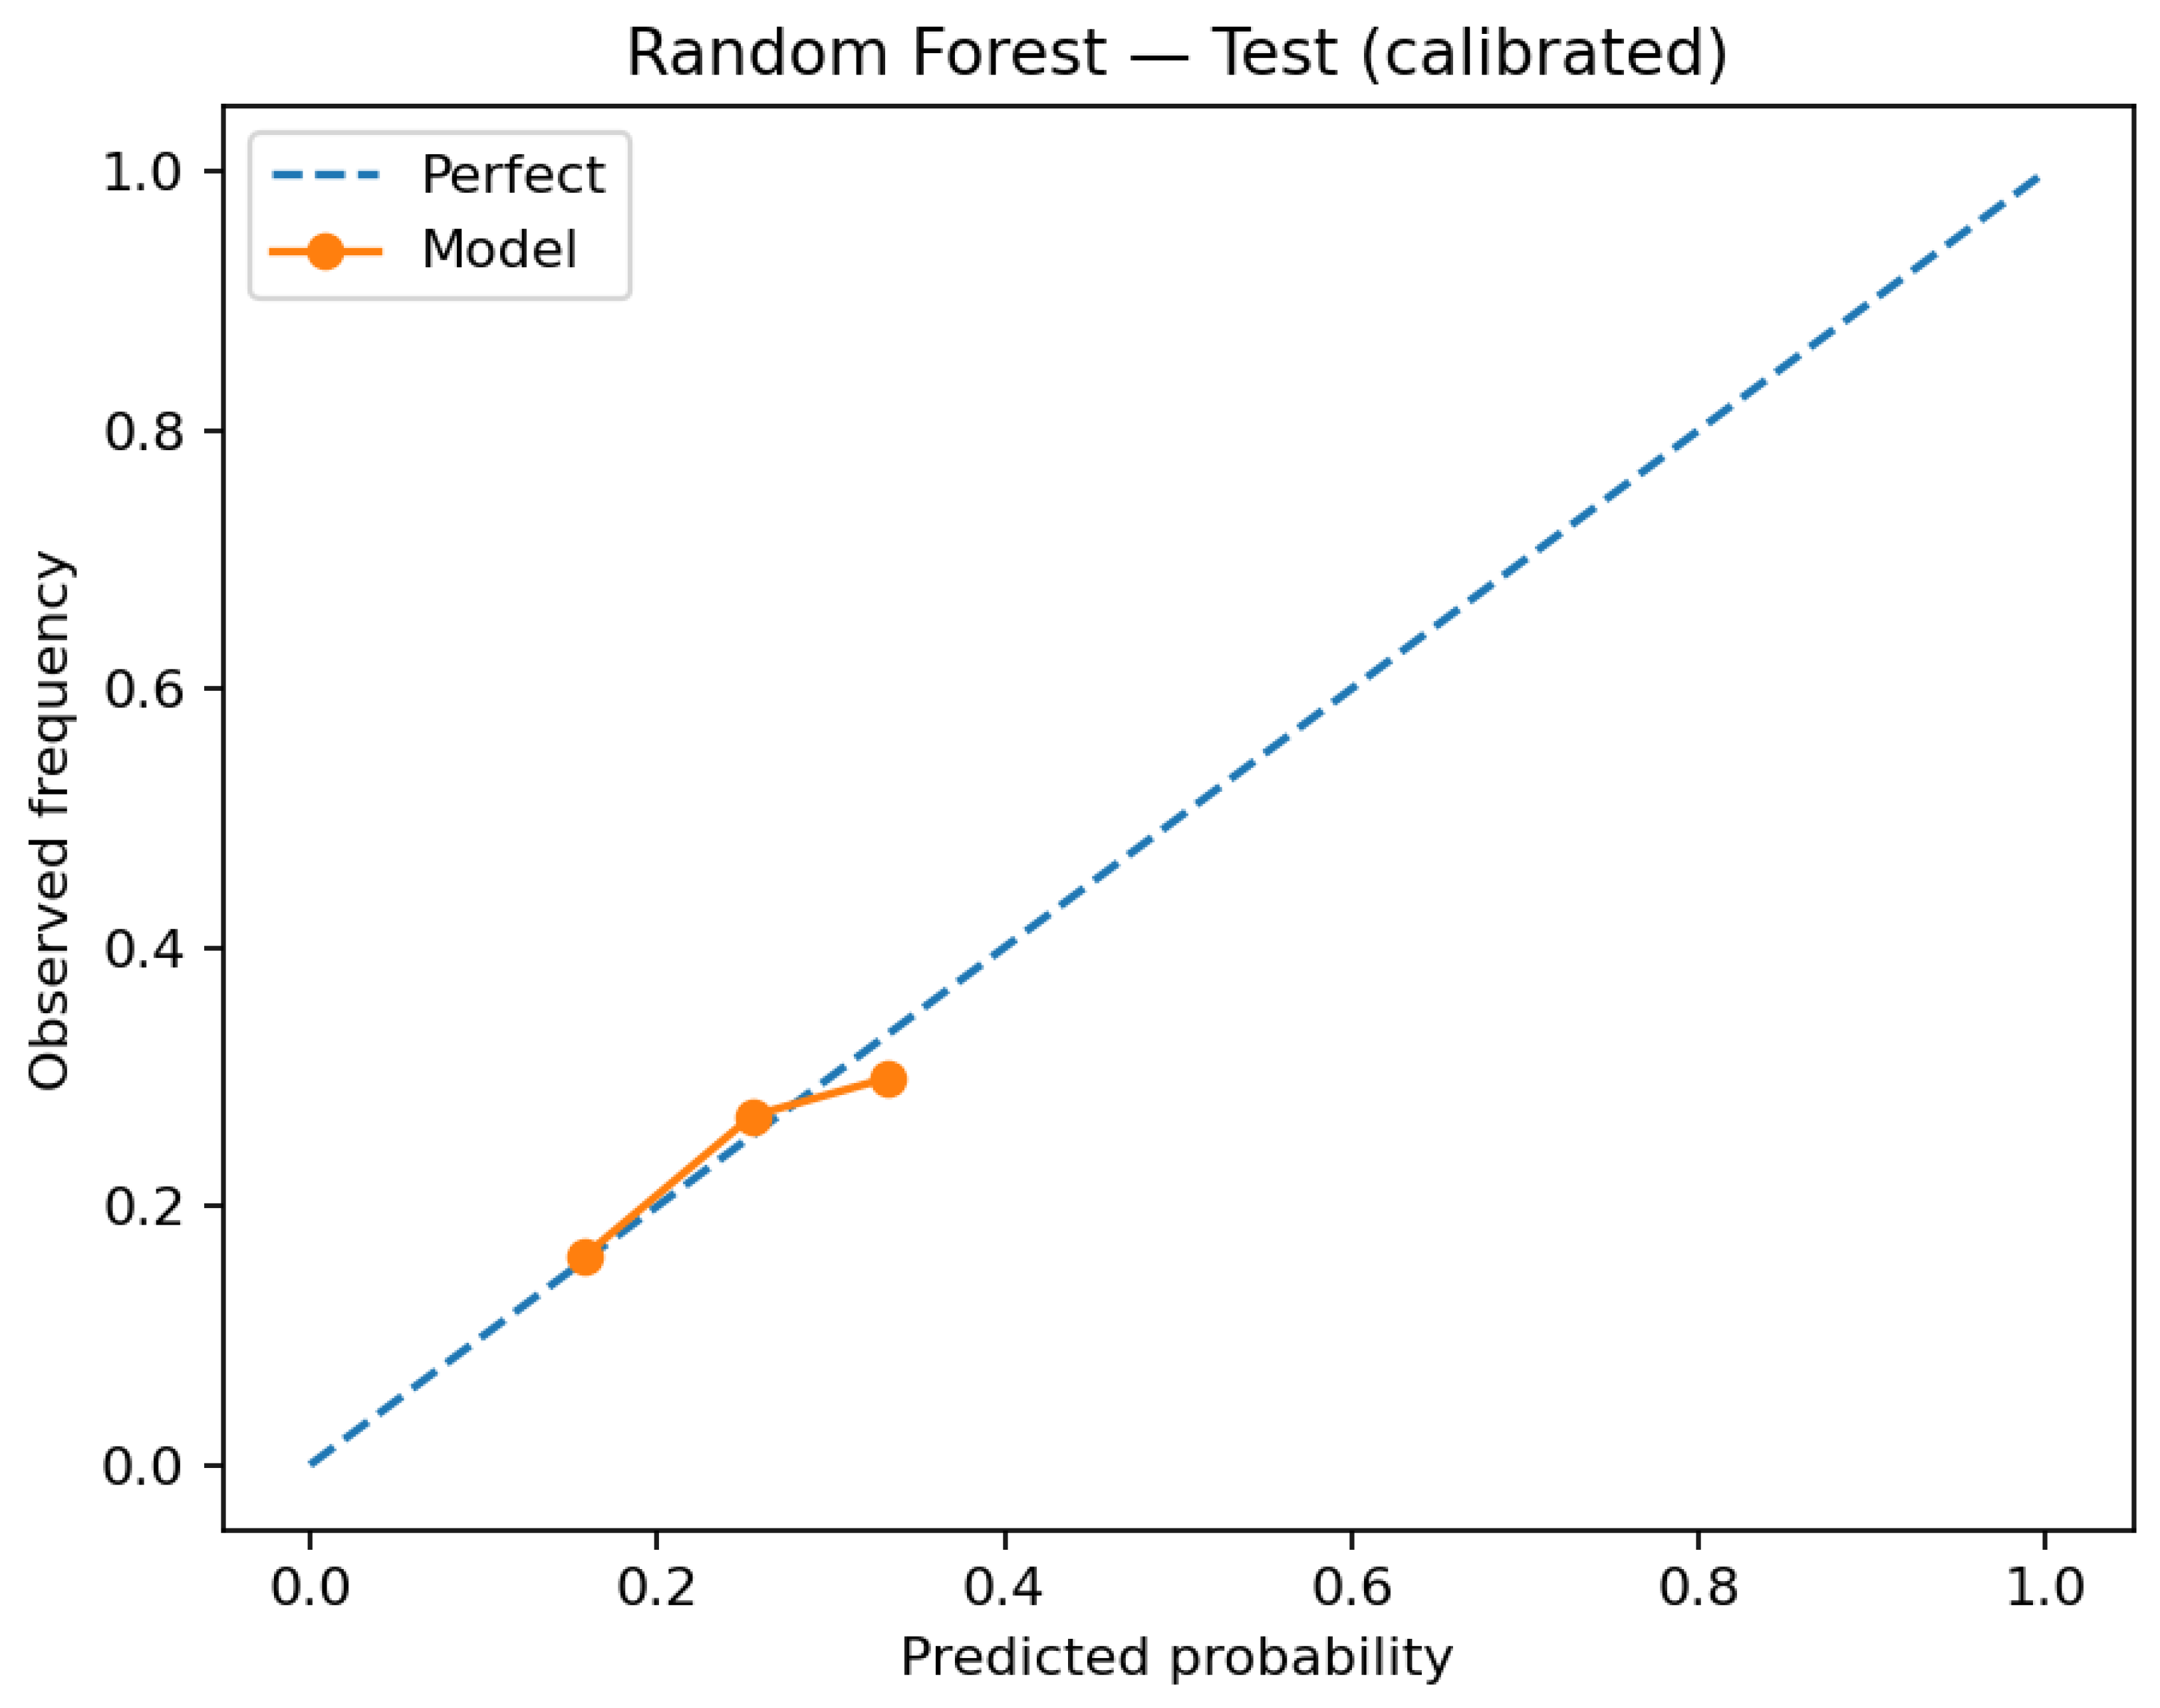
Probability quality appears in the validation reliability diagram before calibration (
Figure 4) and in the test reliability diagrams after calibration (
Figure 5 and
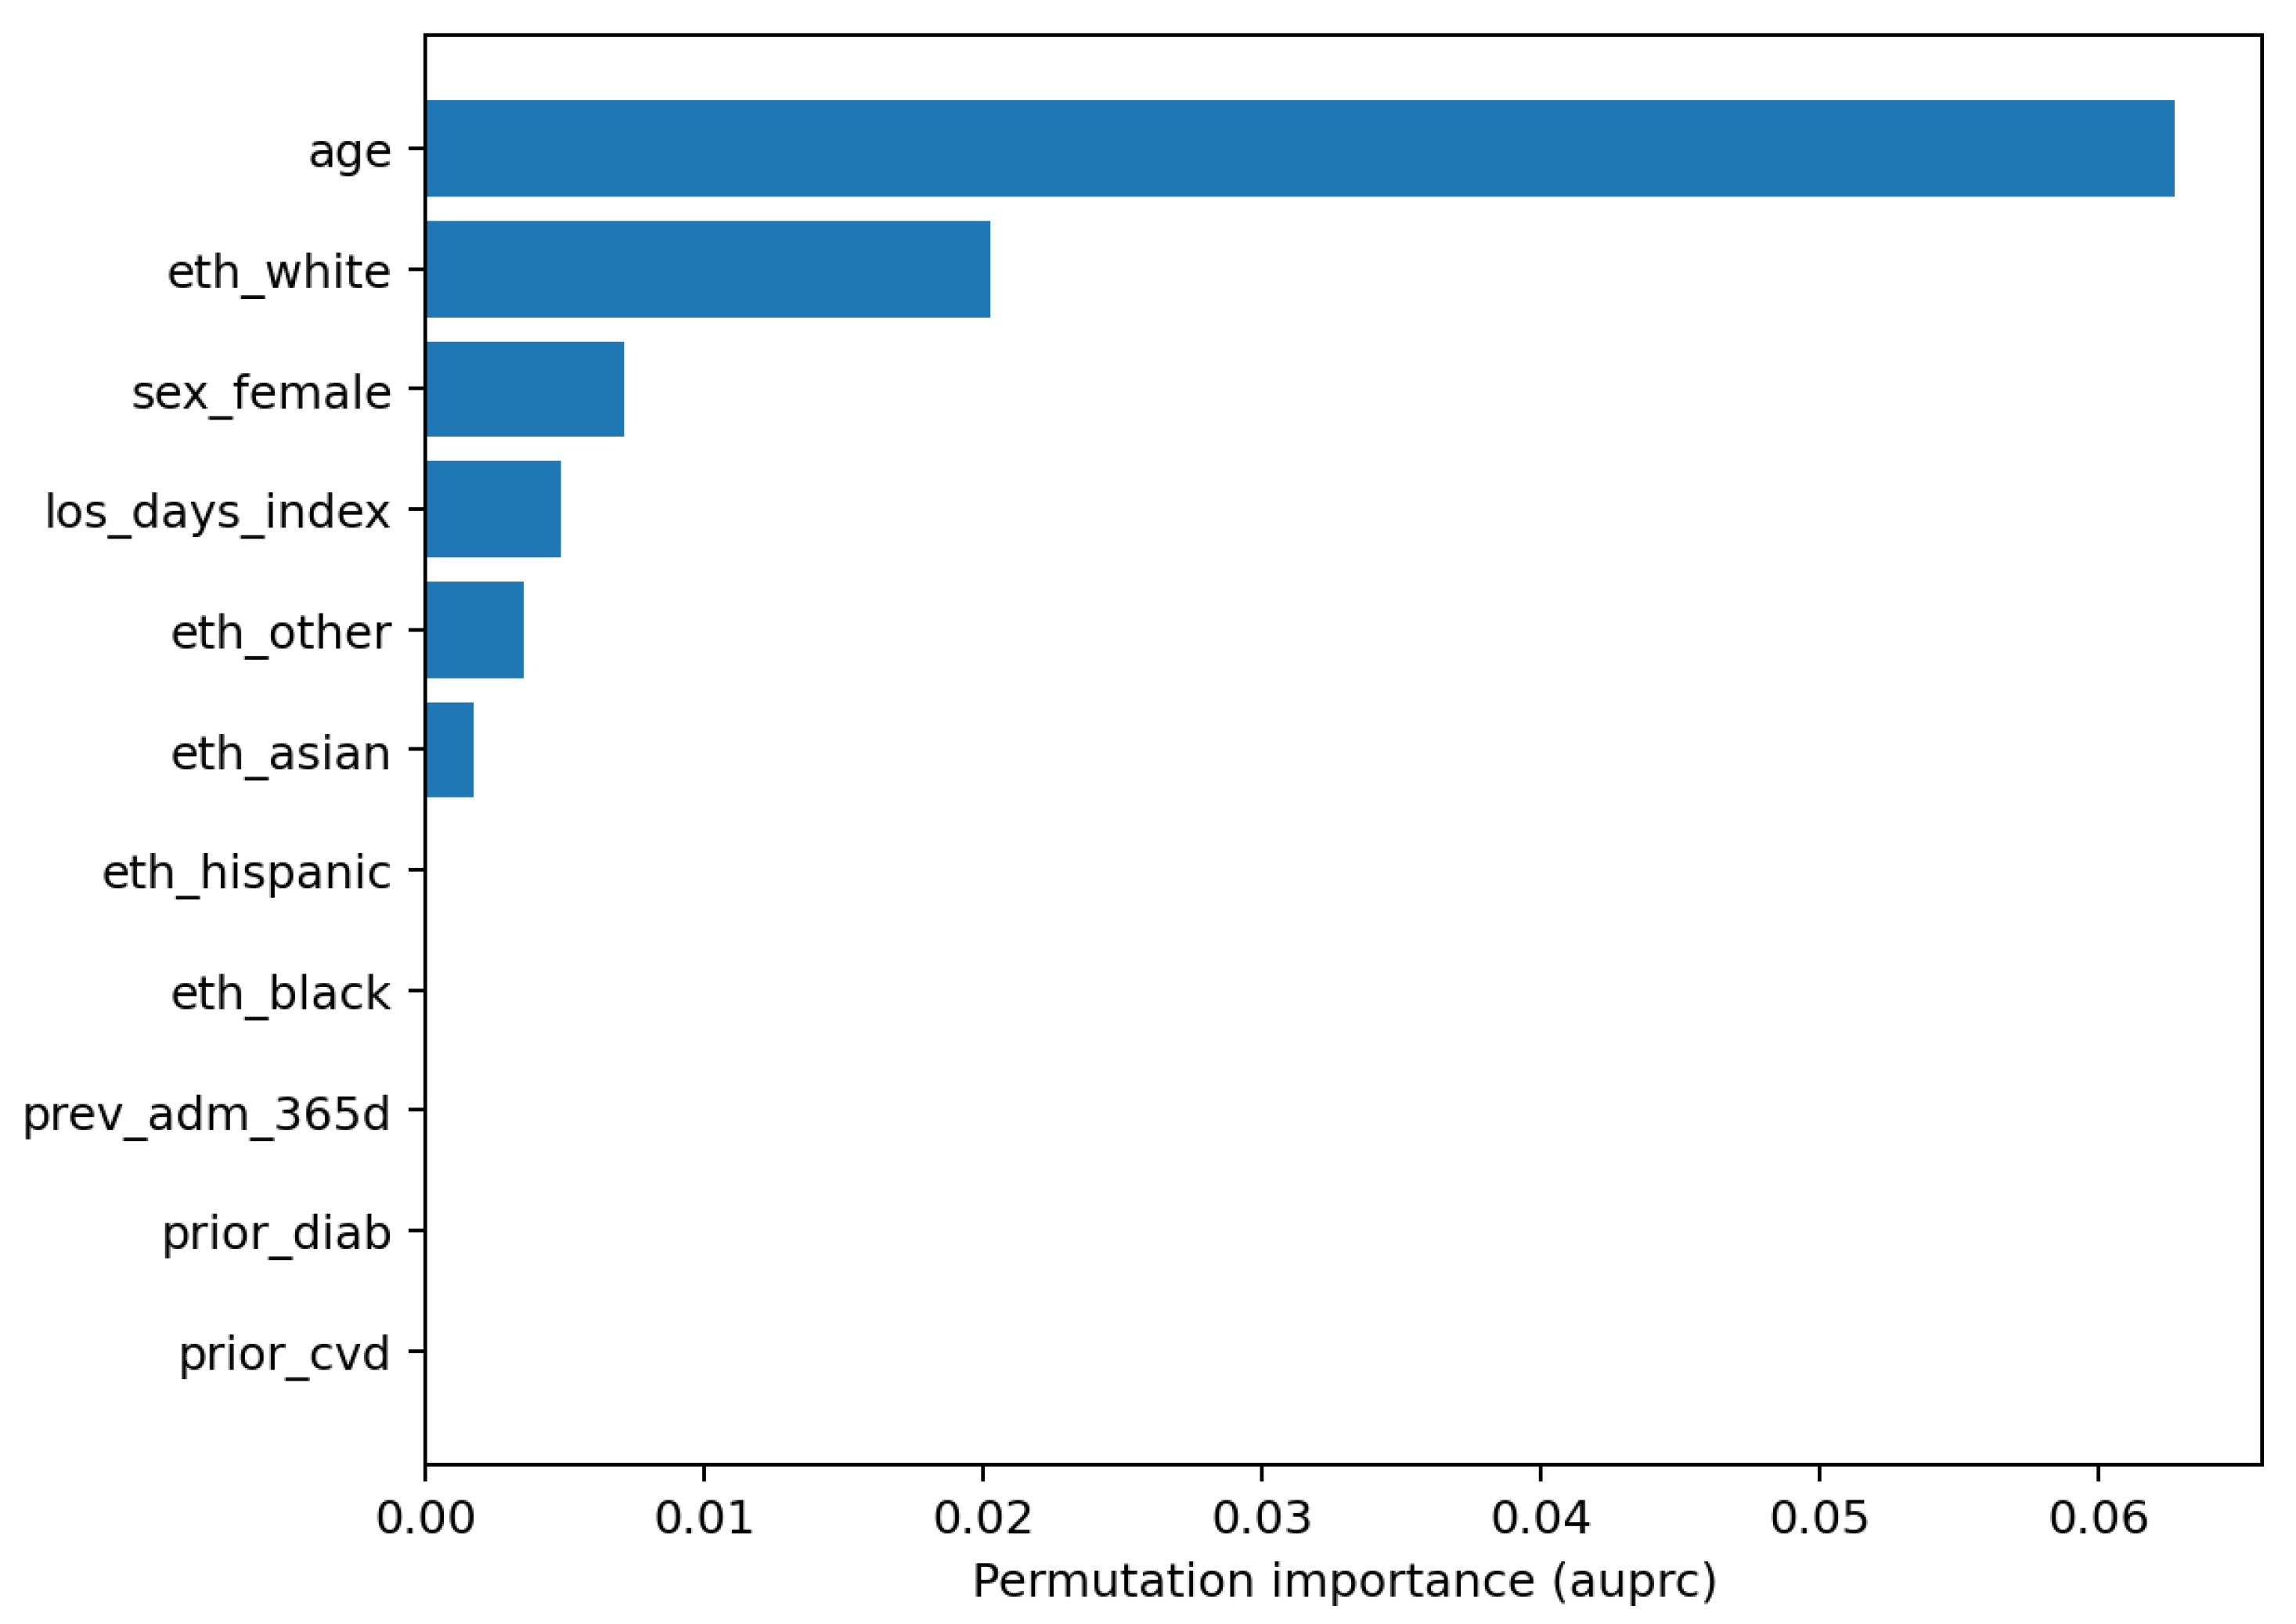
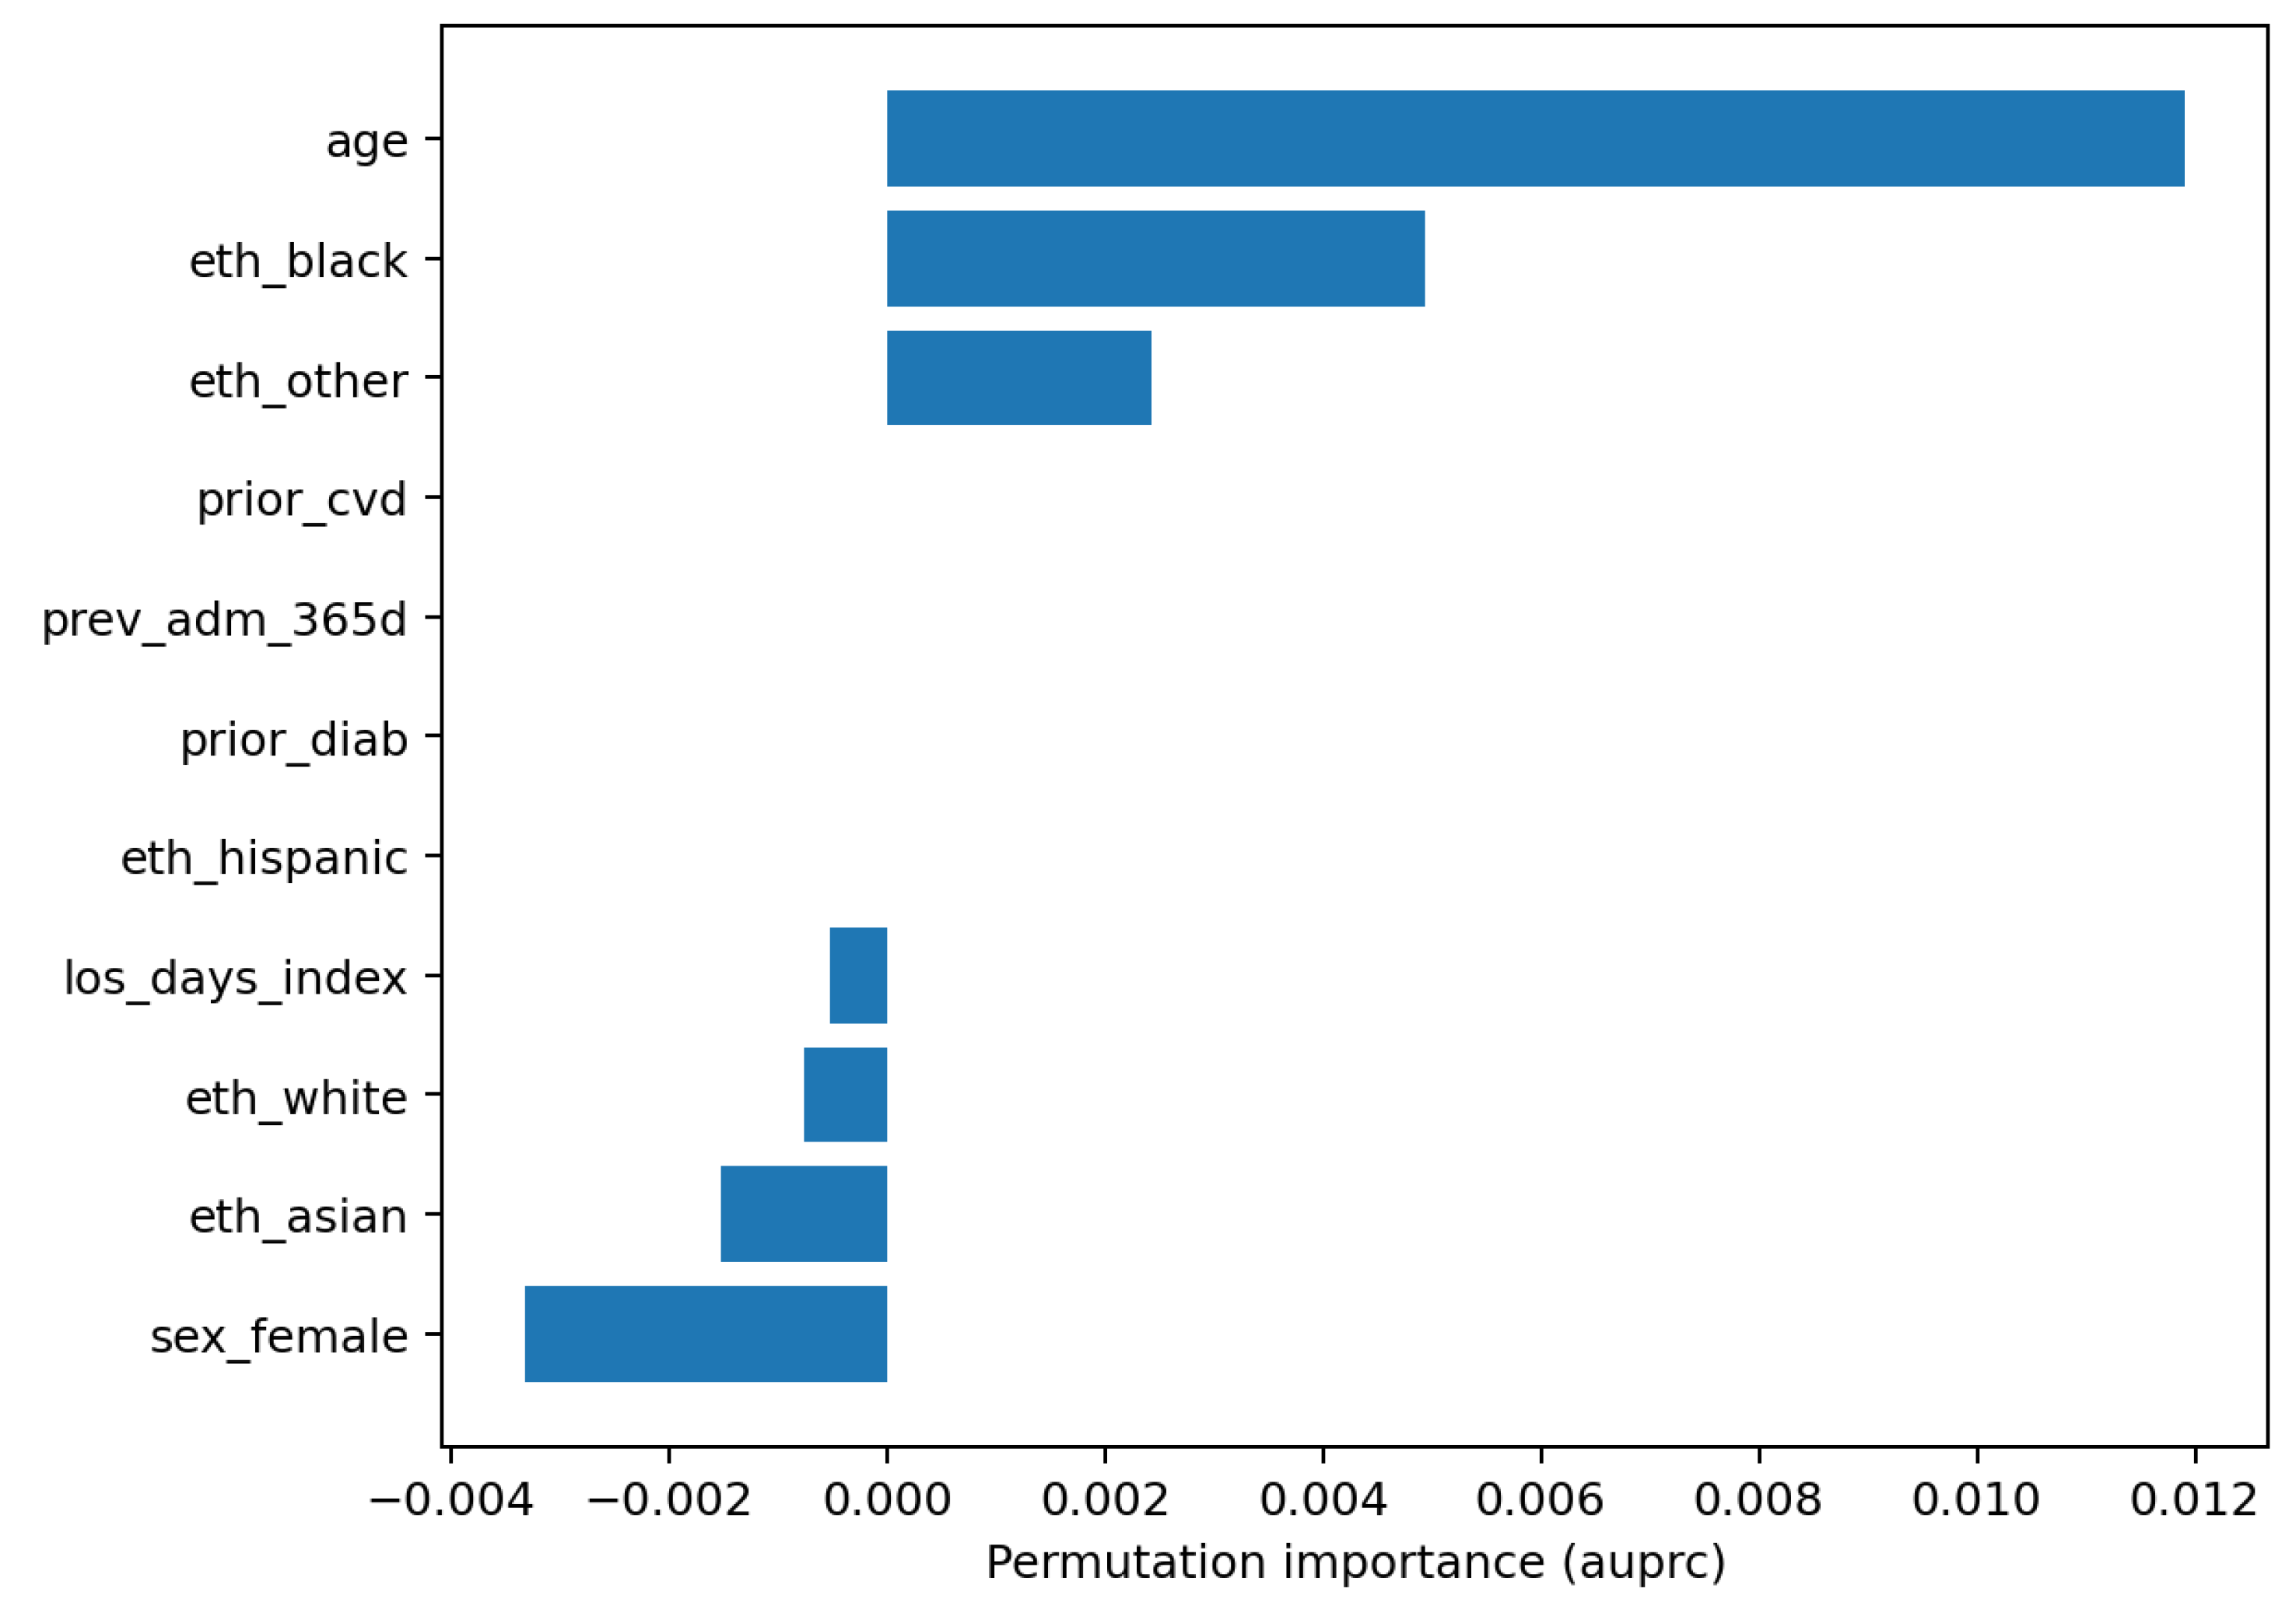
Figure 6). Global feature reliance is reported as permutation importance for LR and RF (
Figure 7 and
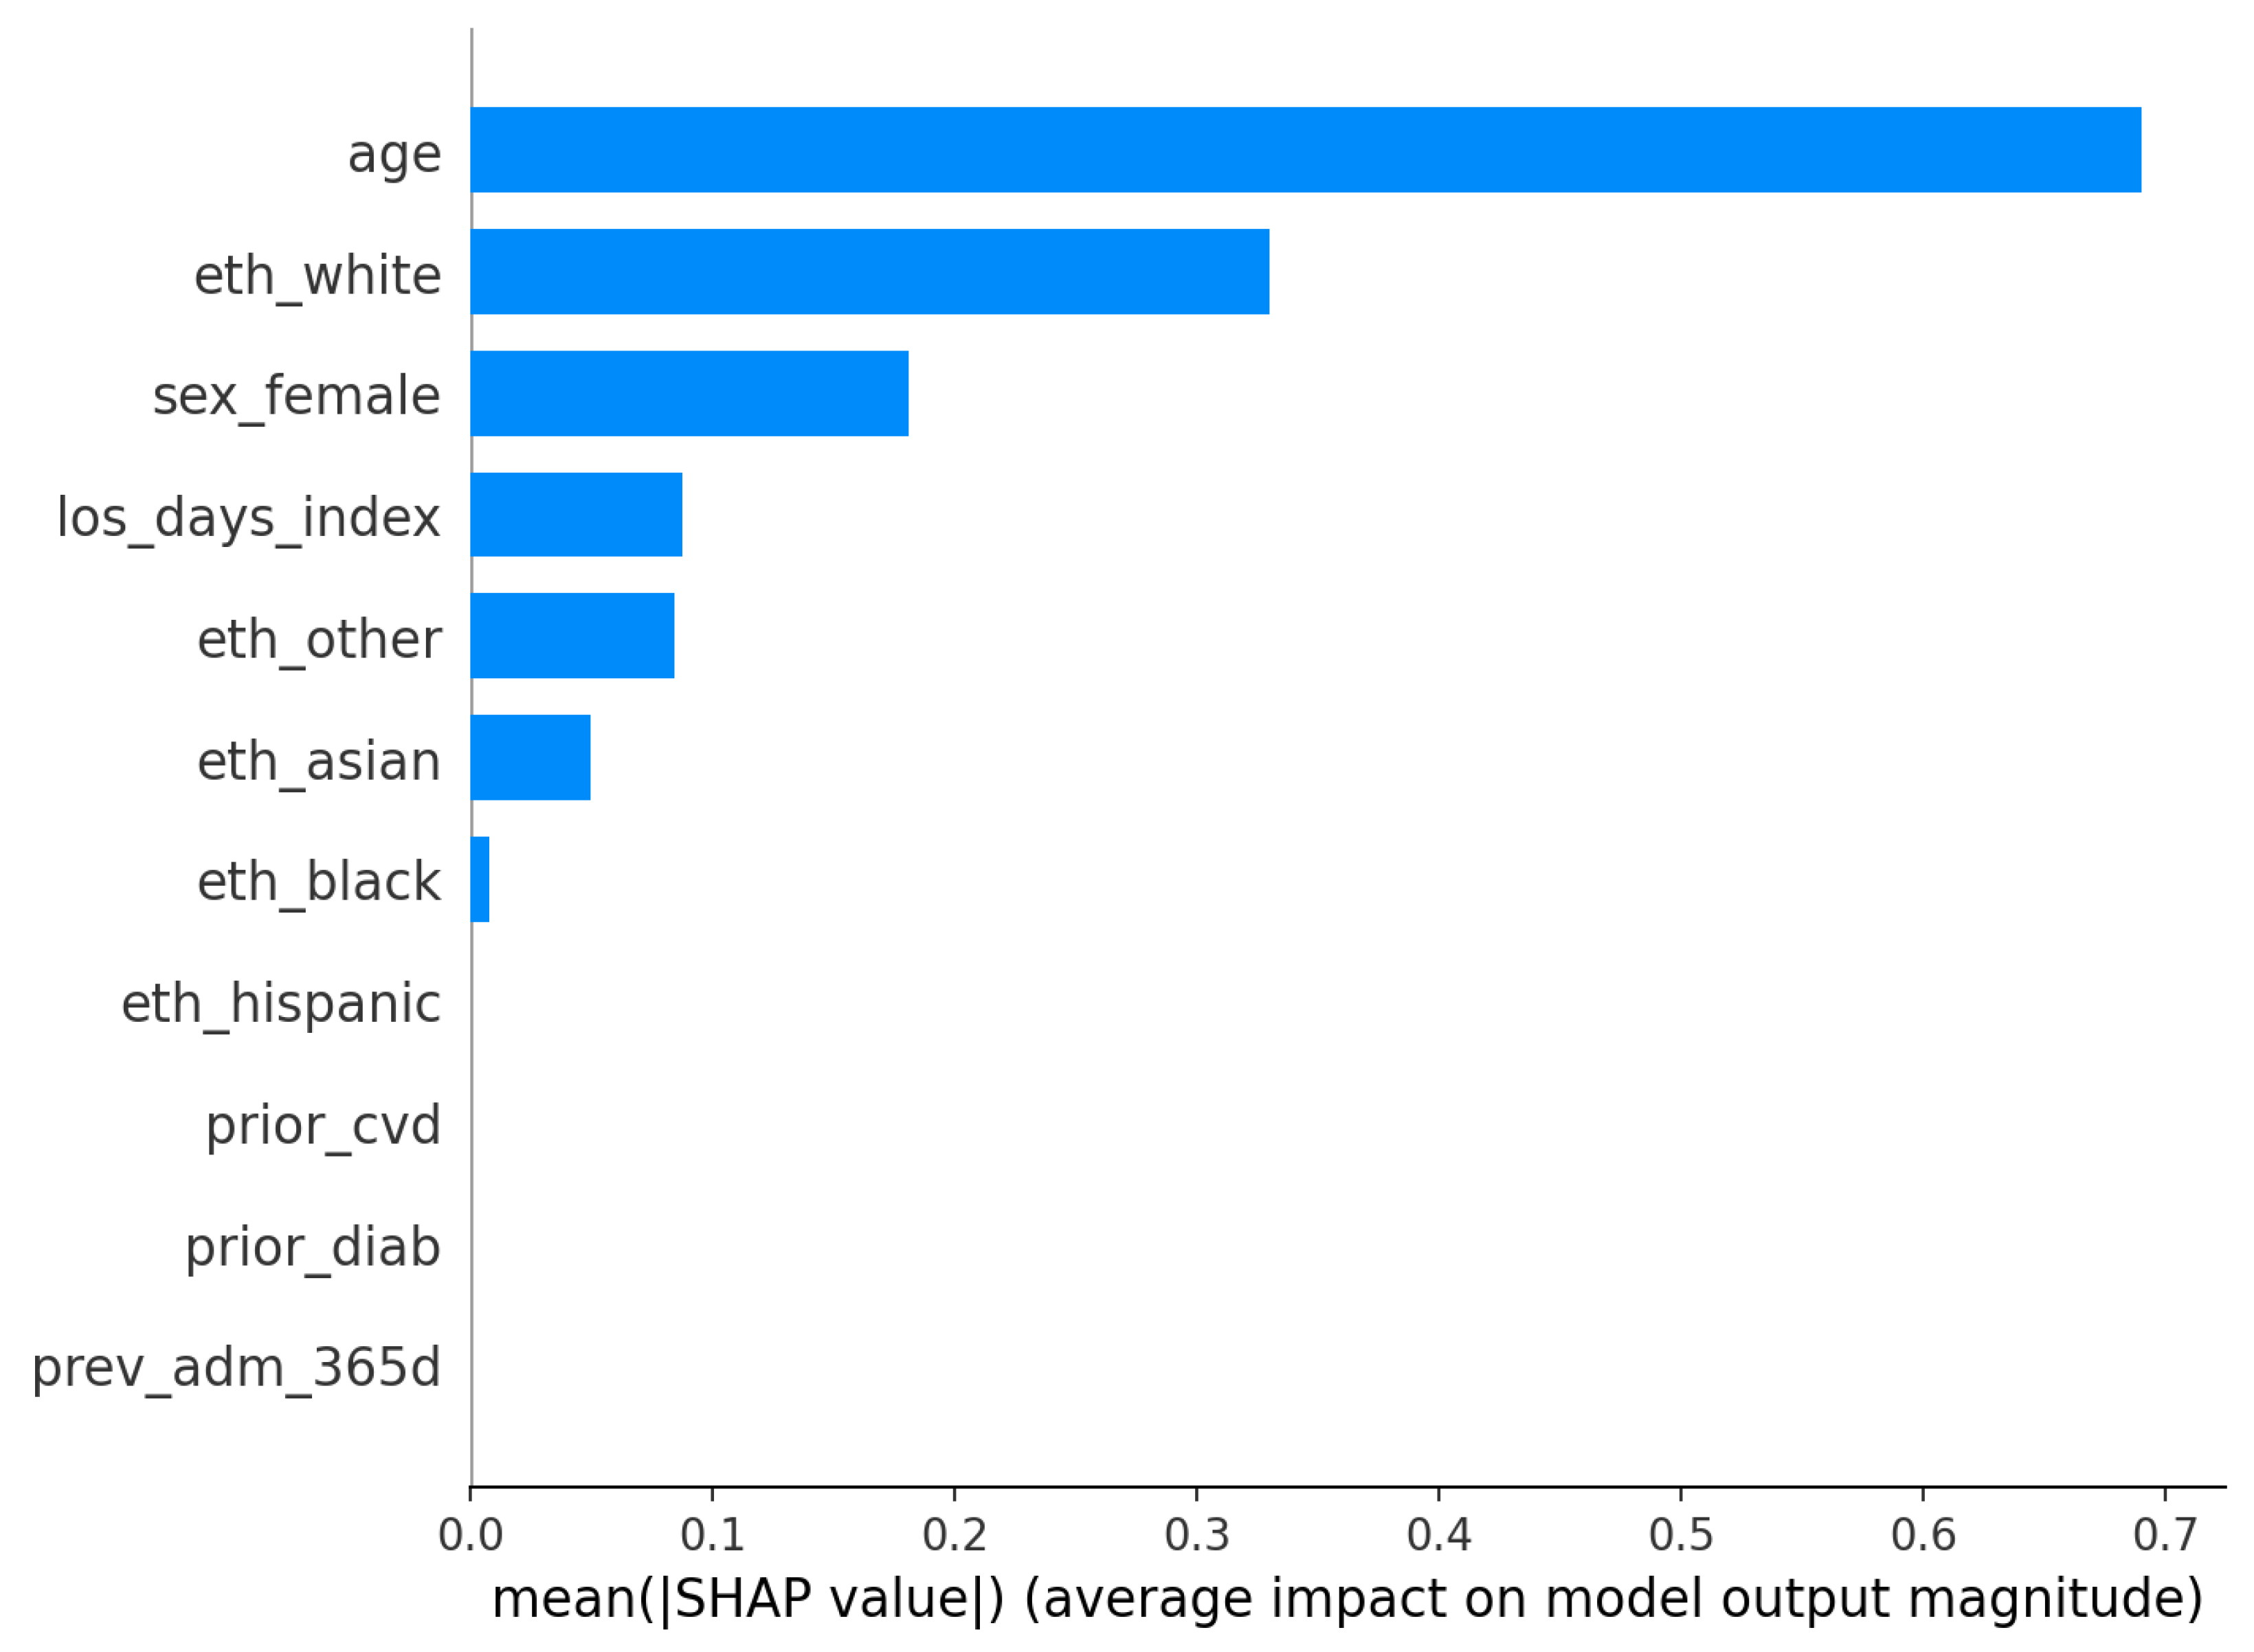
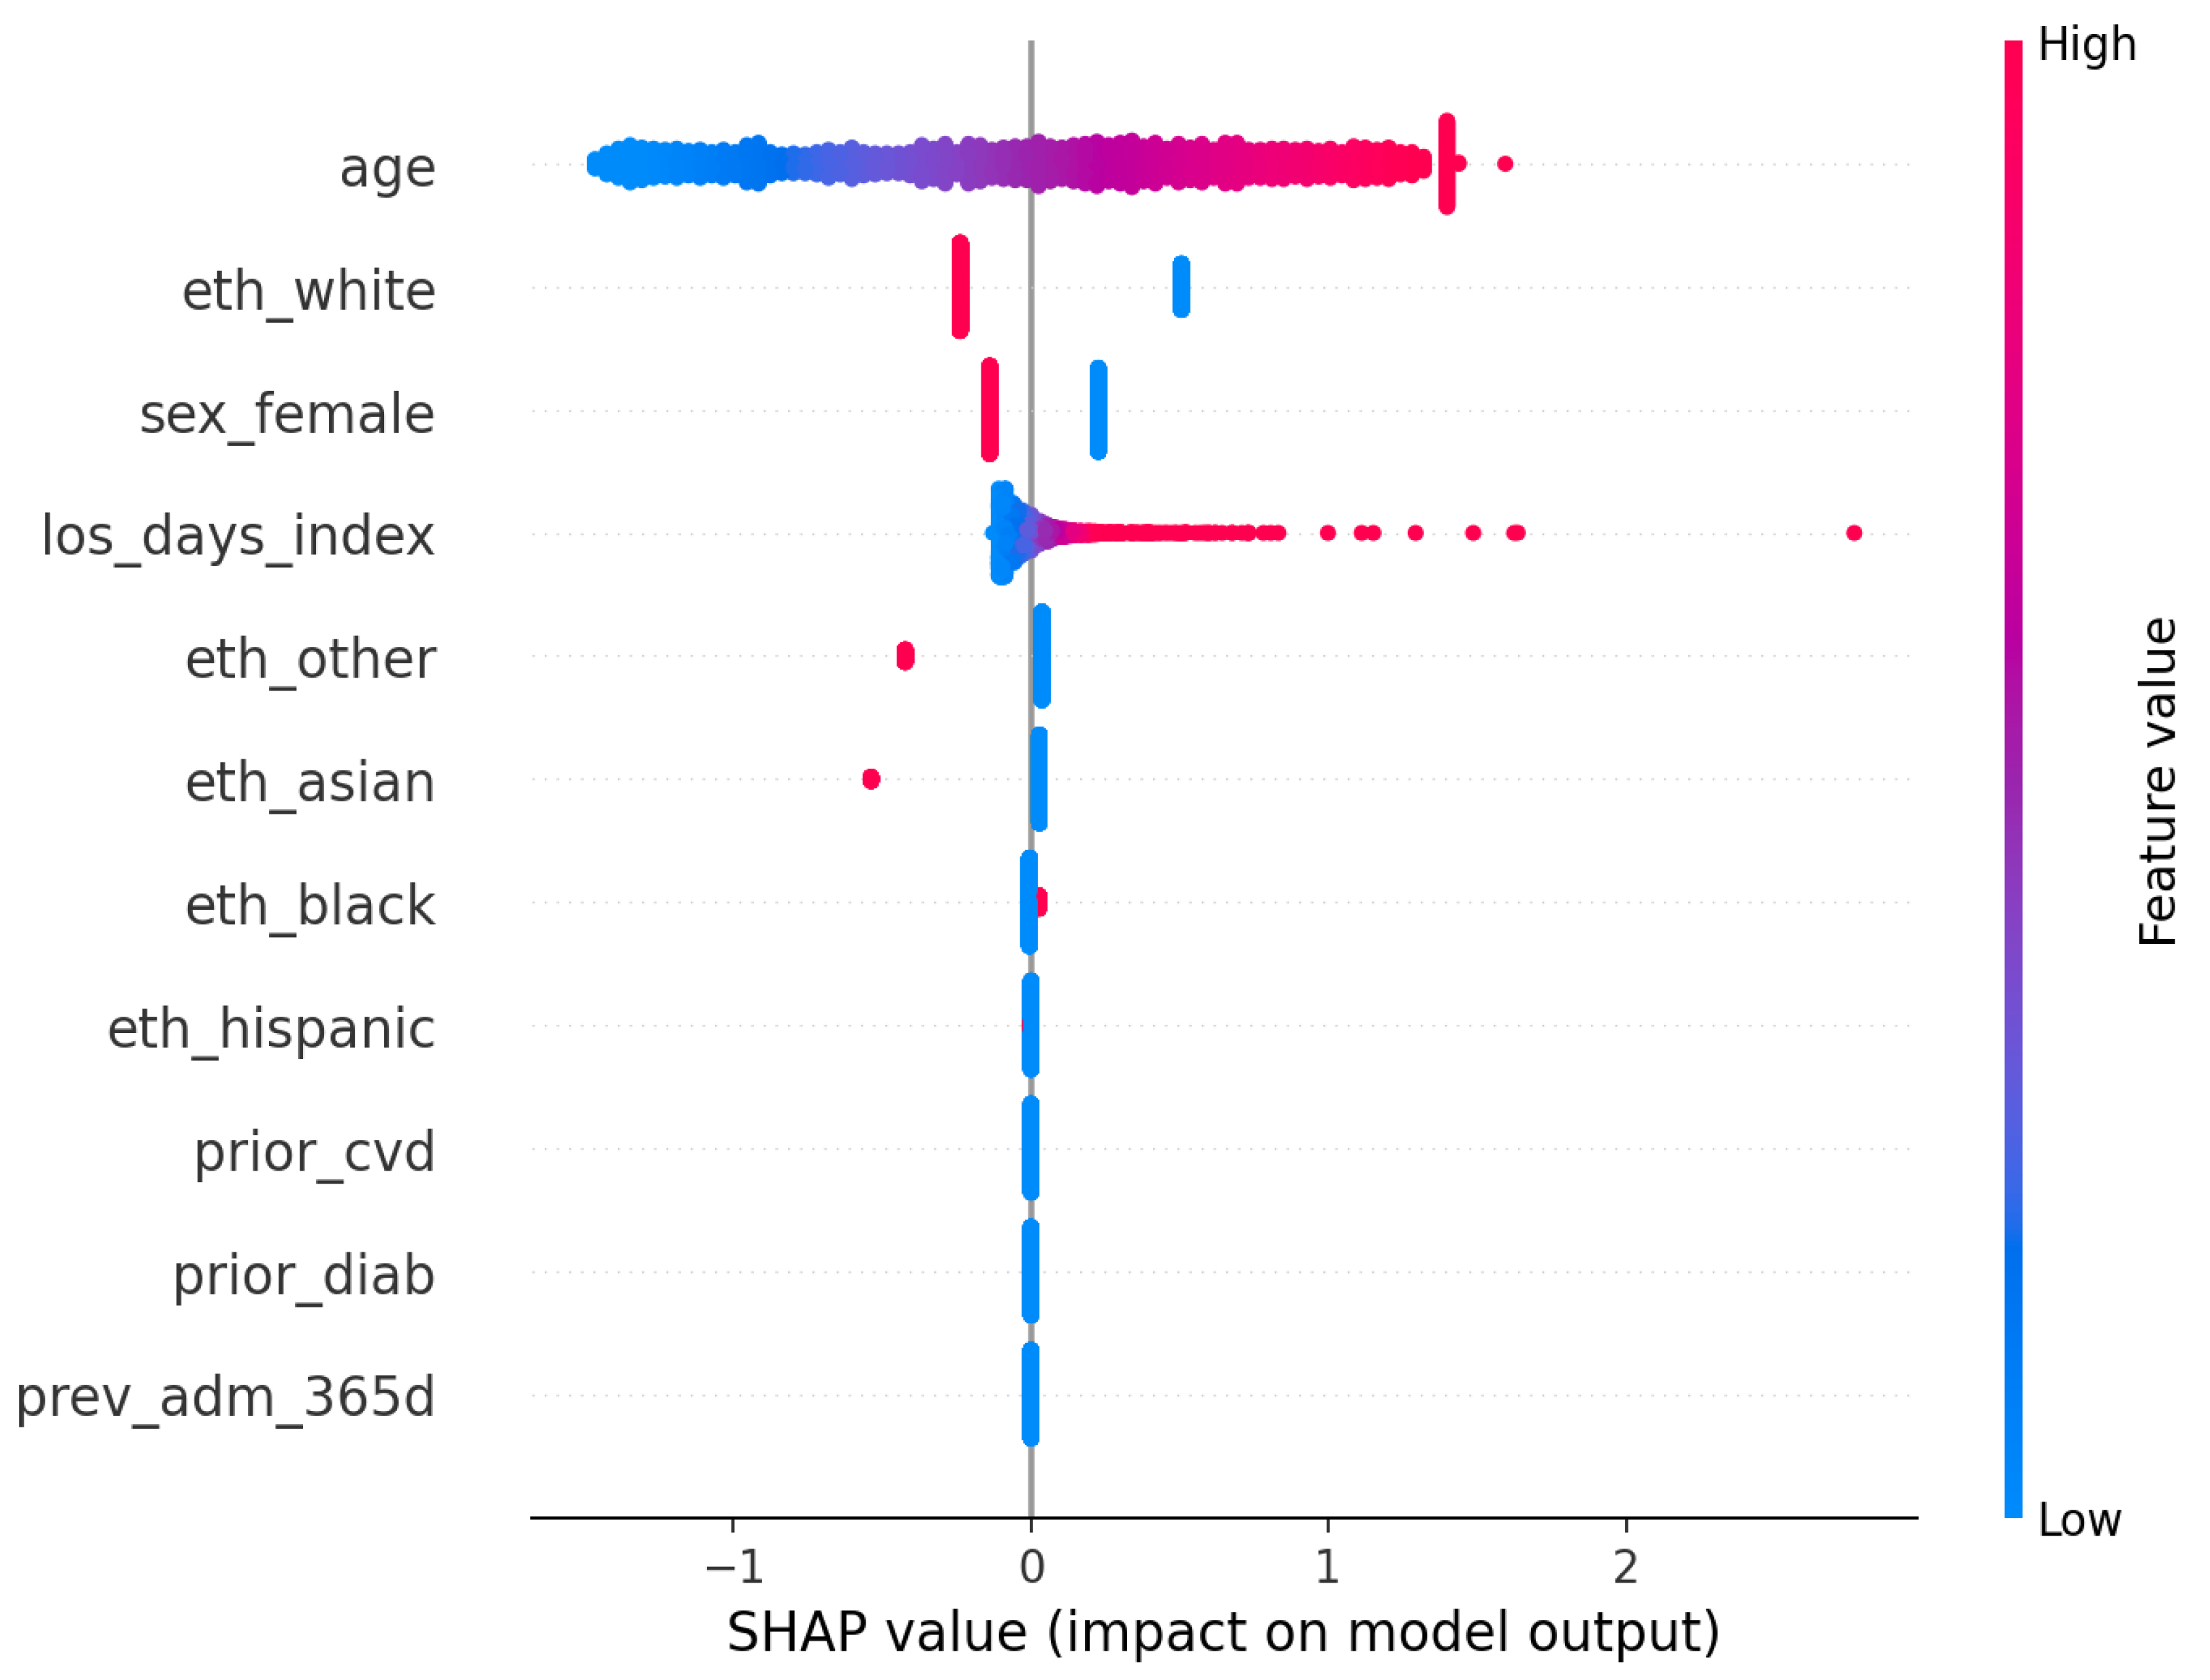
Figure 8); model-agnostic explainability for the logistic model is shown via SHAP bar and summary plots (
Figure 9 and
Figure 10).
3.4. Pipeline Overview
Raw
CSV extracts are converted to Parquet; timestamps define index admissions. A patient-level cohort is assembled and labels for
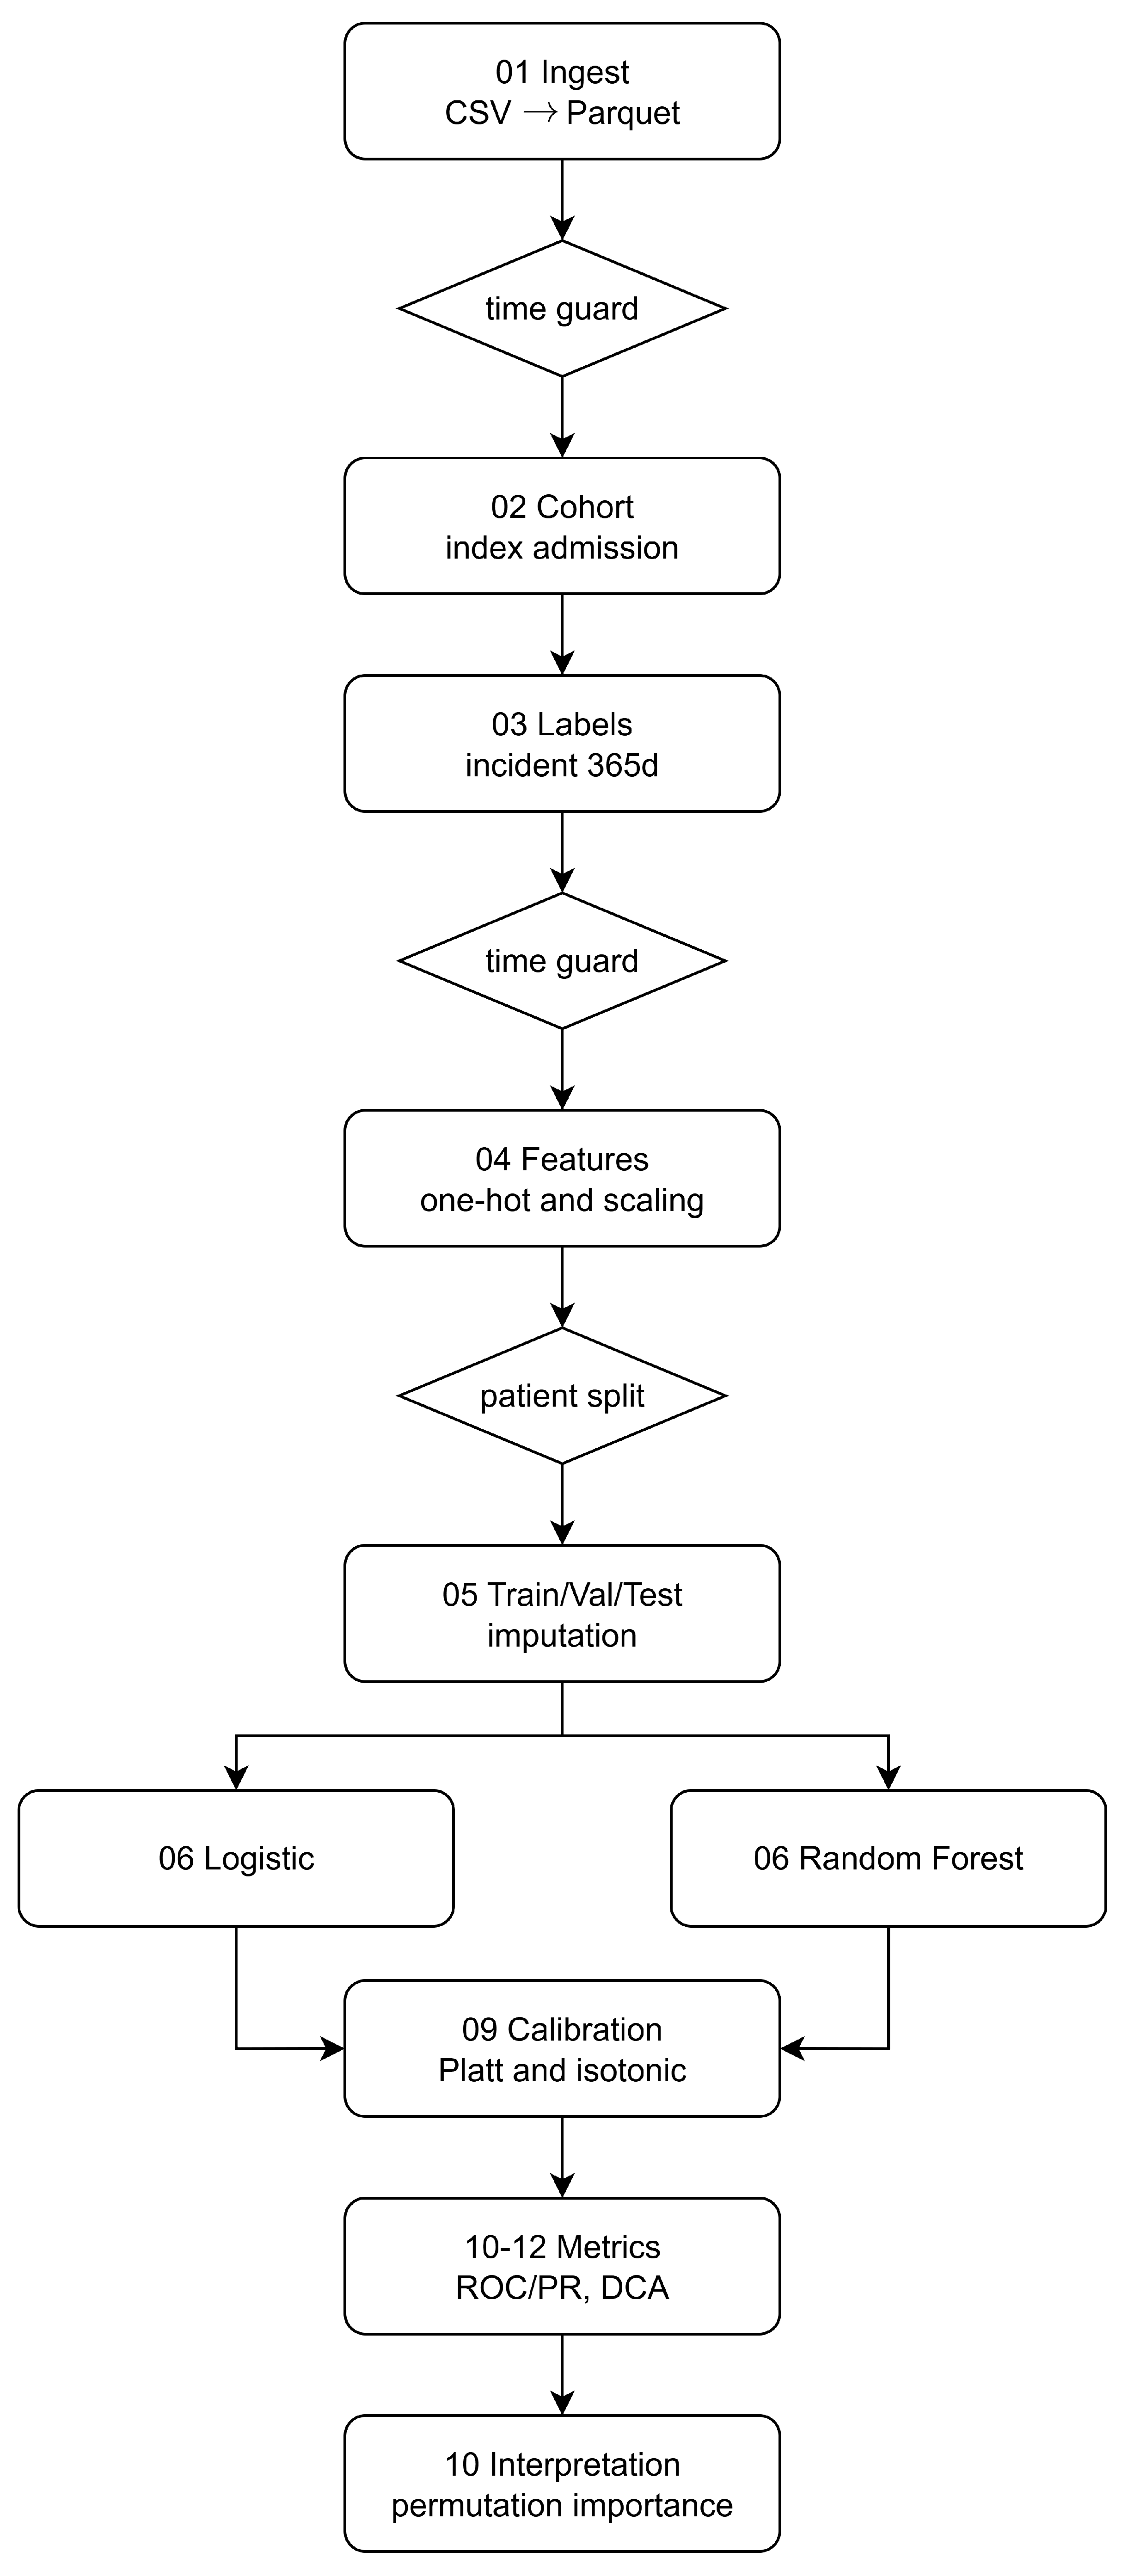
diab_incident_365d are generated with a look-ahead window, enforcing temporal guards at cohorting and feature extraction so that only pre-index information enters the design matrix. Features are imputed and (for LR only) standardized; the dataset is split into disjoint train/val/test partitions at the patient level. Models are tuned via inner CV on training only, calibrated on validation, and evaluated on the untouched test set via ROC/PR, decision curves, and reliability diagrams. Model reliance combines permutation importance (both models) and SHAP (LR) on validation samples. The pipeline overview is denoted by
Figure 11.
This is a single-center retrospective analysis; we therefore emphasize calibration quality and decision utility alongside discrimination and provide a deployment-oriented baseline under strict leakage control. External validation and richer temporal representations are left to future work (
Section 6).
4. Discussion
Taken together, the figures provide a consistent view across discrimination, calibration, clinical utility, and model reliance under a leakage-safe pipeline with tuned baselines. After inner cross-validation on training data and post hoc calibration on validation, the calibrated logistic regression dominates the calibrated random forest on the held-out test set in both ROC and precision–recall space (
Figure 1 and
Figure 2). In an imbalanced endpoint such as incident diabetes at one year, the precision–recall overlay is especially informative and shows a persistent precision advantage for logistic regression over most recall levels.
Calibration materially improves probability quality. Before calibration, the logistic model exhibits overconfidence at higher bins on validation (
Figure 4). Applying the selected mapping to test increases alignment with the identity line (
Figure 5). The calibrated random forest also improves, but its predicted probabilities are concentrated in a narrower range (
Figure 6), limiting granularity for downstream risk stratification. Because clinical workflows consume probabilities rather than ranks, these gains are consequential for thresholding and risk communication.
Decision-curve analysis integrates discrimination, prevalence, and threshold choice into net benefit as a function of the decision threshold. The per-model curves show that calibrated logistic regression achieves consistently higher net benefit across most clinically plausible thresholds, while calibrated random forest remains positive but generally lower.
Model understanding is concordant across permutation importance and SHAP for the logistic model. Age is the dominant predictor in both views, with additional reliance on index length of stay and selected demographic covariates (
Figure 7,
Figure 8,
Figure 9 and
Figure 10). The SHAP summary shows a monotone, clinically sensible pattern whereby higher age pushes risk upward, while other variables exert smaller, sometimes bidirectional, effects. These are statements of model reliance rather than causal claims, but they furnish an auditable trail to accompany performance and calibration diagnostics.
Several aspects delimit current utility and suggest improvements. The precalibration reliability for logistic regression departs from the identity line at higher probabilities (
Figure 4), illustrating why uncalibrated scores should not be operationalized. Postcalibration, random-forest probabilities remain compressed (
Figure 6), which hampers nuanced prioritization even when discrimination is acceptable. Net-benefit magnitudes are small (
Figure 3).
With tuned baselines, strict leakage control, and explicit calibration and decision analysis, a compact calibrated logistic model already delivers stable, threshold-aware utility on MIMIC-IV. The modest absolute gains and residual calibration limitations set the agenda for external and temporal validation, longitudinal feature enrichment, and stronger calibrated baselines (e.g., gradient-boosted trees), rather than undermining the value of a deployable, auditable reference.
4.1. Interpreting Net Benefit in Practice
Net benefit
, plotted against the decision threshold
t, quantifies benefit-adjusted true positives per patient. A value
means that, at threshold
t, the model yields the equivalent of
additional true positives per 100 patients, after accounting for the relative harm of false positives implied by
t. The threshold encodes the risk–benefit trade-off via
so, for example,
corresponds to judging a false alarm as one-quarter as harmful as a missed case. Two operational translations are useful: “benefit-adjusted TPs per 100” equals
; and the net reduction in unnecessary interventions per 100 patients versus a treat-all policy is
In
Table 1, these quantities illustrate how calibrated models can deliver positive benefit at thresholds where a treat-all approach is counterproductive.
4.2. Implementation and Generalization in Clinical Settings
The workflow is designed to translate into a clinical decision support (CDS) service with minimal changes. On the data side, the same temporal guards and patient-level partitioning used in the study become pre-ingestion rules enforced in the hospital’s data platform: only events with timestamps at or before the current admission time are admitted to the feature builder, and the feature map is frozen and versioned to ensure parity with the validated model. Integration with the electronic health record can be achieved via standard interfaces (e.g., FHIR resources for demographics, encounters, observations, medications) and a lightweight inference endpoint that accepts a patient identifier and returns a calibrated probability along with the model version and a timestamp. Because downstream decisions consume probabilities, the calibrator selected on internal validation is exported and attached to the model so that the deployment returns calibrated risks rather than raw scores.
Generalization to new clinical settings follows a site-adaptation protocol that preserves the leakage-safe design while accommodating local prevalence and coding differences. The receiving site first reproduces the cohort and feature map from the site’s own tables and code systems, runs the trained model in “shadow mode” for a short prospective window, and evaluates discrimination, reliability, and net benefit against local labels without exposing outputs to clinicians. If reliability drifts, a lightweight recalibration step is performed on a site-specific validation split, leaving the core model weights unchanged; this preserves interpretability while aligning probabilities to local outcome frequencies. Thresholds are then selected using local decision-curve analysis to reflect resource constraints and clinical policy, and only after this prospective silent period and documentation of performance are alerts turned on.
Operationally, the service is instrumented for continuous monitoring of data drift, calibration drift, and outcome prevalence. The same reliability diagrams, Brier score, ROC–PR overlays, and decision curves used in the study are computed on a rolling window and logged alongside model and calibrator version identifiers. Any material change triggers a scheduled recalibration or a formal review. Governance artifacts—data cards for the cohort and feature space, model cards that report discrimination, calibration, decision-curve ranges, and limitations, and an audit log of versions and thresholds—are kept under change control to support clinical risk management. Clinician-facing displays present the calibrated probability with a short, plain-language explanation, a small set of global reliance cues (e.g., the top permutation-importance features), and links to guidance on follow-up actions defined by the local service line.
To contextualize our discrimination results on
MIMIC-IV, we contrast them with recent EHR-based diabetes-risk studies. On our held-out test set, calibrated logistic regression achieved
and
at a prevalence of
. In a primary-care EHR cohort (age
years) using 53 routinely collected variables, Stiglic et al. reported incident T2D prediction with
(external validations varying by site and covariate set) [
7]. Early EHR prediction efforts for gestational diabetes (a distinct endpoint but informative for EHR screening difficulty) also commonly fall in the
band [
8]. While AUPRC is not directly comparable across studies due to varying prevalence [
9], our
at
is consistent with reports in adult EHR settings where prevalence typically ranges
. Taken together, these references situate our calibrated baselines within the expected range for compact, admission–time feature sets, and reinforce the need to couple discrimination with calibration and decision-analytic evaluation [
9,
10].
5. Related Work
Manco et al. [
11] introduce HEALER, a zone-based healthcare data-lake architecture (Transient Landing, Raw, Process, Refined, Consumption) implemented with Apache NiFi for ingestion and HDFS for storage, plus Python 3.13.5 components for waveform processing and NLP. A proof-of-concept on MIMIC-III demonstrates increasing ingestion throughput with larger batch sizes, identifies the processing layer as the bottleneck, and argues for governance/security layers and streaming ingestion as future work—highlighting the operational, pipeline-centric nature rather than modeling advances.
Prior studies often frame comorbidity prediction through multitask learning (
MTL), where shared representations are learned across related targets. Benchmark work on clinical time series demonstrated consistent, albeit modest, gains for
MTL over single-task models under standardised tasks and data from a single health system [
12]. While such results motivate cross-task sharing, they less frequently emphasize probability calibration, leakage control at the patient level, and threshold-dependent decision utility—factors that are central when predictions are consumed as probabilities in clinical workflows.
A complementary line of research focuses on deployment-oriented, tightly scoped pipelines that favor transparent models, explicit leakage guards, and task-appropriate evaluation. For example, data-driven diagnostic support for pediatric appendicitis demonstrates how careful variable curation, interpretable modeling, and clinically salient metrics can reduce misdiagnoses and unnecessary procedures in a real decision context [
13]. In parallel, systems-engineering studies of healthcare analytics characterize big-data workflows and performance using multiformalism to guide capacity planning and reliable operation of end-to-end pipelines [
14]. These perspectives underscore that success in practice hinges not only on raw discrimination but also on stability, calibration, and operational fit.
Beyond modeling architectures, several strands explicitly address reporting quality, calibration, decision-analytic evaluation, and design considerations for thresholded use. Collins et al. [
15] outline
TRIPOD-AI and
PROBAST-AI, emphasizing transparent reporting and risk-of-bias assessment tailored to AI-based prediction models; this foregrounds calibration, data leakage prevention, and intended use. Van Calster et al. [
16] argue that miscalibration is the “Achilles’ heel” of predictive analytics, recommending routine assessment and correction, and cautioning against relying on discrimination alone. Vickers and Elkin [
3] formalize decision curve analysis (
DCA), which compares net benefit across thresholds against treat-all and treat-none policies, aligning model evaluation with clinical trade-offs rather than single operating points. Whittle et al. [
17] extend sample-size calculations for threshold-based evaluation, showing how planned operating thresholds and prevalence shape the precision of performance estimates and decision metrics.
Riley et al. [
9] discuss a tutorial that bridges the gap between conventional model performance reporting and actual clinical usefulness. Specifically, it stresses that discrimination alone is insufficient and places calibration, decision thresholds, and net benefit at the center of evaluation. The paper provides practical guidance on reading reliability plots, decomposing performance, and linking metrics to decisions, which directly motivates our use of calibrated probabilities, reliability diagrams, and decision-curve analysis in
Section 3.
Vickers et al. [
10] formalize net benefit and its inference, showing how to quantify clinical utility with confidence intervals and hypothesis tests. They clarify the interpretation of thresholds as harm–benefit trade-offs and how to compare models against treat-all/none strategies. This supports our threshold-wise reporting, the interpretation of net benefit magnitudes, and the recommendation to select operating points via decision curves rather than a single fixed cutoff.
Moreover, Corbin et al. [
18] present a pragmatic framework for taking ML models from development to production in healthcare, covering integration, versioning, monitoring, and drift management. The emphasis on transparent artifacts, shadow deployment, calibration checks, and governance aligns with our deployment-oriented discussion: exporting the chosen calibrator with the model, monitoring calibration and prevalence over time, and performing lightweight site-specific recalibration prior to activation.
As per
Table 2, this paper positions itself at that deployment-oriented intersection. We construct a leakage-safe, patient-level pipeline on
MIMIC-IV hospital data; we train two single-task baselines (logistic regression and random forest) for incident diabetes at 365 days; we calibrate probabilities post hoc (Platt and isotonic) and evaluate with
ROC/
PR curves, reliability diagrams, and decision-curve analysis; and we summarize model reliance with permutation importance and
SHAP for the calibrated baselines. In doing so, the work shows that, under strict temporal and subject-level guards with calibration and decision-analytic reporting, a compact calibrated baseline can offer competitive performance and clearer operational traceability on a widely used critical-care dataset. Relative to prior literature, our contribution is methodological and reporting-centric: we assemble an end-to-end, reproducible workflow that surfaces discrimination, calibration, decision utility, and model reliance in a single dossier suitable for clinical review, aligning explicitly with contemporary guidance on reporting, calibration, and threshold-based evaluation [
3,
15,
16,
17].
It should be noticed that, prior MTL studies underscore the potential of shared representation learning across related clinical tasks but often underreport calibration and threshold-dependent clinical utility. Our findings complement that literature by demonstrating that a calibrated, transparent baseline—with explicit decision-analytic reporting—can provide a strong, readily deployable reference. By tying the pipeline to emerging reporting guidance and decision-focused evaluation, we offer a pragmatic template for external validation and, where justified by incremental utility, the integration of more expressive models.
6. Conclusions and Future Work
This study delivers a leakage-safe, calibration-first pipeline for incident diabetes prediction on MIMIC-IV, with strict temporal and patient-level guards, model-specific preprocessing, tuned baselines, and post hoc calibration.
For RQ1 (which calibrated baseline discriminates best), the tuned and calibrated logistic regression consistently exceeded the tuned and calibrated random forest on the held-out test set. Calibrated ROC and PR overlays indicate higher AUROC/AUPRC for logistic regression across operating regions (
Figure 1 and
Figure 2), suggesting that in this admission–time, tabular setting, a compact linear model is a strong and parsimonious choice relative to a deeper ensemble.
For RQ2 (does calibration improve probability quality and translate to decision utility), reliability diagrams show that post hoc calibration materially improves probability accuracy. The logistic model aligns more closely with the identity line from validation (uncalibrated) to test (calibrated) (
Figure 4 and
Figure 5); the calibrated random forest improves as well, albeit with compressed probability ranges (
Figure 6). Decision-curve analysis shows modest but non-negative net benefit across clinically plausible thresholds, with calibrated logistic regression dominating random forest over most of the range. These findings support calibrated, threshold-aware deployment when probabilities are consumed for triage.
For RQ3 (which predictors most influence risk and are they clinically coherent), explanations are concordant with established risk profiles. SHAP summaries for logistic regression and permutation importance for both models highlight
age as the dominant contributor, with additional reliance on index length of stay, sex, and ethnicity indicators (
Figure 7,
Figure 8,
Figure 9 and
Figure 10). These are associative statements of model reliance rather than causal effects, but they provide transparent context to accompany discrimination, calibration, and decision utility.
The contribution is implementation and reproducibility rather than methodological innovation: we consolidate best practices—leakage control, calibration, decision curves, and transparent reliance summaries—into a single, documented workflow that returns calibrated probabilities ready for thresholded use in clinical decision support. All artifacts necessary for clinical review and governance (metrics, reliability, decision curves, model/explainer versions, and data/model cards) are surfaced to enable auditing, monitoring, and safe integration.
Limitations include single-center retrospective data, no external or temporal validation in this release, absence of groupwise fairness analyses, and limited longitudinal features. Future work will (i) perform multi-site external and temporal validation with lightweight recalibration; (ii) report groupwise discrimination, calibration, and net benefit; (iii) enrich features with longitudinal trajectories while preserving leakage guards; (iv) use benchmark calibrated, still interpretable reference learners (e.g., gradient-boosted trees) under the same selection and calibration protocol. These steps aim to strengthen transportability and clinical usefulness while retaining the transparency required for adoption.
