Article

A Lightweight Traffic Signal Video Stream Detection Model Based on Depth-Wise Separable Convolution

1
Guangling College, Yangzhou University, Yangzhou 225012, China
2
College of Information and Artificial Intelligence (College of Industrial Software), Yangzhou University, Yangzhou 225012, China
*
Author to whom correspondence should be addressed.
Electronics 2025, 14(22), 4396; https://doi.org/10.3390/electronics14224396
Submission received: 11 October 2025 / Revised: 2 November 2025 / Accepted: 7 November 2025 / Published: 12 November 2025
(This article belongs to the Section Artificial Intelligence)

Abstract

With the rapid development of Intelligent Traffic Systems (ITS), traffic signal detection has become a hot research issue in various countries. In order to address the challenges of high parameter count, high power consumption, and deployment difficulties on edge devices for the MCA (Multidimensional Collaborative Attention)-YOLOv5-ACON (Activate or Not) model, a lightweight traffic signal video stream detection model based on depth-wise separable convolutions (DSC) was proposed. First, an enhanced MCA-YOLOv5-ACON was elucidated. Then, the backbone network in this model was substituted with MobileNetv3, and ordinary convolutions were replaced with DSC in the PANet section, with a view to achieving further compression. Finally, a comprehensive signal fault determination logic was devised with the objective of identifying common fault types. Results showed that the optimized MobileNetv3-MCA-YOLOv5 model occupied only 19.37% of the original memory usage, with an mAP of 93.57%. While the mAP decreased slightly, Precision increased from 98.15% to 98.53%, and the video streaming detection speed improved from 25.20 fps to 33.34 fps. The improved lightweight model balances high precision and real-time performance, making it more suitable for deployment on edge devices.

1. Introduction

1.1. Background

The intelligent transportation sector is growing in line with the development of smart cities in the context of artificial intelligence [1]. traffic signals represent a fundamental component of intelligent dynamic traffic management systems in urban environments [2]. The monitoring and troubleshooting of these malfunctions are of crucial importance in the context of managing intersection congestion and reducing accident rates within the framework of smart city management. Traffic signal failures have been characterized by randomness and diversity. The necessity of prompt troubleshooting is critical in order to alleviate traffic congestion at intersections [3]. The system for identifying faults is based on the detection of video streams, utilizing techniques for object detection that are based on deep learning. The utilization of technologies such as cloud platforms, the Internet of Things (IoT), and big data facilitates the provision of comprehensive and accurate information-based decision support for transportation authorities, thereby concomitantly reducing labor costs [4]. The system has the capacity to monitor the operational status of traffic signal equipment in real time, accurately identify fault types, and improve maintenance efficiency. The rapid advancement of intelligent transportation has resulted in a substantial increase in the volume of real-time traffic video data. Edge computing, a computing paradigm that has seen significant uptake in the IoT domain, is emerging as a novel computing paradigm across multiple sectors, including smart transportation. Lightweight models have been shown to be capable of operating efficiently within constrained computational resources, thereby effectively meeting the real-time demands of intelligent transportation systems [5].

1.2. Related Works

As more sophisticated Convolutional Neural Networks (CNN) emerge, the model’s capacity for generalization is enhanced. However, this enhancement is accompanied by a decline in learning efficiency and inference speed, attributable to an augmented memory footprint. Consequently, there has been an escalating interest in the design and optimization of lightweight network structures to achieve a balance between model complexity and performance [6].
In the late 1980s, LeCun et al. [7] initiated research into the compression of CNN models, proposing the OBD (Optimal Brain Damage) algorithm. The purpose of this algorithm was to evaluate the importance of parameters and subsequently remove secondary parameters from the model. Consequently, a growing number of experts and scholars have initiated research to reduce the computational complexity of models. The development of compact network architectures such as SqueezeNet [8] and CondenseNet [9] has enabled the creation of new networks at three distinct levels: convolutional kernels, specialized layers and overall network structure. It is evident that pruning, quantization, matrix decomposition and model reconstruction have become prevalent methodologies.
Pruning is a process that can be used to achieve model sparsification. This is achieved by setting redundant parameters to zero, thereby reducing the model size. Quantization, conversely, involves the compression of the model through the replacement of full-precision values in CNNs with lower-precision numbers. W. Wang et al. [10] presented a similarity filter pruning method based on locally linear embedding. Pruning method pruned the operation model mainly by evaluating the similarity of each layer in the network layer filters. Experimental results revealed that, without significantly sacrificing model accuracy, the pruning ratio achieved by this method is only 70%. Y. Zhang et al. [11] introduced RDLNet (RepViT backbone with a DBB-Gelan-based Neck (DGNeck) and Layer-Adaptive Magnitude-based Pruning (LAMP) Network), a lightweight traffic detection framework that synergistically integrated adaptive channel pruning and multi-scale feature refinement. Experimental results showed that the synergistic combination of RepViT, DG-Neck, and LAMP outperforms isolated or partial implementations, highlighting the importance of unified architectural and pruning optimization. Compression methods based on matrix decomposition primarily involve decomposing parameter matrices and convolution kernels, ultimately replacing them with low-rank approximations such as Singular Value Decomposition (SVD). F. Wu et al. [12] proposed a singular value decomposition-based fast mechanism to mitigate adversarial examples in the physical world, especially in the field of automatic drive. Experimental results clearly indicated that the processed images by defense model can effectively eliminate perturbation for the adversarial attack on signpost. Meanwhile, the combine method of SVD+5G will greatly increase the cost of the adversary. However, although these compression methods can produce lightweight models that are suitable for deployment on edge devices, the compressed models often have significantly lower accuracy than the original models.
The process of model reconstruction entails the direct modification of the structural design of neural networks, with the objective of generating lightweight models that are optimized for utilization on mobile devices. This approach results in a reduction in the number of parameters and the computational complexity of the original architectural design. W. Wei et al. [13] employed a feature extraction module constructed using deep separable convolutions and a reverse residual structure. Then introduced a squeezing and excitation block (SE Block) to enhance focus on key features and accurately capture the core information of traffic sign images. Ultimately, the model achieved an accuracy rate of 99.85% on the German Traffic Sign Recognition Benchmark Database (GTSRB). L. Zhang et al. [14] constructed a feature extraction module comprising multi-class convolutional units. They also designed a small object detection module and detection head to extract and detect shallow-level features. Furthermore, they introduced an efficient multi-scale attention mechanism to adjust channel weights. This mechanism aggregates the output features from three parallel branches interactively. Experimental results demonstrated that the model reduces parameters by 9.06 million. While maintaining real-time performance, the model achieves an mAp of 96.8% on the Tsinghua-Tencent 100k annotated dataset and an mAp of 99.4% on the Changsha University of Science and Technology Chinese Traffic Sign Detection Benchmark Dataset. K. Cai et al. [15] improved the backbone network’s ability to extract features for small objects by using an enhanced Bot3 convolutional module. Then introduced GhostConv to obtain redundant feature maps at a low computational cost, thereby improving model efficiency further. Tests on the Tsinghua-Tencent 100K (TT100K) dataset demonstrated that, compared to the original YOLOv5s model, mAP50 improves by 8.7%, the number of parameters decreases by 22.5%, and computational complexity reduces by 17.2%. L. Cao et al. [16] used a lightweight GhostNet backbone network based on YOLOv5s to reduce model parameters and size. Studies using the CCTSDB (Chinese City Traffic Sign Detection Benchmark) 2021 dataset showed that, despite a 16.5% reduction in parameters and a 16.5% decrease in model size, as well as a 7% increase in frame rate, the detection accuracy only declined by 2.1% compared to the original YOLOv5s model.
In contemporary times, characterized by the escalating demand for edge deployment in the field of object recognition, a plethora of lightweight algorithms have come to the fore. C.-Y. Wang et al. [17] proposed a new architecture of realtime object detector and the corresponding model scaling method. This approach subsequently became known as the YOLOv7-tiny algorithm which use the trainable bag-of-freebies method to enhance the accuracy of object detection. G. Yu et al. [18] created a new family of real-time object detectors, named PP-PicoDet. Experimental results showed that the proposed series of lightweight object detectors had superior performance on object detection for mobile devices. Y. Liu et al. [19] introduced a new method for improving vehicle flow detection and tracking based on YOLOv8n which exhibits strong efficacy in accuracy and ease of deployment. However, it is important to acknowledge the potential limitations of contemporary lightweight models such as YOLOv7-tiny, YOLOv8n and PP-PicoDet. While these models demonstrate capabilities in terms of volume and computational complexity, it should be noted that these advantages are often accompanied by a concomitant reduction in mean accuracy [20,21].
To better balance model accuracy and compression effectiveness. This paper adopted the lightweight DSC approach and used the MobileNet3 architecture to improve video stream detection models.

1.3. Contribution

In order to address these challenges, this research illustrates a lightweight traffic signal video stream detection algorithm called the MobileNetv3-MCA-YOLOv5 model. The main contribution of this paper can be summarized as follows:
(1) Making a dataset more suited to the local transport environment.
(2) Proposing a lightweight model called MobileNetv3-MCA-YOLOv5.
(3) Testing the performance of this algorithm through comparative experiments.

1.4. Organization

The rest of this paper is organized as follows: Section 2 presents the lightweight traffic signal video stream detection algorithm based on YOLOv5. Section 3 introduces the experimental validation and results analysis. Section 4 concludes the proposed research work and identifies future research directions.

2. Proposed Methods

2.1. MCA-YOLOv5-ACON Model

YOLO (You Only Look Once), a widely used algorithm for target detection and recognition, has evolved since its introduction in 2018. There are now versions ranging from YOLOv3 to YOLOv8. Although YOLOv8 has a faster inference speed than YOLOv5, YOLOv5 has achieved the highest overall accuracy in target detection and is still widely used for traffic signal detection [22].
In conditions of complexity pertaining to meteorological phenomena and congestion, the efficacy of YOLOv5 may be diminished. Consequently, this paper proposed an enhancement to the YOLOv5 model. In consideration of the model’s color recognition accuracy and the dimensions of its parameters, the YOLOv5l model was selected as the foundation for the experimental study.
Firstly, the MCA attention module [23] was integrated into the PANet network with the objective of enhancing the model’s capacity to extract salient information from images and minimize the loss of significant features.
Consequently, the convolution with a null rate of two was embedded into the output position of the 160 × 160 × 128 feature map in the backbone network to complete information fusion with the 80 × 80 × 256 feature output layer. This enhancement in performance led to an improvement in the extraction of information by the original network. The Meta ACON-C activation function was also employed to substitute a proportion of the SiLU function in the convolutional block of the backbone network, thereby enhancing network performance. The Meta ACON-C activation function represented an enhancement of the ACON (Activate or Not) [24] family of activation functions. The formula is shown in (1).
β c = δ W 1 W 2 w = 1 W x c , w
where β c is the value of the adaptive function for the input sample data channel, δ · is the Sigmoid activation function, c and w are the sample sizes, and W 1 R C × C / r , W 2 R C / r × C , and r are the scaling factors.
As illustrated in Figure 1, the enhanced MCA-YOLOv5-ACON model exhibits a distinct structural configuration. The input image at the Input side is data augmented into the CSPDarknet network as the Backbone of the model. The MCA attention module is embedded in the Path Aggregation Network (PANet) enhanced feature extraction network to serve as the neck of the model. The YOLOv5 convolutional module represents the initial component of the system responsible for feature extraction from images derived from any traffic signal video stream. The MCA mechanism is then able to identify the position and color of traffic signals within the image by assigning weights to its key features, thereby ultimately producing the desired result.

2.2. MobileNetv3

MobileNetv3 [25] is a lightweight CNN structure that was proposed in 2019. The software facilitates the effective reduction in model parameters and minimizes any loss of model accuracy. MobileNetv3 is characterized by its inheritance of the depth-separable convolution present in MobileNetv1, along with the retention of the inverted residual block from MobileNetv2. A distinguishing feature of MobileNetv3 is the incorporation of the SENet module and the enhanced activation function. The network structure is illustrated in Figure 2.
Where H is the height of the feature map, W is the width, C is the number of channels of the input feature map in SENet, and r is the scaling ratio. In Squeeze operation, global average pooling is used to compress the input feature maps to obtain 1 × 1 × C feature maps, whereas in Excitation operation, the 1 × 1 × C feature maps are nonlinearly transformed with the fully connected layer.
The MobileNetv3 network model has been enhanced in two distinct ways. In this study, a lightweight SENet was introduced into the Bneck structure of the network model with the aim of enhancing the quality of the output feature maps. The rationale behind this was that SENet was capable of learning the importance of each feature channel by modeling the interdependence between feature channels, and then based on the importance. The proposed enhancement would serve to accentuate the features that exerted a boosting effect on the prevailing training, and conversely, it would serve to suppress them. Conversely, novel Hard-Swish and Hard-Sigmoid activation functions were employed, which are delineated in Equations (3) and (4), respectively, where x denotes the input feature.
S w i s h x = x · S i g m o i d β x
H a r d S w i s h x = x · R e L U x + 3 6
H a r d S i g m o i d x R e L U x + 3 6
The Swish activation function is characterized by its smooth and non-monotonic nature, a property that confers an advantage in terms of detection accuracy when dealing with large datasets and deep network models. However, it should be noted that this function is computationally expensive. Consequently, MobileNetv3 has enhanced the Swish activation function, and Hard-Swish is a variant of the ReLU activation function. Hard-Swish has been demonstrated to reduce computational cost whilst maintaining performance. In a similar vein, the Hard-Sigmoid function represents an enhancement to the Sigmoid function. MobileNetV3 has been developed to achieve an optimal balance between computational efficiency and model performance by employing Hard-Swish and Hard-Sigmoid. In this paper, the dimensions of the elements constituting the input image were standardized to 640 × 640 .
The fundamental architecture of YOLOv5 is predicated on CSPDarknet, a network layer that is both profound and voluminous, rendering it ill-suited for deployment on edge devices and impeding the efficiency of inference. In this paper, the MCA-YOLOv5-ACON model was lightened by the introduction of a lightweight MobileNet family of networks, which replaced the original CSPDarknet network.
The following steps were to be taken: firstly, the input was scaled uniformly to the feature map of 640 × 640 × 3 . In the original CSPdarknet backbone, three feature layers were extracted, which were located in the middle, lower middle, and bottom layers of the backbone network, respectively. The three output shapes were f e a t 1 = 80 , 80 , 256 , f e a t 2 = 40 , 40 , 512 , and f e a t 3 = 20 , 20 , 1024 , respectively, when the input feature size was 640 × 640 × 3 . Subsequently, the dimensions of the newly configured network were recalibrated in accordance with the convolutional sampling process intrinsic to the original network, thereby ensuring its compatibility with the feature extraction networks of MobileNet and YOLOv5 models. Finally, MobileNet was designed to obtain three new lightweight, effective feature layers of the same width and height as the original effective feature layer, following backbone output of YOLOv5.

2.3. Depth-Wise Separable Convolution

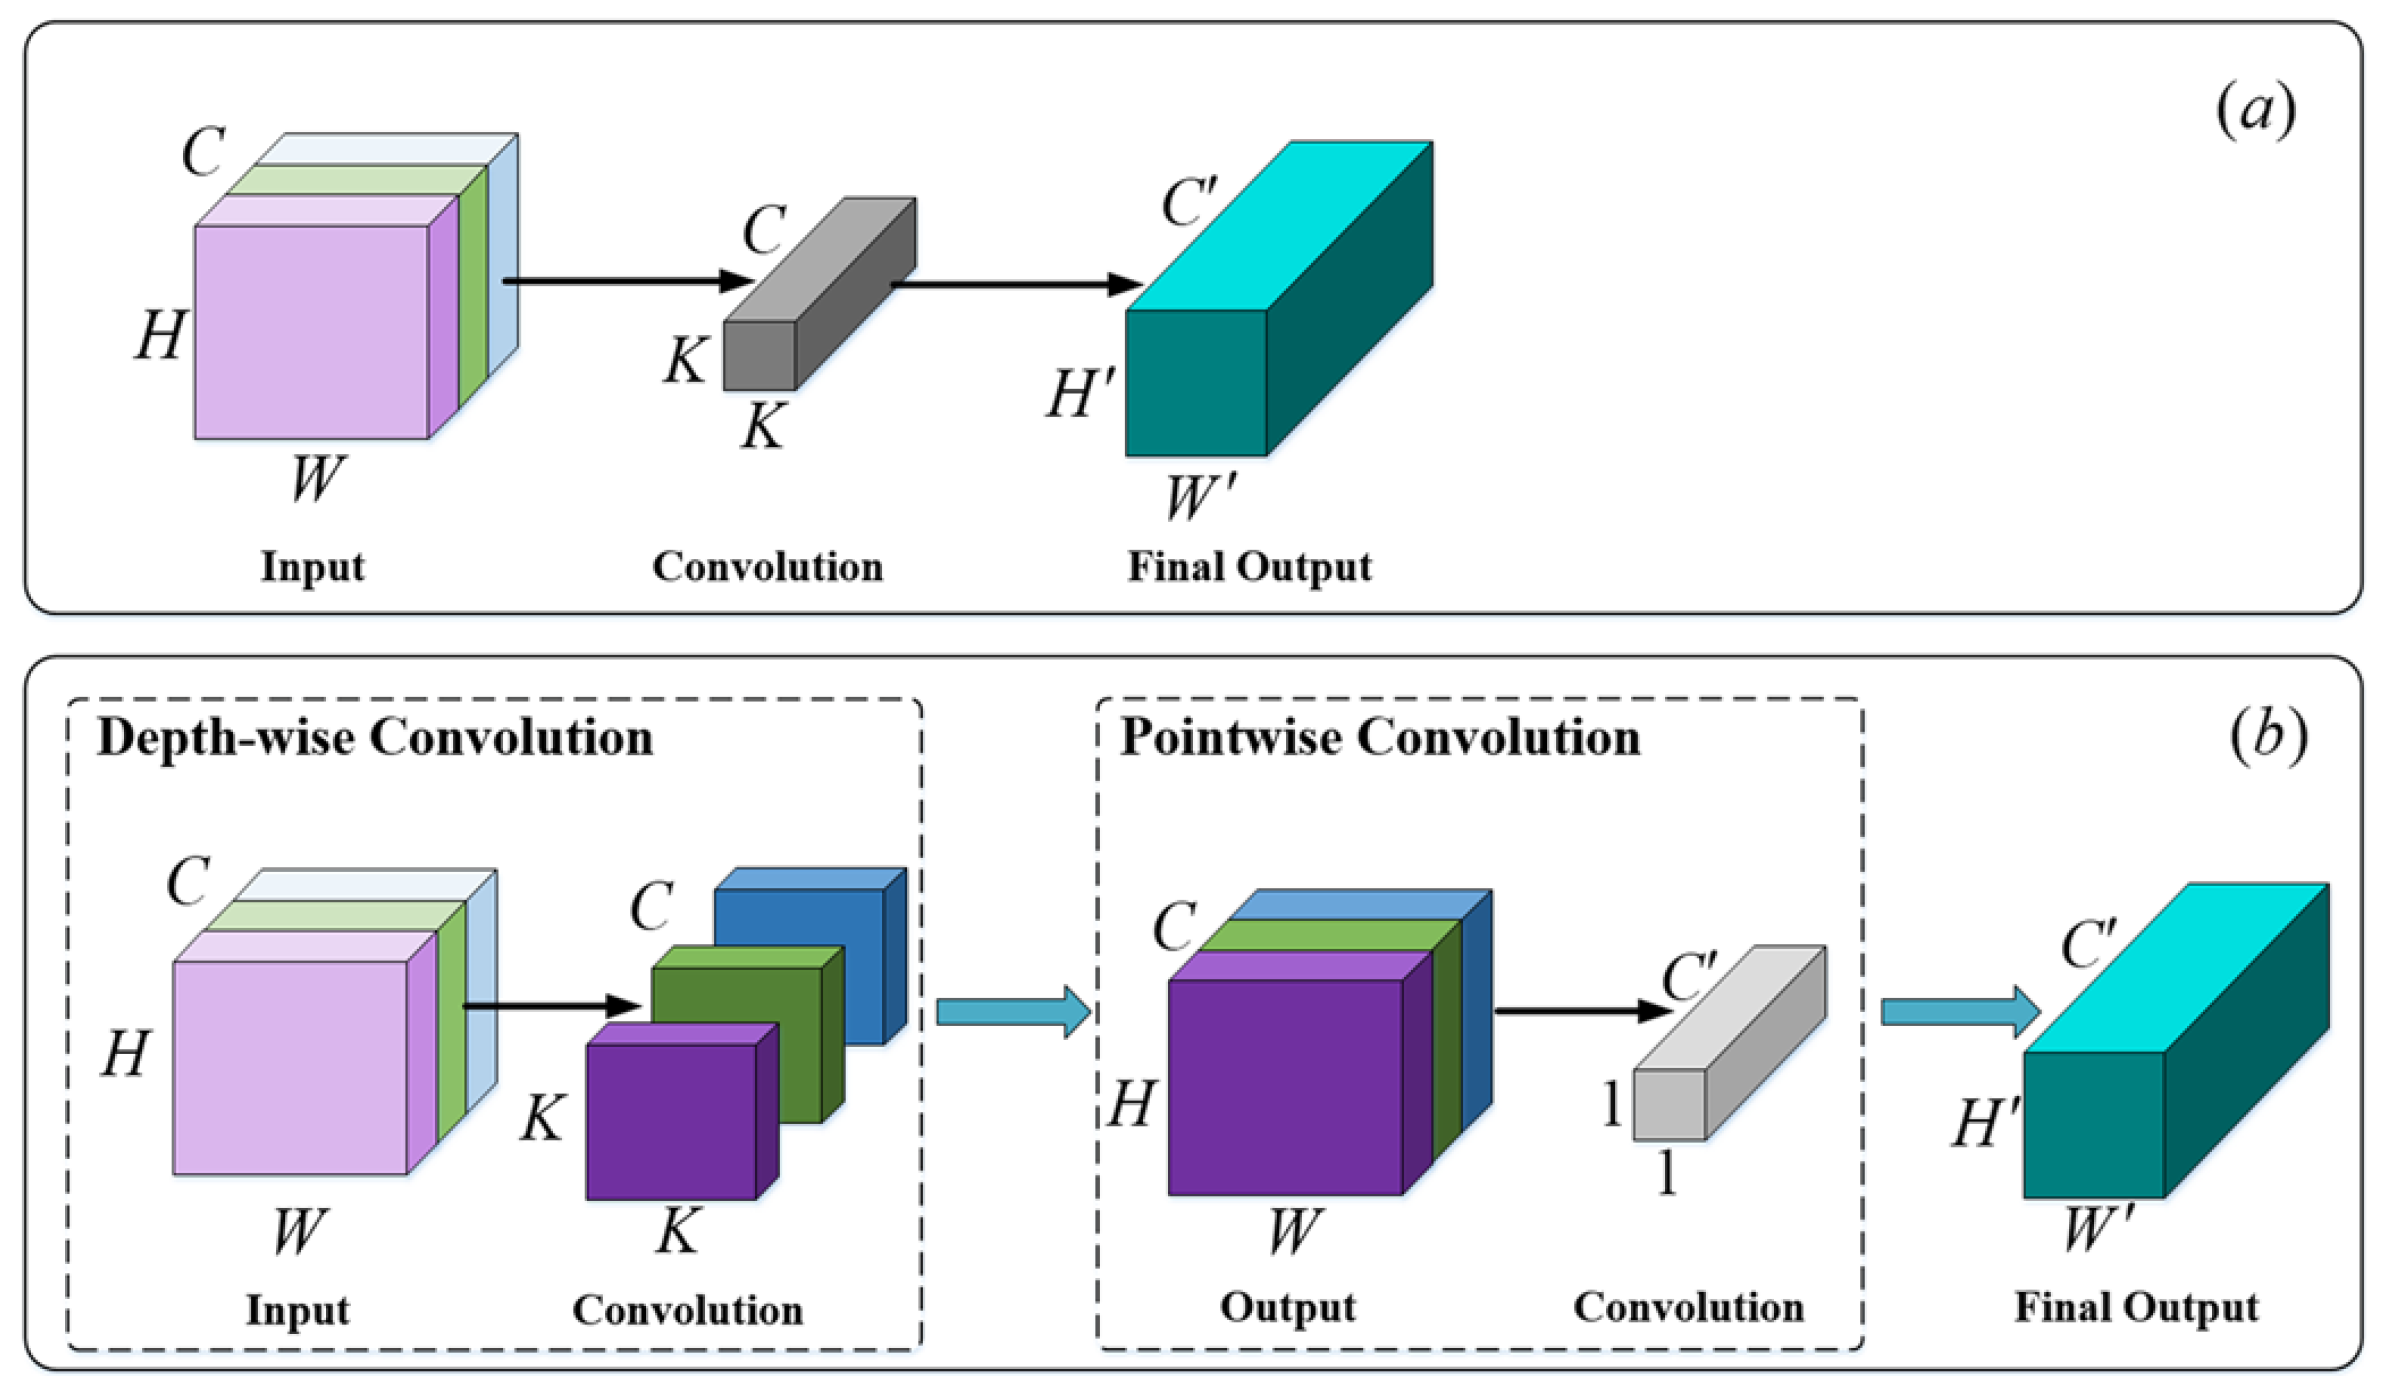
Depth-wise Separable Convolution [26] (DSC) comprises depth-wise convolution and pointwise convolution. In the context of deep convolutional networks, depth-wise convolution employs a distinct convolution kernel for each channel of the input feature map. This approach entails the allocation of a single convolution kernel to each channel, with subsequent connections between the outputs of these kernels resulting in the generation of the network’s final output. This method serves to minimize the number of multiplication operations required, enhancing the efficiency of the network’s operations [27]. In the context of machine learning, point-by-point convolution is a process whereby a point-by-point convolution kernel is employed to convolve with the feature output of each channel, thereby generating the final output channel. The operation of pointwise convolution is characterized by its efficiency, as it involves only element-level multiplication and summation. In this paper, point-by-point convolution with all convolution kernel sizes of 1 × 1 was selected, with the objective of significantly reducing the complexity of the model and enabling the DSC to play a more substantial role in models with limited computational resources.
The process of ordinary convolution is illustrated in Figure 3a, Assuming that the size of the input feature map is H × W × C, that the size of the convolution kernel is K × K, and that the size of the output feature map after calculation is H × W × C . The following calculation is to be performed. The computational complexity can be measured in terms of K 2 × C × H × W × C , where C is the number of input channels and C is the number of output channels.
The DSC process is realized through the division of the conventional convolution operation into two distinct stages. The aggregate computational complexity of this process is the sum of the computational complexities of its constituent parts [28], as illustrated in Figure 3b. The initial phase of the deep convolutional mapping process involves the utilization of three parameters to delineate the input features: namely, the height H, the width W, and the number of channels C. Conversely, the subsequent stage of the point-by-point convolutional mapping procedure employs a single parameter, namely the number of channels C of the output feature. The computational complexity of the initial part is expressed as K 2 × C × H × W , while the computational complexity of the subsequent part is denoted as C × C × H × W . Consequently, the aggregate calculation volume is calculated as follows: K 2 × C × H × W + C × C × H × W . The ratio of the computational effort of the DSC to the computational effort of the standard convolution, as demonstrated in Equation (5).
K 2 × C × H × W + C × C × H × W K 2 × C × H × W × C = 1 K 2 = 1 c
It is evident that the smaller the scale value of the equation, the lower the relative computational complexity. Consequently, the employment of DSC within the model, as opposed to conventional convolution, has been demonstrated to enhance training efficiency and reduce inference cost.
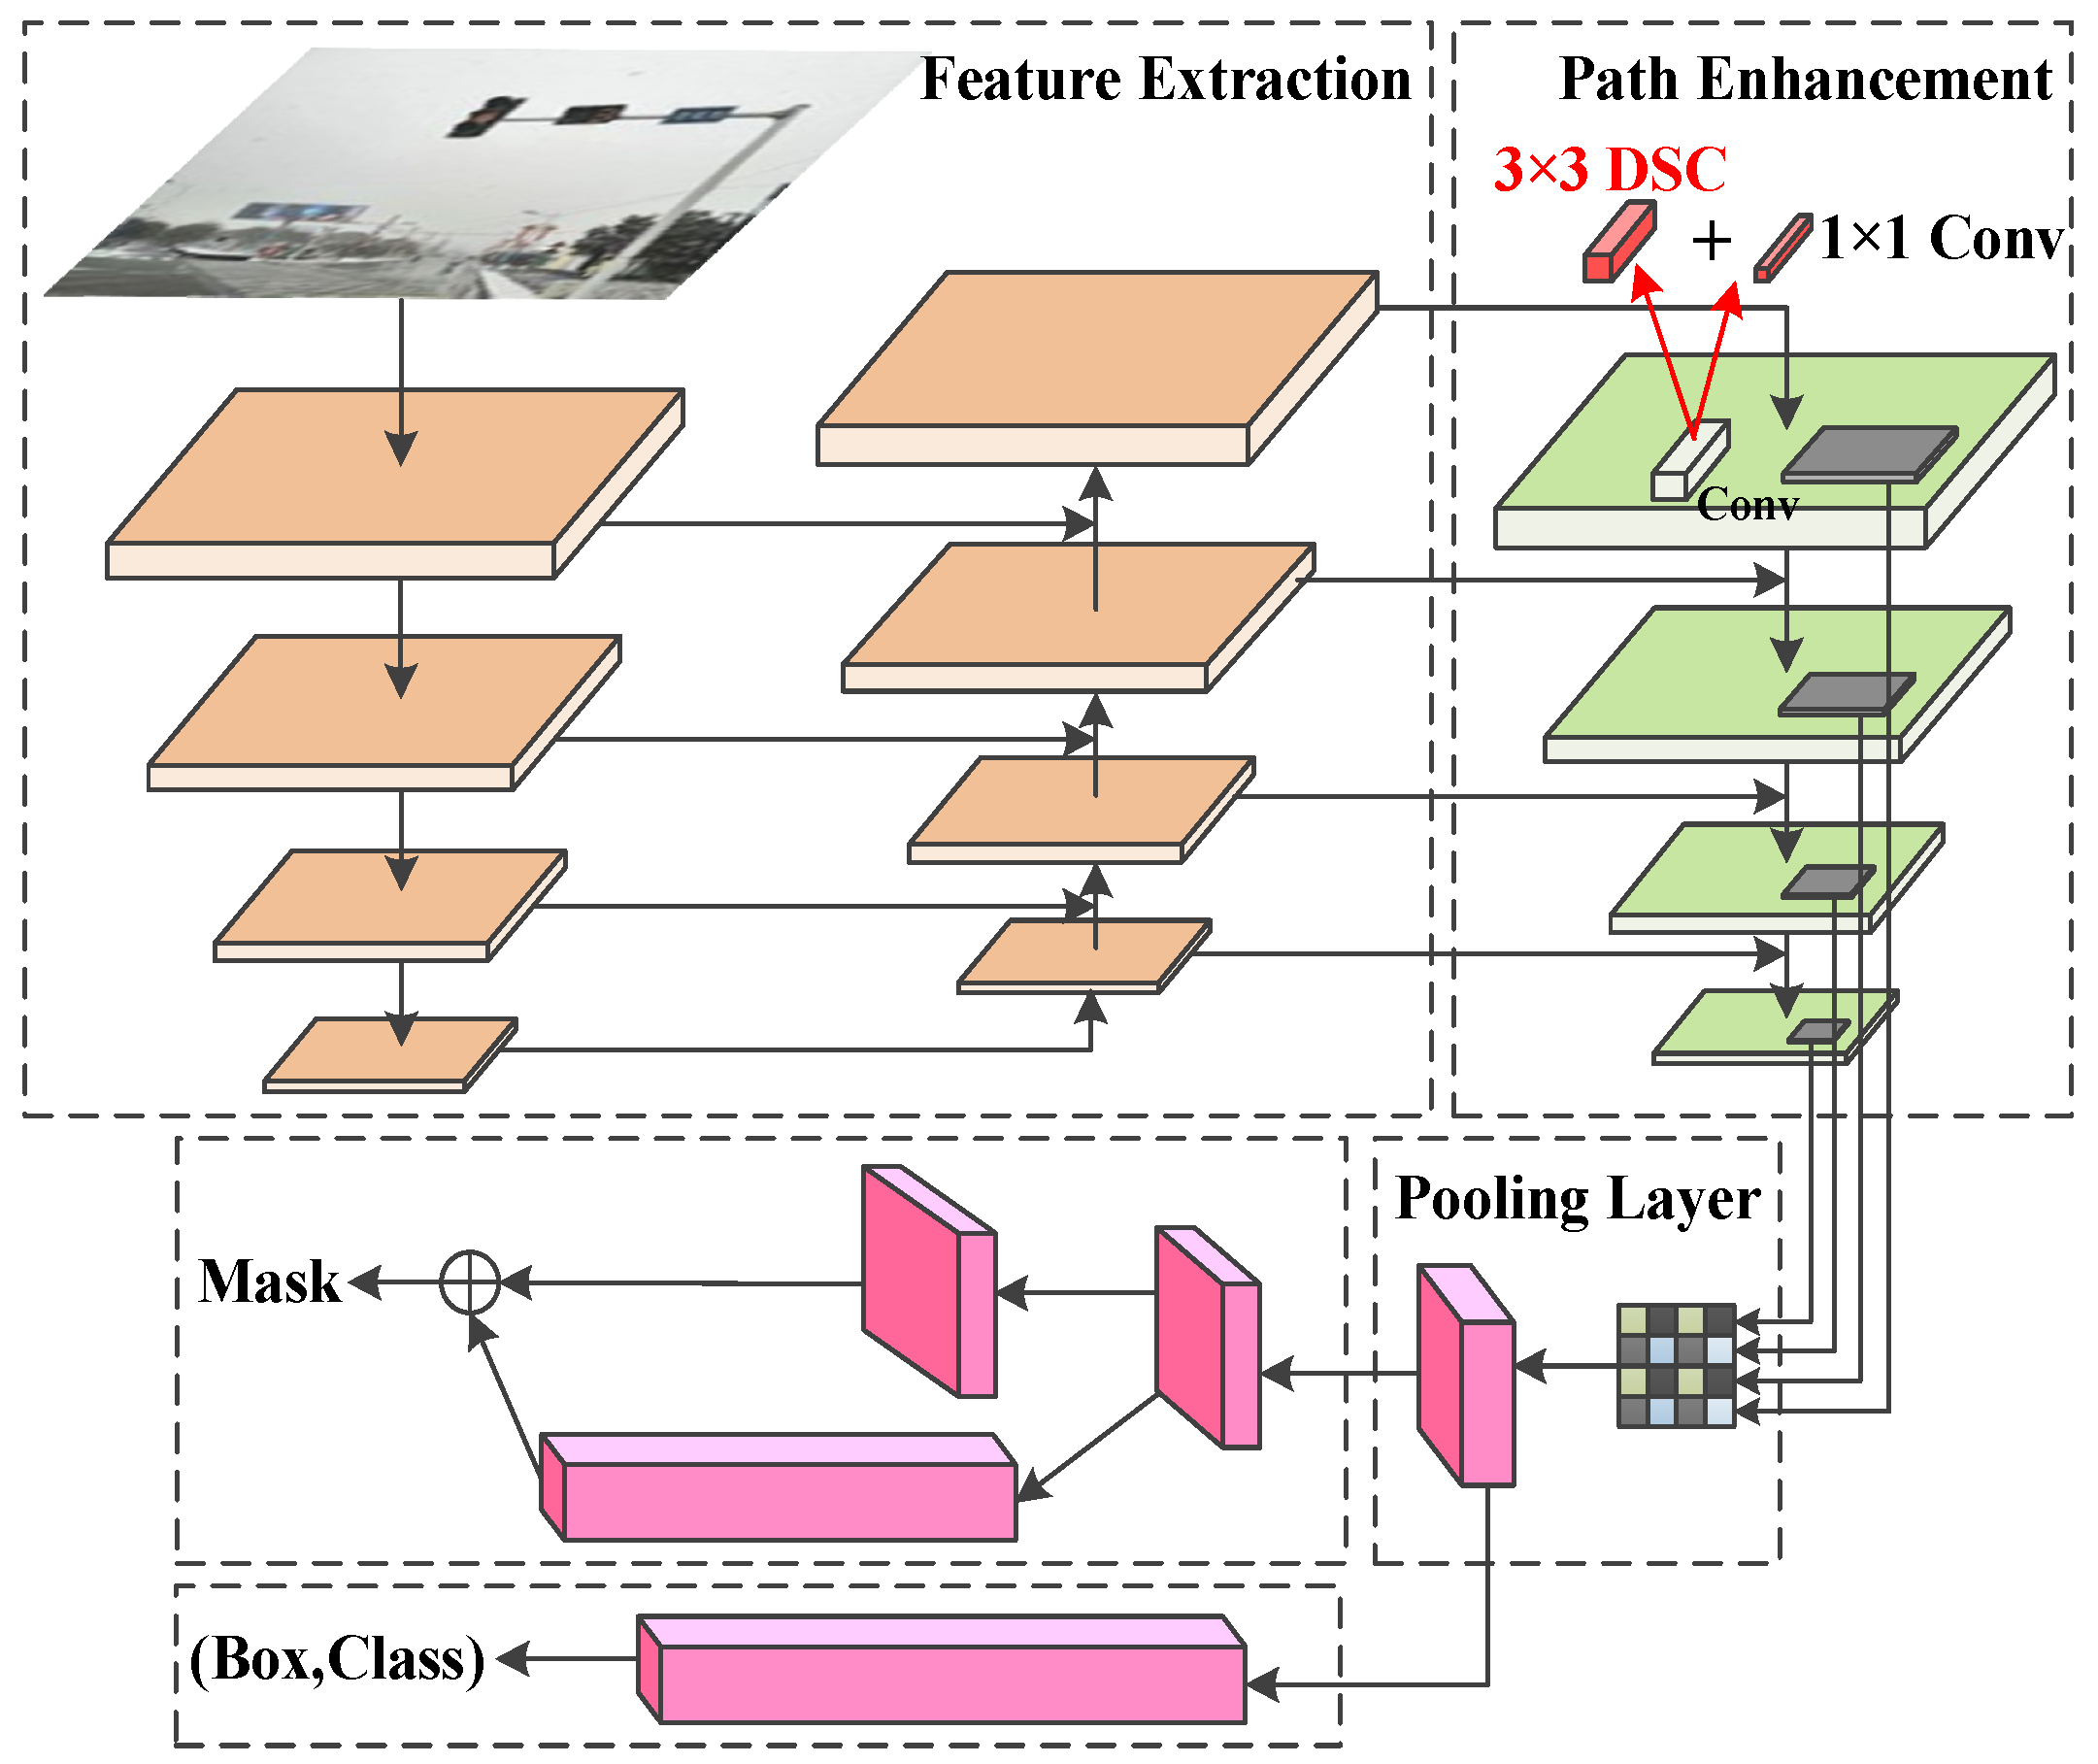
The MCA-YOLOv5-ACON model is derived from the Path Aggregation Network (PANet) of YOLOv5. The superiority of PANet is demonstrated in three ways:
Firstly, a path enhancement method is incorporated to facilitate transition from the low-level network to the high-level network. The precise location property of the information in the low-level network is utilized to enhance the feature extraction capability of the entire network by propagating the features of the low-level network, while concurrently shortening the path of information transfer. The integration of disparate feature layers can be enhanced through the utilization of a dual approach, encompassing both top-down and bottom-up feature extraction methodologies. The underlying principle of the PANet network is delineated in Figure 4.
Secondly, an adaptive pooling layer has been developed to automatically reconstruct the missing information paths between all feature layers and each candidate box. Despite the simplicity of the pooling layer operation, it facilitates the aggregation of features from all feature layers within each candidate box. This approach circumvents the degradation of data quality and consistency that arises from arbitrary allocation.
Thirdly, a small fully connected layer is employed to enhance the prediction of the mask image, as a means of obtaining a different view of each candidate frame. This process has been shown to produce a mask image of greater accuracy, whilst concomitantly increasing the diversity of information.
As demonstrated in Figure 4, in order to further reduce the number of parameters in the model, this study utilizes a depth-separable convolution block to replace all the regular convolutions in PANet with convolution kernel size a during the process of performing feature fusion. The depth-separable convolution block under consideration consists of three 3 × 3 depth-separable convolutions of 3 × 3 , in addition to a regular convolution of 1 × 1 .

2.4. Network Structure

Despite the MCA-YOLOv5-ACON model’s capacity for precise identification of traffic signals in complex weather and road environments, the network structure is intricate and demands excessive computing resources, which makes it unsuitable for edge terminals. The MobileNet family of lightweight networks has been demonstrated to provide a comprehensive and efficient solution strategy. Consequently, this paper replaced the feature extraction network of the MCA-YOLOv5-ACON model with lightweight networks from the MobileNet family. In order to achieve further compression of the model, the PANet enhanced feature extraction network was also optimized by replacing its standard convolutional layers with deep separable convolutional blocks. The improved model not only achieved a significant reduction in parameters but also maintained high performance while accelerating video stream detection. The statistical data pertaining to the number of parameters for each model in the comparison experiment of this study are displayed in Table 1.
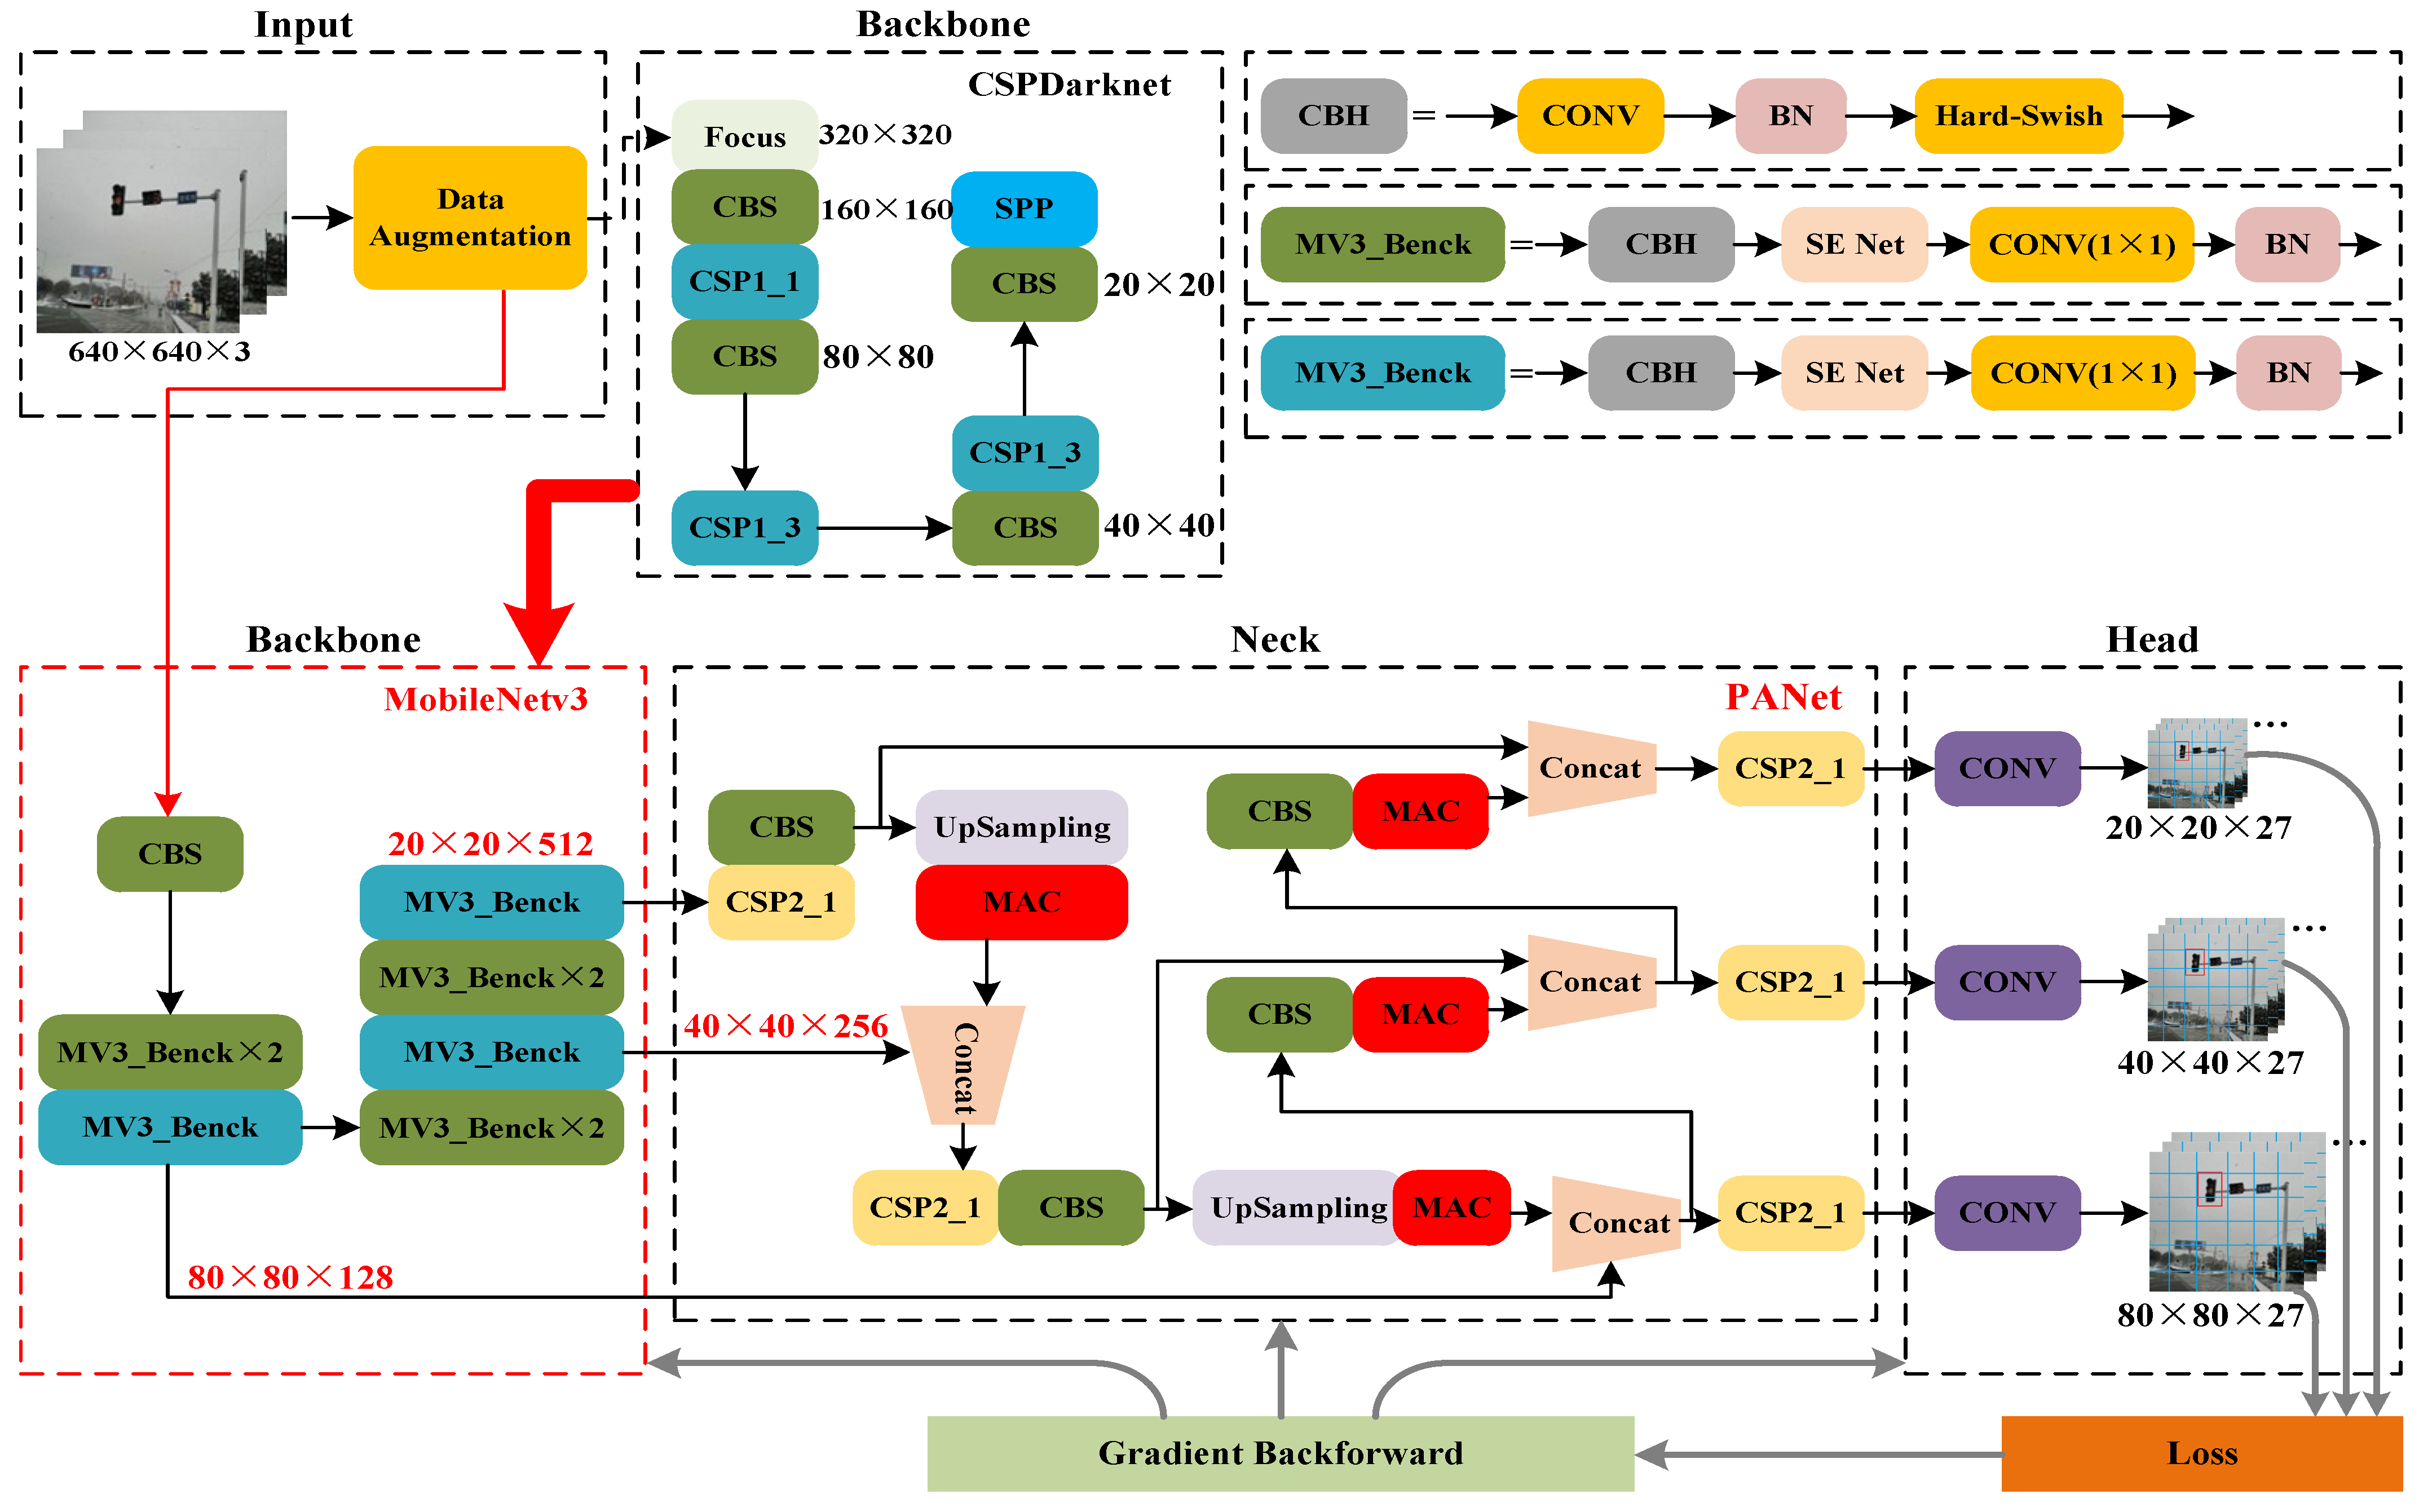
The overall network structure of the enhanced MobileNetv3-MCA-YOLOv5 model is illustrated in Figure 5. The MobileNetv3-MCA-YOLOv5 model is composed of a series of 12 MV3_Bneck blocks, forming the backbone network. In this case, the MV3_Bneck block in the blue box exhibits an SE inverted residual structure, while the MV3_Bneck block in the green box utilizes a linear module in lieu of jump connections.

2.5. Signal Light Fault Determination Logic

Traffic signal failure detection is performed based on the dataset. This involves enabling the model to accurately identify the status of each signal in real time. Subsequently, rigorous fault determination logic is established to indirectly detect and identify malfunctions based on the signal’s location and color status. “Black” indicates a fault condition where the lights are off. The two primary categories of signaling faults are “black” faults and “conflict” faults. The “black” fault has “red black”, “green black”, “all black”, and so on; “conflict” faults are “green conflict”, “red conflict”, “yellow conflict”, “red-green conflict”, and so on. The present paper puts forward a proposal for an enhancement to the logic description of fault judgement, as illustrated in Table 2.
The following design idea for a traffic signal video stream fault identification model was proposed in this paper, taking into consideration the actual situation of signal light operation in Yangzhou City, Jiangsu Province, China. Firstly, it was important to note that the signal light work was divided into three phases: “stable stage”, “conversion stage” and “abnormal stage”. It was evident that the stable stage is indicative of the signal being in a stable working condition for the majority of the time. As the signal countdown reached its conclusion, the signal would transition into a brief switching phase, which was typically limited to a duration of 15 s. During this phase, the yellow light was illuminated and begins to flash, while the red and green lights might also be flashing and switching signals. Subsequent to the conclusion of each transition phase, the system would transition to the subsequent stable phase. This sequence of events would continue until the final stable phase was reached. The only circumstance in which a signal might enter an abnormal state was when it was already abnormal; that was to say, when a fault has occurred. At this point, the signal was unable to manage the traffic order properly.
The fundamental approach to identifying anomalous signals entails the continuous acquisition of color and position data from the traffic video stream over an extended period. This extensive dataset is then utilized as a foundation for fault detection. The color change that occurs during the transition phase of the signal is the most complex aspect to consider; however, a brief anomaly does not necessarily indicate a malfunction of the signal. In order to achieve this objective, the model calculated the number of red, green, yellow and extinguished lights that occur within a cycle length. This was achieved by undertaking a comprehensive signal operating cycle at the current intersection, which was then utilized as a benchmark. Subsequently, the model established the respective time thresholds for various fault categories. In the event of the “fault frame” in the video stream occurring continuously and exceeding the predefined time threshold, it would be judged as a fault. As illustrated in Figure 6 for black faults and Figure 7 for conflict faults, the fault types delineated in Table 3 are further subdivided into a total of 42 categories.
As demonstrated in Figure 6, the square grid serves to illustrate the signals in the directions of “East, South, West and North”. The extinguishing faults are categorized according to the number of extinguishments in the four directions, with the lowest number of extinguishments occurring in the south-east, north-west, west and west directions. The extinguishing faults have been observed in only one of the four directions.
Furthermore, each direction of the black fault is subdivided into seven possible scenarios according to color. Assuming that the array (G, R, Y) represents the traffic signal board with green, red and yellow lights, it can be deduced that the value of 0 is assigned to black and 1 to light on. As illustrated in Table 3, the black fault situation is depicted for each direction.
As demonstrated in Figure 7, in the event of a green light in both the North and South directions, and a green light in the east and west directions that exceeds the designated time threshold, this signifies a “green conflict” fault at this particular intersection. The same applies to “red conflict” and “yellow conflict”. A “green conflict” fault is analogous to a “red conflict” or “yellow conflict” in nature. When the north–south direction of a red light and the other green light exceed the set time threshold, this is indicative of a “red-green conflict” fault. Furthermore, the “yellow-green conflict” and the “red-yellow conflict” are analogous situations. The aforementioned principles also apply to the concepts of “yellow-green conflict” and “red-yellow conflict”.

3. Experiment and Analysis

3.1. Dataset Production and Pre-Processing

The traffic signal dataset utilized in this study was predominantly derived from the traffic arteries in Yangzhou City, Jiangsu Province, China because this study is supported by two grants from the Yangzhou Municipal Government. The acquisition of video streams was achieved through two methods: firstly, manual hand-held video recording at each intersection using a camera; and secondly, direct acquisition of cyclic road videos captured by a car recorder from an in-vehicle USB stick. An FFmpeg script was developed for the purpose of extracting video frame images from the video stream. The script was programmed to identify and remove images that did not contain signals, a process that was then conducted manually. The result of the process was the extraction of 1310 images of traffic signals from the video, which formed the initial dataset.
The dataset images were then subjected to a series of preprocessing operations, including cropping, panning, rotating, mirroring, adding noise, adjusting brightness, histogram equalization, and cutout operations. This process culminated in the acquisition of an expanded dataset, encompassing a total of 3070 images. Following the augmentation of the dataset, the step of label addition was initiated. The present study employed the LabelImg tool for the manual annotation of traffic signal colors and positions, with a focus on the labelling of illuminated and non-illuminated segments. The color labels for traffic signals were categorized as “green”, “red”, “yellow”, and “black”, where black represents the signal being off. Following the enhancement and expansion of the dataset, the distribution thereof became more balanced, as illustrated in Table 4, the number of images per signal color is: “green” appearing 1829 times, “red” appearing 2051 times, “yellow” appearing 1852 times, “black” appearing 1067 times. In this study, the training, validation and test sets were divided into ratios of 8:1:9:10, with the total number of sheets comprising the training set amounting to 2487, the validation set totaling 276, and the test set totaling 307.
The Bosch Small Traffic Light Dataset (BSTLD) [29,30] is a vision-based traffic light detection dataset. It is widely used in experiments to validate traffic signal detection models. It covers complex road scenes and various complex objects with a total of 13,427 camera photos. However, 5094 images from the BSTLD images were used for training purposes, and among those images, 1019 images were split to make a test set [29]. By comparison, the size of our dataset is somewhat limited. However, we preprocessed the dataset to address issues of imbalance and over-fitting. The final experimental results demonstrated that our dataset meets the requirements for validation experiments.

3.2. Model Training and Training Settings

In the context of the preprocessed traffic light dataset, the training phase of the model incorporated the Mosaic and Mixup techniques to enhance the data. The Mosaic method involved the random selection of four images, each with distinct semantic information, for mixing, thereby enhancing the diversity of the data. Conversely, Mixup employed linear interpolation on the input data following Mosaic to generate novel training samples, thereby enhancing the model’s generalization capabilities and mitigating the risk of overfitting.
In this paper, a series of comparison experiments were conducted and the values of hyperparameters were repeatedly adjusted according to the experimental results. In conclusion, the optimal hyperparameter setting values presented in Table 5 have been determined based on the findings of the experimental investigation.

3.3. Evaluation Indicators

The model was evaluated in this paper using the following metrics: precision, recall, mean average precision (mAP), F 1 -score value, and detection speed (FPS).
Taking the green state of the traffic signal as an example. TP (True Positive): the number of green traffic lights that are correctly identified as green in the green category. FN (False Negative): the number of instances in which green traffic lights are erroneously identified as a different color in the green category. FP (False Positive): the number of instances in which green traffic lights are incorrectly identified as a different color in the other color category. TN (True Negative) denotes the number of other color signals that have been successfully detected as other color signals in the other color category.
Precision is defined as the proportion of correctly predicted samples out of all those that were positively predicted [31]. The formula employed to evaluate the accuracy of the prediction of the four states of traffic signals “green, red, yellow, and off” is as follows:
P r e c i s o n = T P T P + F P
Recall can be used to assess the comprehensiveness when making predictions about the status of traffic signals, and its formula is:
R e c a l l = T P T P + F N
Mean Average Precision (mAP) is the average precision rate in the target detection task across multiple categories, which is the average of the AP (Average Precision) values of all the categories included. The mAP provides a unified performance metric that comprehensively considers the model’s performance in different categories, thus rendering it a key measure of multiple categories of traffic lights. The mAP and AP are calculated using the following formulas:
m A P = j = 1 c A P j c
A P = 0 1 P R d R
The F 1 -score is a composite metric based on precision and recall calculations, and it is the average of these two values added together. The formula is shown in Equation (10):
F 1 = 2 × P r e c i s o n × R e c a l l P r e c i s i o n + R e c a l l

3.4. Experimental Results and Analysis

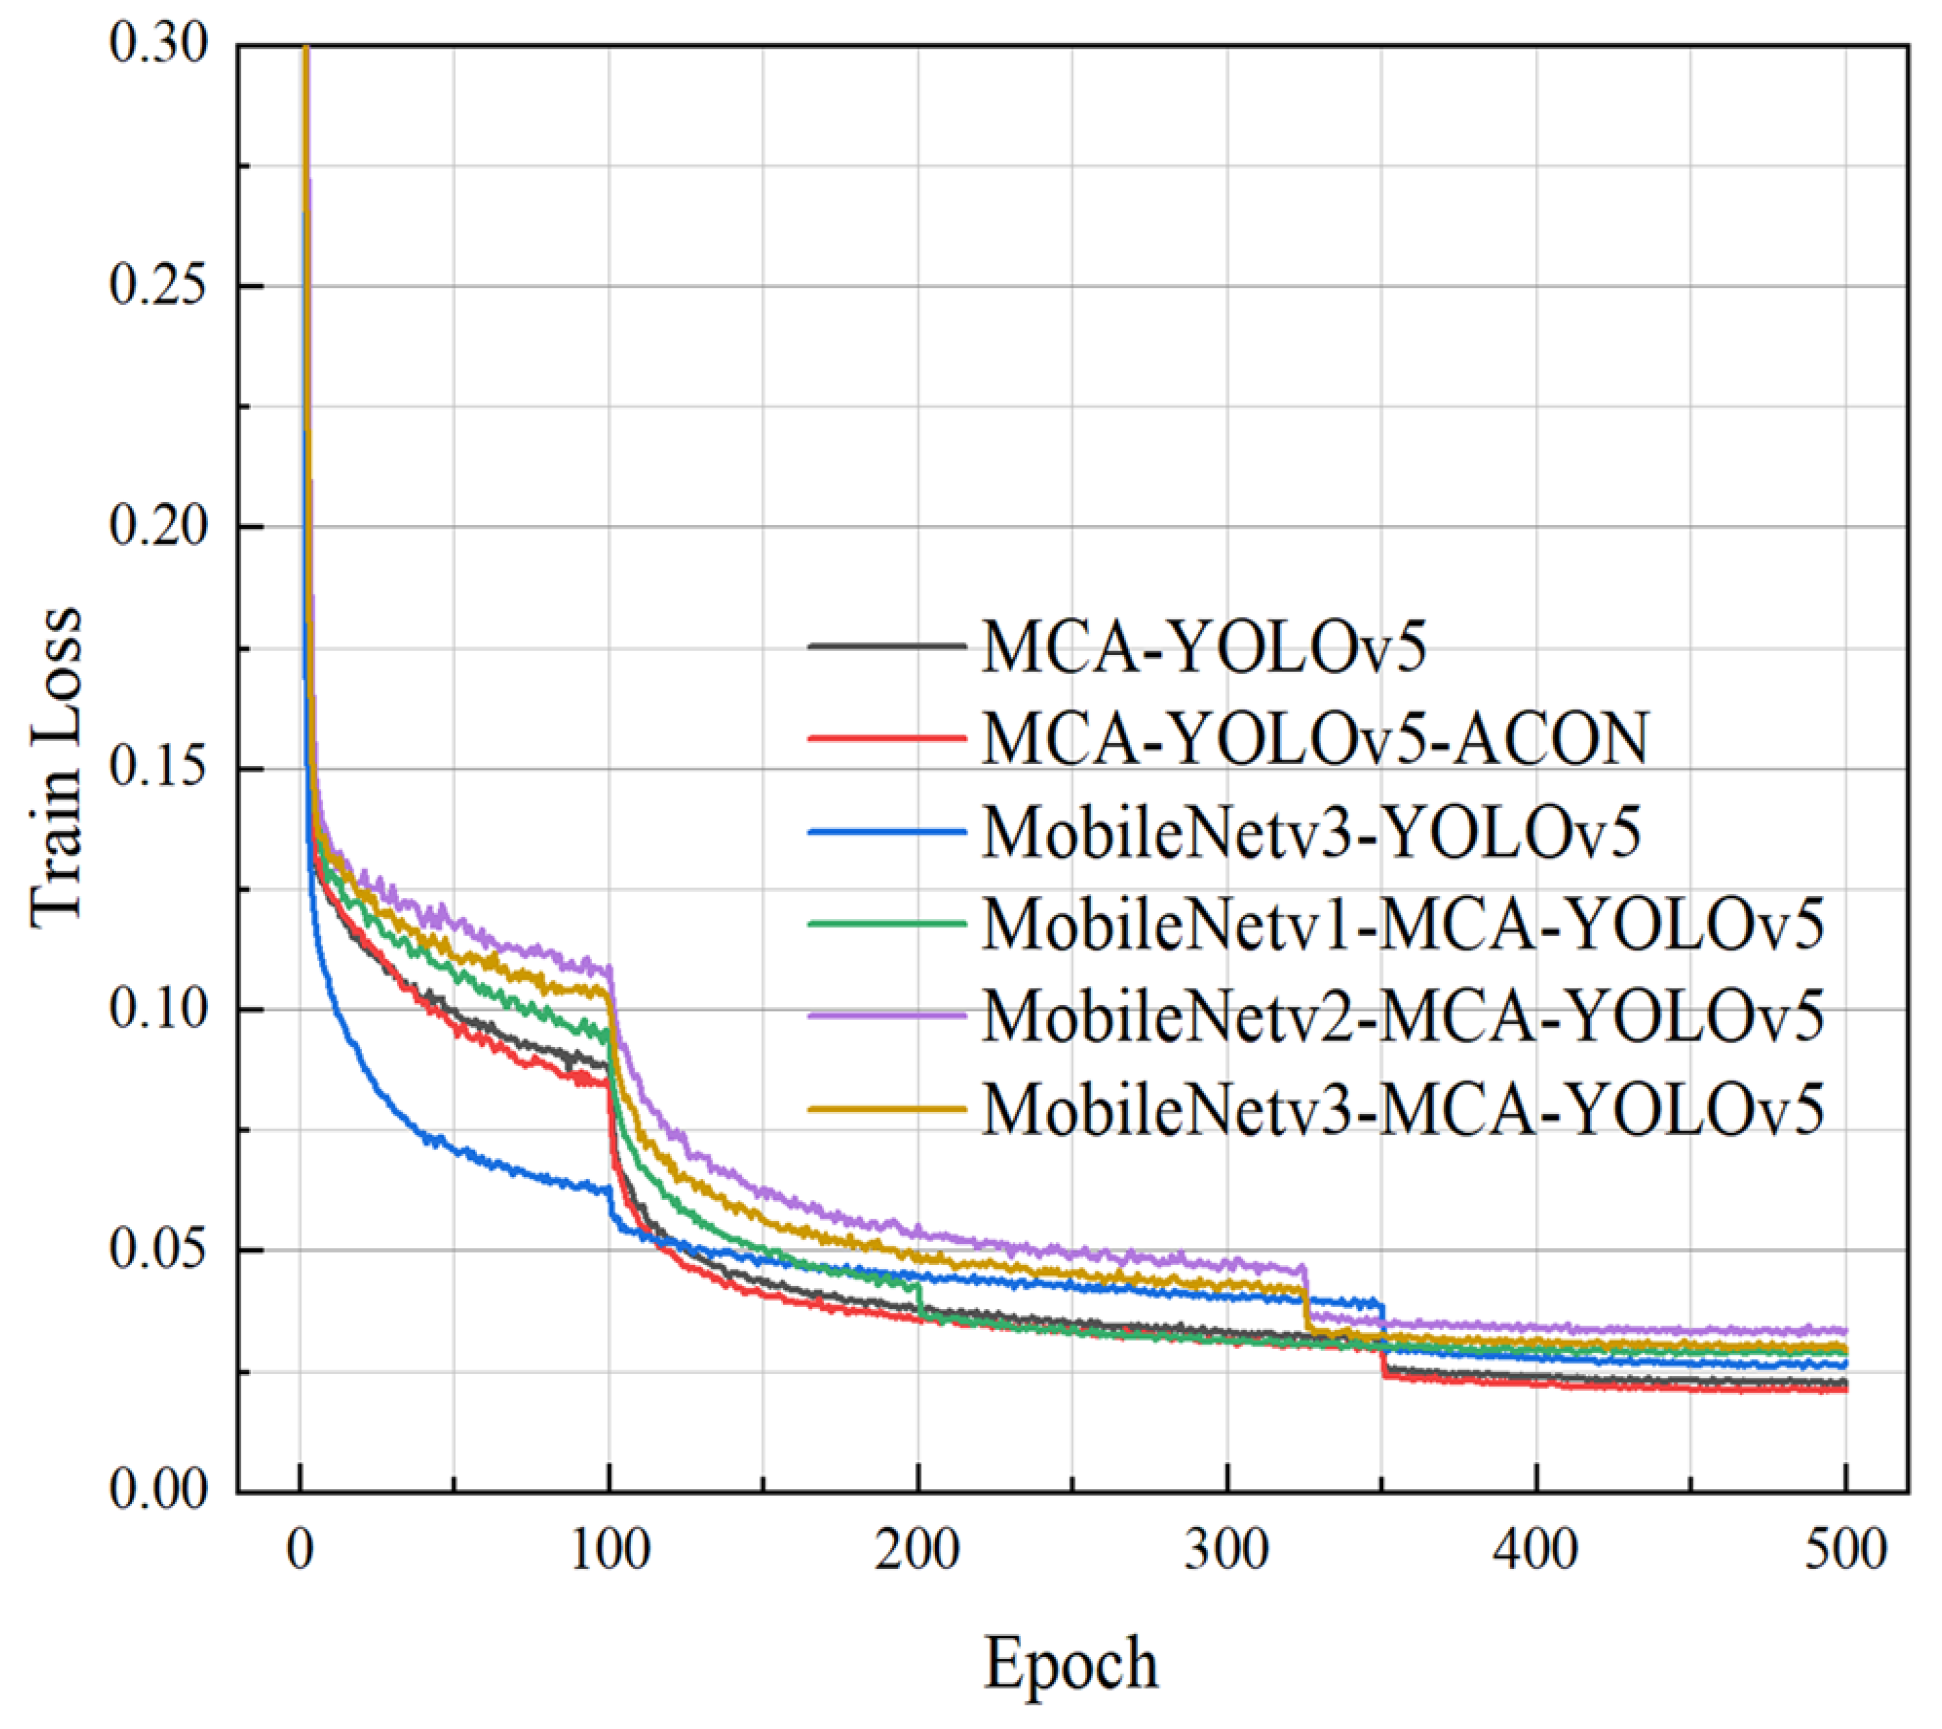
In this paper, we utilized the MCA-YOLOv5 model and the MCA-YOLOv5-ACON model as a point of reference, and the four models, MobileNetv1-MCA-YOLOv5, MobileNetv2-MCA-YOLOv5, MobileNetv3-MCA-YOLOv5 and MobileNetv3-YOLOv5, were trained for 500 Epochs. The training loss and performance metrics were calculated and saved at 5 Epoch intervals, generating mAP comparison plots and training loss comparison plots for the lightweight model, as demonstrated in Figure 8 and Figure 9, respectively.
As illustrated in Figure 8, there is a clear downward trend, indicating that reducing the number of model parameters is associated with a decline in model accuracy. Similarly, observation of Figure 9 demonstrates that the incorporation of MobileNet family networks into the models results in an enhancement of the final loss function value. Following a 400 Epoch training period, the mAP of all models stabilize and exhibit a lower value in comparison to the original model. Furthermore, since the Freeze Epoch is set to 100 Epochs, all models incorporating MCA experience delayed parameter weight updates during the initial 100 Epochs. An analysis of Figure 8 indicated that the three models in which the MCA module was incorporated and the backbone network was substituted with MobileNetv1, MobileNetv2 and MobileNetv3, respectively, exhibited a particularly gradual enhancement in mAP values during the initial 100 epochs of freeze training. Conversely, the MobileNetv3-YOLOv5 model, devoid of the augmented MCA module, exhibited the most expeditious convergence speed. The specific performance comparison is delineated in Table 6.
Among these, the optimal training weights for the MobileNetv1-MCA-YOLOv5, MobileNetv2-MCA-YOLOv5, MobileNetv3-MCA-YOLOv5, and MobileNetv3-YOLOv5 models are attained at the 490th Epoch, 420th Epoch, 390th Epoch, and 370th Epoch, respectively, corresponding to mAPs of 93.25%, 90.03%, 93.57%, and 90.04%, respectively.
An analysis of Table 6 revealed that the four lightweight models were comparable in size, with the MobileNetv1-MCA-YOLOv5 model being the largest at 39.04 MB. The MobileNetv3-YOLOv5 model demonstrated the most optimal precision performance at 98.68%; however, the other performance metrics were the lowest. The MobileNetv1-MCA-YOLOv5 model demonstrated the most optimal recall performance at 87.25%, while the other performance metrics were comparable to the MobileNetv1-MCA-YOLOv5 model. The MobileNetv2-MCA-YOLOv5 model had the smallest capacity of 33.23 MB, but the other performance indicators were not dominant.
In contrast, the MobileNetv3-MCA-YOLOv5 model achieved 93.57% and 92.25% for mAP and F 1 , respectively, which were the highest among the four lightweight models. Furthermore, both Precision and Recall also ranked second, and required less capacity compared to the MobileNetv1-MCA-YOLOv5 model.
In summary, the integration of MobileNetv3 lightweight network had been demonstrated to significantly reduce the computational demands of the model. The number of parameters was reduced to 19.37% of the MCA-YOLOv5-ACON model, while the mAP of the MobileNetv3-MCA-YOLOv5 model achieved 93.57%, and the precision value reached 98.53%. This represented an enhancement of 0.38% compared to the MCA-YOLOv5-ACON model. Consequently, MobileNetv3 was identified as the optimal network for lightweighting in this paper.
In order to provide a more comprehensive illustration of the optimal trade-off between accuracy and efficiency achieved by MobileNetv3-MCA-YOLOv5 model comparative analysis were conducted against two state-of-the-art lightweight models: YOLOv7-tiny and YOLOv8n. The experimental results for YOLOv7-Tiny and YOLOv8nwere derived from research undertaken by Y. Huang et al. [32] The dataset was a custom traffic signal dataset that was collected from the actual taxi driving environment in Yancheng City, Jiangsu Province. The comparison results are demonstrated in Table 7. A comprehensive analysis of Table 7 reveals that, in contrast to YOLOv7-tiny and YOLOv8n, MobileNetv3-MCA-YOLOv5 model is characterized by an elevated number of parameters, whilst its computational complexity is positioned between that of the two aforementioned models. Nevertheless, it achieves the highest mAP. This finding suggested that state-of-the-art lightweight models commonly compromised detection accuracy to achieve real-time detection efficiency. Consequently, it was evident that MobileNetv3-MCA-YOLOv5 model enhanced detection accuracy while maintaining real-time performance.

3.5. Signal Light Fault Detection

In order to evaluate the efficacy of this enhanced video stream fault detection model, the following experiments were conducted in this paper. In accordance with the fault determination table that had been delineated in the preceding section, the TrafficMatrix matrix was programmed and defined to load real-time status data of all signals at the intersection. The 42 common signal faults defined in the previous section were written into the program yolo.py, and the program predict.py was used to read the four video streams of “East, South, West and North”. The real-time processing speed of the MobileNetv3-MCA-YOLOv5 model in the video stream analysis was also calculated, with the frames per second (FPS) displayed at the top left of the video.
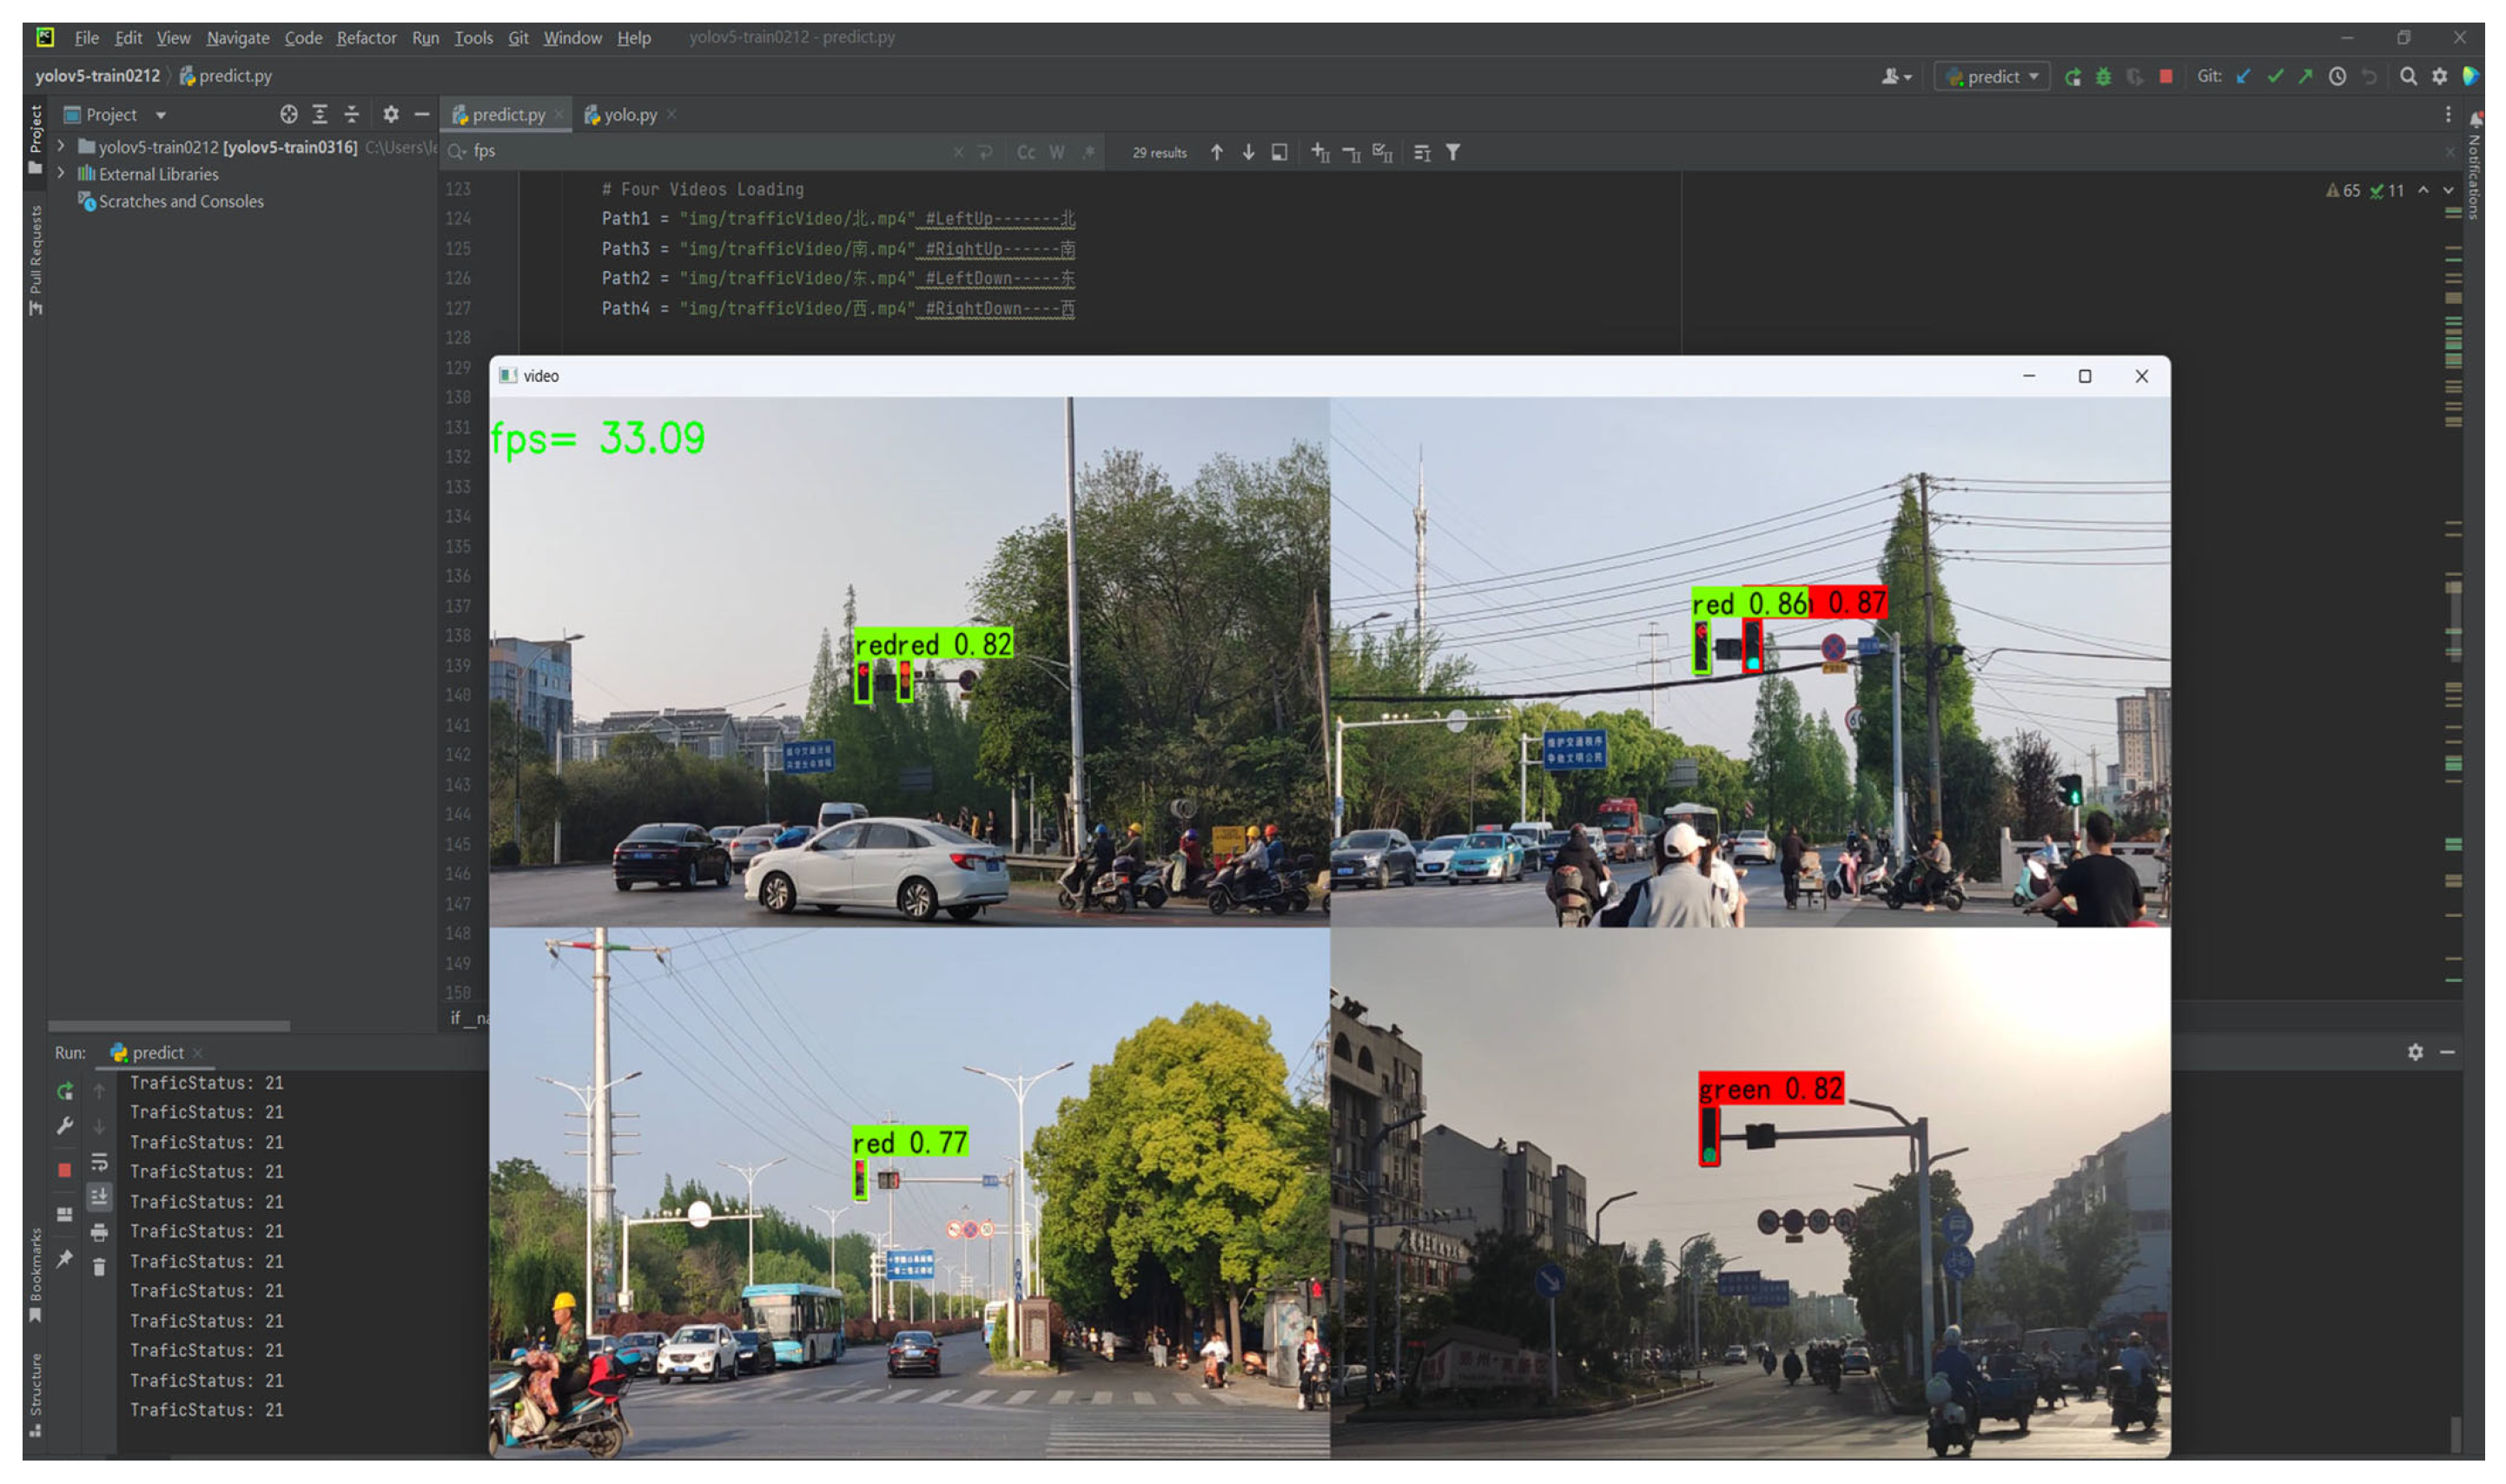
In order to facilitate the verification of the effectiveness of the model function, in this paper, video mode was directly enabled to detect locally intercepted mp4 files. The video file for the experimental test was captured at the intersection of the Southwest corner of the campus, and contained video streams of four signals “East, South, West, and North”. As demonstrated in Figure 10, when the red lights in the three directions of “North, South and East” are on continuously for more than 60 s, the system identifies a red conflict fault, which corresponds to “Category 21” in Figure 10. At this juncture, the system returns the status “TraficStatus = 21”, as illustrated in Figure 10. The FPS at this time is equivalent to 33.09 fps.
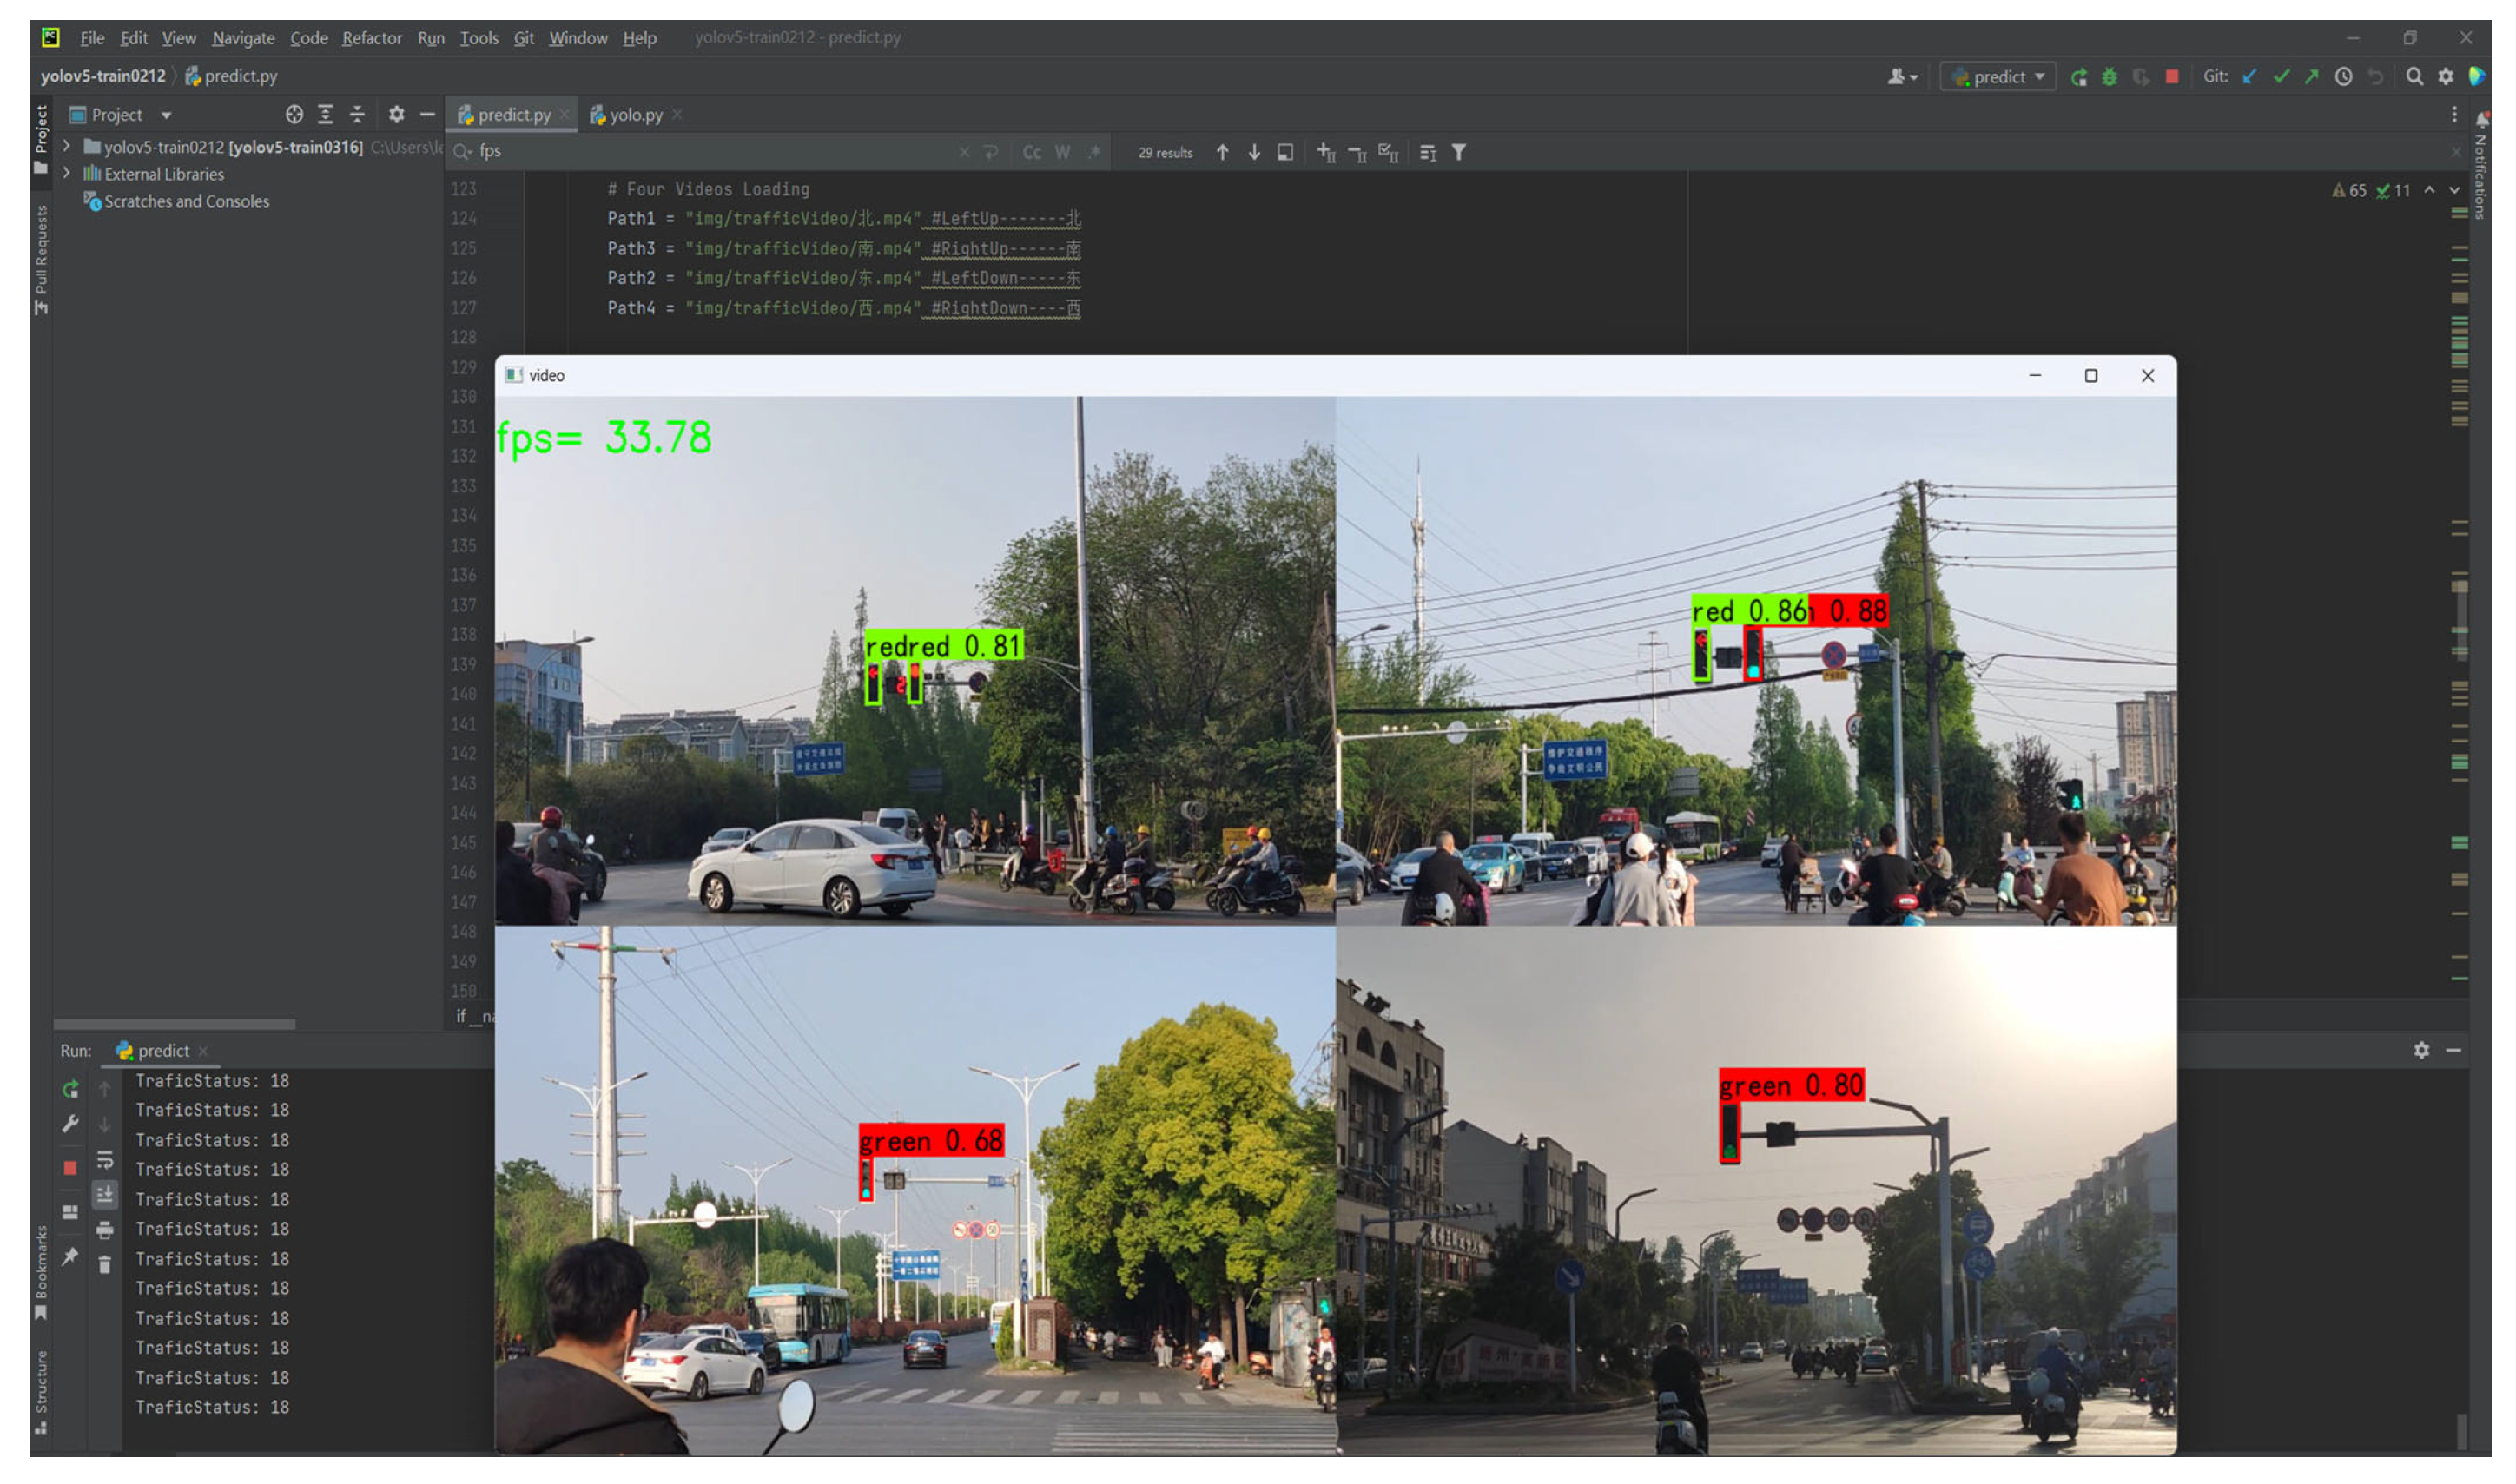
As demonstrated in Figure 11, when the green lights in the three directions of “South, East and West” are on continuously for more than 60 s, the system identifies a green conflict fault, which corresponds to “Category 18” in Figure 7. At this juncture, the system returns the status code “TraficStatus = 18”, as illustrated in Figure 11. The FPS value is equivalent to 33.78 fps.
Following a series of experimental trials, the system demonstrated the capacity to accurately determine fault classifications when video streams were provided for all 42 types of fault states. Furthermore, the detection frame rate of the MobileNetv3-MCA-YOLOv5 model was sampled 100 times, and the mean FPS detection rate was calculated to be 33.34 fps. It was demonstrated that under identical experimental parameters, the MCA-YOLOv5-ACON model achieved the mean FPS of 25.20 fps. The MobileNetv3-MCA-YOLOv5 model exhibited an enhancement in FPS of 8.14 fps. The results demonstrated that MobileNetv3-MCA-YOLOv5 model achieved real-time detection capabilities while maintaining a lightweight design, making it suitable for edge deployment in urban traffic signal fault detection tasks.

4. Discussion

A lightweight MobileNetv3-MCA-YOLOv5 model based on depth-separable convolution had been developed to address the problem that the MCA-YOLOv5-ACON model had a large number of parameters, which made it difficult to be deployed in edge devices. It was evident from our results that this lightweight model effectively balanced memory consumption and performance. Consistent with previous studies, we observed that YOlOv5 Lightweight Model Based on DSC [33] could achieve a good trade-off between precision and speed. Our work provided novel method that the CSPDarknet network was replaced with the MobileNet architecture. And standard convolutions in the PANet architecture were substituted with deep separable convolutions. Experiments demonstrated that MobileNetv3-MCA-YOLOv5 model achieved both high accuracy and real-time performance, making it more suitable for deployment on edge devices. Overall, our research provided a suitable solution for the edge deployment of traffic signals detection, which is considered to be a significant advancement in the field of technological development. Nevertheless, there are several areas that require further exploration. It is important to acknowledge the limitations in our dataset that it is from a single city (Yangzhou). While there is some applicability to most southern Chinese cities sharing common traffic conditions, weather patterns, and signal design characteristics, the application of this research to other geographic regions is limited. Consequently, the future direction of the research will entail the further validation of the model through the utilization of public datasets, with the objective of enhancing its feasibility and expanding its applicability. Another future research direction involves the use of hyperparameter optimization strategies to fine-tune these parameters, thereby establishing a scientific basis for parameter selection.

Author Contributions

All authors contributed to the study conception and design. Material preparation, data collection and analysis were performed by Z.Z. The first draft of the manuscript was written by P.S. and all authors commented on previous versions of the manuscript. All authors have read and agreed to the published version of the manuscript.

Funding

The work presented in this paper was supported by the Educational Reform Project of Guangling College of Yangzhou University, No. JGYB25001; Yangzhou Municipal Programme—Special City-School Cooperation, No. YZ2021159; Industry foresight and common key technologies of Yangzhou City—Industry foresight R&D, No. YZ2021016.

Institutional Review Board Statement

Not applicable.

Data Availability Statement

The raw data supporting the conclusions of this article will be made available by the authors on request.

Conflicts of Interest

The authors declare no conflicts of interest.

References

  1. Tomar, I.; Sreedevi, I.; Pandey, N. State-of-Art Review of Traffic Light Synchronization for Intelligent Vehicles: Current Status, Challenges, and Emerging Trends. Electronics 2022, 11, 465. [Google Scholar] [CrossRef]
  2. Liang, S.; Yan, F. Iterative Fault-Tolerant Control Strategy for Urban Traffic Signals Under Signal Light Failure. In Proceedings of the 2024 IEEE 13th Data Driven Control and Learning Systems Conference (DDCLS), Kaifeng, China, 5 August 2024; pp. 1190–1197. [Google Scholar]
  3. Mafas, A.M.M.; Amarasingha, N. An analysis of signalized intersections: Case of traffic light failure. In Proceedings of the 2017 6th National Conference on Technology and Management (NCTM), Malabe, Sri Lanka, 27 January 2017; pp. 138–141. [Google Scholar]
  4. Shi, T.; Devailly, F.X.; Larocque, D.; Charlin, L. Improving the Generalizability and Robustness of Large-Scale Traffic Signal Control. IEEE Open J. Intell. Transp. Syst. 2024, 5, 2–15. [Google Scholar] [CrossRef]
  5. Liang, S.; Wu, H.; Zhen, L.; Hua, Q.; Garg, S.; Kaddoum, G.; Hassan, M.M.; Yu, K. Edge YOLO: Real-Time Intelligent Object Detection System Based on Edge-Cloud Cooperation in Autonomous Vehicles. IEEE Trans. Intell. Transp. Syst. 2022, 23, 25345–25360. [Google Scholar] [CrossRef]
  6. Duan, C.; Gong, Y.; Liao, J.; Zhang, M.; Cao, L. FRNet: DCNN for Real-Time Distracted Driving Detection Toward Embedded Deployment. IEEE Trans. Intell. Transp. Syst. 2023, 24, 9835–9848. [Google Scholar] [CrossRef]
  7. Lecun, Y.; Denker, J.S.; Solla, S.A.; Howard, R.E.; Jackel, L.D. Optimal brain damage. In Proceedings of the Advances in Neural Information Processing Systems 2, NIPS Conference, Denver, CO, USA, 27–30 November 1989. [Google Scholar]
  8. Wang, W.; Yu, Z.; Fu, C.; Cai, D.; He, X. COP: Customized correlation-based Filter level pruning method for deep CNN compression. Neurocomputing 2021, 464, 533–545. [Google Scholar] [CrossRef]
  9. Fernandes, F.E., Jr.; Yen, G.G. Pruning Deep Convolutional Neural Networks Architectures with Evolution Strategy. Inf. Sci. 2021, 552, 29–47. [Google Scholar] [CrossRef]
  10. Wang, W.; Liu, X. Research on the application of pruning algorithm based on local linear embedding method in traffic sign recognition. Appl. Sci. 2024, 14, 7184. [Google Scholar] [CrossRef]
  11. Zhang, Y.; Ma, H.; Ren, C.; Meng, S. RDLNet: A channel pruning-based traffic object detection algorithm. Eng. Res. Express 2025, 7, 025251. [Google Scholar] [CrossRef]
  12. Wu, F.; Xiao, L.; Yang, W.; Zhu, J. Defense against adversarial attacks in traffic sign images identification based on 5G. EURASIP J. Wirel. Commun. Netw. 2020, 2020, 173. [Google Scholar] [CrossRef]
  13. Wei, W.; Zhang, L.; Yang, K.; Li, J.; Cui, N.; Han, Y.; Zhang, N.; Yang, X.; Tan, H.; Wang, K.; et al. A lightweight network for traffic sign recognition based on multi-scale feature and attention mechanism. Heliyon 2024, 10, e26182. [Google Scholar] [CrossRef]
  14. Zhang, L.; Yang, K.; Han, Y.; Li, J.; Wei, W.; Tan, H.; Yu, P.; Zhang, K.; Yang, X. TSD-DETR: A lightweight real-time detection transformer of traffic sign detection for long-range perception of autonomous driving. Eng. Appl. Artif. Intell. 2025, 139, 109536. [Google Scholar]
  15. Cai, K.; Yang, J.; Ren, J.; Zhang, W. A lightweight algorithm for small traffic sign detection based on improved YOLOv5s. Signal Image Video Process. 2024, 18, 4821–4829. [Google Scholar]
  16. Cao, L.; Kang, S.-B.; Chen, J.-P. Improved lightweight YOLOv5s Algorithm for Traffic Sign Recognition. In Proceedings of the 2023 3rd International Symposium on Computer Technology and Information Science (ISCTIS), Chengdu, China, 7–9 July 2023; pp. 289–294. [Google Scholar]
  17. Wang, C.Y.; Bochkovskiy, A.; Liao, H.Y.M. YOLOv7: Trainable Bag-of-Freebies Sets New State-of-the-Art for Real-Time Object Detectors. In Proceedings of the IEEE/CVF Conference on Computer Vision and Pattern Recognition (CVPR), Vancouver, BC, Canada, 17–24 June 2023. [Google Scholar]
  18. Yu, G.; Chang, Q.; Lv, W.; Xu, C.; Cui, C.; Ji, W.; Dang, Q.; Deng, K.; Wang, G.; Du, Y.; et al. PP-PicoDet: A Better Real-Time Object Detector on Mobile Devices. arXiv 2021, arXiv:2111.00902. [Google Scholar]
  19. Liu, Y.; Shen, S. Vehicle Detection and Tracking Based on Improved YOLOv8. IEEE Access 2025, 13, 24793–24803. [Google Scholar] [CrossRef]
  20. Pan, Y.; Yang, J.; Zhu, L.; Yao, L.; Zhang, B. Aerial images object detection method based on cross-scale multi-feature fusion. Math. Biosci. Eng. 2023, 20, 16148–16168. [Google Scholar] [PubMed]
  21. Hua, W.; Chen, Q.; Chen, W. A new lightweight network for efficient UAV object detection. Sci. Rep. 2024, 14, 13288. [Google Scholar] [CrossRef] [PubMed]
  22. Ikmel, G.; Najiba, E.A.E.I. Performance Analysis of YOLOv5, YOLOv7, YOLOv8, and YOLOv9 on Road Environment Object Detection: Comparative Study. In Proceedings of the 2024 International Conference on Ubiquitous Networking (UNet), Marrakech, Morocco, 26–28 June 2024; pp. 1–5. [Google Scholar]
  23. Yu, Y.; Zhang, Y.; Cheng, Z.; Song, Z.; Tang, C. MCA: Multidimensional collaborative attention in deep convolutional neural networks for image recognition. Eng. Appl. Artif. Intell. 2023, 126, 107079. [Google Scholar] [CrossRef]
  24. Ma, N.; Zhang, X.; Liu, M.; Sun, J. Activate or Not: Learning Customized Activation. In Proceedings of the 2021 IEEE/CVF Conference on Computer Vision and Pattern Recognition (CVPR), Nashville, TN, USA, 20–25 June 2021; pp. 8028–8038. [Google Scholar]
  25. Howard, A.; Sandler, M.; Chu, G.; Chen, L.C.; Chen, B.; Tan, M.; Wang, W.; Zhu, Y.; Pang, R.; Vasudevan, V.; et al. Searching for MobileNetV3. In Proceedings of the IEEE/CVF International Conference on Computer Vision (ICCV), Seoul, Republic of Korea, 27 October–2 November 2019; pp. 1314–1324. [Google Scholar]
  26. Chollet, F. Xception: Deep Learning with Depthwise Separable Convolutions. In Proceedings of the 2017 IEEE Conference on Computer Vision and Pattern Recognition (CVPR), Honolulu, HI, USA, 21–26 July 2017; pp. 1800–1807. [Google Scholar]
  27. Liu, F.; Xu, H.; Qi, M.; Liu, D.; Wang, J.; Kong, J. Depth-Wise Separable Convolution Attention Module for Garbage Image Classification. Sustainability 2022, 14, 3019. [Google Scholar] [CrossRef]
  28. Yin, A.; Ren, C.; Yan, Z.; Xue, X.; Zhou, Y.; Liu, Y.; Lu, J.; Ding, C. C2S-RoadNet: Road Extraction Model with Depth-Wise Separable Convolution and Self-Attention. Remote Sens. 2023, 15, 4531. [Google Scholar]
  29. Al Amin, R.; Hasan, M.; Wiese, V.; Obermaisser, R. FPGA-Based Real-Time Object Detection and Classification System Using YOLO for Edge Computing. IEEE Access 2024, 12, 73268–73278. [Google Scholar] [CrossRef]
  30. Zhao, Y.; Lu, J.; Li, Q.; Peng, B.; Han, J.; Huang, B. PAHD-YOLOv5: Parallel Attention and Hybrid Dilated Convolution for Autonomous Driving Object Detection. In Proceedings of the 2022 5th International Conference on Pattern Recognition and Artificial Intelligence (PRAI), Chengdu, China, 19–21 August 2022; pp. 418–425. [Google Scholar]
  31. Li, R.; Chen, Y.; Wang, Y.; Sun, C. YOLO-TSF: A Small Traffic Sign Detection Algorithm for Foggy Road Scenes. Electronics 2024, 13, 3477. [Google Scholar] [CrossRef]
  32. Huang, Y.; Wang, F. D-TLDetector: Advancing Traffic Light Detection With a Lightweight Deep Learning Model. IEEE Trans. Intell. Transp. Syst. 2025, 26, 3917–3933. [Google Scholar] [CrossRef]
  33. Wang, Y.; Yang, G.; Guo, J. Vehicle detection in surveillance videos based on YOLOv5 lightweight network. Bull. Pol. Acad. Sci.-Tech. Sci. 2022, 70, e143644. [Google Scholar] [CrossRef]
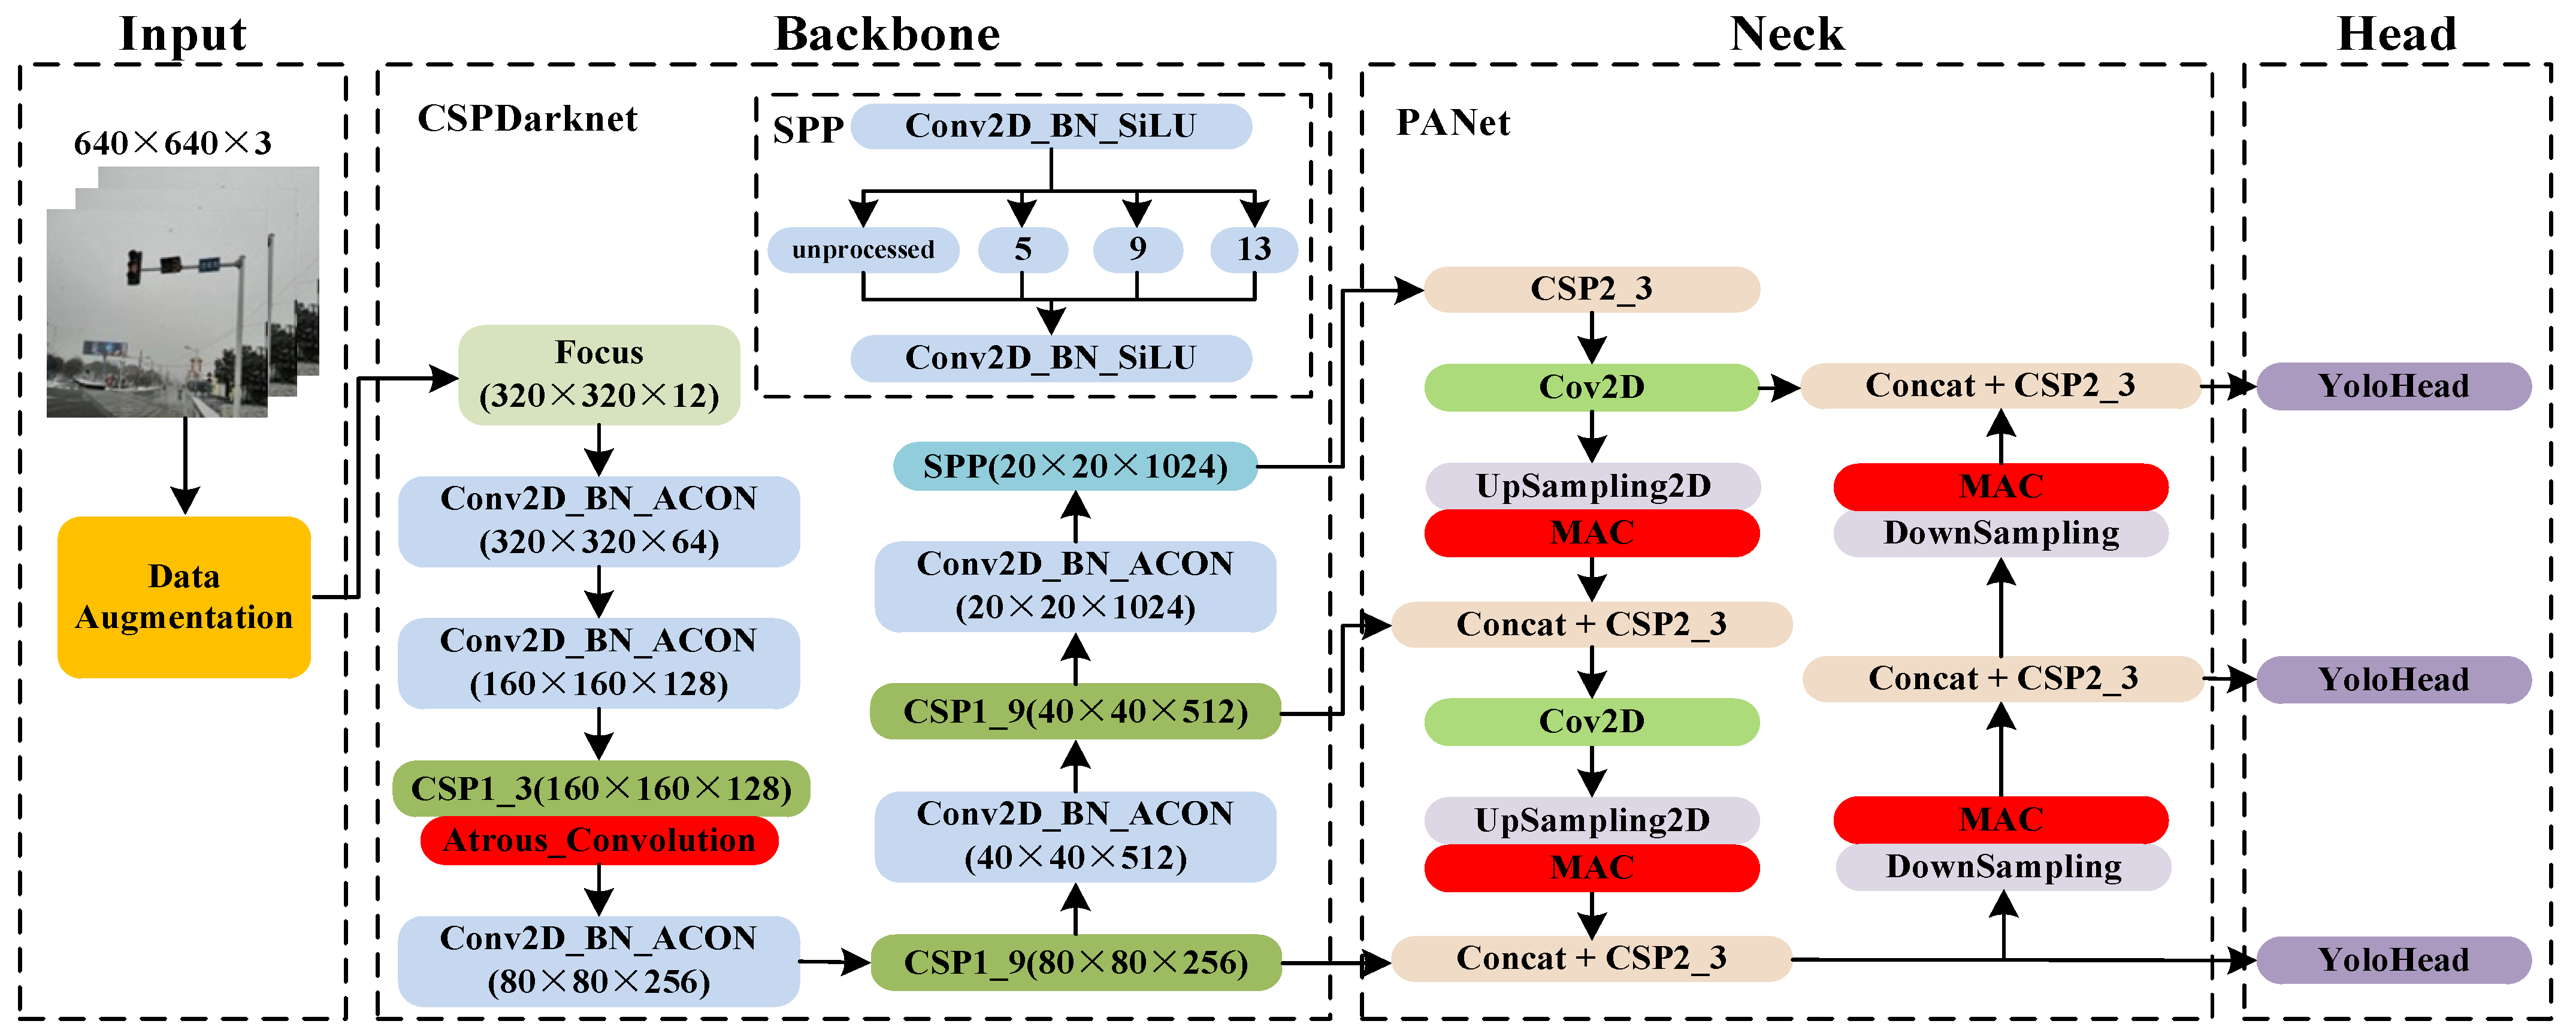
Figure 1. MCA-YOLOv5-ACON Model.
Electronics 14 04396 g001
Figure 2. MobileNetv3 Network Architecture.
Electronics 14 04396 g002
Figure 3. Ordinary Convolution and Depth-wise Separable Convolution. (a) Ordinary Convolution (b) Depth-wise Separable Convolution.
Electronics 14 04396 g003
Figure 4. Optimised PANet Structure.
Electronics 14 04396 g004
Figure 5. MobileNetv3-MCA-YOLOv5 network structure.
Electronics 14 04396 g005
Figure 6. Black Faults.
Electronics 14 04396 g006
Figure 7. Conflict Fault.
Electronics 14 04396 g007
Figure 8. mAP Comparison Chart of Lightweight Model.
Electronics 14 04396 g008
Figure 9. Train Loss Comparison Chart of Lightweight Model.
Electronics 14 04396 g009
Figure 10. Red Conflict Fault (Category 21).
Electronics 14 04396 g010
Figure 11. Green Conflict Fault (Category 18).
Electronics 14 04396 g011
Table 1. Number of Network Model Parameters.
ModelrParameters
MCA-YOLOv5-ACON48,812,541
MobileNetv1-MCA-YOLOv510,235,163
MobileNetv2-MCA-YOLOv58,708,883
MobileNetv3-MCA-YOLOv59,455,421
Table 2. Common Fault Determination Logic Table.
No.Fault TypeFault Description (T: Threshold Time)Fault Name
1black faultNo red light during the signal cyclered black
2black faultNo green light during the signal cyclegreen black
3black faultNo yellow light during the signal cycleyellow black
4black faultNo red/green/yellow lights during the signal cycleall black
5conflict faultsred lights on t > T at the same time during the signal cyclered conflict
6conflict faultsgreen lights on t > T at the same time during the signal cyclegreen conflict
7conflict faultsyellow lights on t > T at the same time during the signal cycleyellow conflict
8conflict faultsred and yellow lights on t > T at the same time during the signal cyclered-yellow conflict
9conflict faultsred and green lights on t > T at the same time during the signal cyclered-green conflict
10conflict faultsyellow and green lights on t > T at the same time during the signal cycleyellow-green conflict
Table 3. Black Faults in One Direction.
NoArray ValueFault Description
1(G = 1, R = 0, Y = 1)red black
2(G = 0, R = 1, Y = 1)green black
3(G = 1, R = 1, Y = 0)yellow black
4(G = 0, R = 0, Y = 1)red-green black
5(G = 0, R = 1, Y = 0)yellow-green black
6(G = 1, R = 0, Y = 0)red-yellow black
7(G = 0, R = 0, Y = 0)All black
Table 4. Number of Images per Signal Color.
Signal ColorNumber
Green1829
Red2051
Yellow1852
Black1067
Table 5. Training Parameter Settings.
ParameterSet Value
MosaicTrue
Mosaic_prob0.45
MixupTrue
Mixup_prob0.50
Train Size2487
Val Size276
Test Size307
Freeze Batch Size8
Unfreeze Batch Size4
Freeze Epoch100
UnFreeze Epoch500
Max Learing Rate0.012
Min Learing Rate0.00012
Momentum0.955
Weight Decay0.0005
Table 6. Lightweight Model Performance Comparison.
ModelmAPPrecisionRecall F 1 Size
(%) (%) (%) (%) (MB)
MCA-YOLOv596.5298.9694.1996.00179.54
MCA-YOLOv5-ACON96.9798.1594.4496.25186.19
MobileNetv3-YOLOv590.0498.6881.1289.2535.12
MobileNetv1-MCA-YOLOv593.2597.1287.2592.0039.04
MobileNetv2-MCA-YOLOv590.0397.8883.5090.0033.23
MobileNetv3-MCA-YOLOv593.5798.5386.8692.2536.06
Table 7. Comparative analysis between our model and other state-of-the-art models.
ModelParametersGFLOPsmAP
(M) (G) (%)
YOLOv7-tiny [32]6.2013.794.63
YOLOv8n [32]3.208.795.41
MobileNetv3-MCA-YOLOv59.4611.898.53
Disclaimer/Publisher’s Note: The statements, opinions and data contained in all publications are solely those of the individual author(s) and contributor(s) and not of MDPI and/or the editor(s). MDPI and/or the editor(s) disclaim responsibility for any injury to people or property resulting from any ideas, methods, instructions or products referred to in the content.