Abstract
Energy efficiency in industrial environments is subject to regulatory and economic constraints. Automated intralogistics systems, such as High Rack Storage Systems (HRSS), exhibit complex and dynamic energy patterns. This paper proposes an unsupervised learning approach that uses Self-Organizing Maps (SOMs) to characterize operational energy states from HRSS measurements (power, voltage, and position). After preprocessing, we train an SOM and apply Watershed segmentation to obtain a topological map of states, and we analyze state transitions with a Markov model to study persistence and switching behavior. The approach yields an interpretable taxonomy of energy use and highlights operating conditions associated with different efficiency levels, as well as central states that influence system behavior. While the study focuses on a single demonstrator, the results suggest that SOM can support explainable monitoring and analysis of industrial energy behavior and may help guide proactive energy-management decisions in Industry 4.0 settings.
1. Introduction
The energy demand of the industrial sector represents a significant challenge in the European ecological transition. In 2022, industry accounted for approximately 25% of final energy consumption in the European Union, according to Eurostat data (Eurostat. (2024). Final energy consumption in industry—detailed statistics. European Commission). This category refers to energy used by sectors, excluding losses from transformation and transport. To address this issue, Directive (EU) 2023/1791 on energy efficiency sets a binding target of reducing final energy consumption by 11.7% by 2030 compared to reference projections, doubling previous commitments and reinforcing legal obligations (Unión Europea. (2023). Directiva (UE) 2023/1791 del Parlamento Europeo y del Consejo de 13 de septiembre de 2023 relativa a la eficiencia energética y por la que se modifica el Reglamento (UE) 2023/955. Diario Oficial de la Unión Europea). In line with this policy, the Spanish National Integrated Energy and Climate Plan 2021–2030 (PNIEC) (Gobierno de España—Ministerio para la Transición Ecológica y el Reto Demográfico (MITECO), (2020). Plan Nacional Integrado de Energía y Clima (PNIEC) 2021–2030) identifies industrial energy efficiency as one of the strategic pillars for decarbonizing the Spanish economy, highlighting the potential for improvement through intelligent energy management and automation technologies.
Industrial organizations therefore face growing pressure from investors, customers, and regulators to demonstrate commitment to reducing carbon emissions, making energy efficiency both an economic and strategic priority. Automated storage systems illustrate this challenge well. These systems, widely used in industrial environments for inventory management and automated material handling, integrate multiple electromechanical components that operate in coordination, such as conveyor belts, motorized vertical rails, position sensors, and programmable control systems. Their complexity results in dynamic and multivariate energy consumption patterns, where overall efficiency depends not only on the performance of individual components but also on their temporal interactions. At the same time, the development of regulatory frameworks for renewable self-consumption, such as net-metering and net-billing systems implemented in various countries [1], is shaping an energy ecosystem that promotes the adoption of energy optimization solutions in industrial environments. Despite the continuous generation of large volumes of operational data through integrated sensors including power, voltage, position, and activation states, there remains a technological gap between the abundance of available data and its effective use for energy optimization [2]. Current control systems are predominantly reactive, responding only to past events, and they lack the ability to proactively adjust operating parameters to minimize energy consumption without compromising functionality. This limitation is compounded by the stochastic nature of consumption patterns, where transitions between operating states generate unpredictable peaks in energy demand [3].
The motivation for developing intelligent solutions rests on three main pillars: economic, since optimization can reduce costs by 15–30% according to recent studies [4]; regulatory, given the growing number of legal obligations and penalties for non-compliance; and environmental, as intelligent energy management systems improve efficiency while also providing strategic value. Their implementation strengthens corporate image, facilitates access to sustainable financing, and contributes to achieving the Sustainable Development Goals established in the 2030 Agenda, particularly SDGs 7, 9, and 13 (Naciones Unidas. (2015). Transformar nuestro mundo: la Agenda 2030 para el Desarrollo Sostenible. Resolución A/RES/70/1 de la Asamblea General de la ONU.). The current technological context offers favorable conditions for applying advanced artificial intelligence techniques to industrial energy optimization. The proliferation of low-cost, high-precision IoT sensors has enabled access to real-time operational data, while the exponential increase in computational capacity supports the application of complex machine learning algorithms in industrial environments [5]. The availability of machine learning frameworks such as TensorFlow and PyTorch, together with the growing volume of data generated by industrial IoT sensors, has facilitated the development of AI-based systems for energy analysis. Self-Organizing Maps (SOM), a type of neural network for unsupervised learning, allow the identification of patterns in multivariate data and the derivation of discrete events from continuous signals [6], providing an approach to segment operational states and characterize energy performance in complex systems.
The integration of these techniques into industrial energy optimization systems is the research focus of this work.
This paper is organized into six main sections. Following this introduction, Section 2 presents a systematic review of the state of the art on unsupervised learning techniques applied to energy optimization in industrial systems, with particular emphasis on Self-Organizing Maps. Section 3 details the methodology employed, including exploratory data analysis of the HRSS system, the design and training of the SOM model, and the segmentation procedures using Watershed and transition analysis with Markov models. Section 4 presents the results obtained, covering the topological structure of energy states, transition dynamics, operational cycles, and identified critical sequences. Section 5 discusses the implications of the findings, the limitations of the study, and future research directions. Finally, Section 6 synthesizes the main conclusions and the practical value of the proposed methodology for proactive energy management in Industry 4.0 environments.
2. State of the Art
For this paper, a state-of-the-art review has been conducted focusing on the application of unsupervised learning techniques for the characterization and optimization of energy in automated industrial systems. The following key contributions and trends have been identified in the literature:
De Santana et al. [7] apply data mining techniques to improve energy efficiency in the auxiliary services of a petrochemical plant. Their study focuses on analyzing operational data to identify optimization opportunities through clustering and pattern analysis, and was implemented in a real industrial environment.
Gao et al. [8] propose a hybrid methodology combining machine learning with evolutionary algorithms for energy-efficient buffer and service rate allocation in manufacturing systems. Clustering techniques are used as part of a broader energy optimization framework, specifically applied to material handling systems.
In the context of automated storage systems, Zhou et al. [9] present multi-objective evolutionary algorithms for integrated production and maintenance scheduling with energy considerations. Their approach includes segmentation techniques for identifying operational configurations, although the primary focus is on multi-objective optimization rather than energy characterization.
Overall, the reviewed studies consistently identify unsupervised clustering techniques, particularly SOM, as viable methodologies for analyzing energy patterns in industrial systems, especially when structured prior knowledge of operational states is unavailable.
In the domain of robotics, Wang et al. [10] propose energy-efficient trajectory planning for industrial robots using parallel deep reinforcement learning. Their work emphasizes the role of optimization in reducing energy consumption during motion operations, complementing the broader objective of identifying efficient operational states through clustering techniques.
Bonci et al. [11] apply Deep Echo State Networks (DeepESN) for predictive maintenance based on energy data. Although their approach is supervised, it reinforces the relevance of energy-based anomaly detection, a task that SOM can address through unsupervised segmentation of operational states.
Ma [12] develops AI-driven decision support systems for sustainable energy management in smart cities. While the application context is urban rather than industrial, the conceptual framework for integrating multiple data sources and optimization algorithms is relevant to large-scale energy-aware systems, including industrial intralogistics.
Recent developments in industrial energy management reflect a shift toward more sophisticated control systems that integrate multiple operational objectives, including energy efficiency, productivity, and environmental sustainability. This transition from single-objective to multi-objective optimization aligns with the increasing complexity of industrial environments, where unsupervised learning techniques such as SOM can contribute to the segmentation and interpretation of operational states.
Guo et al. [13] propose energy-efficient learning algorithms for green wireless sensor networks in terminal-edge collaborative architectures. Although focused on communication networks, the underlying principles of distributed energy optimization are applicable to industrial systems where SOM can be used to cluster sensor data and identify energy-relevant patterns in decentralized environments.
Tieng et al. [14] implement an explainable AI-based facility control system designed to reduce energy consumption and carbon emissions. Their emphasis on interpretability complements the use of SOM, which provides topological mappings of operational states that can be visualized and understood without requiring labeled data.
The reviewed literature also highlights the consolidation of artificial intelligence techniques for predictive maintenance and monitoring in industrial systems. Akyaz and Engin [15] develop a machine learning-based predictive maintenance system for artificial yarn machines, using operational data to anticipate intervention needs. While their approach is supervised, the task of identifying anomalous energy patterns is closely related to SOM’s capability to detect deviations from normal operational states.
Mou et al. [16] present a machine learning approach for energy-efficient scheduling in intelligent transportation systems under dynamic conditions. Although focused on routing and scheduling, their work reinforces the importance of adaptive decision-making based on operational context, supporting the use of SOM to identify and respond to energy-critical transitions.
Cirera et al. [17] propose a data-driven optimization method for industrial refrigeration systems, integrating demand forecasting with control strategies. Their approach demonstrates the value of unsupervised segmentation in identifying consumption patterns, which can be enhanced through SOM-based clustering of operational states.
Ayadi et al. [18] contribute deep learning-based soft sensors for flexible automation in industrial environments. Their work addresses the estimation of unmeasured process variables, a challenge that SOM can support by clustering multivariate sensor data to infer latent operational conditions.
Pathak [19] explores energy savings through synergistic innovation and digitalization in the pulp and paper industry. His study identifies opportunities for technological integration that align with the use of SOM in digital industrial ecosystems, where unsupervised learning can support energy-aware automation.
Finally, Morteza et al. [20] analyze the role of Industry 4.0 technologies in promoting energy sustainability. Their interpretive structural model maps the interrelations between various energy functions, providing a conceptual foundation for integrating SOM into broader frameworks for intelligent energy management in manufacturing systems.
In summary, recent research confirms a growing reliance on artificial intelligence techniques for industrial energy optimization, with unsupervised learning methods playing a particularly relevant role when labeled data or explicit event signals are not available. SOM stand out as a recurrent approach for clustering operational states, detecting anomalies, and supporting interpretable visualizations of system behavior. However, most studies remain limited to specific industrial contexts or focus primarily on predictive maintenance rather than comprehensive energy characterization. This reveals a gap in the literature concerning the systematic application of SOM to intralogistic environments, where complex multivariate signals and dynamic interactions govern energy performance. Addressing this gap, the present work proposes an SOM-based framework to characterize operational states in automated storage systems and to provide an interpretable foundation for proactive energy management in Industry 4.0 settings (Figure 1).
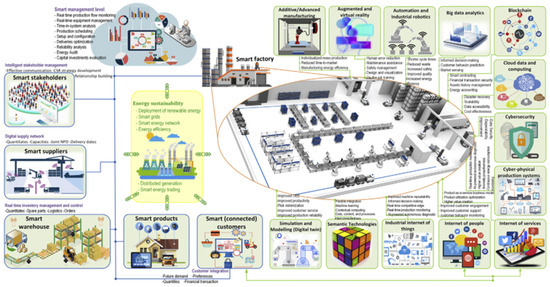
Figure 1.
Schematic representation of Industry 4.0 architecture. Source: Pathak (2024).
Recent research on artificial intelligence for industrial energy management can be grouped into three main directions. First, data-driven optimization studies [7,8,9] apply clustering or hybrid machine-learning and evolutionary algorithms to improve process efficiency, yet these approaches focus on optimization objectives rather than the interpretable segmentation of operational states. Second, predictive-maintenance frameworks [11,15] employ deep or supervised networks to forecast failures from energy data, providing accurate prediction but limited transparency and requiring labeled anomalies. Third, explainable-AI and control-oriented systems [14,17] highlight the need for interpretable models but typically rely on explicit event markers or simplified dynamics that overlook continuous energy variability.
Across these domains, unsupervised methods particularly Self-Organizing Maps (SOMs) have been recognized for their ability to uncover latent operational patterns without prior labels. However, previous works rarely link the resulting clusters to temporal behavior or physical energy meaning. Most studies analyze static snapshots of energy consumption, whereas industrial systems operate through dynamic transitions between states that determine overall efficiency. Despite the increasing adoption of Self-Organizing Maps (SOMs) and related techniques, few studies have systematically integrated topological SOM clustering with temporal transition analysis. This work bridges that gap by introducing a hybrid SOM–Watershed and Markov-transition framework that jointly captures the spatial organization and temporal dynamics of energy states, providing an interpretable and physically grounded representation of industrial energy behavior.
3. Materials and Methods
3.1. Exploratory Data Analysis
An exploratory analysis was performed to identify components and operational cycles with the greatest potential for energy optimization. This step focused on characterizing the energy behavior of the High Rack Storage System (HRSS) under normal operating conditions, providing the foundation for subsequent unsupervised segmentation using Self-Organizing Maps (SOM).
3.1.1. Dataset Description
The study uses the HRSS dataset collected from a real automated intralogistics demonstrator developed by SmartFactoryOWL in collaboration with the Institute Industrial IT (inIT), Lemgo, Germany. The HRSS is designed as an Industry 4.0 testbed for analyzing operational efficiency and anomaly detection in automated storage and retrieval processes. Further information about the demonstrator and its architecture can be found in the SmartFactoryOWL website https://smartfactory-owl.de/ (accessed on 27 October 2025). The system comprises four conveyor belts (BLO, BHL, BHR, BRU) and two vertical rails (HR, HL). The central conveyors (BHL and BHR) are mounted on the rails and can move vertically, while BLO and BRU remain fixed. Each conveyor is equipped with inductive sensors for object detection and position tracking. The system is controlled by a programmable logic controller (PLC) compliant with IEC 61131 standards, which simulates typical material flow in industrial environments.
The dataset contains 25,907 time-stamped records collected under normal operating conditions, including synchronized measurements of position, power, and voltage for the six main components. Variables are grouped into four categories: (i) temporal (timestamp), (ii) positional (e.g., I_w_BLO_Weg), (iii) power (e.g., O_w_HR_power), and (iv) voltage (e.g., O_w_BHL_voltage). All signals were preprocessed through missing-value imputation and Z-score normalization to ensure consistency across features.
3.1.2. Exploratory Energy Analysis
To establish a reference for energy performance, a baseline was calculated for each component using the 25th percentile of its active power distribution. Only active states were considered, filtering out idle periods with thresholds of 100 W for conveyors and 500 W for vertical rails. This procedure ensures that the baseline reflects typical operating conditions rather than transient noise.
The comparison between baseline and mean active power revealed significant variability across components. Although BRU and BHR exhibited minimal deviation from their baselines, components such as BHL, HR, and HL showed substantial gaps, indicating a higher optimization potential. These findings motivated the application of unsupervised learning techniques to segment operational states according to their energy efficiency.
Furthermore, temporal analysis of the total power of the system highlighted frequent and abrupt variations, with an average change every 37 ms. This dynamic behavior reinforces the need for models capable of capturing multivariate patterns and transitions between operating states, a requirement addressed through SOM in the following section.
3.1.3. Exploratory Energy Analysis (PCA)
To identify dominant energy patterns and reduce dimensionality, a Principal Component Analysis (PCA) was applied to the six power variables of the HRSS components. All features were standardized using Z-score normalization to mitigate scale differences. The first three principal components explained 78% of the total variance, with PC1 and PC2 together accounting for 59.3% refer to Table 1.

Table 1.
Principal component loadings for the first three axes.
The loading structure revealed two main functional clusters: (i) BHR and HR with strong positive contributions to PC1, and (ii) BHL, HL, and BLO with negative loadings, while BRU showed an independent behavior in PC2. These results indicate heterogeneous energy dynamics across components, supporting the need for unsupervised segmentation to capture operational states with distinct energy profiles. The combination of Principal Component Analysis (PCA) and Self-Organizing Maps (SOMs) was adopted to ensure a balance between interpretability and clustering performance. PCA provides a transparent linear transformation that reduces redundancy among correlated process variables while preserving their physical meaning in terms of power, voltage, and positional behavior.
3.2. SOM Modeling
The objective of the SOM within the energy optimization framework is to generate a topological representation of the normal operating states of the HRSS, classifying each state according to its energy performance index. This representation serves three purposes: (i) establishing a reference map of normal energy behavior that enables deviation detection through distance calculations to the BMU, (ii) identifying regions of high and low energy efficiency to guide optimization strategies, and (iii) providing an automatic segmentation of operating states to support the analysis of temporal transitions.
The model was trained using power, voltage, and position variables from the six main components, excluding timestamps and labels as they do not provide relevant energy information. Preprocessing included missing-value imputation via linear interpolation, outlier detection using the interquartile range criterion (Q1 − 1.5 × IQR and Q3 + 1.5 × IQR), and Z-score normalization to ensure homogeneous variable scales. Additionally, all numeric variables, including power, voltage, and position signals, were concatenated into a unified feature matrix after standardization. The “position” variables were incorporated directly in their normalized numeric form without derivative computation, as the objective of this stage was to capture global energy behavior rather than detailed kinematic dynamics. These details have been explicitly included to ensure reproducibility of the preprocessing workflow. The SOM architecture was implemented as a two-dimensional rectangular grid, with dimensions determined using an adaptive heuristic based on dataset size. The number of neurons followed the empirical rule , where n is the number of training samples. For 25,907 records, this yielded approximately 806 neurons, distributed in a grid to maintain balanced proportions.
The weight space dimensionality was set to 18, corresponding to the number of input variables after preprocessing. Each neuron in the grid is defined by a weight vector:
where each component corresponds to a specific variable. Training was carried out with the Kohonen algorithm using exponential decay for both the learning rate and the neighborhood radius. For each input vector , the BMU is identified as:
and weight updates are applied as
where is the learning rate and is the neighborhood function.
The neighborhood function follows a Gaussian distribution:
where is the Euclidean distance between the BMU and neuron on the SOM grid.
The grid size and aspect ratio of the SOM were determined automatically using a heuristic proportional to the square root of the number of samples (), adjusted according to the principal-component variance ratio to preserve the data topology. Training was performed with a learning rate of 0.5, an initial neighborhood radius , and 1000 iterations using the Gaussian neighborhood function implemented in MiniSom. After training, the Watershed segmentation was applied to the inverted U-matrix () to detect clusters as topological basins, where local maxima were selected as region markers.
Temporal decay of parameters was modeled with exponential functions:
where and represent the time constants for decay.
The training procedure is summarized in Algorithm 1.
| Algorithm 1: SOM Training Procedure |
 |
After training, the U-matrix was computed as the average distance between each neuron and its immediate neighbors. For neuron :
where is the set of immediate neighbors (8-connectivity), and denotes Euclidean distance.
Energy performance evaluation was based on an index relating observed consumption to the baseline established in the exploratory analysis. For each neuron, the mean energy performance index of its assigned samples was computed. The index for each component c is defined as
and the global index as
Segmentation of the U-matrix was performed with the Watershed algorithm, treating the matrix as a topographic surface. The U-matrix was inverted before segmentation, since Watershed identifies basins as regions, whereas here the regions of interest correspond to high U-matrix values.
For each cluster k, characterization metrics were computed: number of assigned samples, average component power, standard deviation of consumption, mean energy performance index, and dominant energy state. This allowed the physical interpretation of clusters representing specific operating states of the HRSS.
Finally, a temporal transition analysis was carried out to characterize the dynamic behavior of the HRSS. Each observation was assigned to its BMU and corresponding cluster, generating a sequence of states over time. Based on this sequence, a Markov transition matrix was constructed, with rows representing current states and columns representing subsequent states, normalized to obtain conditional probabilities. Transition entropy was calculated for each state to quantify stability, where high entropy indicates multiple possible evolutions and low entropy reflects stable trajectories.
4. Results
The results are organized according to the methodological workflow, from the topological characterization of energy states with Self-Organizing Maps (SOMs) to the analysis of temporal dynamics and critical sequences.
4.1. Topological Structure and U-Matrix
Applying the Watershed algorithm to the U-matrix produced 52 initial regions, of which 48 contained sufficient sample assignments for subsequent statistical analysis and were retained as the effective clusters of the model. This automatic segmentation yields an operational taxonomy of the HRSS that captures energy variability across the six main components.
The learned topology is illustrated with three complementary views (Figure 2): (i) a 2D U-matrix, where high-dissimilarity boundaries (yellow) separate distinct operating configurations and low-dissimilarity areas (blue) group similar patterns; (ii) a 3D surface that highlights topological valleys associated with stable configurations; and (iii) an energy-efficiency map that labels each cluster according to its performance index relative to the baseline (green = near-optimal; red = significant gaps).

Figure 2.
U-matrix and energy-efficiency map.
Overall, the SOM reveals heterogeneous operating configurations with different efficiency levels. The prevalence of medium-to-low efficiency clusters is consistent with the gaps previously observed for BHL, HR, and HL. This topology provides a basis for automatically identifying transitions toward more efficient states while preserving system functionality.
4.2. Operational Dynamics and Transitions
Once the SOM-based taxonomy of states was established, we analyzed temporal transitions among the identified configurations. The state-transition graph (Figure 3) was derived from the BMU assignments of the 25,907 time-stamped samples, producing discrete state sequences over time. The resulting graph comprises 48 nodes and 929 edges, with a connection density of 0.41. Connectivity concentrates in a central region, indicating hub states from which the system can reach multiple alternatives. Transitions are more frequent between states with similar efficiency, whereas moves between opposite categories are less common.
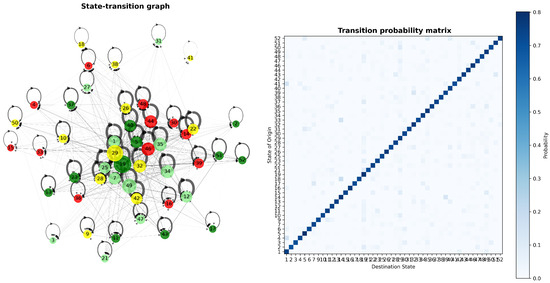
Figure 3.
State-transition graph and transition probability matrix.
The transition probability matrix exhibits a dominant diagonal, with self-transition probabilities above 0.8 for most states, evidencing strong operational inertia. Probabilities for transitions between different states are mostly below 0.2, indicating that configuration changes are relatively infrequent under normal HRSS operation. Centrality analysis identifies states 29, 19, 46, 49, 25, 35, and 32 as hubs, characterized by high in- and out-degree and acting as strategic nodes for intervention.
4.3. Operational Cycles
A coefficient of variation of 71.7% indicates high inconsistency in standard transport sequence durations. Short cycles (25 samples) correspond to direct transfers that minimize waiting configurations. Long cycles (>325 samples) reflect extended stops in BHL, HR, and HL components previously identified as major contributors to energy gaps. These findings support prioritizing interventions in sequences exceeding ∼240 samples, where additional time translates into unproductive energy consumption (Table 2).
Table 2.
Operational cycle characteristics of the HRSS.
4.4. Transition Structure, Entropy, and Hubs
State-wise transition entropy ranges from 0 to 1.2, with an average of 0.288 (Figure 4). Higher-entropy states (1, 2, 5, 29–35, 42–49) act as branching points where the system can evolve toward multiple configurations. Several of these overlap with the hub set (29, 19, 46, 49, 25, 35, 32), reinforcing their role as bifurcation nodes that influence subsequent energy demand.
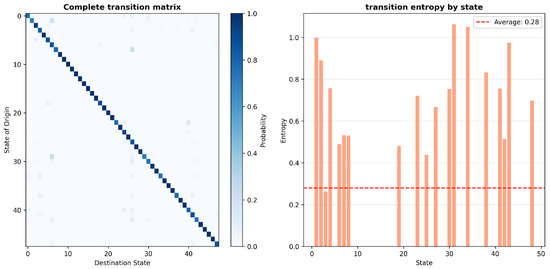
Figure 4.
Complete transition matrix and transition entropy by state.
4.5. Energy Distribution by State and Critical Sequences
The transition graph filtered by probabilities >0.1 (Figure 5) shows nodes colored by energy class (dark green = OPTIMAL; light green = EFFICIENT; yellow = NORMAL; orange = SUBOPTIMAL; red = INEFFICIENT). Classes are heterogeneously distributed across the topology rather than forming cohesive clusters, suggesting that the HRSS does not follow direct preferential routes toward high-efficiency states and may require passages through less efficient states to reach optimal configurations. Each identified energy-consumption state was subsequently interpreted in relation to the physical operation of the HRSS. Clusters with low total power and short activation periods correspond to idle standby or positioning without load phases, whereas medium-efficiency states are typically associated with cargo access and walking movements. The lowest-efficiency states INEFFICIENT were characterized by prolonged activation at high power levels and irreular transition sequences, reflecting loaded lifting or suboptimal movement patterns. Conversely, OPTIMAL and EFFICIENT states coincided with balanced operation cycles, stable voltage profiles, and minimal idle durations.
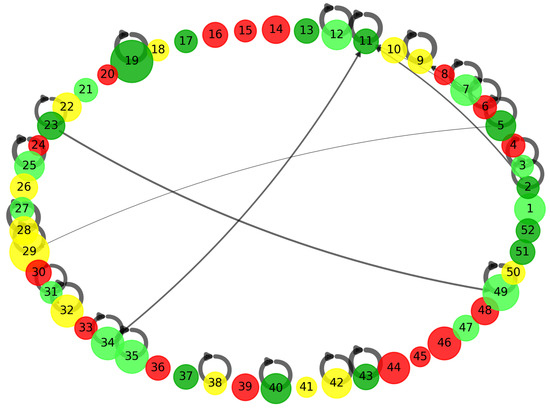
Figure 5.
Transition graph with probabilities above 0.1 (nodes colored by energy class).
The temporal evolution (Figure 6) and Temporal sequence of states (Figure 7) reveals three operational bands: (i) an upper band oscillating among OPTIMAL and EFFICIENT states (35–48), (ii) an intermediate band dominated by NORMAL states (20–30), and (iii) a lower band with transitions among OPTIMAL, EFFICIENT, and INEFFICIENT states (1–10). Vertical transitions between bands are infrequent. The time distribution by class indicates that the system operates in EFFICIENT states for 49.8% of the time and in OPTIMAL states for 13.8%, while INEFFICIENT states account for 15.9%. This distribution implies an 398 estimated potential energy improvement of approximately 8 states were reduced through control adjustments. These values are obtained directly from 400 the transition and duration analysis implemented in the TransitionAnalyzer module.
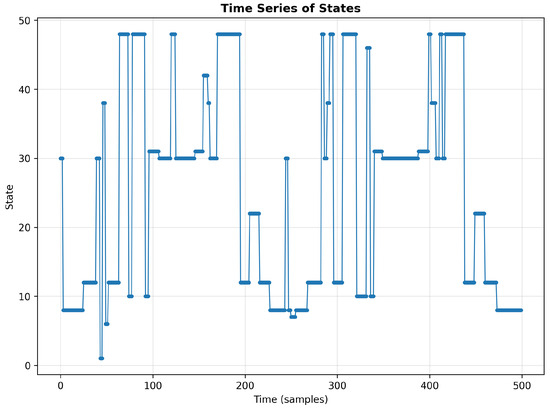
Figure 6.
Temporal sequence of states (first 1000 samples).
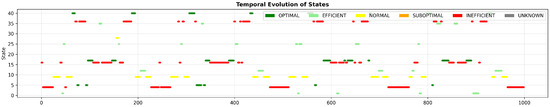
Figure 7.
Temporal evolution of states and time distribution by class.
Figure 8 illustrates the most frequent transition sequences leading to inefficient states. Each horizontal bar shows the frequency of a specific sequence of operational states that most often lead to inefficient configurations Repeated patterns such as or indicate prolonged residence in a single state typically sustained motor or lift activation without effective load movement resulting in elevated power consumption with limited productive output. The most frequent involves prolonged persistence in state 6 (868 occurrences), followed by repetitions of state 48 (606 occurrences) and combinations of states 37, 48, and 7. These configurations activate multiple components without effective load movement, producing energy consumption with limited productive output. The transition subgraph among states 48, 7, 3, and 6 is particularly dense, confirming their joint contribution to energy losses.
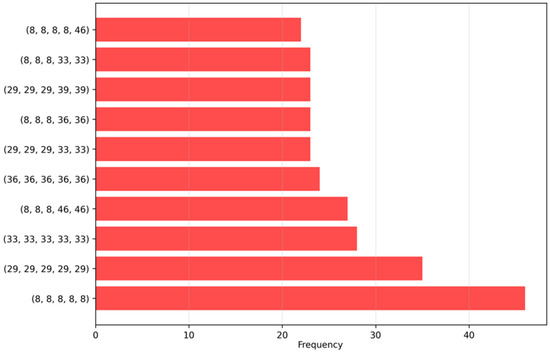
Figure 8.
Top sequences leading to INEFFICIENT states.
4.6. SOM–Watershed Comparison with Other Clustering Methods
To assess the relative performance of the proposed SOM–Watershed framework, we conducted a quantitative benchmark against conventional clustering approaches, including K-Means and DBSCAN, both applied to the same normalized feature space.
Table 3 summarizes the obtained results.
Table 3.
Comparison of clustering methods.
The analysis revealed clear differences among the methods. DBSCAN produced a very large number of micro-clusters (over one thousand) with a sparse transition matrix, yielding low entropy values that were not meaningful due to insufficient connectivity. K-Means generated around fifty clusters with moderate stability but relatively high transition entropy, indicating fragmented state transitions. In contrast, the SOM–Watershed approach resulted in twenty-two interpretable energy states, with the highest temporal stability (average dwell time = 6.25 samples), balanced connectivity (matrix density = 0.36), and dominant transition patterns (share of ), suggesting a more ordered and reproducible state partitioning.
Overall, these results indicate that the SOM–Watershed method achieves the most balanced trade-off between segmentation granularity, temporal coherence, and interpretability, whereas K-Means tends to over-fragment and DBSCAN severely over-segments the feature space, as summarized in Table 3.
5. Discussion
This study successfully demonstrates the viability of using unsupervised learning techniques, specifically Self-Organizing Maps (SOMs), to automatically identify energy inefficiencies within automated intralogistics systems. The methodology presented provides a repeatable framework for characterising operational states and analysing their energy performance using authentic industrial data. A key finding is that energy optimization cannot be applied uniformly across all operational states. The significant energy variability observed indicates that the system’s configuration and dynamic operational behaviours have a greater impact on its energy performance than its nominal design characteristics. This highlights the particular relevance of unsupervised learning techniques for energy optimization in intralogistics and suggests their potential applicability in a wide array of other industrial domains. By overcoming the limitations of conventional reactive control strategies, this approach offers a more comprehensive understanding of system behaviour. Its unsupervised nature also reduces the reliance on expert knowledge, which makes the methodology more transferable to different industrial contexts.
The SOM-based clustering provides a physically interpretable representation of the HRSS operation. Each identified energy state corresponds to a combination of mechanical and electrical conditions such as loaded lifting, horizontal travel, idle standby, or transition between motion phases. The associated efficiency levels reflect the ratio between the measured power consumption and the baseline nominal power of each subsystem, offering a direct link between data-driven states and physical system behavior. Although the Self-Organizing Map (SOM) is a well-established and classical technique, its topology-preserving and interpretable structure remains highly valuable for applications that require transparency and reproducibility, such as industrial energy analysis. The deliberate use of a mature unsupervised method in this work prioritizes explainability over algorithmic novelty, enabling direct physical interpretation of energy states and transitions.
The proposed SOM–Markov framework could be integrated into existing industrial environments to support proactive energy management and decision-making. In practice, the trained model could interface with PLC or SCADA infrastructures to continuously map real-time sensor data to the closest energy state, enabling visualization of efficiency levels and early detection of deviations from normal operation. Moreover, by revealing high-consumption or recurrent inefficient sequences, the framework could guide engineers in prioritizing control-logic adjustments or maintenance actions that contribute to measurable energy savings. The interpretable structure of the SOM and transition graph may also facilitate the development of rule-based alarms that alert operators when the system enters a critical energy pattern. As new data become available, the model could be periodically retrained, allowing adaptive and evolving monitoring capabilities.
Despite these insights, the research has a number of limitations. The experimental validation was confined to a single system under controlled conditions, which restricts the external validity and generalisability of the findings. To address this, further empirical evaluation would be needed to extend the methodology to systems with different configurations or more complex operational patterns. Furthermore, while the study is effective at detecting inefficiencies, it does not propose or implement corrective actions. This limits its immediate practical application and creates a clear direction for future work. Another limitation of this study is the limited availability of suitable industrial datasets. Energy-focused operational data from real production systems are rarely accessible, which constrains large-scale validation and benchmarking.
Building on these foundations, future research could focus on validating the methodology across a wider range of automated storage systems to assess its robustness and generalisability. Longitudinal studies in real-world operational settings would be invaluable for evaluating the temporal stability of the identified energy patterns and measuring the effectiveness of any optimization measures that are implemented. A crucial next step is integrating this diagnostic approach with real-time control systems, transitioning from simple diagnosis to active operational optimization. Research in this area could also explore issues of reliability, safety, and graceful degradation under fault conditions.
Future developments of this framework will investigate complementary feature-engineering strategies and hybrid extensions that combine SOM interpretability with modern deep-representation learning, aiming to enhance scalability and generalization. Ultimately, combining this methodology with broader industrial self-consumption and renewable energy strategies could unlock new opportunities for holistic energy optimization within Industry 4.0 environments, including a detailed scalability assessment of the algorithm across increasing input dimensions and sampling frequencies.
6. Conclusions
This work makes three key contributions to interpretable industrial energy analytics. First, it introduces a hybrid SOM–Watershed and transition-graph framework that jointly captures the spatial and temporal behaviour of the HRSS energy system. Second, it proposes a component-level efficiency mapping approach that exposes localized performance differences across subsystems. Third, it establishes an interpretable symbolic representation of operational states directly linked to measurable physical machine behaviour. The integration of Self-Organizing Maps (SOMs) with energy performance metrics provides a practical approach for segmenting operational states and identifying patterns linked to inefficiency. This method supports a more comprehensive understanding of system behaviour and overcomes the limitations of reactive control strategies often used in industrial environments.
Author Contributions
Conceptualization, M.J., J.P.D., F.D.l.P.P. and L.G.-P.; methodology, M.J.; writing—original draft preparation, M.J. and J.P.D.; writing—review and editing, M.J. and J.P.D.; supervision, J.P.D., L.G.-P. and F.D.l.P.P. All authors have read and agreed to the published version of the manuscript.
Funding
This research received no external funding.
Data Availability Statement
The original contributions presented in this study are included in the article. Further inquiries can be directed to the corresponding authors.
Acknowledgments
This research is part of the International Chair Project on Trustworthy Artificial Intelligence and Demographic Challenge within the National Strategy for Artificial Intelligence (ENIA), in the framework of the European Recovery, Transformation and Resilience Plan. Referencia: TSI-100933-2023-0001. This project is funded by the Secretary of State for Digitalization and Artificial Intelligence and by the European Union(Next Generation).DEMIA.
Conflicts of Interest
The authors declare no conflicts of interest.
References
- Ordóñez, Á.; Sánchez, E.; Rozas, L.; García, R.; Parra-Domínguez, J. Net-metering and net-billing in photovoltaic self-consumption: The cases of Ecuador and Spain. Sustain. Energy Technol. Assess. 2022, 53, 102434. [Google Scholar] [CrossRef]
- Wang, W.; Yang, H.; Zhang, Y.; Xu, J. IoT-enabled real-time energy efficiency optimisation method for energy-intensive manufacturing enterprises. Int. J. Comput. Integr. Manuf. 2018, 31, 362–379. [Google Scholar] [CrossRef]
- Cao, Z.; Han, X.; Lyons, W.; O’Rourke, F. Energy management optimisation using a combined Long Short-Term Memory recurrent neural network—Particle Swarm Optimisation model. J. Clean. Prod. 2021, 326, 129246. [Google Scholar] [CrossRef]
- Liu, J.; Qian, Y.; Yang, Y.; Yang, Z. Can Artificial Intelligence Improve the Energy Efficiency of Manufacturing Companies? Evidence from China. Int. J. Environ. Res. Public Health 2022, 19, 2091. [Google Scholar] [CrossRef] [PubMed]
- Alex, B.; Johnson, M. A Framework for IoT-Enabled Smart Manufacturing for Energy and Resource Optimization. arXiv 2025, arXiv:2502.03040. [Google Scholar]
- Birgelen, A.V.; Niggemann, O. Using self-organizing maps to learn hybrid timed automata in absence of discrete events. In Proceedings of the IEEE International Conference on Emerging Technologies and Factory Automation, ETFA, Limassol, Cyprus, 12–15 September 2017; pp. 1–8. [Google Scholar] [CrossRef]
- de Santana, D.M.; Lourenco, S.R.; Cassiano, D.A. Data mining approach for energy efficiency improvements in a utilities supply on a petrochemical plant. Evol. Syst. 2023, 14, 1071–1081. [Google Scholar] [CrossRef]
- Gao, S.X.; Liu, H.; Ota, J. Energy-efficient buffer and service rate allocation in manufacturing systems using hybrid machine learning and evolutionary algorithms. Adv. Manuf. 2024, 12, 227–251. [Google Scholar] [CrossRef]
- Zhou, B.; Li, X.; Liu, W. Hybrid multi-objective opposite-learning evolutionary algorithm for integrated production and maintenance scheduling with energy consideration. Neural Comput. Appl. 2021, 33, 1587–1605. [Google Scholar] [CrossRef]
- Wang, X.; Cao, J.; Cao, Y.; Zou, F. Energy-efficient trajectory planning for a class of industrial robots using parallel deep reinforcement learning. Nonlinear Dyn. 2025, 113, 8491–8511. [Google Scholar] [CrossRef]
- Bonci, A.; Fredianelli, L.; Kermenov, R.; Longarini, L.; Longhi, S.; Pompei, G.; Prist, M.; Verdini, C. DeepESN Neural Networks for Industrial Predictive Maintenance through Anomaly Detection from Production Energy Data. Appl. Sci. 2024, 14, 8686. [Google Scholar] [CrossRef]
- Ma, N. Artificial Intelligence-Driven Decision Support Systems for Sustainable Energy Management in Smart Cities. Int. J. Adv. Comput. Sci. Appl. 2024, 15, 523–529. [Google Scholar] [CrossRef]
- Guo, H.; Wu, R.; Ma, Y.; Li, Y.; Li, S.; Qi, B.; Sun, Y. Learning-Based Terminal-Edge Collaborative Energy-Efficient Routing Algorithm for Green RWSN. IEEE Trans. Ind. Inform. 2024, 20, 9037–9047. [Google Scholar] [CrossRef]
- Tieng, H.; Lai, C.Y.; Fan, S.X.; Wu, T.Q. Explainable AI-based facility control system for energy saving and carbon reduction. J. Mech. Sci. Technol. 2025, 39, 2301–2310. [Google Scholar] [CrossRef]
- Akyaz, T.; Engin, D. Machine Learning-Based Predictive Maintenance System for Artificial Yarn Machines. IEEE Access 2024, 12, 125446–125461. [Google Scholar] [CrossRef]
- Mou, J.; Gao, K.; Duan, P.; Li, J.; Garg, A.; Sharma, R. A Machine Learning Approach for Energy-Efficient Intelligent Transportation Scheduling Problem in a Real-World Dynamic Circumstances. IEEE Trans. Intell. Transp. Syst. 2023, 24, 15527–15539. [Google Scholar] [CrossRef]
- Cirera, J.; Carino, J.A.; Zurita, D.; Ortega, J.A. A data-driven-based industrial refrigeration optimization method considering demand forecasting. Processes 2020, 8, 617. [Google Scholar] [CrossRef]
- Ayadi, R.; El-Aziz, R.M.A.; Taloba, A.I.; Aljuaid, H.; Hamed, N.O.; Khder, M.A. Deep Learning-Based Soft Sensors for Improving the Flexibility for Automation of Industry. Wirel. Commun. Mob. Comput. 2022, 2022, 5450473. [Google Scholar] [CrossRef]
- Pathak, C. saving energy through synergistic innovation with digitalization. IPPTA Q. J. Indian Pulp Pap. Tech. Assoc. 2024, 36, 145–148. [Google Scholar]
- Ghobakhloo, M.; Fathi, M. Industry 4.0 and opportunities for energy sustainability. J. Clean. Prod. 2021, 295, 126427. [Google Scholar] [CrossRef]
Disclaimer/Publisher’s Note: The statements, opinions and data contained in all publications are solely those of the individual author(s) and contributor(s) and not of MDPI and/or the editor(s). MDPI and/or the editor(s) disclaim responsibility for any injury to people or property resulting from any ideas, methods, instructions or products referred to in the content. |
© 2025 by the authors. Licensee MDPI, Basel, Switzerland. This article is an open access article distributed under the terms and conditions of the Creative Commons Attribution (CC BY) license (https://creativecommons.org/licenses/by/4.0/).