Article

Dynamic Equivalent Modeling of Distributed Photovoltaic Generation Systems in Microgrid Considering LVRT Active Power Response Difference

1
Electric Power Research Institute, China Southern Power Grid, Guangzhou 510663, China
2
School of Electrical Engineering, Dalian University of Technology, Dalian 116024, China
3
College of Electrical Engineering, Zhejiang University, Hangzhou 310000, China
4
School of Electrical Engineering and Computer Science, KTH Royal Institute of Technology, 10044 Stockholm, Sweden
*
Author to whom correspondence should be addressed.
Electronics 2025, 14(22), 4355; https://doi.org/10.3390/electronics14224355
Submission received: 27 July 2025 / Revised: 13 October 2025 / Accepted: 15 October 2025 / Published: 7 November 2025
(This article belongs to the Section Industrial Electronics)

Abstract

The integration of large-scale distributed photovoltaic (PV) units into a microgrid poses critical challenges to transient stability. Developing an effective model of distributed PV generation systems is essential for stability analysis. However, detailed modeling of individual PV units leads to prohibitive computational costs. To address this issue, this paper proposes an equivalent model for distributed PV generation systems in a microgrid. By thoroughly analyzing the PV units’ responses during the low voltage ride-through (LVRT) process, the dominant active power responses are identified, and two segmentation thresholds for clustering are analytically derived. To improve engineering applicability of the proposed clustering method, one voltage-dip-dependent segmentation threshold is approximated. Moreover, for PV units exhibiting post-fault active power ramp recovery, an additional clustering based on average pre-fault steady-state active power is introduced to better represent the dynamic behaviors of actual distributed PV generation systems. On this basis, a four-machine equivalent model is proposed, which captures key dynamic characteristics while ensuring both computational efficiency and modeling accuracy. Extensive simulations under various operating conditions and fault scenarios verify the effectiveness of the proposed equivalent model in reproducing transient behavior of distributed PV generation systems in a microgrid.

1. Introduction

Driven by the dual-carbon policy, distributed photovoltaic (PV) generation systems have experienced rapid expansion and increasingly deep integration into microgrids [1,2,3]. Distributed PV unit interfaces with the microgrid through a power electronic converter, whose dynamic and fault behaviors differ fundamentally from those of conventional synchronous generators [4,5]. In microgrids with high PV penetration, grid faults can trigger a large number of PV units to enter the low voltage ride-through (LVRT) mode simultaneously, causing abrupt power disturbances and posing severe challenges to the stability and security of the power grid [6,7,8].
To investigate the transient response characteristics of microgrids with numerous distributed PV units, accurate dynamic modeling is essential. However, detailed modeling of all distributed PV units leads to excessively high-order models, significantly reducing computational efficiency [9,10]. Therefore, equivalent modeling of distributed PV generation systems has become an indispensable approach to balance accuracy and efficiency. Based on the number of equivalent machines, existing equivalent modeling methods can generally be categorized into single-machine equivalent methods and multi-machine equivalent methods. The single-machine equivalent method aggregates all PV units into a single equivalent machine [11], thereby improving computational efficiency. However, this method usually introduces significant deviations due to its insufficient characterization of operational diversity among individual PV units.
The multi-machine equivalent method groups PV units with similar dynamic response characteristics into clusters, each cluster represented by an equivalent machine. The main challenge lies in defining appropriate clustering criteria. Most existing studies employ operational characteristics or control parameters of PV units as clustering features, followed by clustering algorithms to determine optimal groupings. Considering the spatial dispersion of distributed PV units, some studies use electrical distance as the clustering indicator. For instance, the equivalent line impedance between each PV unit and the point of common coupling (PCC) is selected as the clustering indicator [12,13]. Other studies focus on inverter control parameters, which largely determine the dynamic behavior of PV units. In [14,15,16], sensitivity-weighted inverter control parameter vectors are adopted as clustering indices. In [17], a feature distance weighted by controller parameter sensitivity coefficients is introduced as the clustering indices. In [18], inverter control transfer functions are derived to construct clustering indices, and clustered using the canopy fuzzy C-means algorithm. Beyond control parameters, some studies have considered electrical or environmental inputs and outputs as clustering variables. In [19], irradiance, temperature and active power are used for clustering. Some studies have proposed an integrated performance index combining multiple types of indicators. In [20], a comprehensive index considering electrical distance, active power, and reactive power is constructed, and an improved genetic algorithm (GA) is employed to obtain the optimal clustering results. In [21], electrical distance, irradiation intensity and inverter control parameters are jointly used as clustering indicators for K-means algorithm-based grouping.
Other studies employ output response curves as clustering indicators. In [22], waveforms of voltage, current, active power, and reactive power over a time window are used for dynamic clustering. In [23], the feature points extracted from the power response curve of a PV system are taken as the clustering index. Fault period responses are also adopted. In [24], PV units are first classified by LVRT status, grouping non-LVRT units together, and clustering the remaining units based on transient voltage responses. In [25], the coupling between active power and voltage during the LVRT process is identified, and a clustering method is proposed based on the kron-reduced injected current equations. In [26], both normal and fault period output responses are combined with factor analysis to construct clustering indices. In [27], the reactive power before and after the transient power are used for clustering. Although these approaches improve equivalent accuracy, their dependence on computationally intensive clustering algorithms limits their practicality engineering applications.
Alternative equivalent methods that avoid complex clustering algorithms have also been explored. In [28], PV units are divided into three clusters using fixed active power thresholds of 0.4 p.u. and 0.7 p.u. as segmentation points. In [29], segmentation thresholds are determined from PV unit response patterns under various irradiance levels. These methods are computationally efficient for obtaining clustering results, but usually lack theoretical justification for the chosen thresholds.
In summary, most existing studies rely heavily on clustering algorithms to obtain clustering results. While such methods enhance accuracy, they compromise computational efficiency, limiting practical applicability. Furthermore, some studies require electrical variables during fault periods for clustering, which are difficult to obtain prior to fault occurrence. To address these limitations, this paper proposes an equivalent modeling method for distributed PV generation systems in microgrids. The main contributions are summarized as follows:
(1)
Three dominant active power responses are identified by comprehensively characterizing the LVRT response of PV units, and two candidate segmentation thresholds for clustering are identified;
(2)
A voltage dip dependency segmentation threshold is approximated, and an additional threshold based on the average pre-fault steady-state active power is incorporated to accurately represent post-fault active power ramp recovery.
(3)
A four-machine equivalent modeling method is proposed to replace detailed modeling of all PV units in microgrid, significantly reducing model complexity while maintaining high simulation accuracy.
To clearly highlight the distinctions among the proposed method and existing representative multi-machine equivalent modeling methods, a comparative summary is provided in Table 1.
The rest of this paper is organized as follows. In Section 2, the PV unit-considering LVRT control strategy is modelled. The cluster and aggregation method of distributed PV units in microgrid are presented in Section 3. Section 4 shows the validation results of the proposed equivalent method. Section 5 concludes this paper.

2. Modeling of a Distributed PV Unit Considering LVRT Control

A distributed PV unit consists of a PV array, a DC/DC converter, a dc link capacitor, an inverter, and a filter. The overall configuration is illustrated in Figure 1. In Figure 1, Irad denotes the irradiance of the PV unit, Cdc is the dc link capacitance, and Rf, and Lf represent the resistance and inductance of the filter, respectively. udc denotes the dc link voltage. ua, ub, and uc are the three-phase voltage of the PV unit. ia, ib, and ic are the three-phase current of the PV unit. It should be noted that the PV units considered in this study are grid-following units, whose reactive power control and LVRT behavior are governed by standard grid-following control strategies. Grid-forming PV units, which exhibit fundamentally different LVRT and reactive power control characteristics, are beyond the scope of this work.
Based on the operational principles of PV units, the transient response of a PV unit during LVRT conditions is predominantly determined by its inverter controller. Therefore, to analyze the LVRT response characteristics, the modeling of the inverter controller is presented in this section. The typical LVRT power response waveforms of a PV unit is shown in Figure 2. The dot lines in Figure 2 represent the system states at different time instants. When a fault occurs at t1, the grid voltage drops below the LVRT threshold Uth (typically 0.9 p.u.), and the PV unit enters the LVRT fault period. At this stage, the inverter controller switches from normal operation to LVRT mode. During the LVRT fault period, the PV unit typically prioritizes reactive power injection to support the grid voltage, while active power output may be reduced due to inverter capacity limitations. After fault clearance at t2, the voltage starts to recover. Following a short transient, reactive power decreases and active power increases. To mitigate power fluctuations at the instant of voltage recovery, PV units usually impose a post-fault active power limitation (Plim) and a ramp rate constraint (rp) on active power recovery. The overall control block diagram of the inverter controller, including the LVRT control strategy, is presented in Figure 3. This figure provides an overview of the control framework, which is detailed below.
To achieve decoupled control of active power and reactive power, the inverter controllers usually employ voltage-oriented vector control strategies, typically aligning the grid voltage ug with the d-axis:
u d = u g u q = 0
where ug denotes the grid phase-to-neutral magnitude, ud and uq are the voltage in d-axis and q-axis, respectively.
The instantaneous active power and reactive power, P and Q, can be expressed as [30]
P = 1.5 u d i d + u q i q Q = 1.5 u d i q u q i d
where id and iq are the current components in d- and q-axis, respectively.
Substituting Equations (1) and (2), P and Q are expressed as
P = 1.5 u g i d Q = 1.5 u g i q
From Equation (3), it can be seen that id and iq are the current components corresponding to active power and reactive power respectively, identified as active current and reactive current. During normal operation, the inverter primarily regulates dc link voltage stability while providing reactive power support. The active current reference idref_n is generated by the dc link voltage outer loop, given by
i dref _ n = k pudc e dc + k iudc e dc d t
where
e dc = u dc u dcref
where udcref is the dc link voltage reference, edc is the error signal of dc-link voltage, and kpudc and kiudc are the proportional and integral coefficients of the dc link voltage loop, respectively.
The reactive current reference iqref_n is typically set to zero under normal conditions:
i qref _ n = 0
During the LVRT fault stage, the reactive current reference iqref_f is determined as
i qref _ f = min k U th u g U n I n , i qmax
where k is the reactive power support coefficient, In is the rated current of the inverter, iqmax is the maximum reactive current of the inverter. Uth is the LVRT threshold expressed per unit, with the base taken as the grid phase-to-neutral rated voltage. A typical value of Uth is 0.9 p.u.
The active current reference idref_f during fault period is expressed as
i dref _ f = min i dref _ n , i max 2 i qref _ f 2 , t 1 t < t 2 min i dref _ n , i max 2 i qref _ f 2 , P lim 1.5 u g , t 2 t < t 3
where imax is the maximum current of the inverter, and Plim represents the active power limitation after fault clearance.
After voltage recovers to Uth at t3, the PV unit enters into the LVRT recovery process. Reactive power typically returns to the pre-fault value immediately, while active power gradually recovers at a predefined ramp rate rP after a short delay tdelay. At t5, active power reaches the pre-fault steady-state value. The active current reference during recovery process idref_r is given by
i dref _ r = P lim 1.5 u g , t 3 t < t 4 P lim + r p ( t t 4 ) 1.5 u g , t 4 t < t 5
where rp is the active power recovery rate during LVRT recovery process.
The active current reference idref_n/f/r and reactive current reference iqref_n/f/r are compared with their corresponding current components (id and iq), and the resulting errors are processed through the current inner loop with feedforward compensation. The voltage references in dq frame usdref and usqref are expressed as
u sdref = k pc e id + k ic e iq d t ω L f i q + u d u sqref = k pc e iq + k ic e iq d t + ω L f i d + u q
where
e id = i dref _ n / f / r i d e iq = i qref _ n / f / r i q
where eid and eiq are the error signal of active current and reactive current, respectively. kpc and kic are the proportional and integral coefficients of the current inner loop, respectively, and ω is the grid voltage angular frequency. The control gains kpc and kic play a crucial role in transient responses. In this paper, these gains are not arbitrarily chosen, but obtained through the parameter identification method, as shown in Appendix A.

3. Equivalent Modeling of Distributed PV Generation Systems in Microgrid

To establish a computationally efficient and physically meaningful equivalent modeling method for distributed PV generation systems in a microgrid, the transient active power responses of individual PV units under LVRT scenarios are first analyzed to extract their representative dynamic patterns. These response features are then utilized to define segmentation thresholds that enable a systematic classification of PV units with similar transient behaviors. Building upon this classification, the distributed PV units are clustered into four representative groups, each aggregated into an equivalent machine retaining the internal control structure and dynamic characteristics of the original units. The equivalent parameters of the aggregated machines are subsequently derived, forming a four-machine equivalent model that effectively reproduces the dynamic performance of the detailed system.

3.1. Analysis of Active Power Transient Responses Characteristics

This section analyzes the transient power response characteristics of a PV unit during the complete LVRT processes, aiming to identify segmentation thresholds for clustering. As illustrated in Section 2, PV units inject reactive power in proportion to the voltage deviation during the fault period. Under voltage dip conditions, PV units exhibit similar reactive power responses regardless of their pre-fault steady-state operating conditions. In contrast, the transient active power dynamics vary significantly among PV units operating at different pre-fault steady-state active power. Consequently, active power behavior serves as a suitable basis for defining cluster segmentation boundaries of distributed PV units. According to Equation (8), the active power of the PV unit during the LVRT fault process can be expressed as
P fault = min 1.5 u g k pudc ( u dc u dcref ) + k iudc ( u dc u dcref ) d t , P fault _ max , t 1 t < t 2 min 1.5 u g k pudc ( u dc u dcref ) + k iudc ( u dc u dcref ) d t , P fault _ max , P lim , t 2 t < t 3
where,
P fault _ max = 1.5 u g i max 2 min k ( U th u g ) I n , I qmax 2
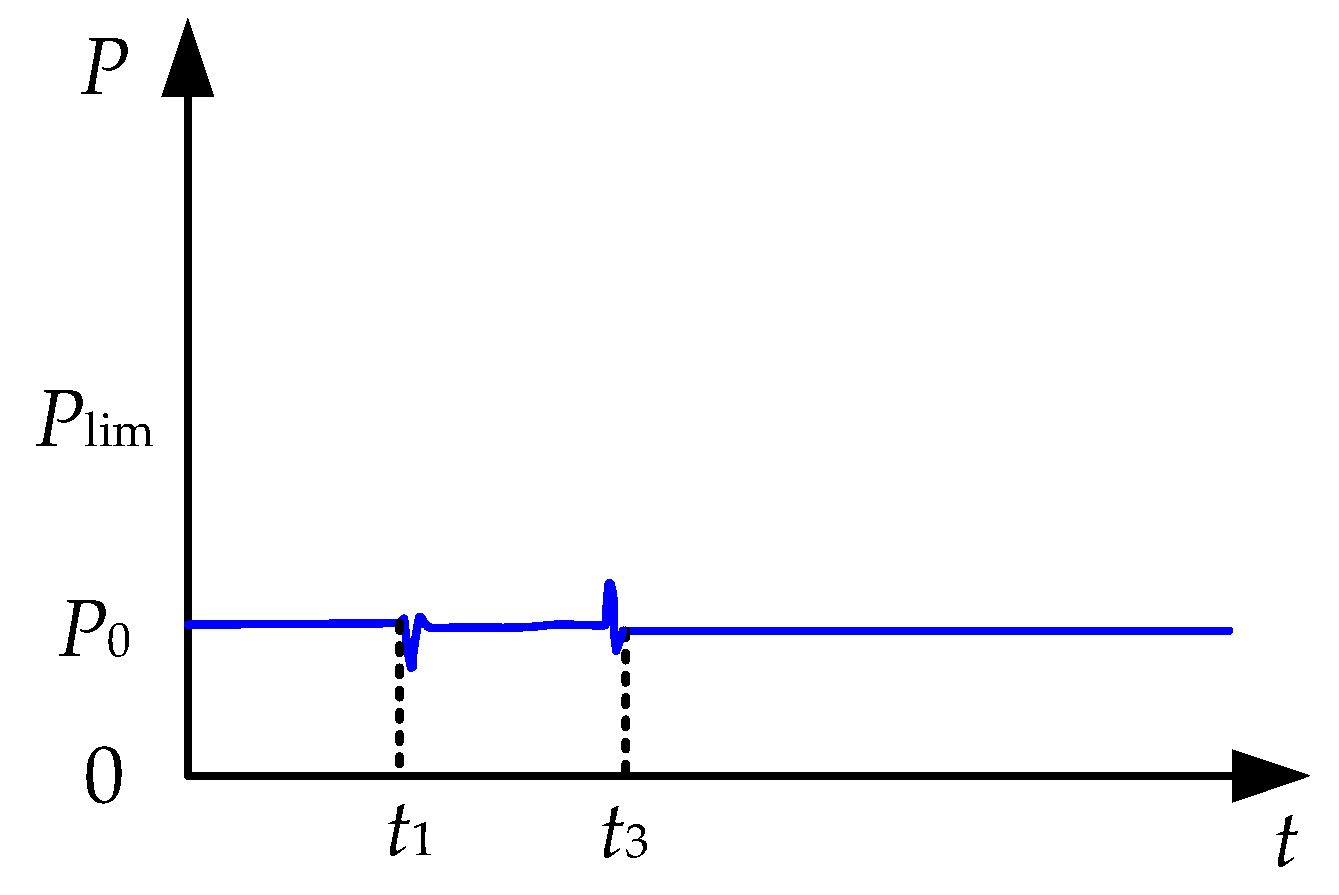
Based on Equation (12), the maximum active power output of a PV unit during the interval [t1, t2] is denoted as Pfault_max. When the pre-fault steady-state active power P0 satisfies P0Pfault_max, the PV unit retains sufficient control margin to regulate its active power, maintaining output close to P0 after a short transient, as shown in Figure 4. Conversely, when Pfault_max < P0Plim, the inverter reaches its current limitation, and the PV unit’s active power is constrained to Pfault_max after a short transient, irrespective of its initial operating conditions, as depicted in Figure 5. These characteristics indicate that Pfault_max is a viable active power segmentation threshold.
After fault clearance at t2, voltage begins to recover. PV units with P0 > Pfault_max increase their active power output after a short transient. For PV units satisfying Pfault_max < P0Plim, active power rapidly returns to P0 without a ramp recovery process, as shown in Figure 5. In contrast, when P0 > Plim, the active power first increases to Plim before the voltage reaches Uth. Once the voltage recovers above Uth, active power continues to rise at a ramp rate after a short time delay, as illustrated in Figure 6. Therefore, PV units with Pfault_max < P0Plim and those with P0 > Plim exhibit different transient active power responses. This observation identifies Plim as another candidate segmentation threshold.

3.2. Clustering Method of Distributed PV Units in Microgrid

In Section 3.1, two candidate active power segmentation thresholds, Pfault_max and Plim, are identified based on the distinct transient active power responses of distributed PV units. This section determines the effective segmentation point, and proposes a practical clustering method for distributed PV units with a microgrid.
PV units with P0Plim can be divided into two groups with Pfault_max as a boundary. As explicitly defined in Equation (13), Pfault_max depends on the grid voltage ug and thus varies with the depth of the voltage dip. Selecting Pfault_max as a segmentation point requires prior knowledge of each PV unit’s voltage during the fault stage. However, the voltage of individual PV unit depends on parameters such as fault impedance and location, which are typically unknown before fault occurrence. To enhance engineering applicability, Pfault_max is approximated by Pfault_avg, and PV units with P0Plim are evenly divided into two clusters. Specifically, Pfault_avg is defined as the average pre-fault steady-state active power of PV units with P0Plim, making it independent of the specific fault condition. Accordingly, Pfault_avg can be expressed as
P fault _ avg = i = 1 m 1 P 0 i m 1
where P0i is the pre-fault steady-state active power of i-th PV unit, and m1 is the number of PV units with P0iPlim.
To evaluate the validity of replacing Pfault_max with Pfault_avg, an analytical error analysis is conducted. Aggregated active power expression is derived when clustering is performed by either Pfault_max or Pfault_avg, and representative cases are compared under various conditions. Consider a subset of PV units with P0Plim containing y units sorted in ascending order of P0. When clustering is performed using Pfault_avg, two equivalent machines are obtained, whose aggregated pre-fault active powers Peq1 and Peq2 are given by Equation (15).
P eq 1 = i = 1 n 1 P 0 i n 1 P eq 2 = i = n 1 + 1 n 1 + n 2 P 0 i n 2
where n1 is the number of PV units with P0Pfault_avg, and n2 is the number of PV units with P0 > Pfault_avg.
When clustering is conducted by Pfault_max, the clustering results become fault-dependent. Based on the relationships between Pfault_max, Peq1, Pfault_avg, and Peq2, five representative cases are illustrated in Figure 7.
The active power of equivalent model clustering by Pfault_max (denoted as Pm_fault) can be expressed as
P m _ fault = i = 1 m 1 + m 2 P fault _ i i = 1 m 1 P 0 i + m 2 P fault _ max , P fault _ max P eq 1 i = 1 m 1 P 0 i + ( n 1 m 1 ) P fault _ max + n 2 P fault _ max , P eq 1 < P fault _ max P fault _ avg i = 1 n 1 P 0 i + i = n 1 + 1 m 1 P 0 i + m 2 P fault _ max , P fault _ avg < P fault _ max P eq 2 i = 1 m 1 P 0 i + m 2 P fault _ max , P eq 2 < P fault _ max < P lim i = 1 m 1 + m 2 P 0 i , P eq 2 P lim
where Pfault_i is the active power of i-th PV unit during [t1, t2]. P0i is the pre-fault steady-state active power of i-th PV unit. m1 is the number of PV units with P0Pfault_max, and m2 is the number of PV units with P0 > Pfault_max.
Similarly, the active power of equivalent model clustering by Pfault_avg (denoted as Pa_fault) is given by
P a _ fault = i = 1 n 1 + n 2 P fault _ i m 1 P fault _ max + m 2 P fault _ max , P fault _ max P eq 1 i = 1 m 1 P 0 i + i = m 1 + 1 n 1 P 0 i + n 2 P fault _ max , P eq 1 < P fault _ max P fault _ avg i = 1 n 1 P 0 i + ( m 1 n 1 ) P fault _ max + m 2 P fault _ max , P fault _ avg < P fault _ max P eq 2 i = 1 m 1 P 0 i + i = m 1 + 1 m 1 + m 2 P 0 i , P eq 2 < P fault _ max < P lim i = 1 m 1 + m 2 P 0 i , P eq 2 P lim
Comparing Equations (16) and (17), the approximation error can be expressed as
P m _ fault P a _ fault i = 1 m 1 ( P 0 i P fault _ max ) , P fault _ max P eq 1 i = m 1 + 1 n 1 ( P 0 i P fault _ max ) , P eq 1 < P fault _ max P fault _ avg i = n 1 + 1 m 1 ( P 0 i P fault _ max ) , P fault _ avg < P fault _ max P eq 2 i = m 1 + 1 m 1 + m 2 ( P 0 i P fault _ max ) , P eq 2 < P fault _ max < P lim 0 , P eq 2 P lim
The error expressions in Equation (18) show that the approximation error primarily depends on (i) the fault severity reflected by Pfault_max (i.e., voltage dip depth) and (ii) the mismatch in the number of PV units grouped below the threshold (e.g., m1, ∣m1n1∣ or m2). Under severe voltage dips, Pfault_max approaches 0, making the approximation error negligible. Under relatively shallow voltage dips, where Pfault_max > Plim, the two clustering criteria converge, and the error again vanishes. For moderate voltage dips, the error mainly depends on the relative position of Pfault_max with respect to Peq1 and Peq2, and the mismatch in the number of units grouped below the threshold (e.g., ∣m1n1∣ or m2). Overall, this analysis demonstrates that the approximation remains accurate in most fault scenarios, and deviations under moderate voltage dips are bounded and quantifiable. Therefore, Pfault_avg is adopted as the first segmentation threshold, and Plim as the second segmentation threshold.
For PV units with P0 > Plim, although they share similar post-fault active power recovery response, their recovery times differ, which can be expressed as
t rec _ j = P 0 j P lim r p + t 4
where trec_j is the time instant at which the active power of jth PV unit recovers to the pre-fault steady-state value.
As shown in Equation (19), PV units with different P0 exhibit distinct recovery times, and grouping all of them into one equivalent cluster would cause significant errors. To illustrate the source of this deviation, consider a distributed PV generation system with m2 units satisfying P0 > Plim, sorted in ascending order of P0. The total active power during the LVRT recovery process (denoted as Prec_PVm2) can be approximated as
P rec _ PV m 2 m 2 P lim , t 3 t < t 4 m 2 P lim + m 2 r p ( t t 4 ) , t 4 t < t rec _ 1 i = 1 j P 0 i + ( m 2 j ) P lim + ( m 2 j ) r p ( t t 4 ) , t rec _ j t < t rec _ j + 1 , j = 1 ~ m 2 1 i = 1 m 2 P 0 i , t t rec _ m 2
When aggregating these m2 PV units into one equivalent machine, its active power during the recovery process (denoted as Prec_PVeq) is
P rec _ PVeq m 2 P lim , t 3 t < t 4 m 2 P lim + m 2 r p ( t t 4 ) , t 4 t < t rec _ eq i = 1 m 2 P 0 i , t t rec _ eq
where trec_eq denotes the time at which the equivalent machine’s active power recovers to the pre-fault steady-state value.
From Equations (20) and (21), it can be seen that Prec_PVm2 exhibits stepwise variations at each trec_j, whereas Prec_PVeq shows a constant slope of m2rp during the recovery process. To enhance equivalent model accuracy, additional clustering is required for PV units with P0 > Plim. While increasing the number of clusters enhances fidelity, it also raises computational costs. To balance accuracy and efficiency, this study adopts a minimal yet effective clustering scheme. PV units with P0 > Plim are divided into two clusters, and the segmentation threshold is determined as the average pre-fault steady-state active power (denoted as Pramp_avg) of these units. Pramp_avg can be expressed as
P ramp _ avg = i = 1 m 2 P 0 i m 2
Accordingly, Pramp_avg is adopted as the third segmentation threshold for distributed PV unit clustering.

3.3. Equivalent Modeling of Distributed PV Generation Systems in Micgrid

Based on the clustering analysis in Section 3.2, this paper develops a four-machine equivalent modeling method for distributed PV generation systems in a microgrid. The distributed PV units are divided into four clusters determined by the segmentation thresholds Pfault_avg, Plim, and Pramp_avg, which are obtained through the analysis of active power transient characteristics during the complete LVRT processes. Each cluster is aggregated into an equivalent machine that maintains the same structural configuration as an individual PV unit.
For an equivalent machine representing n identical PV units, the total active power output Psum_cluster is the sum of active power of all n PV units, expressed as:
P sum _ cluster = i = 1 n g ( I rad _ i )
where Irad_i is the irradiance of i-th PV unit in the cluster, and g(·) denotes the functional expression relating input irradiance to output active power of an individual PV unit.
To maintain power consistency, an equivalent irradiance of equivalent machine is defined as Irad_eq, such that the output active power of equivalent machine Psum_eq satisfies
P sum _ eq = n g ( I rad _ eq )
Substituting Equation (23) into Equation (24), Irad_eq can be calculated as:
I rad _ eq = g 1 1 n i = 1 n g ( I rad _ i )
where g−1(·) is the inverse function that converts output active power back into input irradiance of an individual PV unit.
The rated capacity of the equivalent inverter and equivalent transformer is scaled proportionally to the number of aggregated units, given by
S inv _ eq = n S inv S Teq = n S T
where Sinv and ST are the rated capacity of the inverter and transformer for an individual PV unit, and Sinv_eq and STeq are those of the equivalent machine.
For the circuit parameters of the equivalent machine and equivalent transformer, the multiplier method is applied according to the series-parallel relationships [26]. Since the dc link capacitances of PV unit are connected in parallel, the equivalent dc link capacitance Cdceq of the equivalent machine is
C dceq = n C dc
Each PV unit contributes a series impedance Rf + jωLf, and the n filter branches are paralleled at the collector node. Therefore, the equivalent filter resistance and inductance are given by
R feq = R f n L feq = L f n
where Rfeq and Lfeq are the filter resistance and filter inductance of the equivalent machine, respectively.
Similarly, as transformer impedances are connected in parallel, the equivalent transform impedance ZTeq is expressed as:
Z Teq = Z T n
The equivalent parameters of collector lines are calculated as [31].

4. Simulation Results

To comprehensively validate the proposed four-machine equivalent modeling method, this section presents a series of systematically simulation studies. The validation process is structured to examine the model’s accuracy and robustness under multiple operating scenarios. First, the approximation of the key segmentation threshold Pfault_avg is verified to ensure the theoretical consistency of the clustering framework. Subsequently, the effectiveness of the equivalent modeling method is evaluated under various steady-state operating conditions, voltage dip depths, unbalanced fault scenarios, and irradiance variations. Both steady-state and transient performance are compared with those of the detailed model and the conventional single-machine equivalent model. The equivalent errors and computational time of different equivalent models are also compared. The simulations are conducted on the test system of the distributed PV generation system within a microgrid, as illustrated in Figure 8. The microgrid consists of 20 distributed PV units, each rated at 0.32 MW. The main parameters of an individual PV unit are summarized in Table 2. All simulations were carried out in PSCAD/EMTDC, using a fixed time step of 25 μs.

4.1. Error Analysis and Validation of Pfault_avg Approximation

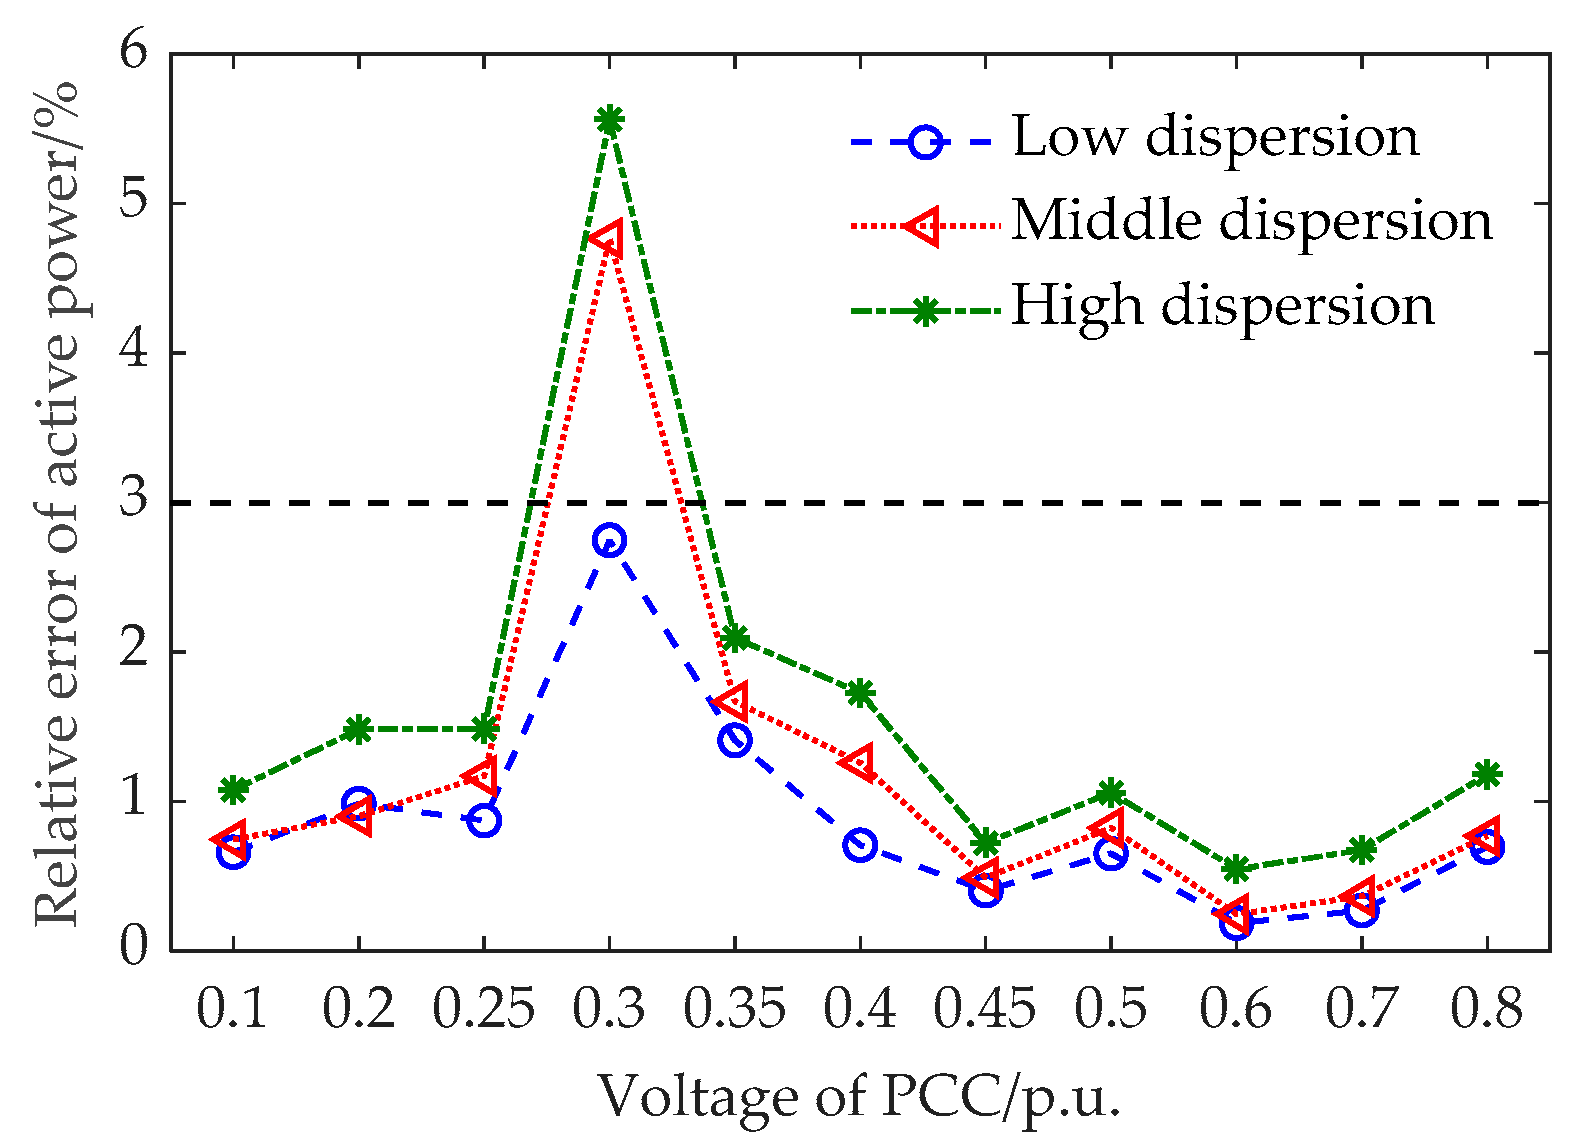
To evaluate the accuracy of approximating Pfault_max with Pfault_avg, extensive simulations have been performed on the test system. Eleven voltage dips have been considered, with PCC voltage drops of 0.1 pu, 0.2 pu, 0.25 pu, 0.3 pu, 0.35 pu, 0.4 pu, 0.45 pu, 0.5 pu, 0.6 pu, 0.7 pu, and 0.8 pu. For each voltage dip, three representative electrical distance dispersion scenarios are examined: (1) Low dispersion: electrical distances distributed around 2 km ± 0.5 km; (2) Medium dispersion: randomly distributed between 0.5 km and 4 km; (3) High dispersion: randomly distributed between 0.5 km and 8 km. The corresponding electrical distance configurations for these dispersion scenarios are illustrated in Figure 9.
This setup enables systematic evaluation of how voltage dip severity and electrical distance variation affect the accuracy of the Pfault_avg approximation. The analysis focuses on comparing the aggregated active power responses of the detailed model and the equivalent model during both fault and post-fault periods, quantifying the deviation introduced by Pfault_avg simplification. The deviation of active power eP between the equivalent model (clustered by Pfault_avg) and the detailed model is calculated as [32]
e p = i = N start N end P eq ( i ) P de ( i ) P de ( i ) N end N start + 1 × 100 %
where Peq and Pde denote the active power output of the equivalent model and the detailed model of distributed PV generation system, respectively. Nstart and Nend represent the first and last data within the calculation interval, respectively. The error is evaluated from the moment of fault occurrence until the active power of the detailed model fully recovers to its pre-fault steady-state value after fault clearance.
Figure 10 presents the relative error results under different voltage dips and electrical distance dispersion scenarios. The black dotted line in Figure 10 indicates a 3% error. The deviation peaks around a 0.3 pu voltage dip, while for both severe and shallow sags the error remains negligible, consistent with the theoretical analysis in Section 3.2. Under low electrical distance dispersion, the error remains within 3% across all voltage dips, whereas higher dispersion results in larger deviations, particularly in the moderate sag region. This behavior arises from non-uniform voltage profiles among PV units due to diverse feeder lengths, leading to slightly varied voltage sag levels. Nevertheless, the results demonstrate that the Pfault_avg approximation still captures the dominant dynamic trends of the detailed model, with only bounded errors under moderate dips and high dispersion.
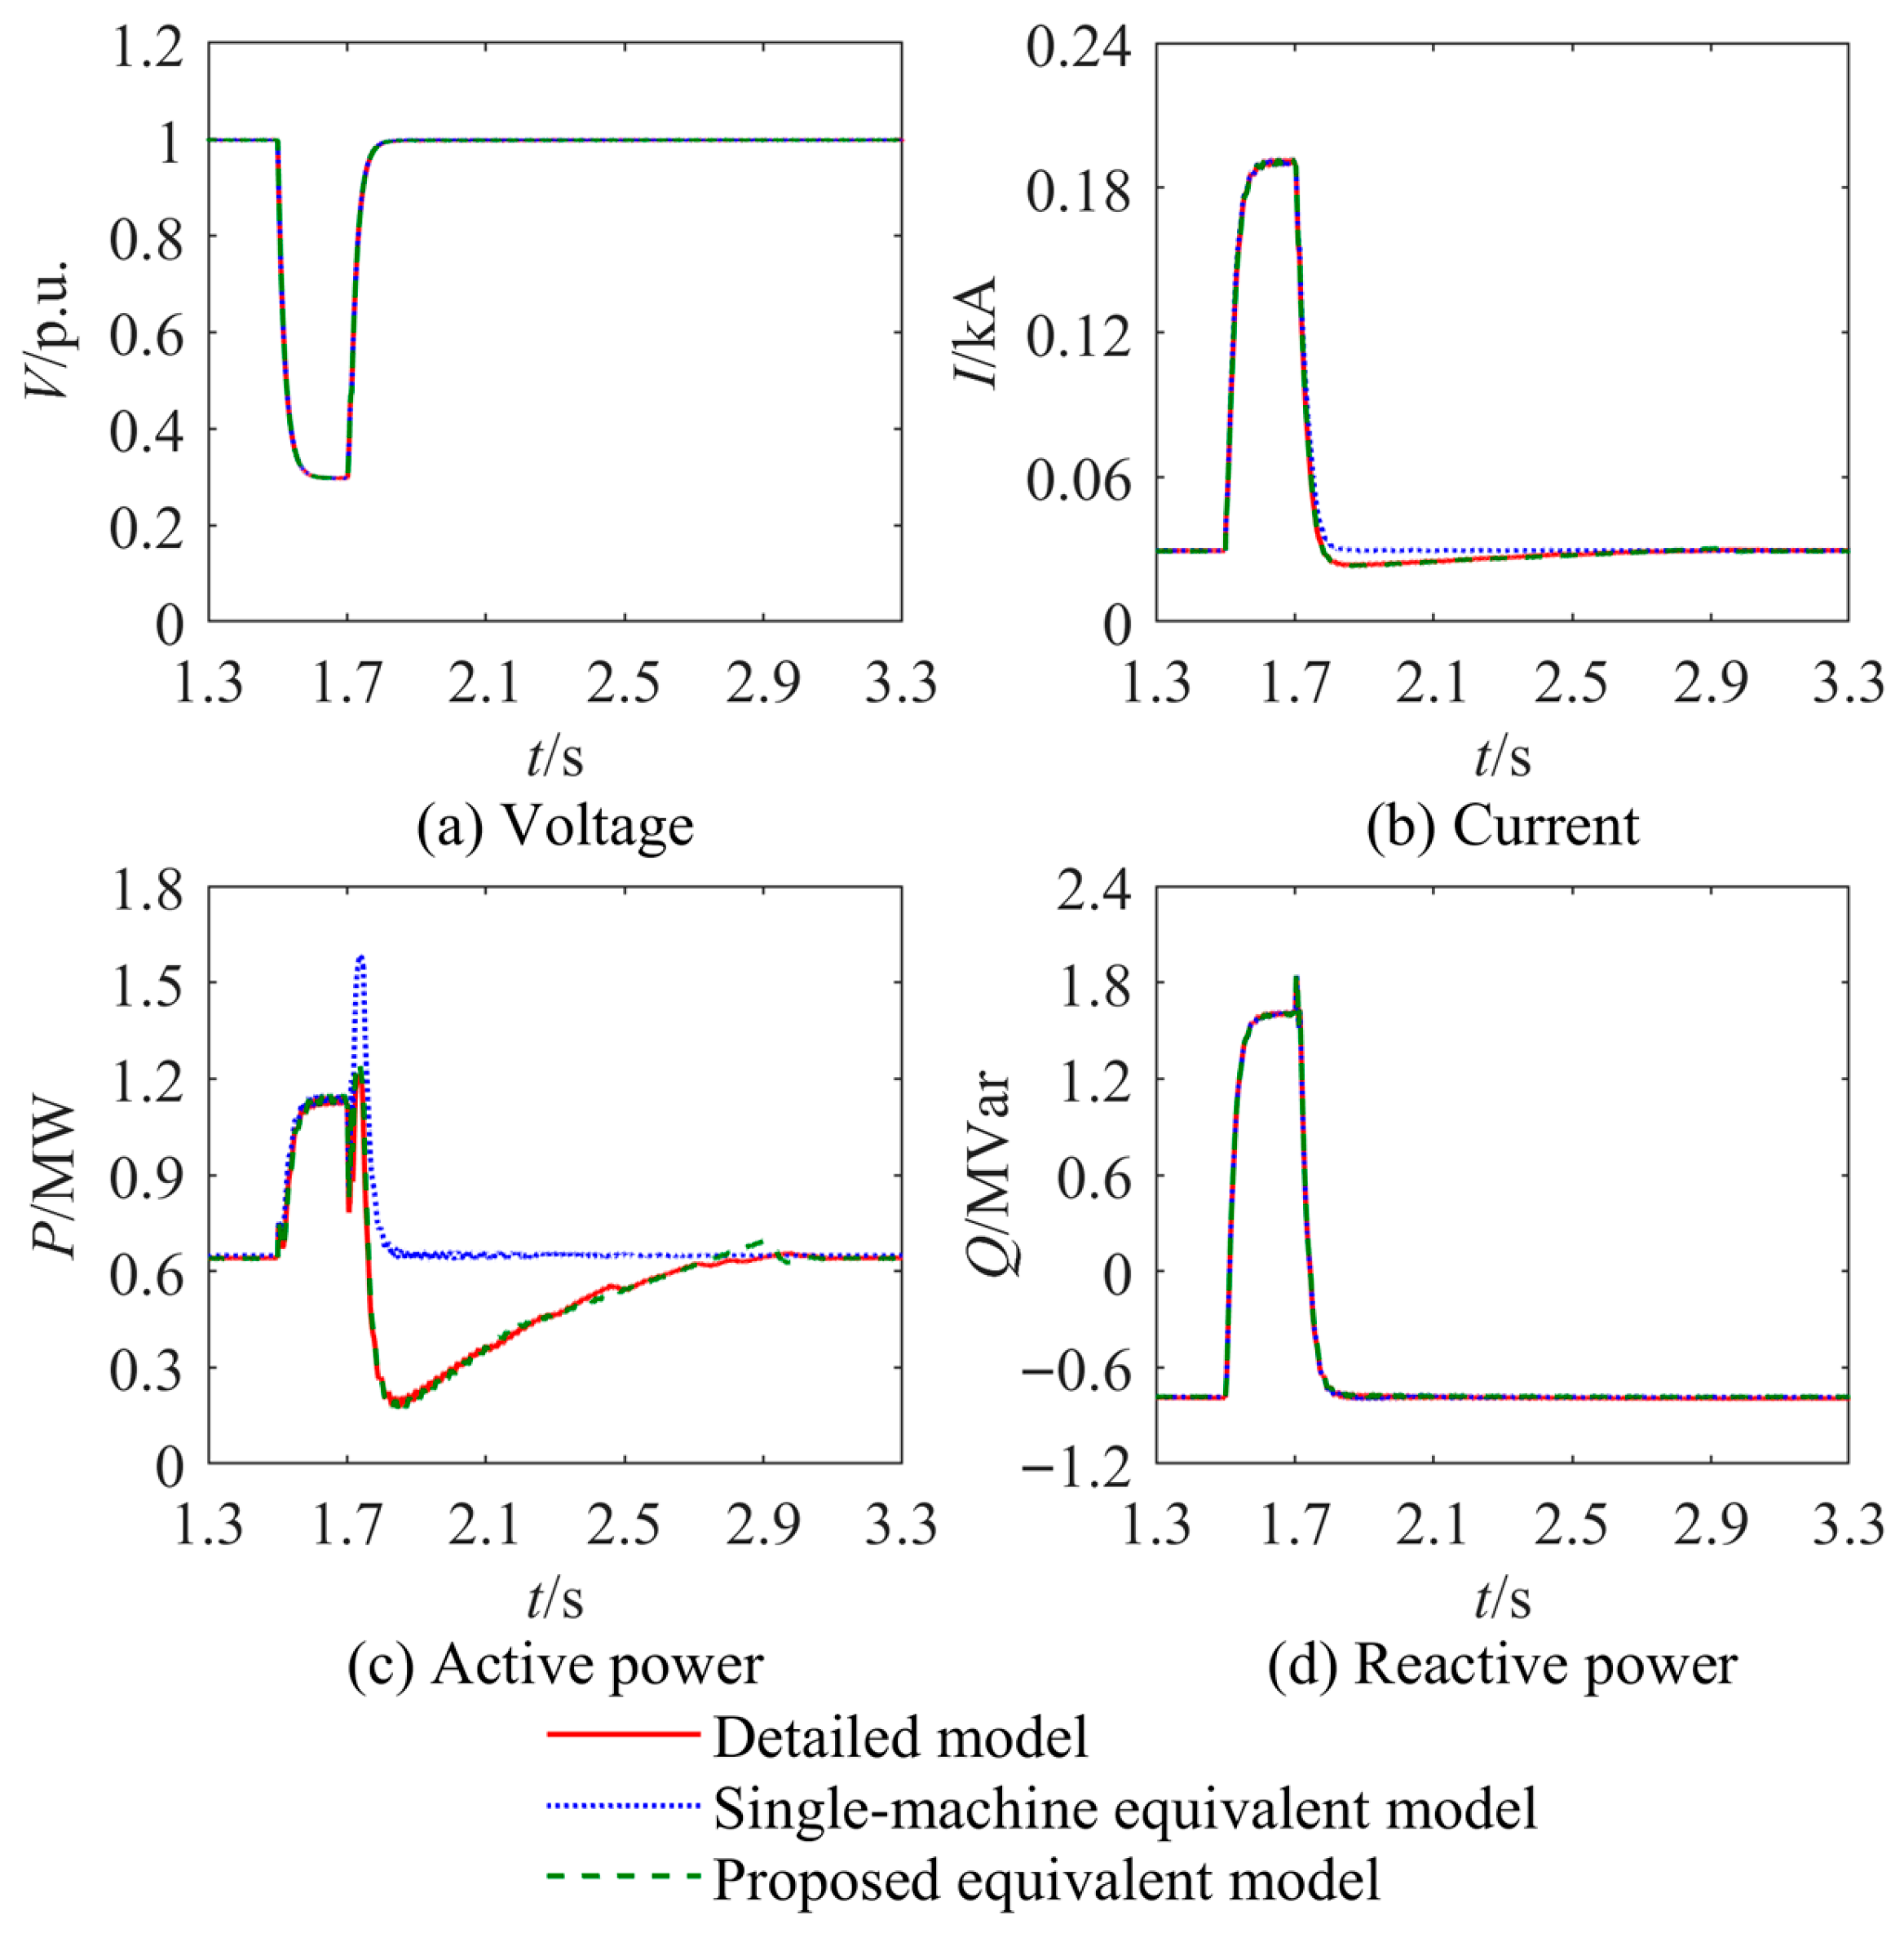
As shown in Figure 10, the worst-case error occurs around a 0.3 pu voltage dip under high electrical distance dispersion, where the relative deviation of aggregated active power reaches approximately 5.6%. Figure 11 illustrates the impact of this worst-case scenario on the LVRT responses. In this case, the active power and current of the equivalent model exhibit noticeable deviations from those of the detailed model during the fault period. These results indicate that while the Pfault_avg approximation is not universally precise, its limitations are well-defined. Specifically, the proposed method maintains satisfactory accuracy in practical systems where the spread of electrical distances is limited and voltage sag variation remains moderate (for instance, when VPCC ≤ 0.25 pu or VPCC ≥ 0.45 pu). Under these conditions, Pfault_avg can be reliably adopted as an engineering approximation, balancing modeling simplicity and accuracy for system-level transient studies.

4.2. Effectiveness of Equivalent Modeling Method Under Various Steady-State Operating Conditions

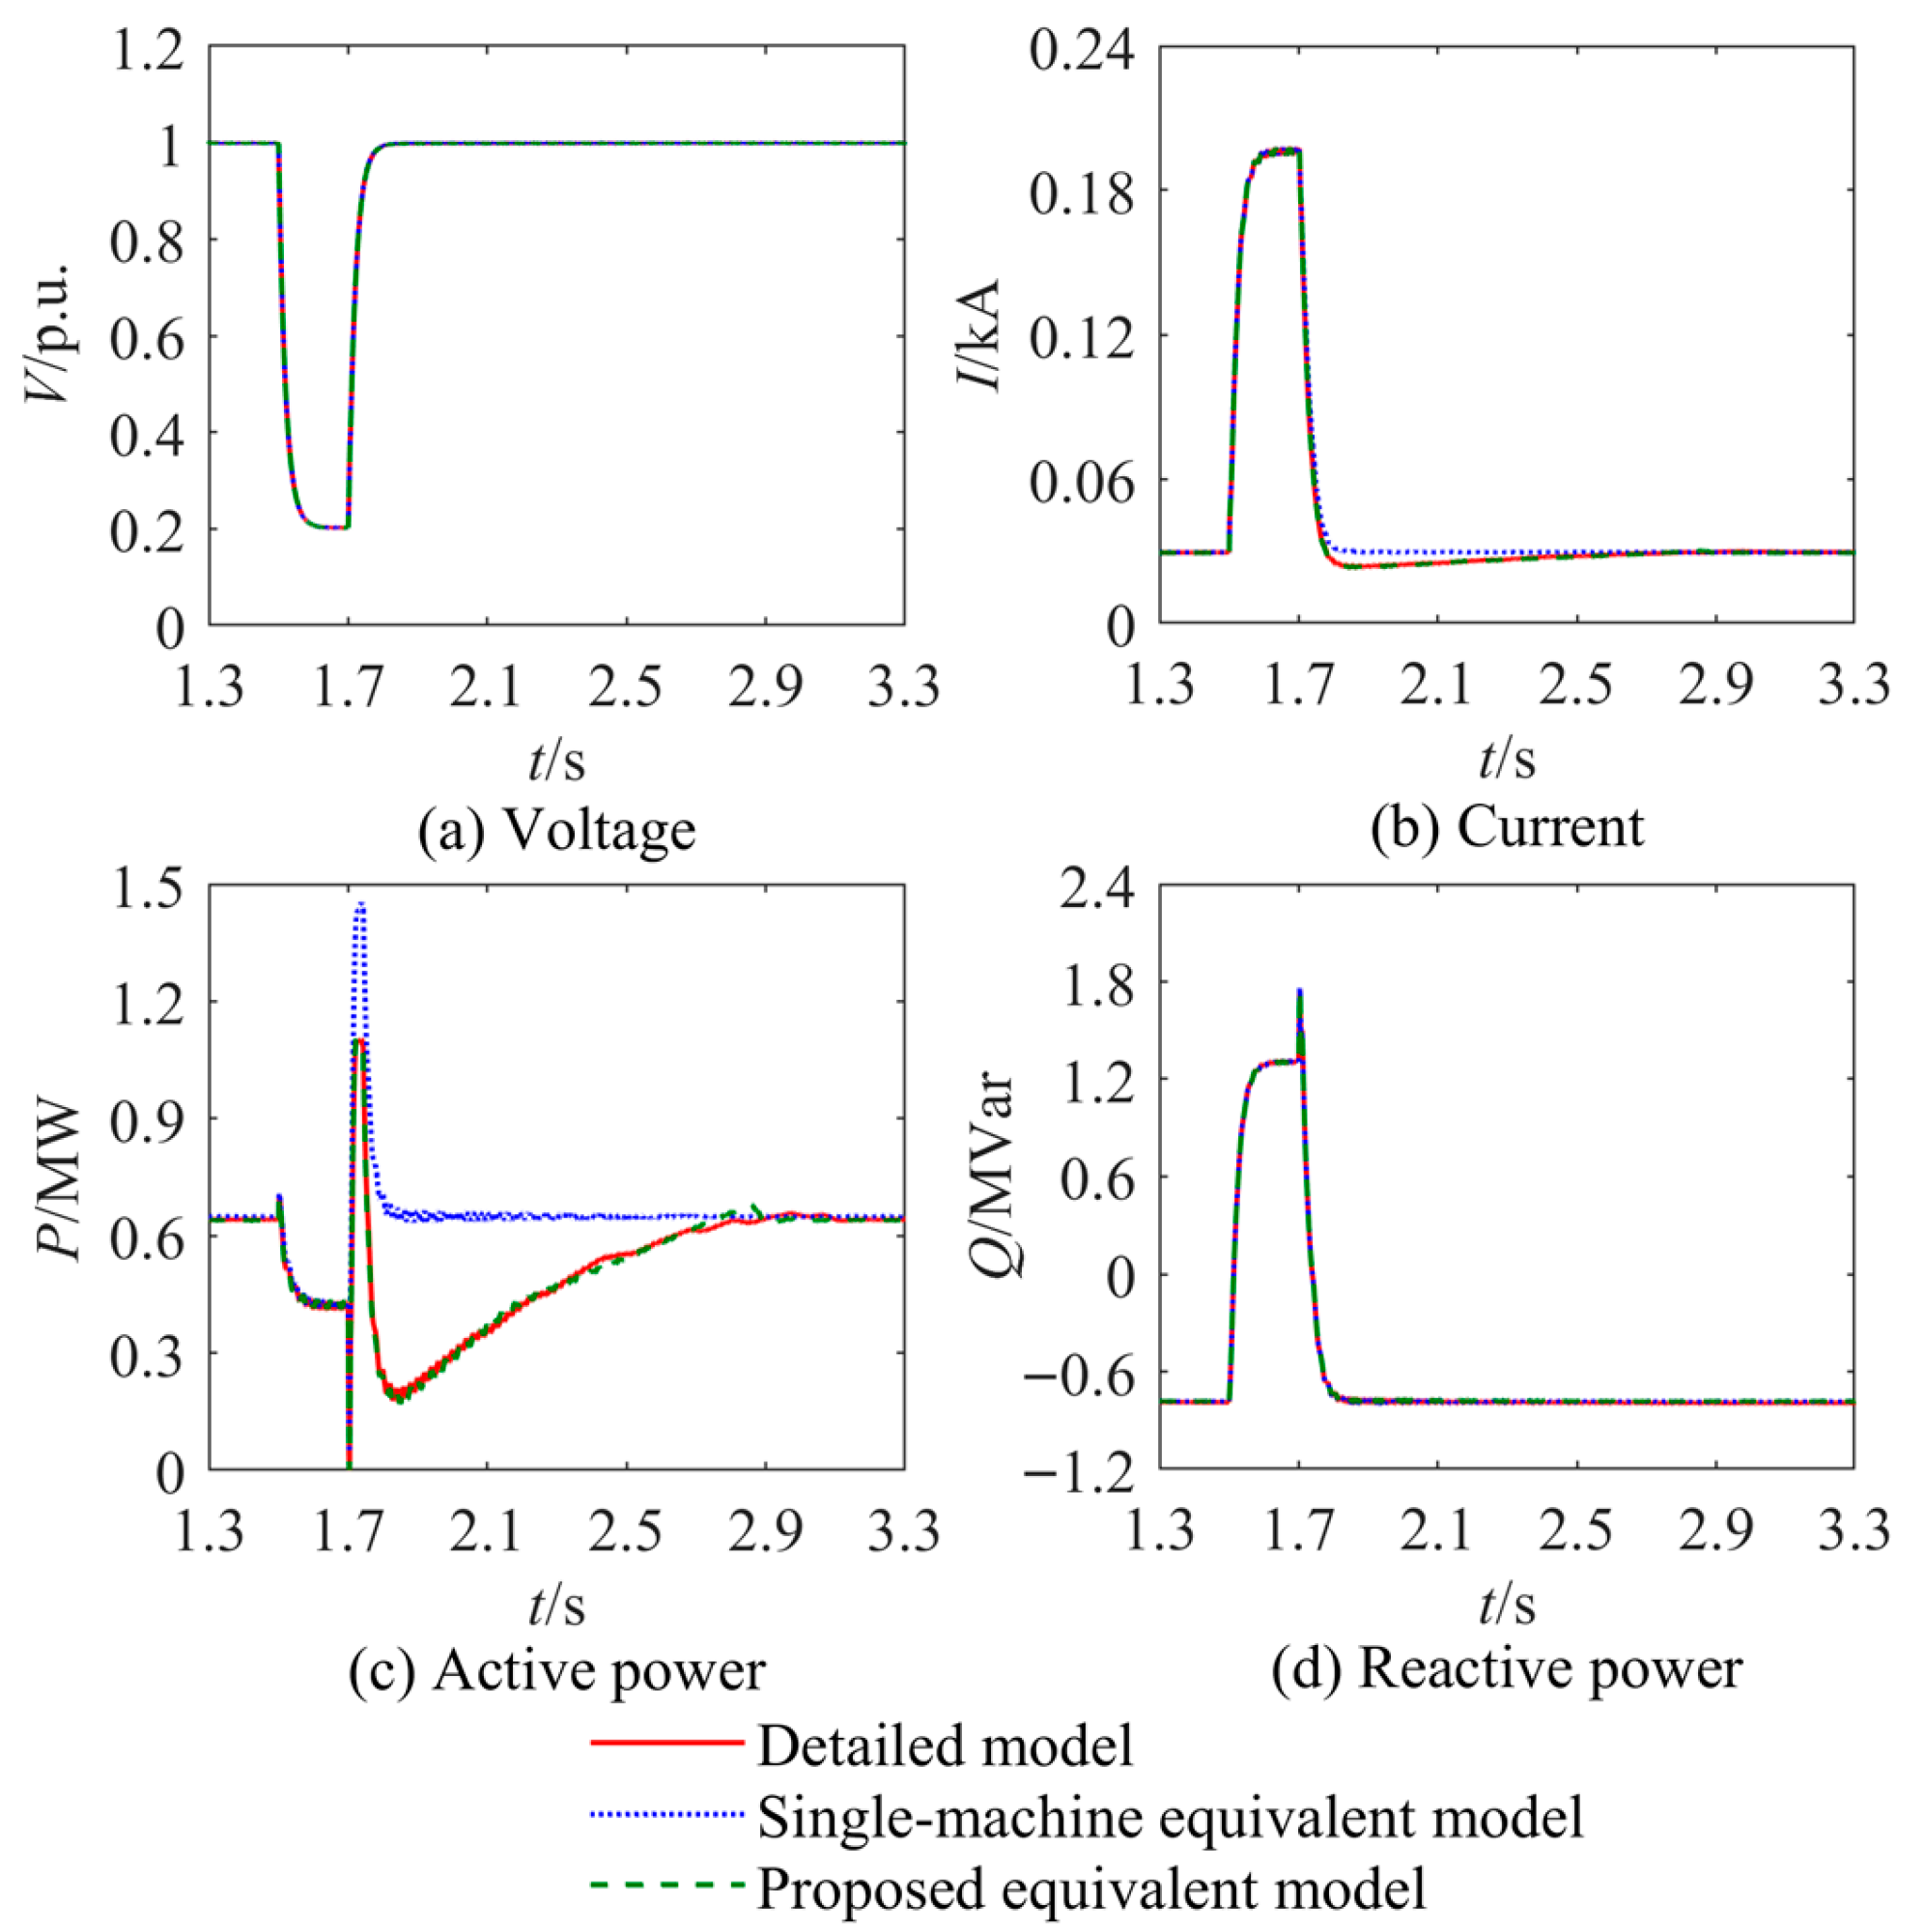
A three-phase short-circuit fault is applied at the PCC of simulation system in Figure 8 at 1.5 s, resulting in a voltage drop to 0.3 p.u. The fault is cleared at 1.7 s. Massive simulations were conducted under various steady-state operating conditions to assess the proposed model’s applicability. The transient responses for two representative cases are illustrated in Figure 12 and Figure 13. For Case 1, the segmentation thresholds are Pfault_avg = 0.107 MW, Plim = 0.16 MW, and Pramp_avg = 0.228 MW, and for Case 2, Pfault_avg = 0.106 MW, Plim = 0.16 MW, and Pramp_avg = 0.219 MW. The detailed clustering results, and each equivalent model’s pre-fault steady-state active power are summarized in Table 3.
The comparison results reveal that the single-machine equivalent model reproduces the detailed model’s voltage and reactive power transient responses reasonably well, but exhibits noticeable deviations in current and active power dynamics. This limitation indicates insufficient accuracy for capturing non-uniform PV unit responses during transient events. In contrast, the proposed four-machine equivalent model effectively reproduces the detailed model’s key transient characteristics throughout the complete LVRT processes, exhibiting particularly accurate active power and current dynamics.
To quantitatively evaluate modeling accuracy, the relative active power error eP is calculated. The fault occurs at 1.5 s, and the distributed PV generation system in the detailed model recovers to its pre-fault steady-state active power at 3.2 s (Case 1) and 3.1 s (Case 2). Accordingly, the error calculation windows are 1.5–3.2 s and 1.5–3.1 s, respectively. With a PSCAD/EMTDC simulation time step of 25 μs, this corresponds to 68,000 and 64,000 samples for Cases 1 and 2. The comparative results in Table 4 indicate that the proposed four-machine equivalent model yields substantially lower active power error than the single-machine model, clearly demonstrating its superior dynamic accuracy.
In addition, computational efficiency is evaluated to confirm the practicality of the proposed approach. All simulations are performed on a personal computer equipped with an Intel (R) Core (TM), Ultra 9 CPU @ 2.9 GHz and 32 GB RAM, using a fixed 25 us time step over a 4 s simulation period. The computational time of different models is compared in Table 5. It can be observed that the proposed equivalent model achieves about 94.6% reduction in computation time compared with the detailed model.
In summary, the error analysis and computational performance comparison verify that the proposed four-machine equivalent method significantly reduces the error compared with a traditional single-machine equivalent model, while maintaining high computational efficiency. This quantitative evaluation further demonstrates the accuracy and practicality of the proposed approach.

4.3. Effectiveness of Equivalent Modeling Method Under Different Voltage Dip Scenarios

To further evaluate the performance of the proposed four-machine equivalent modeling method, simulations are carried out under various voltage sag scenarios by applying different fault impedances at the PCC in Figure 8. The simulation results for Case 1 and Case 2 under voltage sags of 0.2 p.u. and 0.4 p.u. are presented in Figure 14, Figure 15, Figure 16 and Figure 17, respectively. The results show that the proposed equivalent model accurately replicates the dynamic responses of distributed PV generation systems throughout the complete LVRT processes under different voltage dips. Compared with the conventional single-machine equivalent model, the proposed method demonstrates significantly improved accuracy and fidelity, effectively capturing both the fault time and post-fault recovery dynamics.
Furthermore, the relative active power errors for both the single-machine and the proposed four-machine equivalent models under 0.2 p.u. and 0.4 p.u. voltage sags are computed using Equation (30). The corresponding results, summarized in Table 6, show that the proposed model consistently achieves lower active power deviation, confirming its superior equivalence performance across different fault severities.
It is worth noting that the active power curves presented in Figure 12, Figure 13, Figure 14, Figure 15, Figure 16 and Figure 17 deviate from the schematic diagram shown in Figure 2. This discrepancy arises because Figure 2 illustrates the schematic diagram of LVRT active power response of a single distributed PV unit, whereas Figure 12, Figure 13, Figure 14, Figure 15, Figure 16 and Figure 17 depict the aggregated LVRT active power response at the PCC of the test system, reflecting not only the combined behavior of multiple PV units but also the impacts of network interactions and load dynamics within the microgrid.
These results confirm that the proposed four-machine equivalent modeling method maintains strong accuracy and adaptability under varying voltage dip conditions, effectively representing the collective transient behavior of distributed PV systems in practical microgrid environments.

4.4. Effectiveness of Equivalent Modeling Method Under Unbalanced Fault Conditions

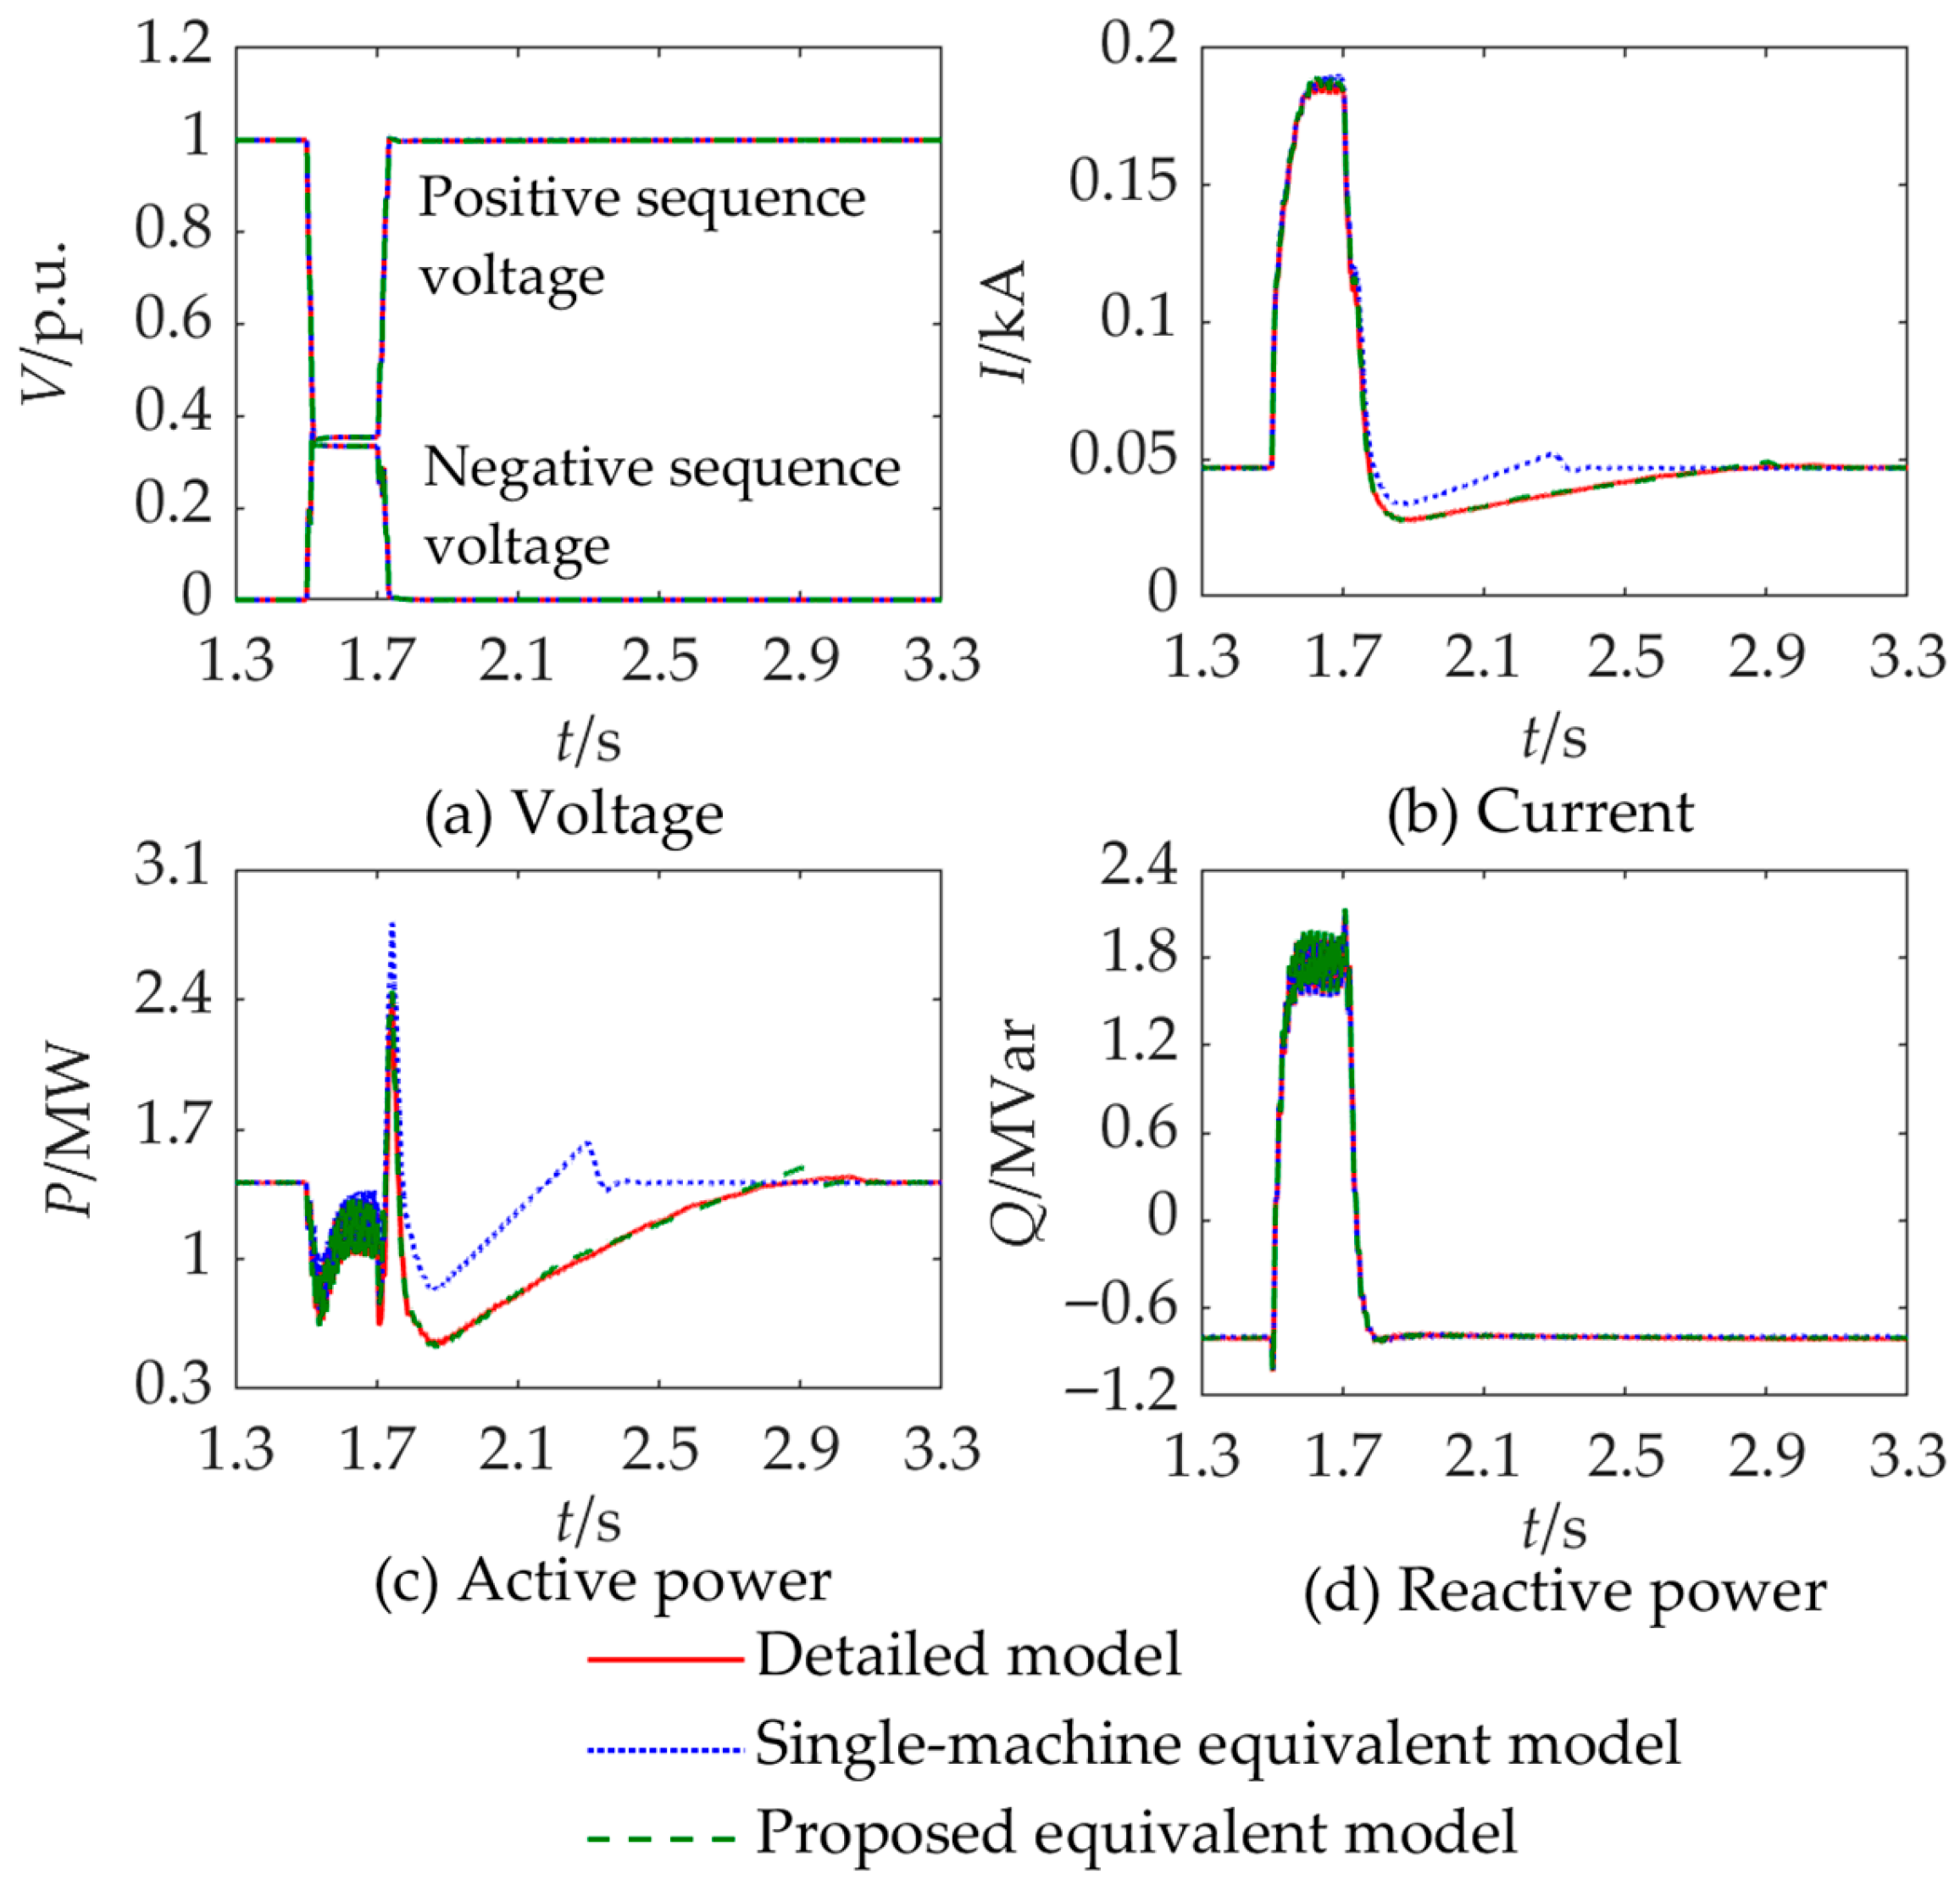
To further verify the effectiveness of the proposed equivalent modeling method under unbalanced faults, the simulations were conducted for a two-phase voltage dip scenario. During unbalanced faults, both positive and negative sequence components appear in the voltages and currents of the distributed PV unit. In the simulations, the positive sequence active current and reactive current control strategies remain the same as in the balanced fault case, whereas the negative sequence active current reference and reactive current reference are set to 0, following a typical negative sequence current suppression strategy. Two representative cases from Section 4.2 are considered, and the transient responses of the detailed model and the equivalent model under a two-phase voltage dip are shown in Figure 18 and Figure 19, respectively.
The comparison results demonstrate that, after the unbalanced fault occurs, the positive sequence voltage at the PCC decreases while the negative sequence voltage increases, causing the PV units to inject reactive power into the grid. Consequently, both the active and reactive power responses exhibit double frequency oscillations. After fault clearance, the positive sequence voltage rises, the negative sequence voltage diminishes, and both active power and reactive power gradually return to their pre-fault steady-state values. The relative active power errors of the single-machine equivalent model are 18.87% and 23.45% for Case 1 and 2, respectively, whereas the proposed four-machine equivalent model achieves much lower errors of 1.74% and 2.68%. These results confirm that the proposed equivalent modeling method can still accurately capture the dominate dynamic characteristics of the distributed PV generation system under unbalanced fault conditions.

4.5. Effectiveness of Equivalent Modeling Method Under Varying Irradiance Conditions

To further assess the applicability of the proposed equivalent method under varying irradiance conditions, a case study involving irradiance fluctuations is performed. The active power of individual distributed PV units under irradiance variation are shown in Figure 20, where the corresponding irradiance changes can be obtained from the PV unit’s power-irradiance characteristic curve. Figure 21 compares the transient responses of different models under an LVRT scenario. It can be observed that the proposed four-machine equivalent model closely reproduces the LVRT response of the detailed model, accurately reflecting both the transient and recovery processes. These results demonstrate that the proposed equivalent modeling method remains valid and effective even when irradiance conditions vary, confirming its robustness and applicability for dynamic analyses of distributed PV systems under realistic environmental fluctuations.

5. Conclusions

This paper presents a four-machine equivalent modeling method for distributed PV generation systems in microgrids. By analyzing transient active power responses, two candidate segmentation thresholds are identified for clustering PV units. To enhance engineering practicality, the threshold varying with voltage dip depth is approximated by a simplified function, and an auxiliary threshold based on pre-fault active power is introduced to better capture the post-fault active power recovery dynamics. These strategies enable the proposed model to replace detailed PV representations with four equivalent machines, substantially reducing model complexity without compromising simulation accuracy. The analytical clustering framework eliminates dependence on iterative clustering algorithms, ensuring low computational cost and strong engineering applicability. Simulation results under diverse conditions, including varying steady-state operating conditions, voltage dips, electrical distances, unbalanced faults, and irradiance conditions, demonstrate that the proposed model accurately reproduces LVRT responses. Compared with the conventional single-machine equivalent method, the proposed approach achieves significantly lower errors and reduces simulation time by approximately 94.6%, confirming its effectiveness and efficiency for transient stability assessment in renewable-rich microgrids.

Author Contributions

Conceptualization, J.Q., Q.G. and Y.Y.; methodology, J.Q. and Y.Y.; software, Y.L.; validation, J.Q., Q.G. and L.T.; formal analysis, Y.T.; investigation, C.S.; resources, C.L.; data curation, Y.Z.; writing—original draft preparation, J.Q.; writing—review and editing, J.Q., Q.G. and L.T.; visualization, C.L.; supervision, C.L.; project administration, Y.Z.; funding acquisition, C.L. All authors have read and agreed to the published version of the manuscript.

Funding

The 2025 Routine Technical Service Project of the Electric Power Research Institute, China Southern Power Grid Co., Ltd. (SEPRI-A25M004).

Data Availability Statement

Data are contained within the article.

Conflicts of Interest

Authors Jinling Qi, Qi Guo, Yihua Zhu, Liang Tu, Chao Luo, Yujia Tang, and Yuyan Liu were employed by the Electric Power Research Institute, China Southern Power Grid. The remaining authors declare that the research was conducted in the absence of any commercial or financial relationships that could be construed as a potential conflict of interest. The authors declare that this study received funding from the 2025 Routine Technical Service Project of the Electric Power Research Institute. The funder was not involved in the study design, collection, analysis, interpretation of data, the writing of this article, or the decision to submit it for publication.

Appendix A

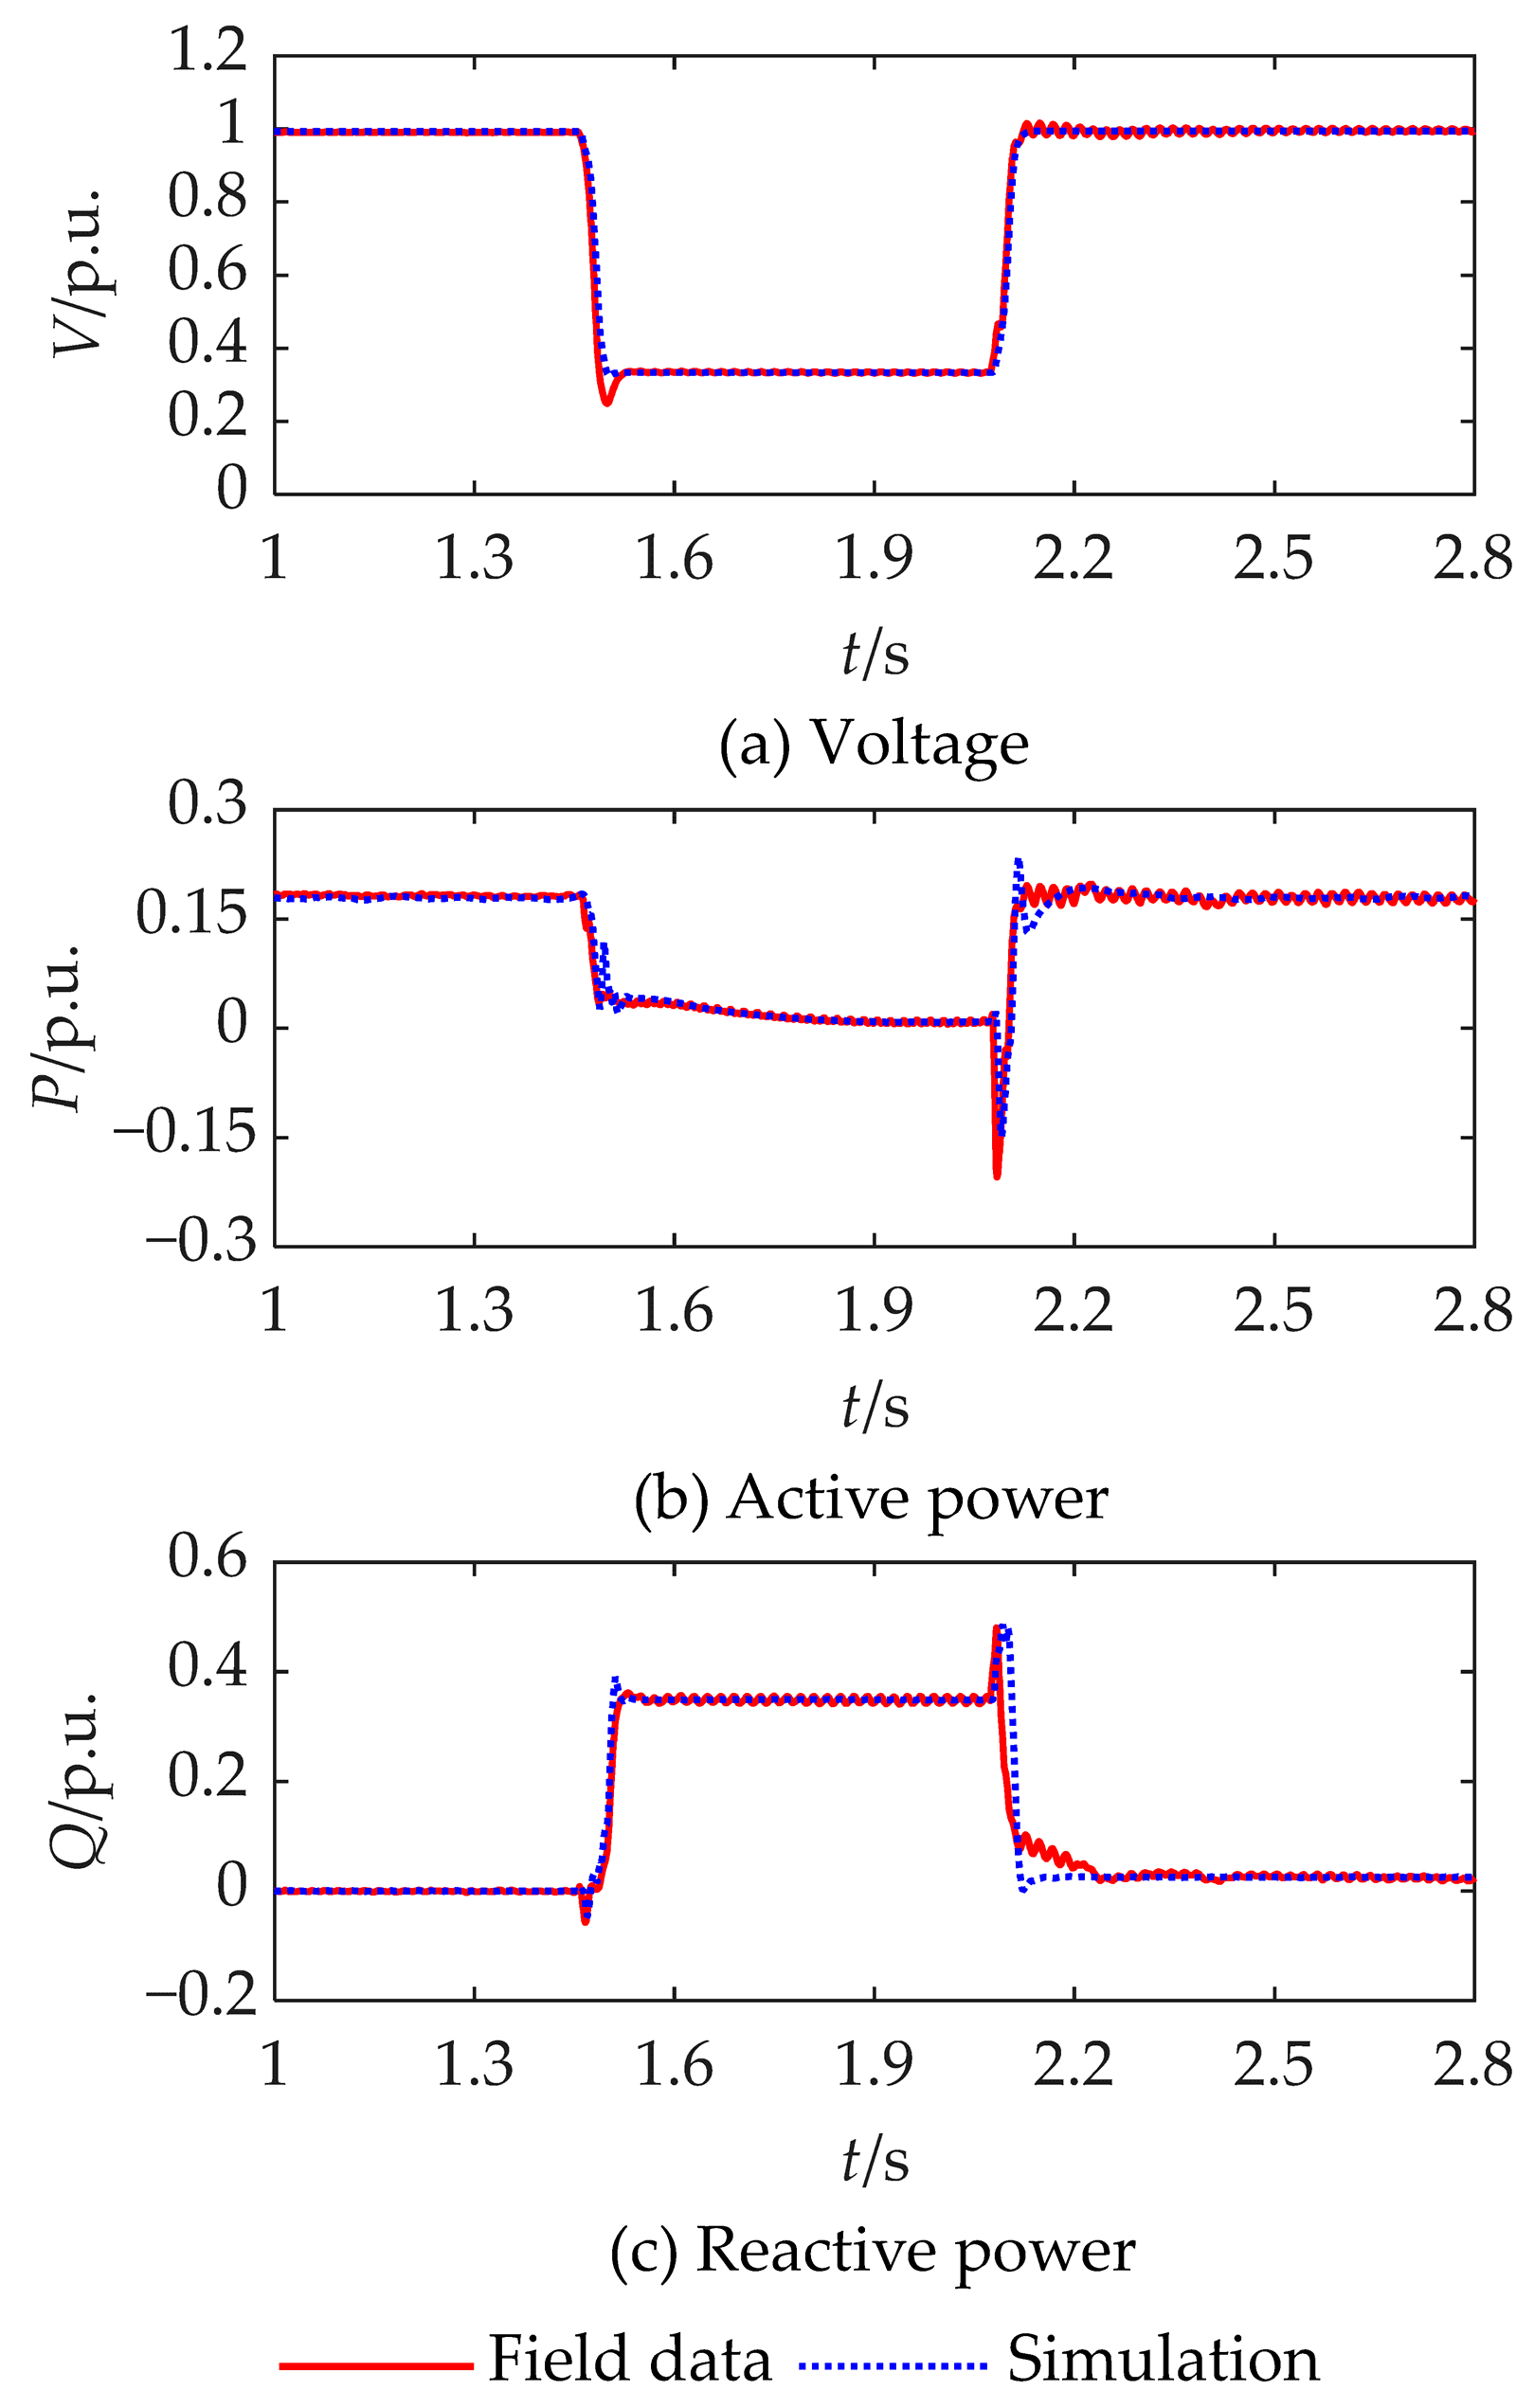
The control gains kpc and kic in Equation (10) play a crucial role in transient responses. In this paper, these gains are not arbitrarily chosen, but obtained through the parameter identification method proposed in [33], using LVRT test data of a 0.32 MW distributed PV unit. According to [33], the overall identification procedures are as follows:
Step 1: Conduct LVRT test for distributed PV unit, and calculate Pfault_max for each test cases.
Step 2: From all test results, determine the maximum output current during the fault period as imax, and the maximum reactive current as iqmax. Then, select test cases in which the reactive current does not reach the upper limit iqmax to identify k. The value of k can be calculated as
k = i qM I n ( u gM U n U th )
where iqM and ugM are the measured reactive current and grid voltage, respectively.
Step 3: Apply an optimization algorithm to iteratively identify kpc and kic using test data satisfying P0 > Pfault_max.
Step 4: Calculate the error of active power and reactive power between simulation and test data:
e PQ = 0.5 t 1 t 2 P M ( t ) P S ( t ) 2 d t + 0.5 t 1 t 2 Q M ( t ) Q S ( t ) 2 d t
where PM and Ps are the active power of measurement and simulation, and QM and Qs are the reactive power of measurement and simulation, respectively.
Step 5: Determine whether the termination condition is satisfied, e.g., the error ePQ is less than the pre-defined threshold or the number of iterations reaches the pre-defined maximum value. If satisfied, perform Step 6, otherwise return to Step 3;
Step 6: Output the identified parameter values of kpc and kic.
In this paper, a genetic algorithm is employed for parameter identification. The following GA parameters are set: population size is 100, crossover probability is 0.8, mutation probability is 0.05, and selection rule is rank. Figure A1 shows the comparison between the LVRT simulation with identified parameters and field test data. It can be observed that the LVRT response characteristics of the simulation model show good agreement with field test data, confirming the accuracy of the identified parameters. This approach enables the identified gains to capture realistic transient dynamics and provides good consistency with field test results, making them suitable for validating the proposed equivalent model.
Figure A1. Comparison of simulation and field test results under the PV unit with low power output.
Electronics 14 04355 g0a1

References

  1. Han, Y.; Zhang, K.; Li, H.; Coelho, E.A.A.; Guerrero, J.M. MAS-based distributed coordinated control and optimization in microgrid and microgrid Clusters: A comprehensive overview. IEEE Trans. Power Electr. 2018, 33, 6488–6508. [Google Scholar] [CrossRef]
  2. Higashikawa, K.; Ide, A.; Bian, W.; Kiss, T. Development of superconducting cable with energy storage function and evaluation of its functionality in DC microgrid with renewable energy sources. IEEE Trans. Appl. Supercond. 2023, 33, 5400405. [Google Scholar] [CrossRef]
  3. Badal, F.R.; Das, P.; Sarker, S.K.; Das, S.K. A survey on control issues in renewable energy integration and microgrid. Prot. Control. Mod. Power Syst. 2019, 4, 8. [Google Scholar] [CrossRef]
  4. Radovanovic, A.; Milanovic, J.V. Equivalent modelling of hybrid RES plant for power system transient stability studies. IEEE Trans. Power Syst. 2022, 37, 847–859. [Google Scholar] [CrossRef]
  5. Remon, D.; Cantarellas, A.M.; Rodriguez, P. Equivalent model of large-scale synchronous photovoltaic power plants. IEEE Trans. Ind. Appl. 2016, 52, 5029–5040. [Google Scholar] [CrossRef]
  6. Xie, Y.; He, Y.; Zhou, X.; Zhang, Z. Investigation of the feasibility of the dynamic equivalent model of large photovoltaic power plants in a harmonic resonance study. Electronics 2023, 12, 3746. [Google Scholar] [CrossRef]
  7. Rahbar, K.; Xu, J.; Zhang, R. Real-time energy storage management for renewable integration in microgrid: An off-line optimization approach. IEEE Trans. Smart Grid. 2015, 6, 124–134. [Google Scholar] [CrossRef]
  8. Ross, M.; Abbey, C.; Bouffard, F.; Joós, G. Multiobjective optimization dispatch for microgrids with a high penetration of renewable generation. IEEE Trans. Sustain. Energy 2015, 6, 1306–1314. [Google Scholar] [CrossRef]
  9. Shabanikia, N.; Khajehoddin, S.A. Weighted dynamic aggregation modeling of grid-following inverters to analyze renewable DG integrated microgrids. IEEE Trans. Ind. Electr. 2024, 71, 583–594. [Google Scholar] [CrossRef]
  10. Radovanovic, A.; Milanovic, J.V. Deep learning-based equivalent modelling of hybrid RES plant for efficient, repetitive power system transient stability studies. IEEE Trans. Power Syst. 2024, 39, 3008–3020. [Google Scholar] [CrossRef]
  11. Li, H.; Pang, S.; Huang, J. Equivalent modeling and simulation of large photovoltaic station. Appl. Mech. Mater. 2014, 615, 27–30. [Google Scholar] [CrossRef]
  12. Zhang, Y.; Li, F.; Zhang, L.; Wu, F.; Ma, M.; Zhang, X. Equivalent modeling of distributed photovoltaic power stations based on line impedance clustering. Acta Energiae Sol. Sin. 2022, 43, 312–318. [Google Scholar]
  13. Wang, J.; Wang, F.; Zhu, J.; Zhou, J. A multi-machine equivalent modeling method of T-connected inverter-interfaced distributed generation suitable for protection setting calculation of distribution network. In Proceedings of the 2024 the 7th International Conference on Energy, Electrical and Power Engineering (CEEPE), Yangzhou, China, 26–28 April 2024. [Google Scholar]
  14. Ma, Z.; Zheng, J.; Zhu, S.; Shen, X.; Wei, L.; Wang, X.; Men, K. Online clustering modeling of large-scale photovoltaic power plants. In Proceedings of the 2015 IEEE Power & Energy Society General Meeting, Denver, CO, USA, 26–30 July 2015. [Google Scholar]
  15. Sheng, W.; Ji, Y.; Wu, M.; Liu, H.; Kou, L. Dynamic clustering modeling of regional centralized photovoltaic power plant based on improved fuzzy c-means clustering algorithm. Power Syst. Technol. 2017, 41, 3284–3291. [Google Scholar]
  16. Cui, X.; Li, W.; Li, Z.; Fang, Y.; Xue, Y.; Xue, F. An online dynamic equivalent method for large-scale photovoltaic power plant suitable for electromechanical transient stability simulation. Autom. Electr. Power Syst. 2015, 39, 21–26. [Google Scholar]
  17. Zheng, J.; Ma, Z.; Wang, Z.; Wang, X.; Zhu, S.; Wei, L. Feature distance based online cluster modeling of LVRT controlled PV power plants. Electr. Power Syst. Res. 2018, 154, 223–233. [Google Scholar] [CrossRef]
  18. Wu, H.; Zhang, J.; Luo, C.; Xu, B. Equivalent modeling of photovoltaic power station based on canopy-FCM clustering algorithm. IEEE Access 2019, 7, 102911–102920. [Google Scholar] [CrossRef]
  19. Li, F.; Huang, Y.; Wu, F.; Liu, Y.; Zhang, X. Research on clustering equivalent modeling of large-scale photovoltaic power plants. Chin. J. Electr. Eng. 2018, 4, 80–85. [Google Scholar] [CrossRef]
  20. Ding, M.; Liu, X.; Bi, R.; Hu, D.; Ye, B.; Zhang, J. Method for cluster partition of high-penetration distributed generators based on comprehensive performance index. Autom. Electr. Power Syst. 2018, 42, 47–52+141. [Google Scholar]
  21. Ye, L.; Shi, Y.; Wang, Q.; Peng, Y.; Pei, M. Multi-step grouping and equivalent modeling of distributed photovoltaic clusters for transient analysis. Autom. Electr. Power Syst. 2023, 47, 72–81. [Google Scholar]
  22. Li, P.; Gu, W.; Wang, L.; Xu, B.; Wu, M.; Shen, W. Dynamic equivalent modeling of two-staged photovoltaic power station clusters based on dynamic affinity propagation clustering algorithm. Int. J. Electr. Power Energy Syst. 2018, 95, 463–475. [Google Scholar] [CrossRef]
  23. Wu, H.; Liu, Z.; Chen, Y.; Xu, B.; Qi, X. Equivalent modeling method for regional decentralized photovoltaic clusters based on cluster analysis. CPSS Trans. Power Electr. Appl. 2018, 3, 146–153. [Google Scholar] [CrossRef]
  24. Pan, X.; Wang, W.; Huang, H.; Liang, W.; Chen, H.; Yong, C. Equivalent modeling of PV station groups considering dynamic interaction between PV and power grid. Electr. Power Autom. Equip. 2023, 43, 80–85+109. [Google Scholar]
  25. Li, J.; He, G.; Sun, G.; Wang, Y.; Li, J. Clustering analysis method for large-scale photovoltaic with LVRT characteristics. Proc. CSU-EPSA 2023, 35, 1–8. [Google Scholar]
  26. Han, P.; Lin, Z.; Zhang, J.; Xia, Y.; Wang, L. Equivalent modeling of photovoltaic power plant based on factor analysis and correlation clustering. IEEE Access 2019, 7, 56935–56946. [Google Scholar] [CrossRef]
  27. Zhang, W.; Liu, X.; Shi, X.; Wang, Z.; Lin, L. Equivalent modeling of distributed photovoltaic clusters with various voltage support functions. In Proceedings of the 2024 IEEE 10th International Power Electronics and Motion Control Conference (IPEMC2024-ECCE Asia), Chengdu, China, 17–20 May 2024. [Google Scholar]
  28. Meng, H.; Ye, X.; Yang, M.; Song, X.; Su, Z.; Liu, W.; Luo, L.; Zhao, H. Equivalent modeling and simulation for PV system on dynamic clustering equivalent strategy. In Proceedings of the IECON 2017-43rd Annual Conference of the IEEE Industrial Electronics Society, Beijing, China, 29 October–1 November 2017. [Google Scholar]
  29. Fan, S. Investigation on Equivalent Modeling of Photovoltaic Power Plants. Master’s Thesis, Harbin Institute of Technology, Harbin, China, 2016. [Google Scholar]
  30. Kim, S.-K.; Kim, E.-S. PSCAD/EMTDC-based modeling and analysis of a gearless variable speed wind turbine. IEEE Trans. Energy Convers. 2007, 22, 421–430. [Google Scholar] [CrossRef]
  31. Han, P.; Lin, Z.; Wang, L.; Fan, G.; Zhang, X. A survey on equivalence modeling for large-scale photovoltaic power plants. Energies 2018, 11, 1463. [Google Scholar] [CrossRef]
  32. Zhu, Q. Research on Equivalent Modeling of Wind Power Plants for Electromechnical Transients in Power Systems. Doctoral Thesis, Hefei University of Technology, Hefei, China, 2017. [Google Scholar]
  33. Qi, J.; Li, W.; Chao, P.; Liang, X.; Sun, Y.; Li, Z. Generic EMT modeling method of Type-4 wind turbine generators based on detailed FRT studies. Renew. Energy 2021, 178, 1129–1143. [Google Scholar] [CrossRef]
Figure 1. The schematic diagram of a distributed PV unit.
Electronics 14 04355 g001
Figure 2. Typical LVRT power response waveforms of a distributed PV unit.
Electronics 14 04355 g002
Figure 3. Control block diagram of inverter controller considering LVRT control.
Electronics 14 04355 g003
Figure 4. The transient active power response of distributed PV units satisfying P0Pfault_max.
Electronics 14 04355 g004
Figure 5. The transient active power response of distributed PV units satisfying Pfault_max < P0Plim.
Electronics 14 04355 g005
Figure 6. The transient active power response of PV units satisfying P0 > Plim.
Electronics 14 04355 g006
Figure 7. Schematic diagram of clustering results conducted by Pfault_max and Pfault_avg.
Electronics 14 04355 g007
Figure 8. Schematic diagram of simulation system of distributed PV generation systems in a microgrid.
Electronics 14 04355 g008
Figure 9. Electrical distance of collector lines of different dispersion.
Electronics 14 04355 g009
Figure 10. Errors of the equivalent model using Pfault_avg under various voltage dips and electrical distance dispersion.
Electronics 14 04355 g010
Figure 11. Response of different models for 0.3 p.u. voltage dip under a high dispersion of electrical distance scenario.
Electronics 14 04355 g011
Figure 12. Response of different models of Case 1 when voltage drops to 0.3 p.u.
Electronics 14 04355 g012
Figure 13. Response of different models of Case 2 when voltage drops to 0.3 p.u.
Electronics 14 04355 g013
Figure 14. Response of different models of Case 1 when voltage drops to 0.2 p.u.
Electronics 14 04355 g014
Figure 15. Response of different models of Case 2 when voltage drops to 0.2 p.u.
Electronics 14 04355 g015
Figure 16. Response of different models of Case 1 when voltage drops to 0.4 p.u.
Electronics 14 04355 g016
Figure 17. Response of different models of Case 2 when voltage drops to 0.4 p.u.
Electronics 14 04355 g017
Figure 18. Response of different models of Case 1 under unbalanced fault.
Electronics 14 04355 g018
Figure 19. Response of different models of Case 2 under unbalanced fault.
Electronics 14 04355 g019
Figure 20. Active power of each distributed PV unit under varying irradiance scenario. The color lines represent the active power outputs of each PV unit.
Electronics 14 04355 g020
Figure 21. Response of different models under varying irradiance when voltage drops to 0.4 p.u.
Electronics 14 04355 g021
Table 1. Comparison of multi-machine equivalent modeling methods for PV generation system.
Equivalent MethodReferenceInput Variables RequiredCluster NumberComputational CostReported Errors
Clustering algorithm based method[12]Line impedance from PV unit to the PCC5MiddleBelow 2%
[14,15,16,17]PI parameters of inverter controllers3~4MiddleNo reported
[18]Filter inductance and PI parameters of inverter controllers3MiddleBelow 2%
[19]Irradiation intensity, temperature, and active power3MiddleBelow 1%
[20]Electrical distance, active power, and reactive power8MiddleNo reported
[21]Electrical distance, irradiation intensity, and inverter control parameters4MiddleNo reported
[22]Waveforms of voltage, current, active power, and reactive power
in a period of time
3HighBelow 5%
[23]Feature points extracted from the power response curveNo fixedMiddleBelow 1%
[24]PV unit’s voltage during fault period3MiddleNo reported
[25]PV unit’s voltage during fault period and network structure of system3~4HighNo reported
[26]Pre-fault and fault period data (active power, reactive power, active current, and reactive current)4MiddleBelow 1%
[27]Reactive power before and after the transient are used for clustering3MiddleNo reported
Threshold-based method[28]Pre-fault active power of PV units3LowBelow 4%
[29]Pre-fault active power of PV units3LowBelow 5%
Proposed methodPre-fault active power of PV units4LowBelow 3% (Error in Section 4)
Table 2. Main parameters of the distributed PV unit.
ParametersValues
Rated capacity of a distributed PV unit0.32 MW
Rated voltage of a distributed PV unit0.8 kV
DC link voltage1.5 kV
DC link capacitance6000 µF
Filter resistance0.003 Ω
Filter reactance0.0001 H
Transformer LV/HV ratio0.8/20 kV
Table 3. Clustering results of proposed equivalent model for two cases.
CaseClustersNumber of PV UnitsPre-Fault Steady-State Active Power of Equivalent Machine
Case 1Cluster 12, 3, 50.224 MW
Cluster 21, 4, 80.419 MW
Cluster 36, 11, 12, 15, 18, 191.178 MW
Cluster 47, 9, 10, 13, 14, 16, 17, 202.010 MW
Case 2Cluster 11, 2, 3, 4, 5, 8, 120.566 MW
Cluster 26, 11, 15, 18, 190.710 MW
Cluster 37, 9, 10, 170.768 MW
Cluster 413, 14, 16, 200.986 MW
Table 4. Error of different equivalent models under various steady-state operating conditions.
CaseVoltage DipError of Single-Machine
Equivalent Model
Error of Proposed Equivalent Model
Case 10.3 p.u.18.77%1.68%
Case 20.3 p.u.27.45%2.22%
Table 5. Computational time comparison of different models.
ModelComputational Time
Detailed model of distributed PV generation system852 s
Single-machine equivalent model12 s
Proposed equivalent model46 s
Table 6. Error of different equivalent models under different voltage dip scenarios.
CaseVoltage DipError of Single-Machine
Equivalent Model
Error of Proposed Equivalent Model
Case 10.2 p.u.20.72%1.62%
Case 20.2 p.u.29.11%1.95%
Case 10.4 p.u.18.74%1.71%
Case 20.4 p.u.25.26%2.49%
Disclaimer/Publisher’s Note: The statements, opinions and data contained in all publications are solely those of the individual author(s) and contributor(s) and not of MDPI and/or the editor(s). MDPI and/or the editor(s) disclaim responsibility for any injury to people or property resulting from any ideas, methods, instructions or products referred to in the content.