Article

Real-Time Estimation of Ionospheric Power Spectral Density for Enhanced BDS PPP/PPP-AR Performance

1
School of Geomatics, Liaoning Technical University, Fuxin 123000, China
2
College of Surveying and Mapping Engineering, Heilongjiang Institute of Technology, Harbin 150050, China
*
Author to whom correspondence should be addressed.
Electronics 2025, 14(21), 4342; https://doi.org/10.3390/electronics14214342
Submission received: 7 October 2025 / Revised: 1 November 2025 / Accepted: 2 November 2025 / Published: 5 November 2025

Abstract

The undifferenced and uncombined (UDUC) model preserves raw code and carrier-phase observations for each frequency, avoiding differencing or ionosphere-free combinations. This approach enables the direct estimation of atmospheric parameters. However, the stochastic characteristics of these parameters, particularly ionospheric delay, are often oversimplified or based on empirical assumptions, limiting the accuracy and convergence speed of Precise Point Positioning (PPP). To address this issue, this study introduces a stochastic constraint model based on the power spectral density (PSD) of ionospheric variations. The PSD describes the distribution of ionospheric delay variance across temporal frequencies, thereby providing a physically meaningful constraint for modeling their temporal correlations. Integrating this PSD-derived stochastic model into the UDUC framework improves both ionospheric delay estimation and PPP performance, especially under disturbed ionospheric conditions. This paper presents a BDS PPP/PPP-AR method that estimates the ionospheric power spectral density (IPSD) in real time. Vondrak smoothing is applied to suppress noise in ionospheric observations before IPSD estimation. Experimental results demonstrate that the proposed approach significantly improves convergence time and positioning accuracy. Compared to the empirical IPSD model, the PPP mode using the estimated IPSD reduced horizontal and vertical convergence times by 11.1% and 13.2%, and improved the corresponding accuracies by 15.7% and 12.6%, respectively. These results confirm that real-time IPSD estimation, coupled with Vondrak smoothing, establishes an adaptive and robust ionospheric modeling framework that enhances BDS PPP and PPP-AR performance under varying ionospheric conditions.

1. Introduction

The BeiDou Navigation Satellite System (BDS) has been developed by China to deliver global, all-weather, high-precision positioning, navigation, and timing (PNT) services. The third-generation BeiDou system (BDS-3) was officially commissioned on 31 July 2020, and has been providing global services since then [1]. The BDS-3 constellation consists of 3 geostationary (GEO) satellites, 24 medium Earth orbit (MEO) satellites, and 3 inclined geosynchronous orbit (IGSO) satellites. In addition to the B1I (1561.090 MHz) and B3I (1268.520 MHz) signals of BDS-2, BDS-3 provides four additional open-service signals: B1C (1575.420 MHz), B2a (1176.450 MHz), B2b (1207.140 MHz), and B2a+b (1191.795 MHz) [2,3,4]. Beyond PNT services, BDS-3 integrates Satellite-Based Augmentation (SBAS) and Precise Point Positioning (PPP) capabilities, as well as supporting short-message communication and international search-and-rescue functions. However, traditional PPP float solutions are plagued by long convergence times, which severely restricts their practical application. The use of uncalibrated phase delay (UPD) products for ambiguity resolution (AR) can be traced back to the late 20th century. Ge et al. [5] utilized server-estimated UPD products to recover integer ambiguities. They reported approximately a 30% improvement in positioning accuracy after AR, compared to float solutions. Reference [6] introduced the use of the Least-squares AMBiguity Decorrelation Adjustment (LAMBDA) method for sequential AR, enabling rapid and independent resolution of BDS-2 ultra-wide-lane (UWL) and wide-lane (WL) ambiguities. Their experiments demonstrated that using a third frequency to resolve both UWL and WL ambiguities simultaneously significantly improved positioning accuracy and accelerated convergence. Reference [7] presented a joint GPS/BDS PPP-AR positioning model accounting for the Inter-System Bias (ISB). Experimental results demonstrated that under limited satellite visibility, multi-system joint PPP-AR positioning outperformed single-system solutions, leading to substantial performance gains. Reference [8] extended the Digital Clock Model (DCM) from a dual-frequency combination to a triple-frequency uncombined formulation and assessed the multi-frequency PPP-AR performance for the Galileo system. Their results demonstrated that triple-frequency PPP-AR significantly enhanced both convergence speed and positioning accuracy. Reference [9] investigated the impact of abnormal ionospheric disturbances on positioning performance in low-latitude regions. Utilizing data from approximately 100 Continuously Operating Reference Stations (CORSs), the study analyzed variations in Total Electron Content (TEC) and their impact on single-system BDS PPP-AR. Experimental results demonstrated that increasing the elevation cutoff angle above 25° effectively mitigated the adverse effects of ionospheric disturbances from low-elevation signals, thereby significantly improving the positioning stability and accuracy of single-system BDS PPP-AR in low-latitude regions.
Ionospheric delay is primarily driven by factors such as solar ionizing radiation, geomagnetic activity, and user location. Its significant and complex spatiotemporal variations constitute a major source of error limiting the performance of Global Navigation Satellite System (GNSS) positioning. Two common approaches are employed to mitigate ionospheric delay: (1) forming an ionosphere-free combination to eliminate the first-order ionospheric term, and (2) estimating the slant ionospheric delay as an unknown parameter in a UDUC model. Compared to the UDUC model, the ionosphere-free combination suffers from two main drawbacks: (1) the combination process amplifies measurement noise, thereby degrading positioning precision; and (2) the elimination of the ionospheric parameter prevents the utilization of prior ionospheric information and its spatiotemporal correlations to enhance the solution [10,11,12,13,14,15,16]. Advances in multi-frequency and multi-system GNSS have made the advantages of the UDUC positioning model increasingly prominent, rendering it a major research focus [17,18,19].
In the UDUC observation model for PPP, ionospheric delays are estimated as unknown parameters. Appropriately constraining these ionospheric parameters can effectively improve PPP performance. This is typically achieved by applying constraints derived from Global Ionosphere Maps (GIMs), Network Real-Time Kinematic (NRTK) information, or PPP-RTK ionospheric corrections [20]. The Ionosphere-Weighted Model (IWM) operates by setting the double-differenced ionospheric prior to zero and applying appropriate constraints through the adjustment of its variance. This variance is often determined using an empirical formula or values defined as a function of baseline length. These prior constraints thus rely on externally provided ionospheric information. A critical challenge in the ionospheric weighting model lies in determining the prior variance, for which no universally accepted method currently exists. However, ionospheric variations in both time and space possess well-defined and accessible statistical characteristics [21]. Research on the spatial correlation of ionospheric errors has primarily focused on modeling ionospheric delays and correcting for regional ionospheric errors. When applying constraints to additional ionospheric parameters, the errors are often modeled as a linear function of latitude and longitude, and spatial constraints are implemented by estimating polynomial coefficients [22]. Reference [16] combined a deterministic model with a satellite-specific random process based on an empirical PSD to achieve refined modeling. They also introduced ionospheric corrections as pseudo-observations. Experimental results demonstrated that this method significantly improved the positioning accuracy of single-frequency PPP, reduced convergence time, and incurred minimal computational overhead. Owing to the rapid variability of the ionosphere and the complexity of influencing factors, establishing an accurate empirical model for its temporal correlation poses significant challenges [23]. By leveraging the linear relationships inherent in raw carrier-phase observations, ionospheric delays can be derived, reflecting variations in ionospheric errors. The temporal variations in the ionosphere are typically modeled as a random walk process, which is governed by its PSD. Thus, PSD governs the time-varying characteristics of ionospheric errors and characterizes the temporal changes in the ionosphere [24]. Reference [24] employed observation-derived ionospheric PSD in long-range network RTK experiments. The results demonstrated that the use of empirical PSD values significantly improved performance. Specifically, the ambiguity-fixing time for dynamic baseline processing was reduced by 65%, while the positioning accuracy in the East, North, and Up directions for long baselines improved by an average of 12%, 15%, and 19%, respectively. However, ionospheric observations contain measurement noise, and when differential time intervals are short, the noise overwhelms the intrinsic ionospheric variations [25]. The key to obtaining a PSD that reflects the time-varying characteristics of the ionosphere lies in attenuating noise in ionospheric observations. This study employs the Vondrak smoothing method to process ionospheric observations, thereby obtaining smoothed data that captures true ionospheric variations while suppressing noise. The PSD is then calculated from these denoised ionospheric observations, eliminating the need for empirical formulas and prior temporal constraints on the ionosphere. Here, ‘denoised observations’ refer to the ionospheric delay time series processed by the Vondrak filter, which suppresses high-frequency noise while preserving the dominant temporal variations in the ionosphere. The detailed filtering process and parameter selection are described in Section 2.2. Instead, real-time ionospheric characteristics are used to derive the random walk PSD. The effectiveness of the proposed method is validated through BDS-based PPP and PPP-AR positioning models, and its advantages in terms of convergence time and positioning accuracy are thoroughly analyzed. Furthermore, high-precision BDS triple-frequency UPD products are utilized for PPP-AR, and the performance of BDS PPP-AR is compared with that of the PPP float solution.

2. Methods

2.1. BDS Triple-Frequency UDUC PPP Model

In the UDUC PPP model, the ionospheric delay is estimated as an unknown parameter. Using raw carrier-phase and pseudorange measurements, the BDS triple-frequency UDUC PPP observation model is formulated as follows:
Δ P r , 1 s = u r s x + d t ¯ r + m r s Z r + I ¯ r , 1 s Δ P r , 2 s = u r s x + d t ¯ r + m r s Z r + μ 2 I ¯ r , 1 s Δ P r , 3 s = u r s x + d t ¯ r + m r s Z r + μ 3 I ¯ r , 1 s + e r , 3 s Δ L r , 1 s = u r s x + d t ¯ r + m r s Z r I ¯ r , 1 s + λ 1 N ¯ r , 1 s Δ L r , 2 s = u r s x + d t ¯ r + m r s Z r μ 2 I ¯ r , 1 s + λ 2 N ¯ r , 2 s Δ L r , 3 s = u r s x + d t ¯ r + m r s Z r μ 3 I ¯ r , 1 s + λ 3 N ¯ r , 3 s
In Equation (1), Δ P r , j s and Δ L r , j s denote the pseudorange and carrier-phase observation values for frequency j , corrected by the model and precise satellite products, subtracting the computed values. u r s is the station-to-satellite direction vector. s and r denote the satellite and station numbers, respectively. x is the coordinate vector. d t ¯ r = c d t r + d r , I F 12 , c is the speed of light in a vacuum. d t r is the receiver error, and d r , I F 12 represents the receiver hardware delay bias mapped to the ionosphere-free combination. Z r and m r s denote the zenith wet tropospheric delay and its corresponding mapping function, respectively. I ¯ r , 1 s denotes the reparametrized slant ionospheric delay at the first frequency, which is a combined parameter that absorbs hardware delays to resolve linear dependencies in the model. Meanwhile I ¯ r , 1 s = I r , 1 s β 12 ( Δ D P B 12 s + Δ D P B r , 12 ) and I r , 1 s represent the actual slant ionospheric delays on their respective frequencies. β 12 = f 2 2 f 1 2 f 2 2 and μ i = ( f 1 / f i ) 2 are the frequency-dependent ionospheric scaling factors. Δ D P B 12 s and Δ D P B r , 12 are the satellite and receiver hardware delay biases, respectively. λ i is the wavelength corresponding to frequency i . N ¯ r , 1 s denotes the carrier-phase ambiguity parameter, which absorbs hardware delays. Since the pseudorange observation on the third frequency uses the same receiver clock bias parameter as the first two frequencies, an additional pseudorange bias parameter e r , 3 s for the third frequency must be introduced to absorb the associated hardware delays.
In UDUC PPP, atmospheric delays are typically modeled as random walk processes. The expectation of the ionospheric and tropospheric variations between consecutive epochs is zero. By adjusting the process noise variance of these random walk processes, the atmospheric parameters can be appropriately constrained. Before estimating tropospheric delay errors using a projection function, a priori tropospheric models can be applied for correction. The random walk process of the tropospheric delay parameter can be expressed as
R Z T D ( t ) = R Z T D ( t 1 ) + ω Z ( t ) , ω Z ( t ) ~ N ( 0 , σ Z 2 )
In Equation (2), R Z T D ( t ) denotes the zenith tropospheric delay at epoch t , t 1 denotes the previous epoch, and ω Z ( t ) denotes the zenith tropospheric parameters between differential epochs, which follow a normal distribution with a mean of zero and variance of σ Z 2 .
Similarly, the temporal variation in the ionospheric delay is modeled as a random walk process:
I r s ( t ) I r s ( t 1 ) = ω I , ω I ~ N ( 0 , σ I 2 )
In Equation (3), I r s ( t ) denotes the slant ionospheric delay at epoch t , and ω I is the process noise, following a zero-mean normal distribution with variance σ I 2 . From Equations (2) and (3), it is evident that determining an appropriate process noise variance is crucial for properly constraining the atmospheric parameters.
The variance of the ionospheric process noise is Δ t and the PSD. The relationship between the variance and the ionospheric PSD q 2 ( I r s ) is
σ I 2 = Δ t q 2 ( I r s )

2.2. Ionospheric PSD Calculation and Smoothing Method

The ionospheric observation I r , j k s ( i ) at observation epoch i for any two frequencies j and k can be expressed as
I r , j k s ( i ) = f k 2 f k 2 f j 2 L r , j s ( i ) L r , k s ( i ) + ( λ j N r , j s λ k N r , k s ) ( ε r , j s ε r , k s )
In Equation (5), L r s denotes the undifferenced phase observation value, N r s denotes the undifferenced carrier-phase ambiguity, and ε r s denotes the observation noise of the carrier-phase measurement. From Equation (5), it is evident that the ionospheric observation derived from carrier-phase measurements contains the integer ambiguity, making it impossible to determine the absolute ionospheric delay. By applying epoch differencing to the ionospheric observations, the integer ambiguity parameter is eliminated. The epoch-differenced ionospheric (EDI) observation, which characterizes the temporal variation in the ionosphere between epochs i Δ i to time i , can be expressed as
Δ I r , j k s ( i ) = I r , j k s ( i ) I r , j k s ( i Δ i ) + ε ϕ , j k s ( i )
From Equation (6), it can be seen that the EDI is contaminated by the carrier-phase observation noise ε ϕ , j k s . Since the three BDS frequencies are known, the variance of the observation noise in the EDI for any frequency combination can be calculated based on the known carrier-phase measurement precision and the frequency scaling factors.
The corresponding variance relationship is given as
D ( Δ I r , j k s ( i ) ) = D ( I r , j k s , Δ i ) + D ( ε ϕ , j k s )
In Equation (7), D ( Δ I r , j k s ( i ) ) denotes the variance of the EDI, which can be computed from a time series of ionospheric observations. D ( I r , j k s , Δ i ) denotes the variance of the true ionospheric variation between epochs, and D ( ε ϕ , j k s ) denotes the variance of the carrier-phase observation noise.
Analogous to the relationship between IPSD and variance in Equation (4), IPSD can be expressed in terms of the EDI variance, ionospheric variation, and observation noise variance as follows:
q 2 ( I r s ) = D ( Δ I r , j k s ( i ) ) / Δ t D ( ε ϕ , j k s )
The PSD calculated directly from raw observations does not represent the true ionospheric variations due to contamination by observation noise. Therefore, to accurately reflect ionospheric variations through the IPSD, the ionospheric observations must be denoised [26]. Moving averaging is the most commonly used method for denoising observational data. The choice of smoothing window length is critical in moving averaging. If the smoothing window is too short, noise cannot be adequately removed; if it is too long, genuine ionospheric variations may be oversmoothed. Thus, the smoothing window must strike a balance between noise reduction and the preservation of true ionospheric signals [27]. Vondrak filtering can effectively smooth observational data without prior knowledge of the underlying variation pattern or an explicit fitting function. Therefore, Vondrak filtering is well-suited for suppressing observational noise in this context. The basic criterion of Vondrak filtering is [28]
Q = i = 1 n p i ( x i x i ~ ) 2 + λ 2 ( i = 1 n 3 Δ 3 x i ~ ) 2 = A + λ 2 S = min
In Equation (9), p i denotes the weight of the observations, x i is the original observation sequence, and x i ~ denotes is the smoothed sequence. The term Δ 3 represents the third difference in the smoothed values; minimizing this term suppresses high-frequency oscillations to produce a smooth curve. The parameter α = 1 λ 2 ( 0 , + ) is a predefined dimensionless positive smoothing factor.
In Equation (9), the term A quantifies the fidelity of the smoothed values to the original observations, where A = 0 corresponds to the case where the smoothed values perfectly match the original data. The term S represents the smoothness of the fitted curve, reflecting the level of residual noise. When S = 0 holds, the smoothed values form a linear sequence. A larger smoothing factor α results in a stronger smoothing effect. This study employs the observation-error method to determine the optimal smoothing factor α . The method involves applying Vondrak filtering with a range of smoothing factors and computing the resulting root mean square (RMS) between the original and smoothed observations. The smoothing factor that yields an RMS value closest to the known standard deviation of the observation noise is selected as optimal. For a set of candidate smoothing factors, the corresponding RMS errors are calculated as follows:
σ ( α ) = i = 1 n p i ( x i x i ~ ) 2 n
The optimal smoothing factor σ ( α ) σ m is selected such that the RMS from Equation (10) is closest to σ m , which denotes the standard deviation of the noise in the ionospheric observations. Therefore, the optimal smoothing criterion for the ionospheric observations in this study is derived from Equation (9) as
i = 1 n p i ( Δ I r , j k s ( i ) Δ I r , j k s ( i ) ~ ) 2 + λ 2 ( i = 1 n 3 Δ 3 Δ I r , j k s ( i ) ~ ) 2 = min
In Equation (11), p i represents the weight of observations at different epochs. In this study, we assign equal weights to all observations. I r , j k s ( i ) and I r , j k s ( i ) ~ represent the ionospheric observations before and after smoothing, respectively. The PSD is then estimated using the denoised ionospheric variation derived from the smoothed observations:
q 2 ( I r s ) = q 2 ( I r s ~ ) = Δ I r , j k s ( i ) 2 ~ / ( n Δ t )
In Equation (12), Δ I r , j k s ( i ) 2 ~ denotes the denoised EDI. Using Equation (12) with the denoised EDI sequence allows for the estimation of a more accurate and representative IPSD, reflecting the true ionospheric variation characteristics.
In summary, the Vondrak filter is applied to smooth the EDI observation sequence. The inputs to this process are the raw, noise-contaminated EDI observations and the pre-determined standard deviation of the carrier-phase observation noise. The core of the method lies in achieving an optimal balance between preserving the true ionospheric variation trend and suppressing measurement noise. This balance is controlled by the optimal smoothing factor, which is determined objectively via the ‘observation-error method’. The output is the smoothed ionospheric data, which is then used to calculate a more accurate and representative IPSD. This real-time estimated IPSD subsequently provides an adaptive and physically meaningful stochastic constraint for the ionospheric delay parameter within the PPP filter.

2.3. BDS Three-Frequency Undifferenced PPP-AR Method

The procedure for user-end ambiguity resolution is as follows. First, between-satellite single-differencing is applied to observations from satellites m and n to eliminate the receiver UPD. Subsequently, the pre-estimated satellite UPD products for the Extra-Wide Lane (EWL, Δ d E W L m , n ), Wide Lane (WL, Δ d W L m , n ), and Narrow Lane (NL) are applied. These products are used to convert the between-satellite single-differenced float ambiguities Δ N ¯ r , 1 s , Δ N ¯ r , 2 s , and Δ N ¯ r , 3 s into their corresponding EWL, WL, and NL integer ambiguities, denoted as Δ N r , E W L m , n , Δ N r , W L m , n , and Δ N r , N L m , n , respectively. The EWL and WL ambiguities are defined as
Δ N r , E W L m , n Δ N r , W L m , n = 0 1 1 1 1 0 Δ N ¯ r , 1 m , n Δ N ¯ r , 2 m , n Δ N ¯ r , 3 m , n + Δ d E W L m , n Δ d W L m , n
The LAMBDA method (Teunissen, 1995) is first employed to resolve the EWL ambiguity Δ N r , E W L m , n ; After successful EWL ambiguity resolution, the fixed ambiguity value is used to update other parameters in the filter, including the ionospheric delays and receiver coordinates [29]. The same procedure is then applied to fix the WL ambiguity. The fixed WL ambiguity, in turn, aids in resolving the NL ambiguity Δ N r , N L s : as follows:
Δ N r , N L m , n = f 2 2 f 1 2 f 2 2 f 2 2 f 1 2 f 2 2 Δ N ¯ r , 1 m , n Δ N ¯ r , 2 m , n + f 2 Δ N r , W L m , n Δ d W L m , n f 1 2 f 2 2 + Δ d N L m , n
This study adopts a partial ambiguity resolution strategy. A subset of ambiguities is selected for fixing based on criteria such as satellite elevation angle and the variance of the float ambiguity estimates. If the number of remaining ambiguity parameters after selection is fewer than four, the solution defaults to the float solution. The ratio test threshold for the LAMBDA method is set to 3. The methodologies described in Section 2 were implemented and evaluated through the following experiments.

3. Results

3.1. IPSD Characteristics Analysis

The temporal variation in the ionosphere is modeled as a random walk process, which is governed by its ionospheric IPSD. The IPSD directly characterizes the ionosphere’s time-varying behavior. The accurate estimation of IPSD from ionospheric observations is hampered by measurement noise. Therefore, the effective suppression of observation noise is essential for the accurate determination of IPSD. This noise suppression relies on leveraging the distinct statistical characteristics of true ionospheric variations versus measurement noise.
To evaluate the smoothing performance of the Vondrak filter, we selected data from the ABMF station on DOY 124, 2024, with a 1 s sampling interval. The smoothing effect was analyzed by applying a 60 s moving average window to BDS satellite data over 3000 epochs and comparing it with the Vondrak method. Figure 1 presents the original EDI-derived ionospheric observations, along with the corresponding Vondrak-smoothed and moving-averaged values, for satellites C02, C10, and C35. To analyze ionospheric variations across different time scales, differential intervals of 1 s, 30 s, and 90 s were examined. The 1 s interval reflects the raw sampling rate, where signals are dominated by noise. The 30 s interval is a standard GNSS data approach, and the 90 s interval was chosen because preliminary tests indicated that the estimated IPSD stabilizes beyond this point, suggesting effective noise suppression and the emergence of true ionospheric behavior. As shown in Figure 1, the raw ionospheric delays are contaminated by significant noise, exhibiting random fluctuations. Both smoothing methods effectively suppress this noise and produce more stable time series. However, the Vondrak filter more accurately captures the underlying trend of ionospheric variation compared to the moving average, particularly during periods of rapid ionospheric change. This advantage of the Vondrak filter becomes more pronounced during periods of intense ionospheric activity.
To investigate the statistical distribution and variability of the EDI across different differential intervals, a 3000 s dataset was analyzed. The resulting EDI values at various time intervals approximately follow a normal distribution, as illustrated in Figure 2. As summarized in Table 1, increasing the differential interval results in increased mean values and standard deviations of the EDI for all satellites. Even at the 90 s interval, the mean remains relatively small, and the distribution continues to approximate a normal distribution. These observations support the modeling of the ionospheric parameters as a random walk process. In the estimation filter, the expected value of the temporal variation is set to zero, while its variance is dynamically adjusted based on the estimated IPSD. As implied by Equation (8), the influence of observation noise on the IPSD estimate is inversely proportional to the differential interval. Consequently, when IPSD is computed using short differential intervals, the estimate is dominated by observation noise. As the interval increases, the influence of observation noise diminishes, and the estimated IPSD decreases. As shown in Figure 3 and Figure 4, at a 1 s differential interval, the EDI observations are dominated by noise and fail to reveal the underlying ionospheric variation. Thus, the 1 s EDI observations exhibit characteristics akin to white noise. In contrast, at a 90 s interval, the influence of observation noise is substantially reduced, and the EDI observations begin to display a random walk pattern over time. In contrast, at a 90 s interval, the influence of observation noise is substantially reduced, and the EDI observations begin to display a random walk pattern over time. This trend is consistently observed across all satellites as the differential interval increases. Correspondingly, the estimated IPSD for each satellite decreases as the differential interval increases (Figure 4). This occurs because longer intervals effectively suppress the contribution of observation noise to the variance calculation. Beyond a certain interval (e.g., around 90 s in this case), the IPSD for each satellite ceases to decrease and stabilizes. At this stage, the influence of observation noise becomes negligible, and the stabilized IPSD value represents the inherent power of the true ionospheric variations.

3.2. PPP/PPP-AR Positioning Experiment

To comprehensively evaluate the impact of IPSD on PPP/PPP-AR performance, two sets of experiments were conducted employing data from 12 globally distributed MGEX stations. These 12 MGEX stations were strategically selected to ensure global coverage across different latitudes and continuous availability of BDS triple-frequency data, thereby providing a representative sample of diverse ionospheric conditions. In Experiment 1, BDS observation data from DOY 111 to 135, 2024 (spanning 25 days), were processed under two modes to evaluate the static PPP performance of the BDS system. Notably, an extreme magnetic storm occurred on DOY 132, characterized by a Dst index of −412 nT. The data sampling interval was set to 30 s. The geographic distribution of the stations is shown in Figure 5, and their precise latitudes and longitudes are listed in Table 2. The experimental strategy for PPP/PPP-AR is shown in Table 3.
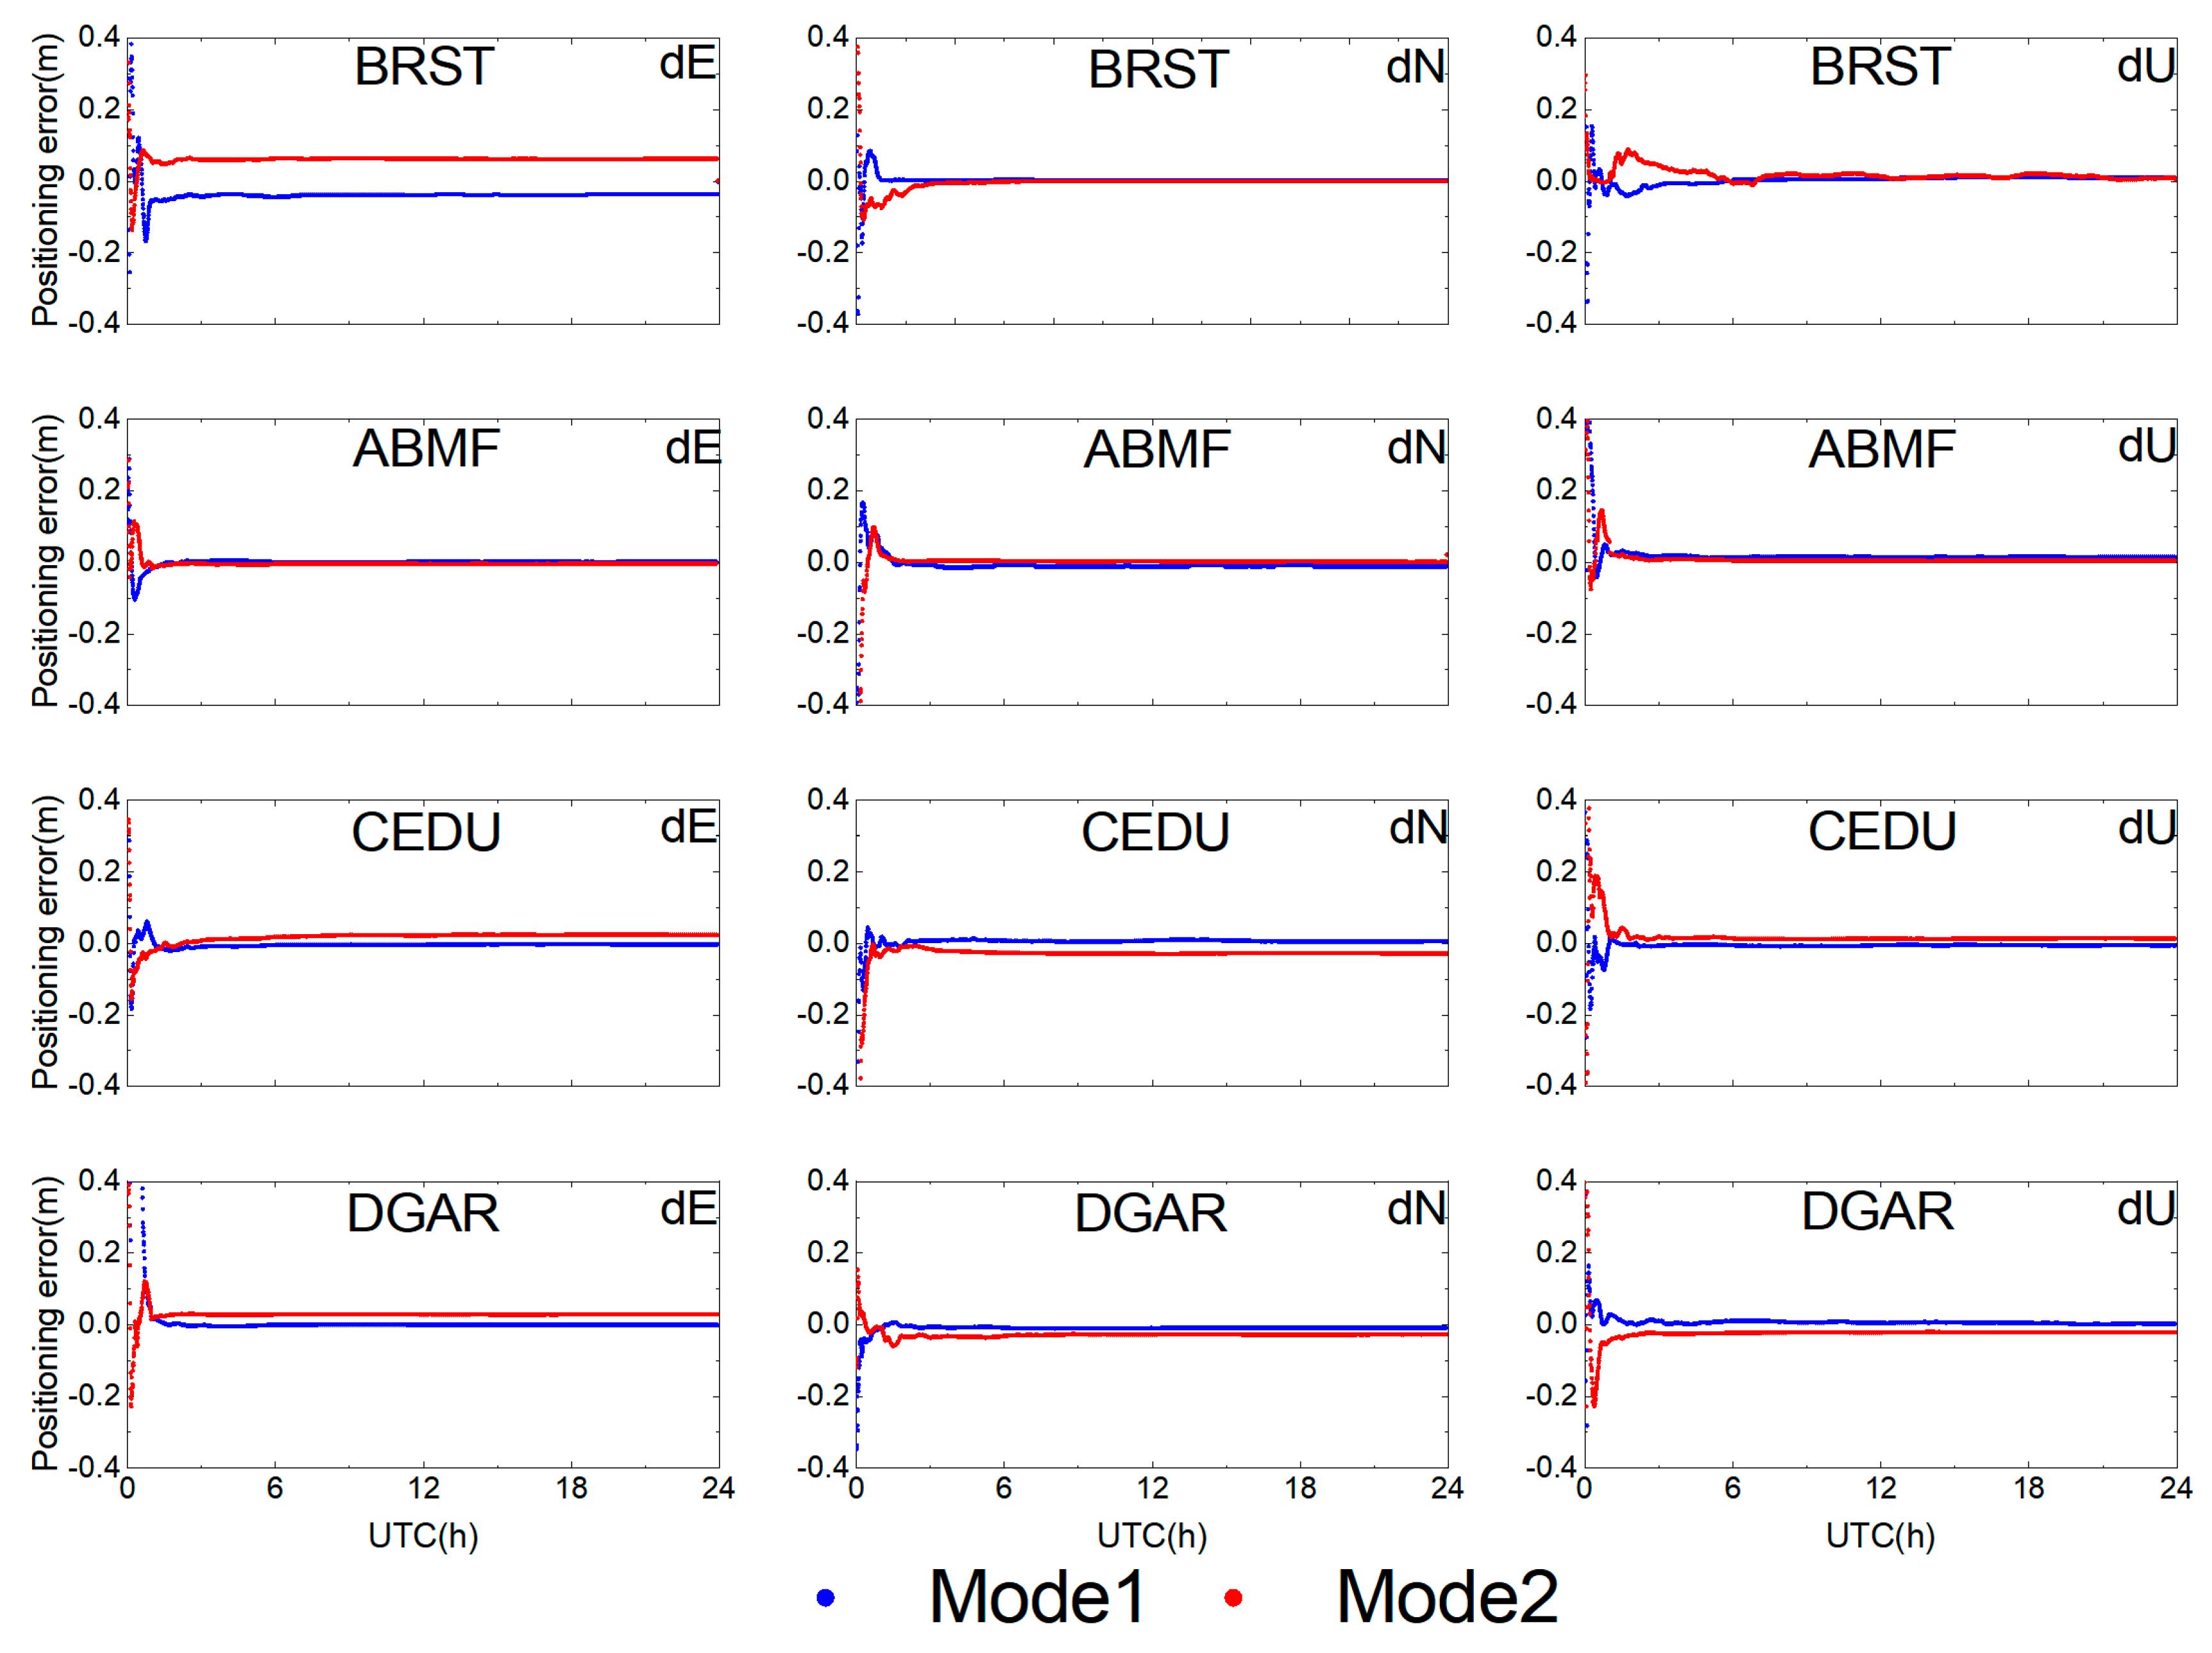
In Mode 1, ionospheric delays were modeled as a random walk process whose PSD was estimated in real time (estimated IPSD), and the ambiguities were estimated as float solutions. Mode 2 used the same float ambiguity resolution strategy as Mode 1, but the PSD was set to an empirical value (1.7 × 10⁻⁵ m2/s) instead of being estimated in real time. Convergence was defined as the epoch from which both the horizontal and vertical positioning errors subsequently remained below 0.1 m [30,31]. The positioning performance was analyzed over the entire 25-day period across all 12 stations. Figure 6 shows the static PPP error time series for stations BRST, ABMF, CEDU, and DGAR on DOY 124. The results indicate noticeable differences between Modes 1 and 2. After convergence, the error series remain stable, with positioning errors in the North (N), East (E), and Up (U) directions generally below 0.03 m. However, the positioning error trajectories of certain stations do not fully overlap. Overall, Mode 1 (with estimated IPSD) consistently achieved smaller positioning errors compared to Mode 2 (empirical IPSD).
In Experiment 2, BDS observation data from the same 25-day period (DOY 111-135, 2024) were processed under two modes to evaluate the static PPP-AR performance. Modes 3 and 4 involved PPP-AR utilizing high-precision UPD products. These UPD products were estimated using data from a separate global network of 170 MGEX stations. The distribution of these UPD estimation stations is also shown in Figure 5. In Mode 3, ionospheric delays were modeled as a random walk with the PSD estimated in real time (estimated IPSD). In Mode 4, the same ionospheric model was applied, but the PSD was set to the empirical value. Ambiguity resolution was carried out using between-satellite single-differencing combined with a partial AR strategy.
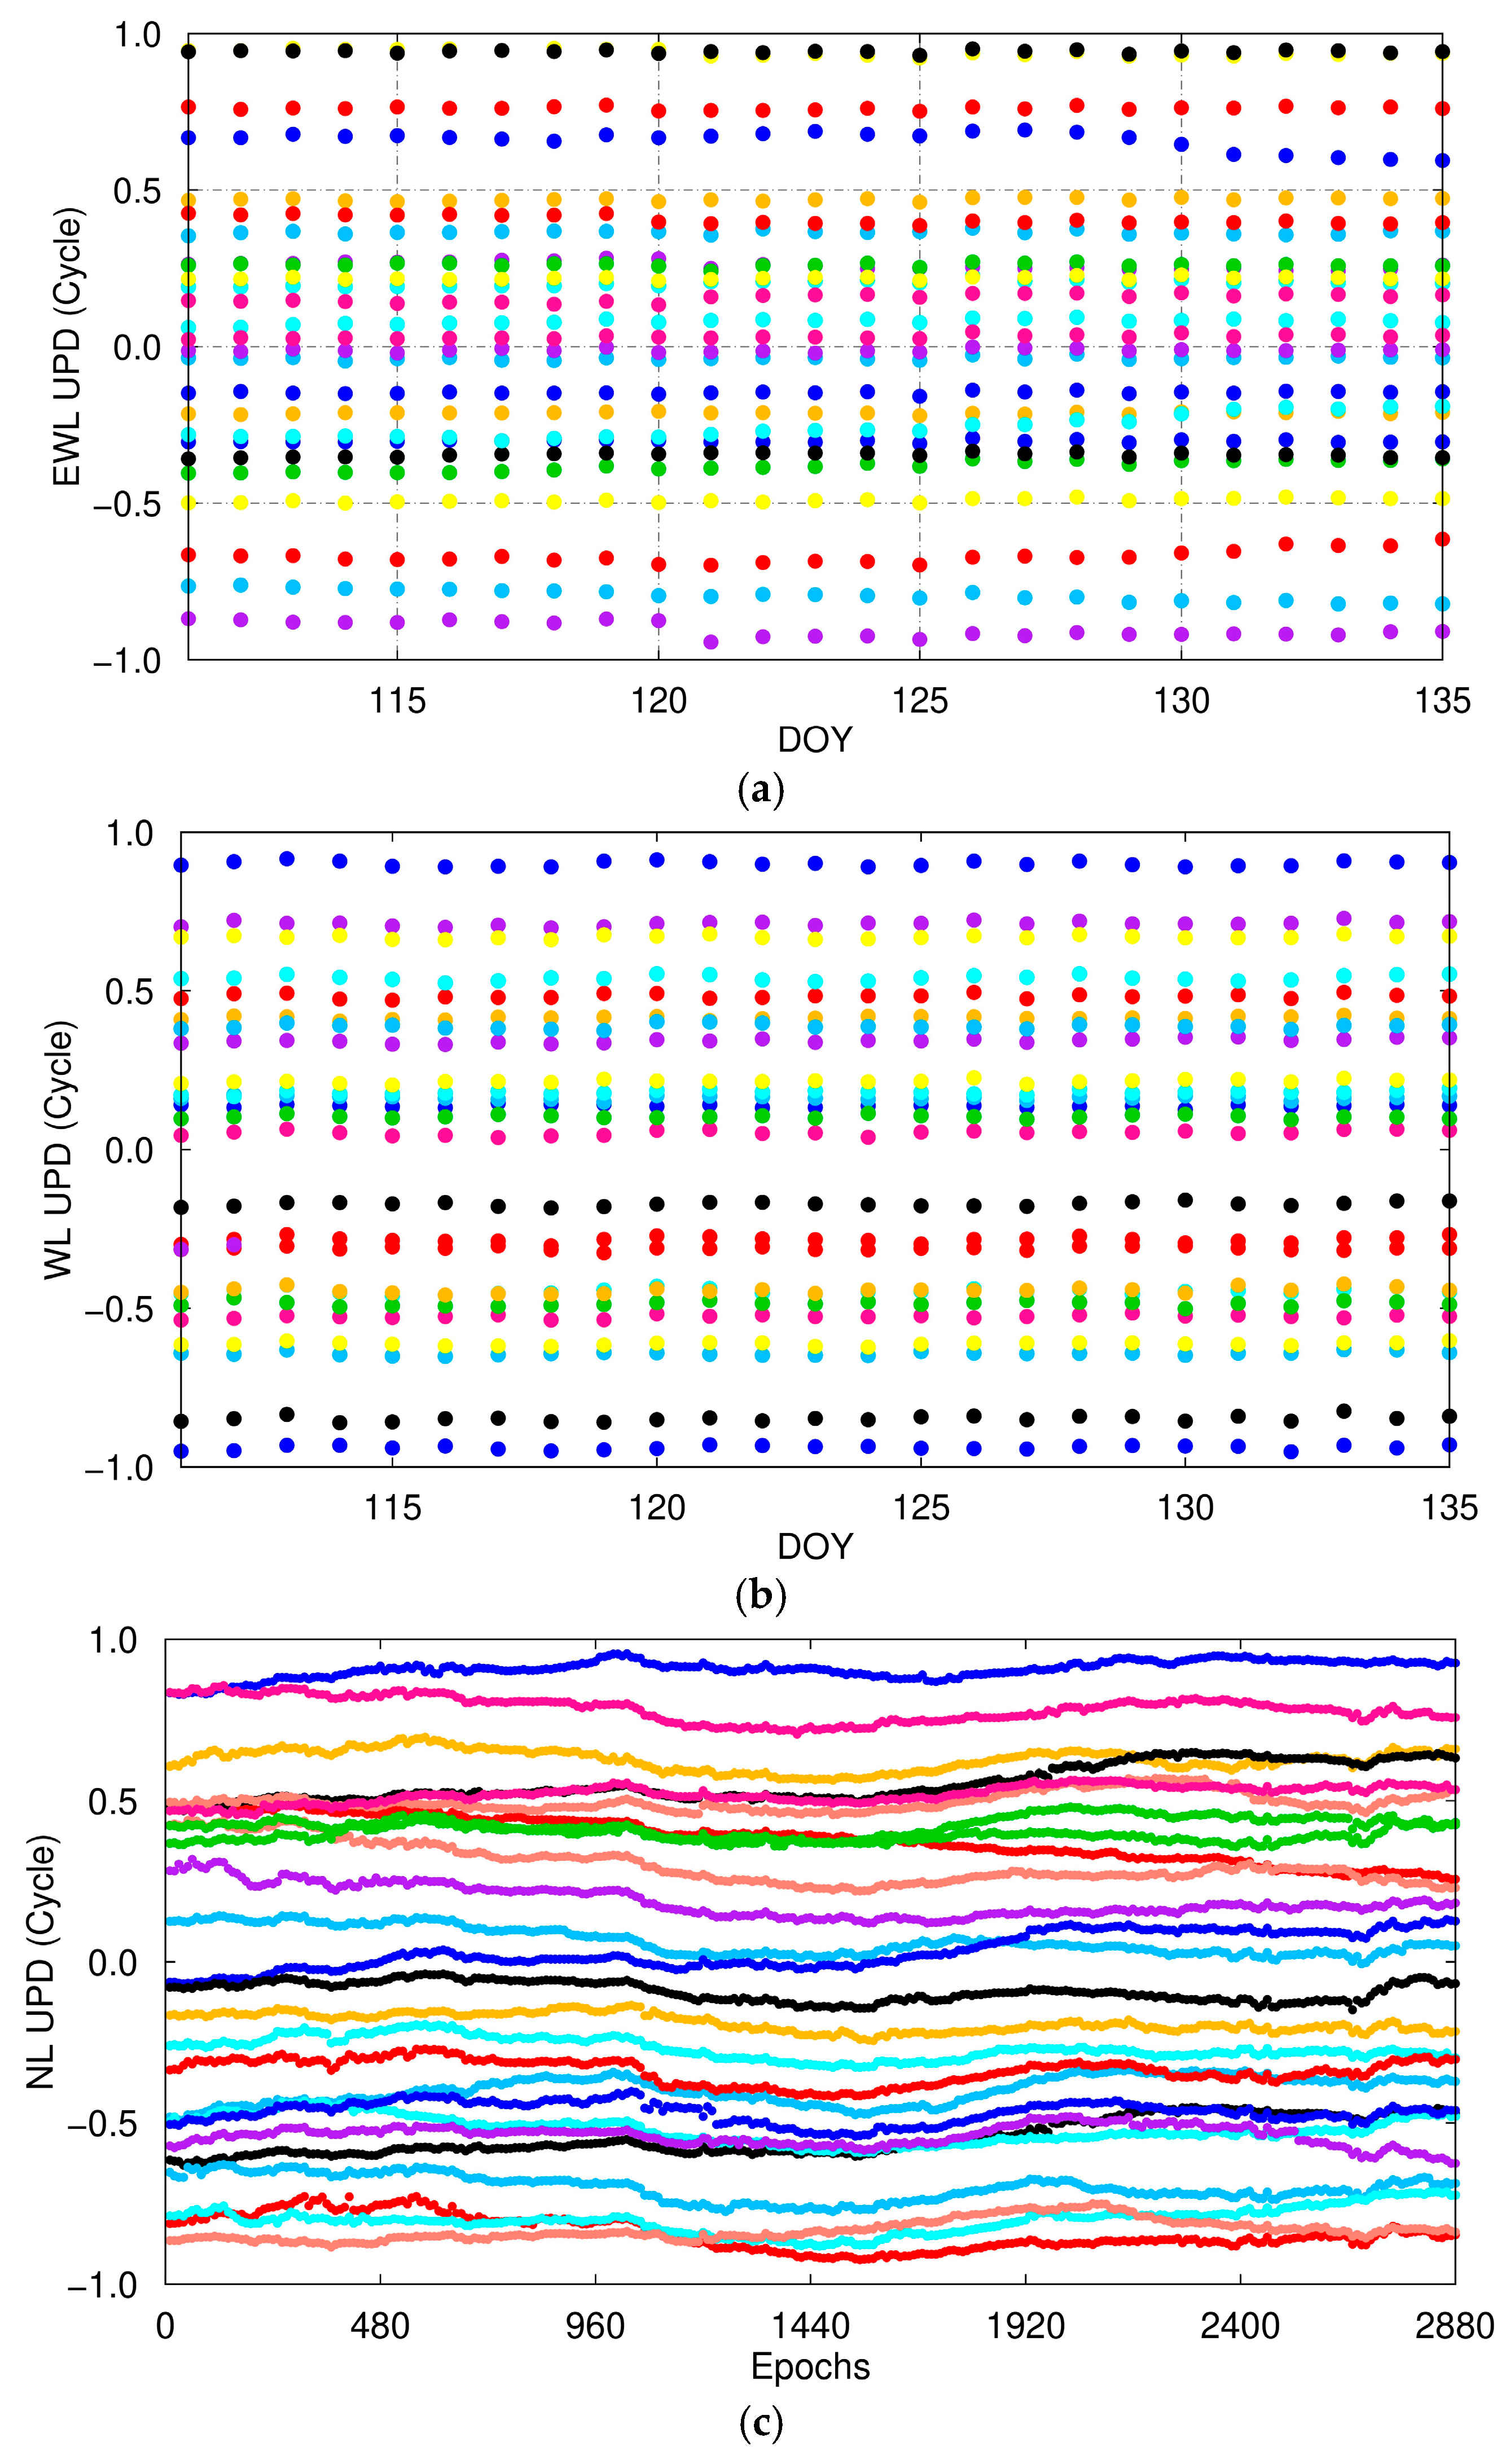
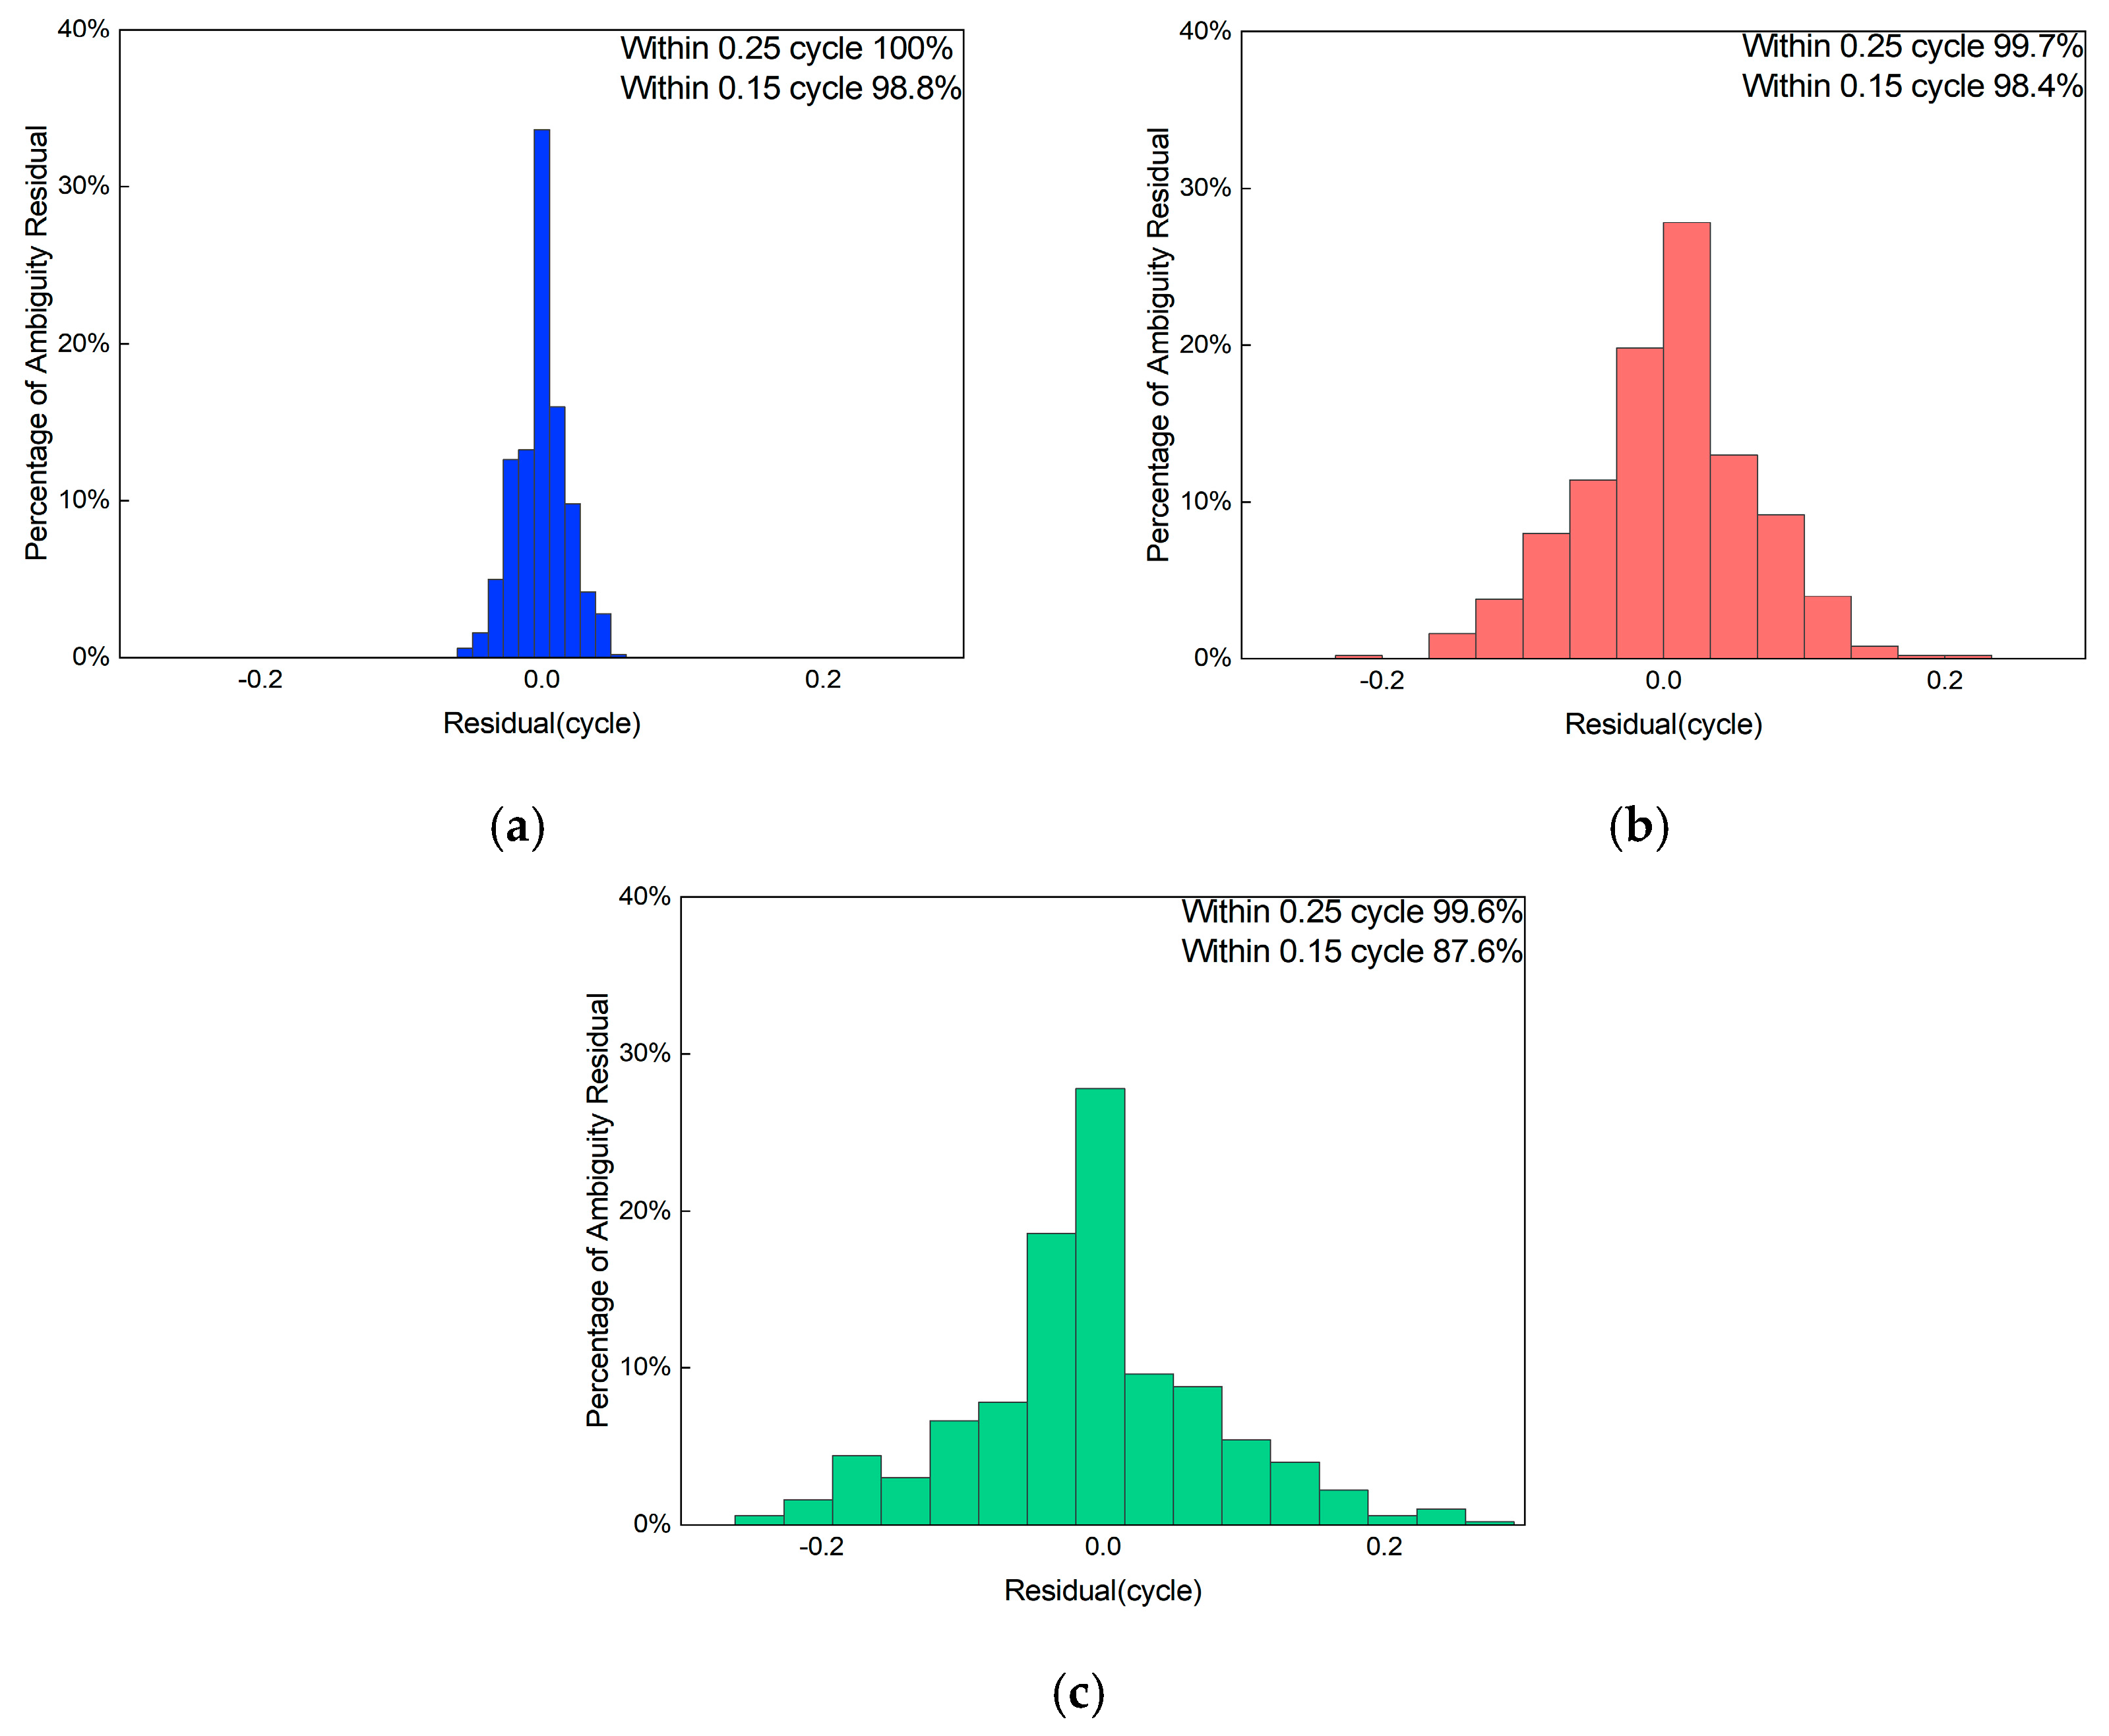
High-precision UPD products are essential for recovering the integer nature of carrier-phase ambiguities. The BDS satellite UPDs were estimated using the global MGEX station data. Figure 7 presents the estimated EWL and WL UPD sequences for the entire 25-day period (DOY 111–135), and the NL UPD sequence for a single day (DOY 124). The sequences exhibit good stability over time. Different colors indicate UPD sequences from different BDS satellites. For clarity, the sequences were vertically shifted in the figure to highlight variation trends. The average standard deviations of the estimated BDS EWL, WL, and NL UPDs across all satellites were 0.019, 0.024, and 0.068 cycles, respectively. To further validate the accuracy of the UPD products, the distributions of the ambiguity residuals after applying satellite UPD corrections were analyzed, as shown in Figure 8. Overall, the EWL, WL, and NL residuals exhibit symmetric distributions centered near zero, indicating the absence of significant systematic biases. All EWL ambiguity residuals fall within ±0.25 cycles, and 98.8% fall within ±0.15 cycles, confirming the high accuracy of the EWL UPD product. For WL residuals, 99.6% fall within ±0.25 cycles, and 98.4% fall within ±0.15 cycles. For NL residuals, 99.6% lie within ±0.25 cycles, while 87.6% lie within ±0.15 cycles. These results demonstrate that the EWL UPD product achieves the highest accuracy, followed by WL, with NL being the least accurate, as expected due to the influence of unmodeled atmospheric delays and measurement noise on the raw carrier-phases.
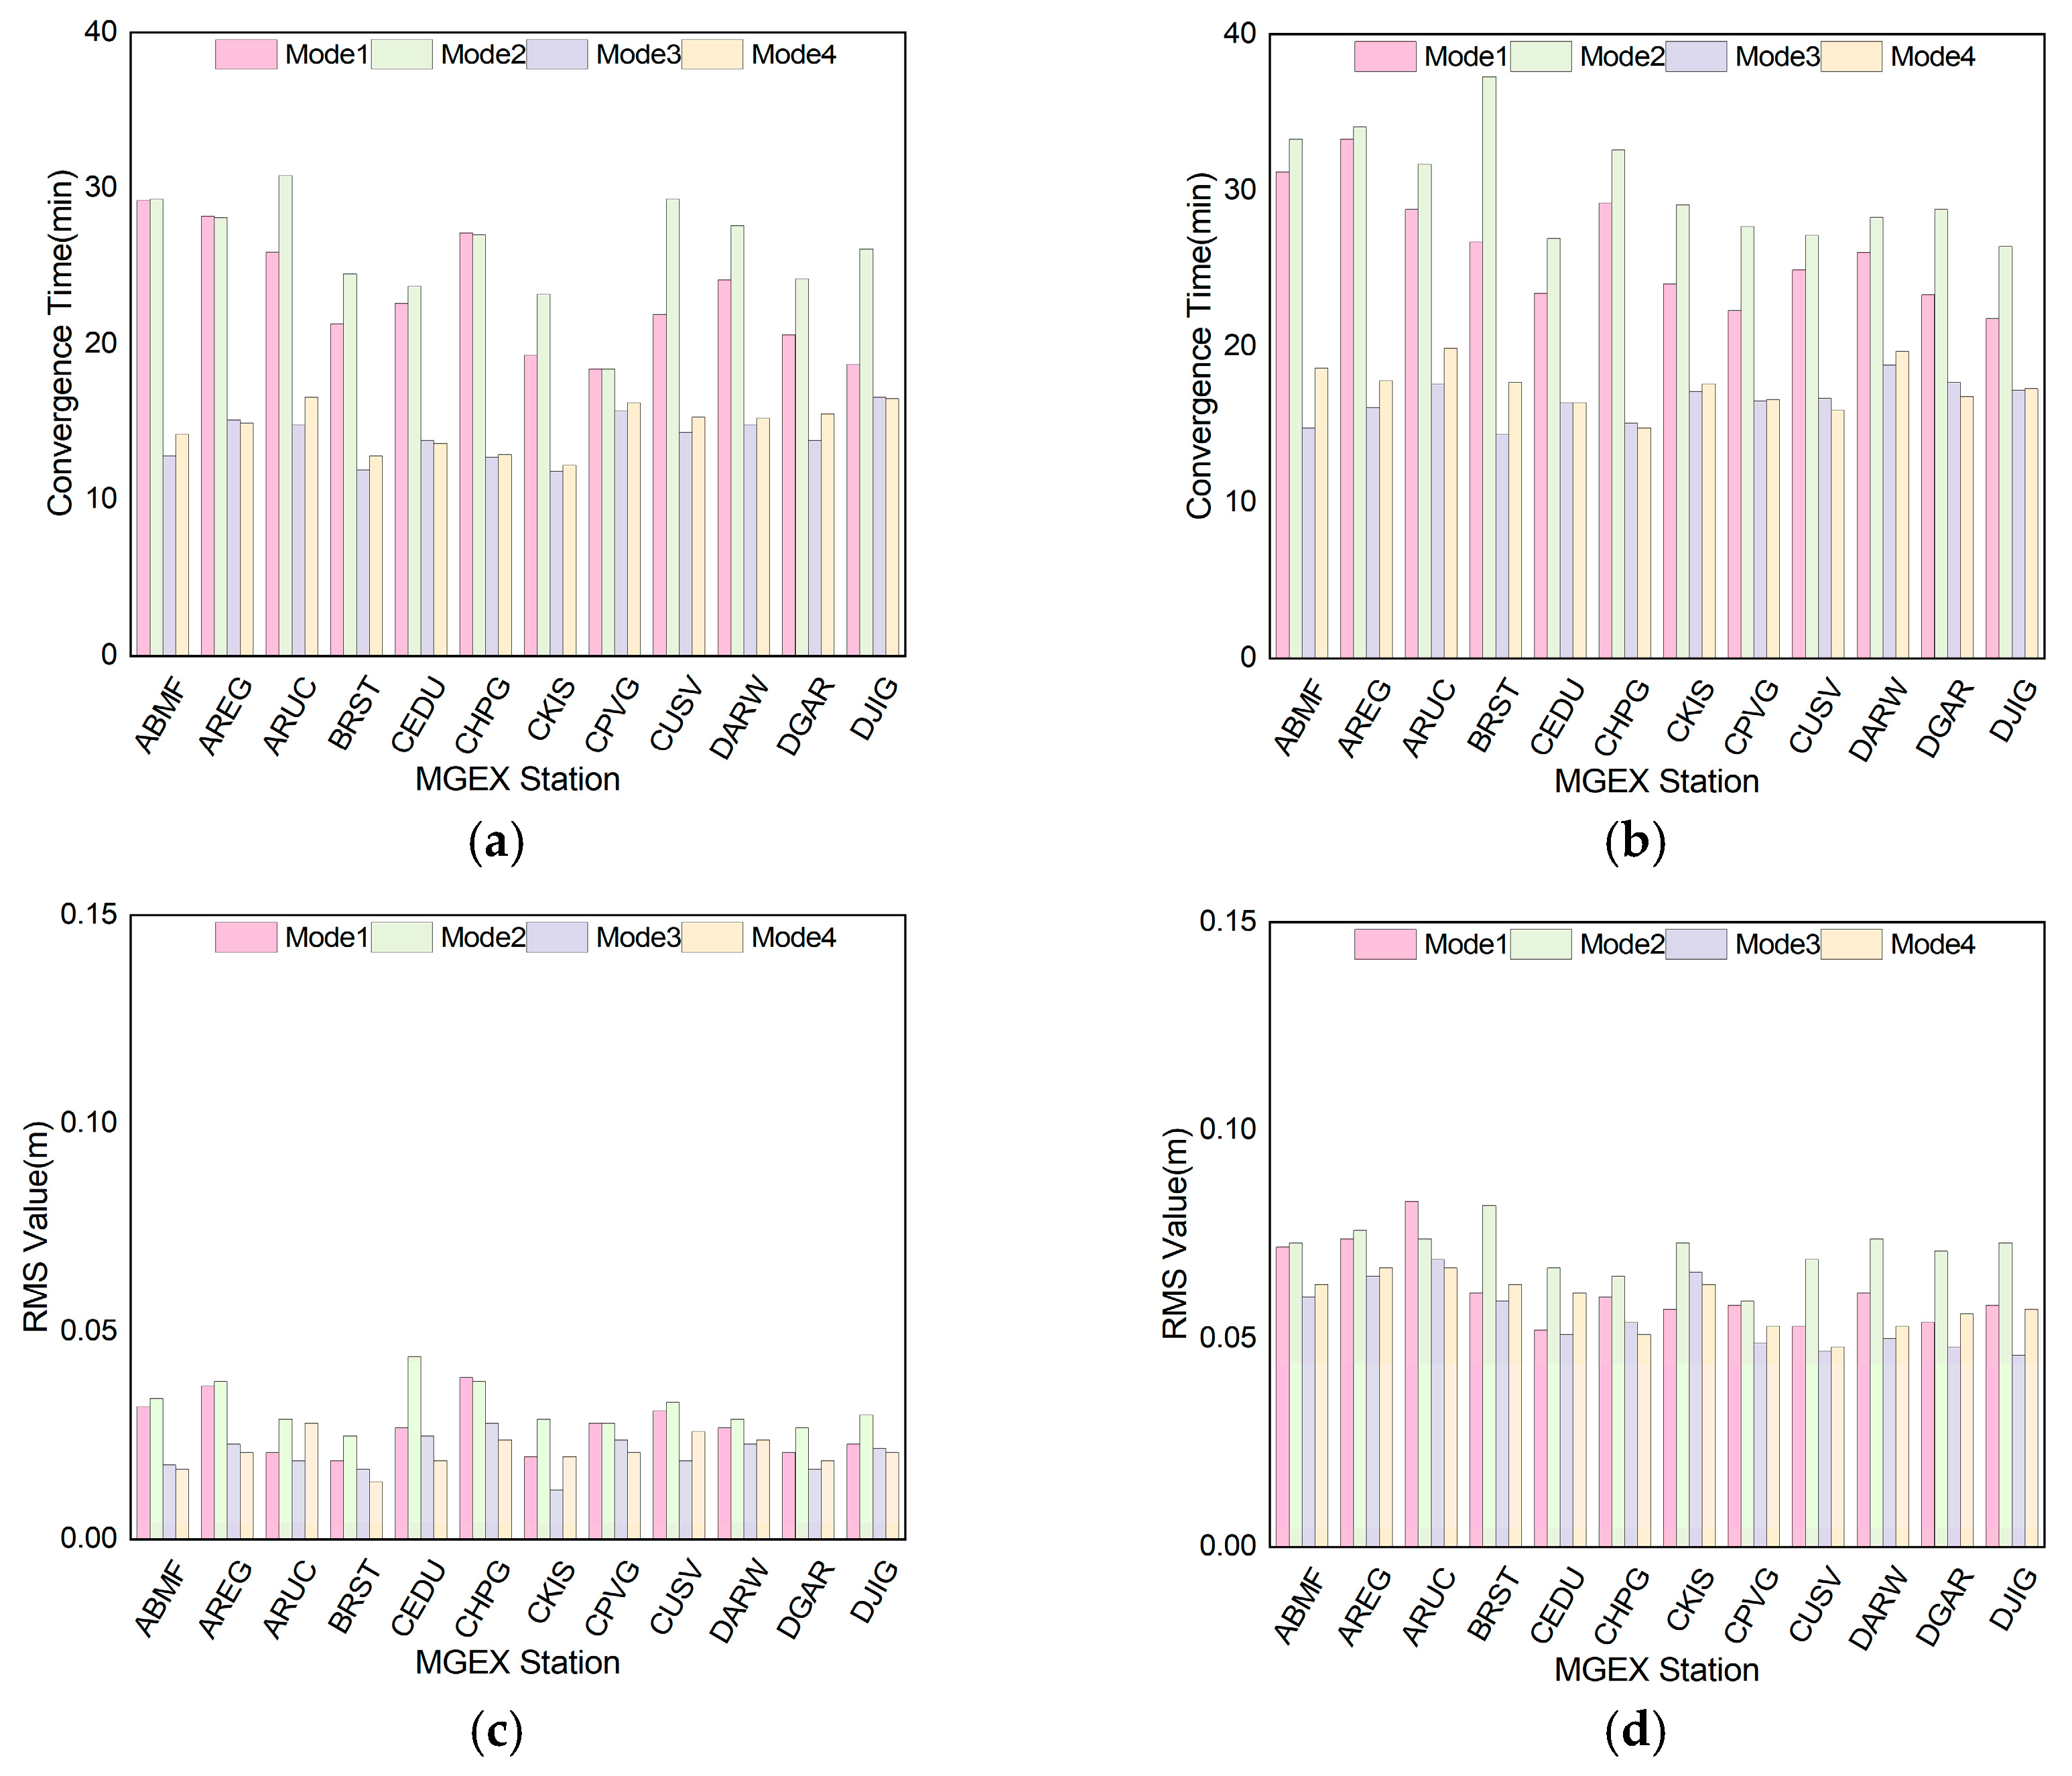
Figure 9 presents the static PPP-AR positioning error time series for stations BRST, ABMF, CEDU, and DGAR on DOY 124 under Modes 3 and 4. Compared with the PPP float solutions (Modes 1 and 2), both the positioning accuracy and convergence time are significantly improved in PPP-AR (Modes 3 and 4), demonstrating a marked enhancement in convergence speed. Figure 10 summarizes the average convergence times and positioning RMS values for all four positioning modes across the 12 stations. The average horizontal convergence times were 23.1 min (Mode 1), 29.0 min (Mode 2), 14.0 min (Mode 3), and 14.7 min (Mode 4). The corresponding vertical convergence times were 26.2 min (Mode 1), 30.2 min (Mode 2), 16.5 min (Mode 3), and 17.4 min (Mode 4). Relative to Mode 2 (empirical IPSD), Mode 1 (estimated IPSD) reduced the horizontal and vertical convergence times by 11.1% and 13.2%, respectively, while improving the corresponding positioning accuracies by 15.7% and 12.6%. Compared with Mode 4 (empirical IPSD in PPP-AR), Mode 3 (estimated IPSD in PPP-AR) achieved faster convergence, improving horizontal and vertical convergence times by 4.8% and 5.2%, and enhancing vertical accuracy by 5.1%, respectively. The improvement in horizontal accuracy was marginal (0.1%).
The performance gains of Mode 3 over Mode 4 are relatively limited compared to the gains in float PPP. This is likely because the high-precision UPD products, which are essential for AR, already absorb and correct for a portion of the ionospheric delay error, thereby reducing the relative impact of the refined ionospheric stochastic model. More significantly, compared with the float solution using estimated IPSD (Mode 1), PPP-AR with estimated IPSD (Mode 3) improved horizontal and vertical convergence speeds by 39.3% and 37.1%, respectively, and enhanced positioning accuracy by 22.2% and 11.1%. These findings demonstrate that incorporating global high-precision UPD products into PPP-AR positioning effectively accelerates convergence and improves positioning accuracy beyond what is achievable with float solutions.

4. Conclusions

This study addressed the critical challenge of accurately modeling the time-varying characteristics of ionospheric delay in BDS PPP and PPP with PPP-AR. We developed and implemented a novel method for the real-time estimation of ionospheric IPSD, which leverages Vondrak smoothing to effectively denoise ionospheric observations, and integrates it into the UDUC PPP/PPP-AR framework. Based on comprehensive theoretical analysis and experimental validation, the following principal conclusions can be drawn:
1. The application of Vondrak smoothing to ionospheric observations effectively suppresses measurement noise and more faithfully captures the true temporal dynamics of the ionosphere. This leads to a significant improvement in the accuracy and reliability of the estimated IPSD, providing a physically realistic constraint for the stochastic model.
2. In the PPP-AR mode, while high-precision UPD products are the dominant factor for performance enhancement, the real-time IPSD provides a distinct and systematic contribution. It accelerates the convergence and improves the accuracy of the float solution prior to ambiguity fixation, creating a more robust foundation for the subsequent AR process. This synergy demonstrates that the combination of real-time IPSD estimation with high-precision UPD products is a highly effective strategy for building optimal PPP-AR systems.
This study establishes a robust framework for enhancing BDS PPP and PPP-AR performance through real-time IPSD estimation, demonstrating its significant potential. Future work will involve validation over longer periods and across a more extensive station network to further confirm its robustness under diverse ionospheric conditions, including extreme storm events.

Author Contributions

Conceptualization, Y.W. and H.Z.; methodology, Y.W.; software, Y.W. and H.Z.; validation, H.Z. and Q.X.; investigation, Y.W. and J.L.; resources, H.Z. and C.S.; data curation, Y.W. and Q.X.; writing—original draft preparation, Y.W. and C.S.; writing—review and editing, H.Z.; project administration, H.Z.; funding acquisition, H.Z. All authors have read and agreed to the published version of the manuscript.

Funding

This research was funded by the Natural Science Foundation of Liaoning Province, China (2025-BS-0398), the Open Fund of Hubei Luojia Laboratory (No. 250100018), and the LiaoNing Revitalization Talents Program (XLYC2203162).

Data Availability Statement

The data presented in this study are available on request from the corresponding authors. The data are not publicly available due to privacy issues.

Conflicts of Interest

The authors declare no conflicts of interest.

References

  1. China Satellite Navigation Office. BeiDou Navigation Satellite System Open Service Performance Standard (Version 3.0). Available online: http://www.beidou.gov.cn/xt/gfxz/202105/P020210526215541444683.pdf (accessed on 1 September 2020).
  2. Ma, H.; Yang, J.; Guan, X.; Wu, J.; Wu, H. Differences in Time Comparison and Positioning of BDS-3 PPP-B2b Signal Broadcast Through GEO. Remote Sens. 2025, 17, 2351. [Google Scholar] [CrossRef]
  3. Liu, J.; Ye, S.; Xia, F.; Wei, P.; Fan, Y.; Song, Y. Processing and analysis of BDS-2 B1I/B3I and BDS-3 B1C/B2a joint PPP considering inter system and frequency biases. Adv. Space Res. 2025, 75, 7065–7081. [Google Scholar] [CrossRef]
  4. Guo, S.; Cai, H.; Meng, Y.; Geng, C.; Jia, X.; Mao, Y.; Geng, T.; Rao, Y.; Zhang, H.; Xie, X. BDS-3 RNSS Technical Characteristics and Service Performance. Acta Geod. Cartogr. Sin. 2019, 48, 810–821. [Google Scholar] [CrossRef]
  5. Ge, M.; Gendt, G.; Rothacher, M.; Shi, C.; Liu, J. Resolution of GPS carrier-phase ambiguities in Precise Point Positioning (PPP) with daily observations. J. Geod. 2008, 82, 401–412. [Google Scholar] [CrossRef]
  6. Gu, S.; Lou, Y.; Shi, C.; Liu, J. BeiDou Phase Bias Estimation and Its Application in Precise Point Positioning with Triple-Frequency Observable. J. Geod. 2015, 89, 979–992. [Google Scholar] [CrossRef]
  7. Yao, Y.; Peng, W.; Xu, C.; Shi, J.; Cheng, S.; Ouyang, C. The realization and evaluation of mixed GPS/BDS PPP ambiguity resolution. J. Geod. 2019, 93, 1283–1295. [Google Scholar] [CrossRef]
  8. Nacer, N.; Sunil, B. An uncombined triple-frequency user implementation of the decoupled clock model for PPP-AR. J. Geod. 2021, 95, 56. [Google Scholar] [CrossRef]
  9. Tang, J.; Zhang, W.; Yao, Y.; Peng, W.; Xu, C.; Zhang, L. BDS PPP-AR positioning performance with ionospheric disturbances at low-latitudes. GPS Solut. 2025, 29, 116. [Google Scholar] [CrossRef]
  10. Klobuchar, J.A. Ionospheric Time-Delay Algorithm for Single-Frequency GPS Users. IEEE Trans. Aerosp. Electron. Syst. 1987, AES-23, 325–331. [Google Scholar] [CrossRef]
  11. Dubey, S.; Wahi, R.; Gwal, A.K. Ionospheric Effects on GPS Positioning. Adv. Space Res. 2005, 38, 2478–2484. [Google Scholar] [CrossRef]
  12. Otsuka, Y.; Shinbori, A.; Sori, T.; Tsugawa, T.; Nishioka, M.; Huba, J. Plasma depletions lasting into daytime during the recovery phase of a geomagnetic storm in May 2017: Analysis and simulation of GPS total electron content observations. Earth Planet. Phys. 2021, 5, 427–434. [Google Scholar] [CrossRef]
  13. Xu, Z.; Yang, N.; Xu, Y.; Tang, L.; Xu, A.; Li, L.; Gao, M. BDS Precise Point Positioning Ambiguity Resolution with High Rate Data and Its Application to Seismic Displacement and Marine Surveying. Earth Sci. Inform. 2021, 14, 2331–2346. [Google Scholar] [CrossRef]
  14. Zhang, X.; Liu, G.; Guo, F.; Li, X. Model Comparison and Performance Analysis of Triple-Frequency BDS Precise Point Positioning. Geomat. Inf. Sci. Wuhan Univ. 2018, 43, 2124–2130. [Google Scholar] [CrossRef]
  15. Yan, Z.; Zhang, X. Partial Ambiguity Resolution Method and Results Analysis for GNSS Uncombined PPP. Geomat. Inf. Sci. Wuhan Univ. 2022, 47, 979–989. [Google Scholar] [CrossRef]
  16. Shi, C.; Gu, S.; Lou, Y.; Ge, M. An Improved Approach to Model Ionospheric Delays for Single-Frequency Precise Point Positioning. Adv. Space Res. 2012, 49, 1698–1708. [Google Scholar] [CrossRef]
  17. Wu, G.; Chen, J.; Bai, T.; Wu, X.; Hu, J. Wide-Area Between-Satellite Single-Difference VTEC Ionospheric Model and Its Assessment for Undifferenced and Uncombined PPP. Geomat. Inf. Sci. Wuhan Univ. 2021, 46, 928–937. [Google Scholar] [CrossRef]
  18. Gu, S.; Dai, C.; He, C.; Fang, L.; Wang, Z. Analysis of Semi-tightly Coupled Multi-GNSS PPP-RTK/VIO for Vehicle Navigation in Urban Areas. Geomat. Inf. Sci. Wuhan Univ. 2021, 46, 1852–1861. [Google Scholar] [CrossRef]
  19. Song, W.; He, C.; Gu, S. Performance Analysis of Ionospheric Enhanced PPP-RTK in Different Latitudes. Geomat. Inf. Sci. Wuhan Univ. 2021, 46, 1832–1842. [Google Scholar] [CrossRef]
  20. Zhang, X.; Ren, X.; Chen, J.; Zuo, X.; Mei, D.; Liu, W. Investigating GNSS PPP--RTK with external ionospheric constraints. Satell. Navig. 2022, 3, 11. [Google Scholar] [CrossRef]
  21. Li, J.; Zhu, H.; Xu, A.; Lu, Y.; Lei, X. BDS long-range RTK positioning algorithm considering the time-varying properties of ionosphere. Acta Geod. Et Cartogr. Sin. 2023, 52, 383–396. [Google Scholar] [CrossRef]
  22. Tu, R.; Zhang, H.; Ge, M.; Huang, G. A real-time ionospheric model based on GNSS Precise Point Positioning. Adv. Space Res. 2013, 52, 1125–1134. [Google Scholar] [CrossRef]
  23. Fu, Z.; Shen, X.; Liu, Q.; Wang, N. Ionospheric Disturbances from the 2022 Hunga-Tonga Volcanic Eruption: Impacts on TEC Spatial Gradients and GNSS Positioning Accuracy Across the Japan Region. Remote Sens. 2025, 17, 3108. [Google Scholar] [CrossRef]
  24. Li, J.; Zhu, H.; Xu, A.; Xu, Z. Estimating ionospheric power spectral density for long-range RTK positioning using uncombined observations. GPS Solut. 2023, 27, 120. [Google Scholar] [CrossRef]
  25. Xu, Z.; Zhang, H.; Xu, Y.; Li, J.; Yang, N.; Shi, S. A Method for Estimating Ionospheric Power Spectral Density in BDS Undifferenced and Uncombined PPP. Geomat. Inf. Sci. Wuhan Univ. 2025, 50, 628–636. [Google Scholar] [CrossRef]
  26. Chen, Z.; Zhang, Q.; Li, L.; Li, X.; Lv, H. An improved carrier-phase smoothing pseudorange algorithm with self-modeling of ionospheric delay variation. Acta Geod. Cartogr. Sin. 2019, 48, 1107–1118. [Google Scholar] [CrossRef]
  27. Zhu, H.; Li, J.; Tang, L.; Ge, M.; Xu, A. Improving the Stochastic Model of Ionospheric Delays for BDS Long-Range Real-Time Kinematic Positioning. Remote Sens. 2021, 13, 2739. [Google Scholar] [CrossRef]
  28. Zheng, D.; Zhong, P.; Ding, X.; Chen, W. Filtering GPS time-series using a Vondrak filter and cross-validation. J. Geod. 2005, 79, 363–369. [Google Scholar] [CrossRef]
  29. Teunissen, P.J.G. The least-squares ambiguity decorrelation adjustment: A method for fast GPS integer ambiguity estimation. J. Geod. 1995, 70, 65–82. [Google Scholar] [CrossRef]
  30. Li, P.; Zhang, X. Integrating GPS and GLONASS to accelerate convergence and initialization times of precise point positioning. GPS Solut. 2014, 18, 461–471. [Google Scholar] [CrossRef]
  31. Odolinski, R.; Teunissen, P.; Odijk, D. Combined GPS + BDS for short to long baseline RTK positioning. Meas. Sci. Technol. 2015, 26, 045801. [Google Scholar] [CrossRef]
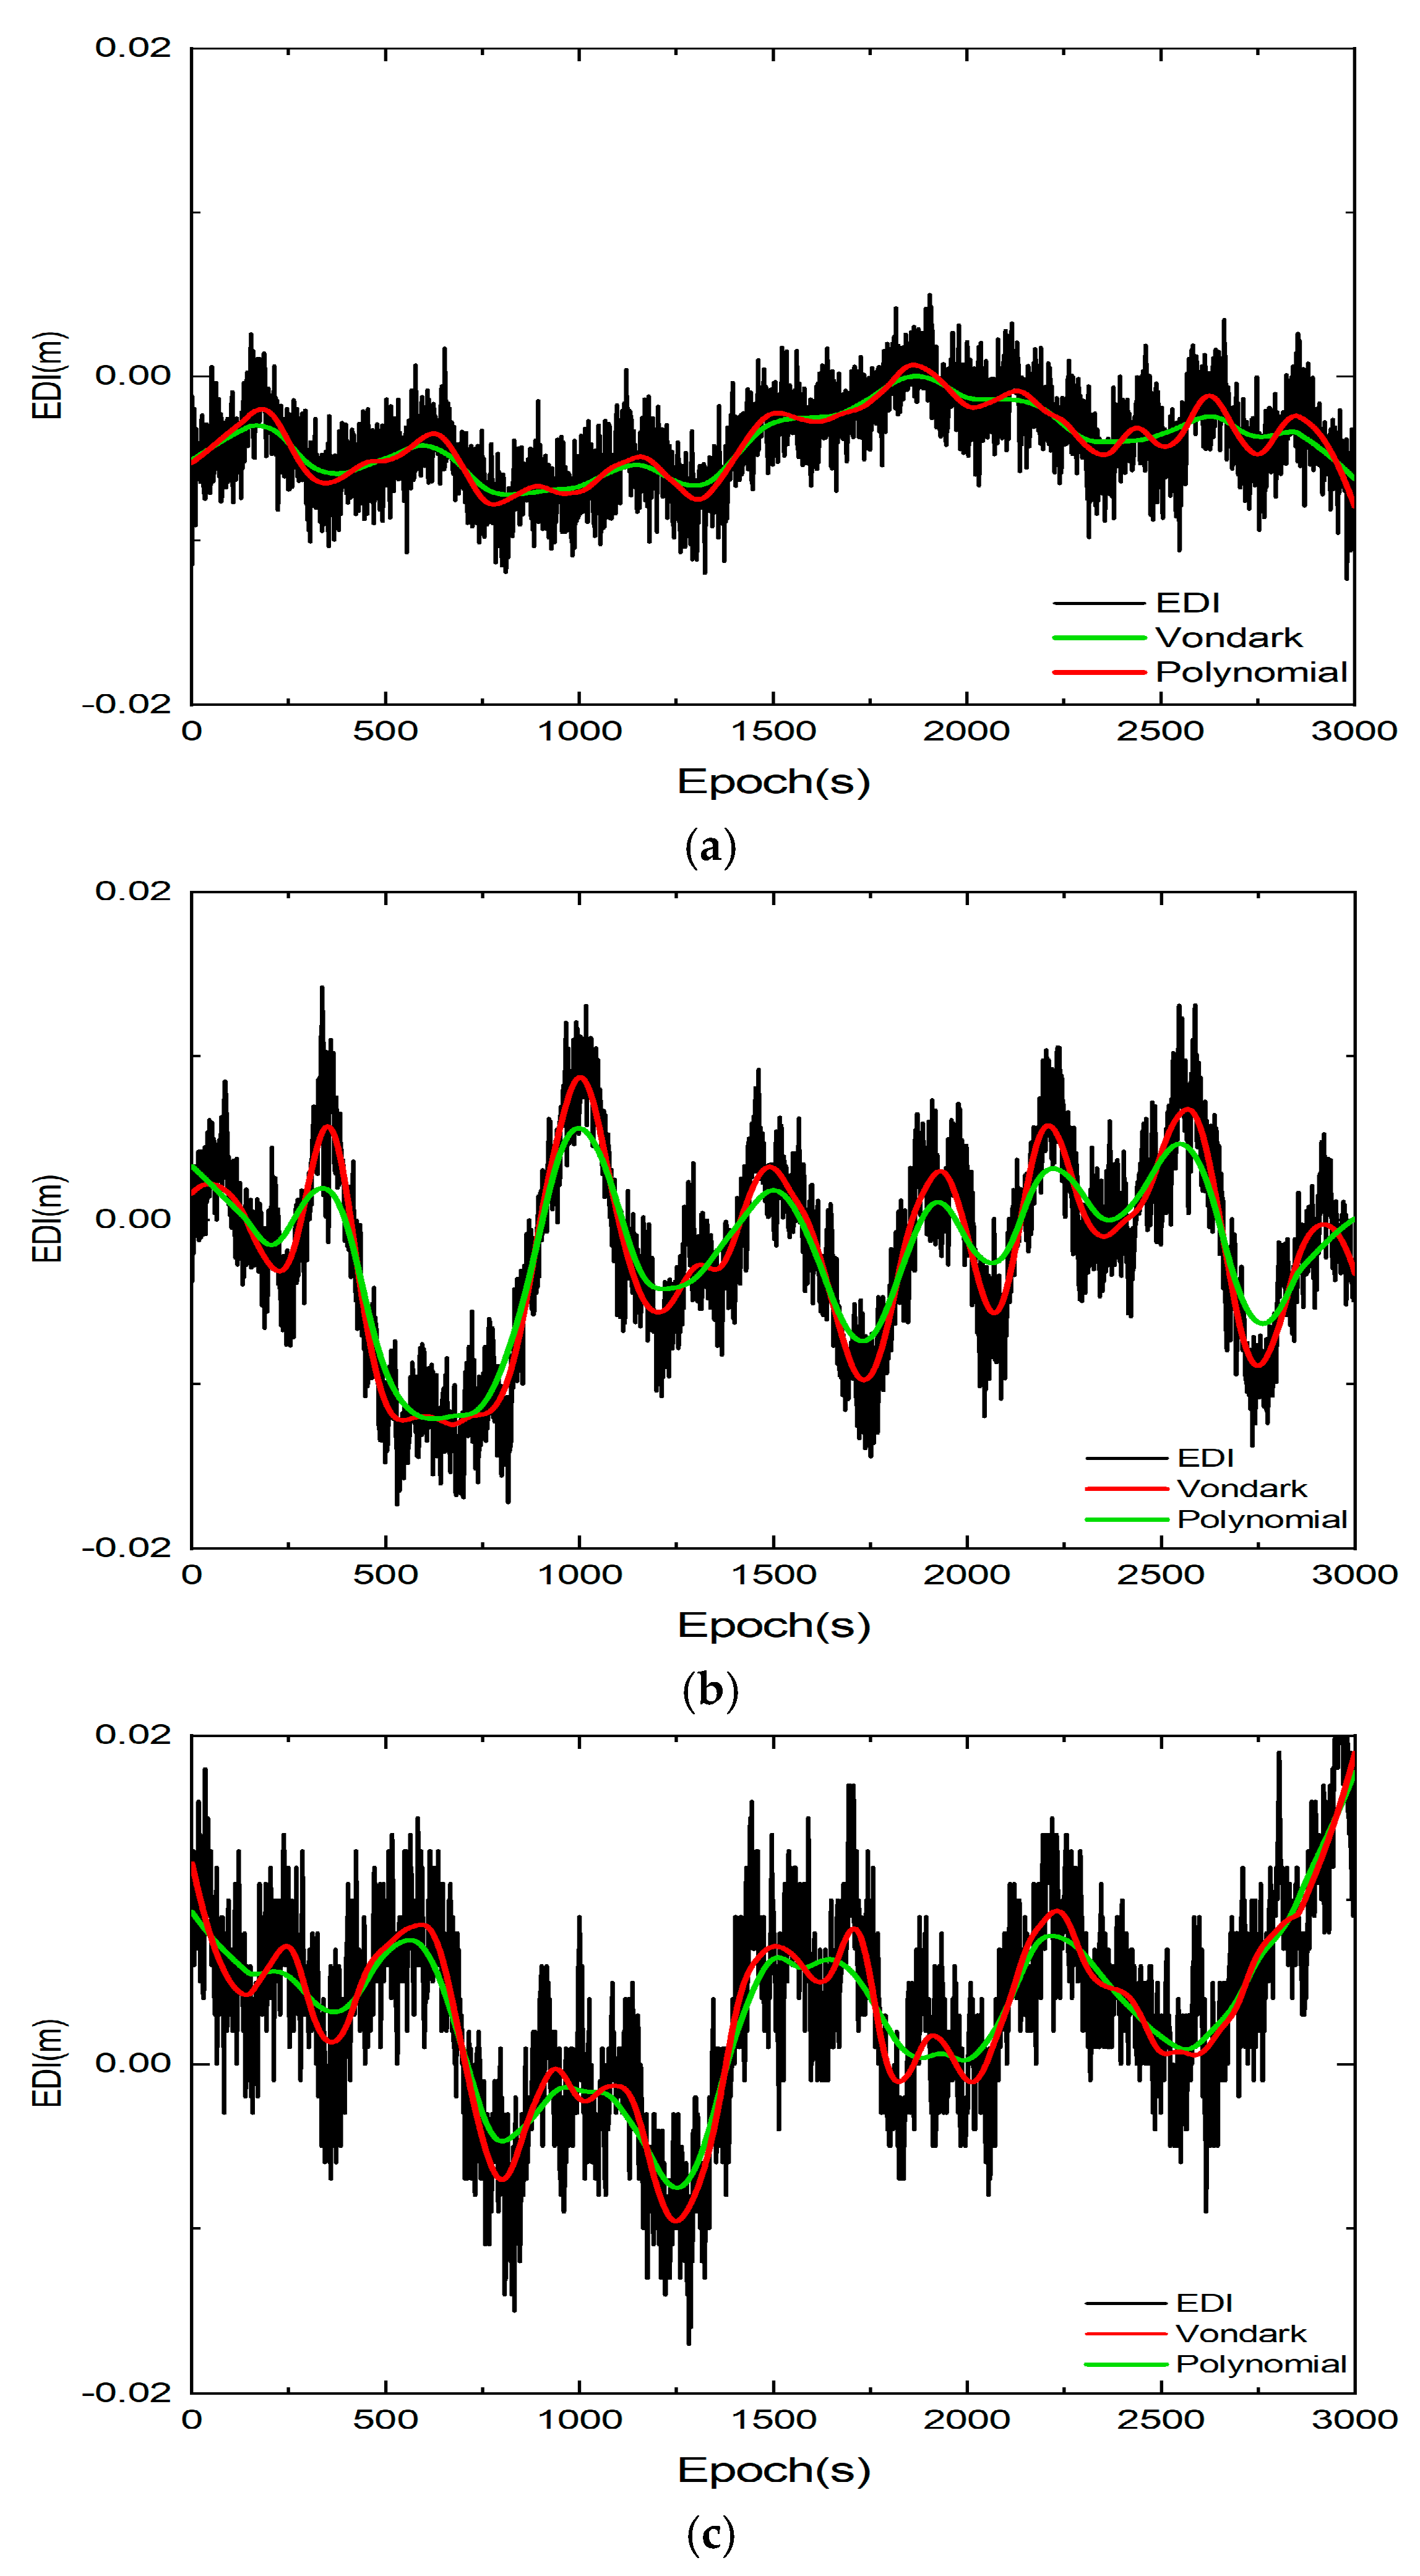
Figure 1. Comparison of EDI and smoothed values using different smoothing methods: (a) Comparison of C02 satellite EDI and smoothed values using different methods; (b) comparison of C10 satellite EDI and smoothed values using different methods; and (c) comparison of C35 satellite EDI and smoothed values using different methods.
Electronics 14 04342 g001
Figure 2. Normal distribution of EDI at 1 s, 30 s, and 90 s time intervals.
Electronics 14 04342 g002
Figure 3. EDI of different satellites at different time intervals.
Electronics 14 04342 g003
Figure 4. IPSD of different satellites at different time intervals.
Electronics 14 04342 g004
Figure 5. Geographic distribution of the 12 MGEX stations used in the PPP and PPP-AR experiments.
Electronics 14 04342 g005
Figure 6. Positioning bias time series of Mode 1 and Mode 2 calculation strategies on DOY 124 (2024).
Electronics 14 04342 g006
Figure 7. DOY111-135 (2024) BDS-3 EWL, WL, NL UPD sequences: (a) EWL sequence, (b) WL sequence, and (c) NL sequence.
Electronics 14 04342 g007
Figure 8. DOY124 (2024) distribution of ambiguity residuals for EWL, WL, and NL after satellite UPD correction: (a) EWL ambiguity residual distribution, (b) WL ambiguity residual distribution, and (c) NL ambiguity residual distribution.
Electronics 14 04342 g008
Figure 9. Positioning deviation time series for two solution strategies (Mode 3 and Mode 4) on DOY124 (2024).
Electronics 14 04342 g009
Figure 10. Average convergence time and RMS statistics for four positioning modes at different stations: (a) Average convergence time for planar positioning at different stations; (b) average convergence time for vertical positioning at different stations; (c) planar RMS values for different positioning modes at different stations; and (d) vertical RMS values for different positioning modes at different stations.
Electronics 14 04342 g010
Table 1. EDI standard deviation (m) at different time differential intervals.
Satellite PRNEpoch Difference Interval
1 s30 s90 s
C02STD0.00210.00300.0036
Mean Value0.00000410.000130.00038
C10STD0.00190.00280.0044
Mean Value0.00000160.0000520.00012
C35STD0.00190.00320.0053
Mean Value0.00000510.000160.00031
Table 2. Latitude and longitude of test sites.
StationLatitude(°)Longitude(°)
ABMF16.262−61.528
AREG−16.465−71.493
ARUC40.28644.086
BRST48.38−4.497
CEDU−31.867133.81
CHPG−22.682−45.002
CKIS−21.201−159.801
CPVG16.732−22.935
CUSV13.736100.534
DARW−12.844131.133
DGAR−7.2772.37
DJIG11.52642.847
Table 3. PPP/PPP-AR experimental data processing strategy.
ProjectStrategy
Sampling Interval30 s
Cutoff Elevation Angle10°
Satellite Orbit and Clock BiasWHU Analysis Center Precise Products
Ionospheric DelayRandom Walk, PSD (Estimated IPSD)
Random Walk, PSD (Empirical Value 1.7 × 10⁻⁵ m2/s)
Tropospheric DelayRandom Walk, PSD (Empirical Value 1.7 × 10⁻⁵ m2/s)
Receiver Clock BiasEpoch-by-Epoch Estimation
Antenna CalibrationIGS20 File Correction
Tidal Disturbance CorrectionCorrecting for Solid Tide, Ocean Tide, and Polar Motion Tide Separately
UPD EstimationExtra-Wide Lane: Estimate one value per day
Wide Lane: Estimate one value per day
Narrow Lane: Estimate one value every 30 s
Ambiguity StrategyInter-Satellite Single-Difference for Partial AR
Float Solution
Disclaimer/Publisher’s Note: The statements, opinions and data contained in all publications are solely those of the individual author(s) and contributor(s) and not of MDPI and/or the editor(s). MDPI and/or the editor(s) disclaim responsibility for any injury to people or property resulting from any ideas, methods, instructions or products referred to in the content.