Article

Full Process Dynamics and HIL Simulation of Precise Airdrop System

1
College of Computer, Hunan University of Technology and Business, Changsha 410205, China
2
Hypersonic Technology Laboratory, National University of Defense Technology, Changsha 410073, China
3
College of Aerospace Science and Engineering, National University of Defense Technology, Changsha 410073, China
*
Author to whom correspondence should be addressed.
Electronics 2025, 14(21), 4285; https://doi.org/10.3390/electronics14214285 (registering DOI)
Submission received: 27 September 2025 / Revised: 27 October 2025 / Accepted: 27 October 2025 / Published: 31 October 2025
(This article belongs to the Special Issue Digital Intelligence Technology and Applications, 2nd Edition)

Abstract

Amid intensifying competition in airdrop equipment development, there is a growing demand for large-load, high-precision, maneuverable, and low-cost airdrop systems. However, Precision Aerial Delivery Systems (PADS) exhibit structural complexity and immature dynamics theory for flexible-body parachute/parafoil systems. Flight testing proves prohibitively expensive, while random environmental interference hinders data consistency. To address these challenges, this paper integrates navigation control systems and actuators with dynamics models through a Hardware-in-the-Loop (HIL) simulation system for comprehensive performance evaluation.

1. Introduction

With the increasing competition in the development of airdropped equipment, the trend now is the development of a large-load, high-precision, maneuverable, and low-cost airdrop system [1]. Precision Aerial Delivery Systems have a relatively complex internal structure and working procedure. The dynamics theory behind parachute systems and parafoil systems (flexible bodies) is still undeveloped. On the one hand, the cost of flight testing is high; on the other hand, the entire working process is highly sensitive to random environmental factors, making consistent test data difficult to acquire. Therefore, it is essential to integrate the navigation control system and actuators into the existing dynamics model and use HIL simulation platform [2] technology to evaluate the flight performance of Precision Aerial Delivery Systems.
To support the performance evaluation of precision airdrop systems, establishing a full-process simulation framework and developing an HIL simulation platform requires a deep understanding of key dynamics and control issues at each stage. This study concentrates on three core subsystems of Precision Aerial Delivery Systems: parachute system, parafoil system, and cluster parachute system.
In the parachute deployment process, the core dynamics and control challenge lie in accurately modeling the complex process of rapidly extracting tightly packed suspension lines and canopies from the parachute pack. This process is significantly affected by random factors such as friction, pack angle-of-attack, and manufacturing tolerances, making complete repeatability difficult even with identical design parameters. In practical applications, payload wake and high-altitude winds often cause the deployment direction to deviate from the freestream flow. The “rope-sail phenomenon” caused by lateral airflow acting on the suspension lines is particularly prominent, necessitating high-precision variable-mass dynamics modeling methods. Simplified continuous extraction models can be used during preliminary design to analyze factors such as packing technique, binding force, payload velocity, and mass. Toni [3], McVey [4], Wolf [5], and French [6] established engineering-applicable models under the simplified assumption of a fixed deployment direction. Purvis [7,8,9] first proposed a more reasonable, simplified finite-segment planar model, treating the canopy and suspension lines as concentrated mass nodes connected by damped springs, successfully numerically reproducing the severe rope-sail phenomenon observed in F-111 airdrop tests. Song and Wang [10] systematically proposed multi-flexible-body and multi-rigid-body models while studying the main parachute deployment of manned spacecraft, analyzing the influence of high-altitude winds and the suppression of line lashing by the pilot parachute and peel strip; Ding [11], based on a continuous cable dynamics model, explored the propagation mechanism of stress waves in bent suspension lines/canopies and the causes of line lashing.
Compared with the parachute deployment process, the core dynamic problems of the parachute terminal descent phase and the cluster parachute deployment process focus on trajectory dynamics and motion stability. As an unrooted multibody system, parachutes must meet trajectory requirements while avoiding instability, simultaneously describing payload attitude changes. These demand establishing refined payload–parachute multibody dynamics models to study stability evaluation methods and criteria. White [12] analyzed the stability of the payload–parachute system near equilibrium points using the small perturbation method, based on a five-degree-of-freedom (ignoring roll) single rigid-body model. Wolf [13,14] also established simplified interference force models for cluster parachutes and analyzed their flight stability. Cockrell and Graham investigated the planar motion stability of payload–parachute systems using perturbation analysis methods [15,16]. Tang [17] established an unconstrained nine-degree-of-freedom multibody model and proposed an infrared target recognition algorithm incorporating parachute-ballistic motion characteristics. Ginn [18] analyzed the influence of added mass on stability. Notably, NASA repeatedly observed in the “Orion” spacecraft airdrop tests [19,20] that two- or three-parachute cluster systems, under factors like periodic oscillation and asymmetric geometry, could cause the capsule to exceed the expected oscillation threshold, potentially leading to excessive landing impact loads. Limited early testing of the Orion parachute system has led to the development of new methods for quantifying and visualizing these critical loads [21]. Taylor’s [22] analysis of sub-scale wind-tunnel testing for the Artemis Orion parachute system revealed a slight longitudinal static instability in the parachute canopy, providing a potential explanation for the unwanted pendulum motion observed in the full-scale vehicle. Addressing this, Pei, J. [23] analyzed the stability of two- and three-parachute systems using simplified planar models combined with test data. Zhang et al. [24] studied the variation patterns of the oscillation modal characteristics of the payload–parachute system using data-driven techniques based on a multi-flexible-body dynamics model for cluster parachutes. Huang et al. [25] detailed the guidance, navigation, and control (GNC) system for Tianwen-1′s Entry, Descent, and Landing (EDL), encompassing its architecture, algorithms, and validation through ground tests, simulations, and actual flight telemetry.
Parafoil systems are key to enhancing precision airdrop performance. Their research challenges lie in analyzing the impact of wind fields on stability and the strongly nonlinear dynamics characteristics during maneuvering. This nonlinearity makes traditional flight testing and system identification methods ineffective for prediction, urgently requiring new modeling and identification approaches. Goodrick proposed a six-degree-of-freedom model early on and simulated the flight stability of small parafoil systems [26]. Slegers et al. established a nine-degree-of-freedom multibody model and simulated the influence of factors like installation angle and trailing-edge deflection on lateral motion [27]. The Italian DIS Laboratory [28] demonstrated that 9-DoF models outperform 6-DoF in capturing canopy–payload interactions. Vishniak [29] and Yang et al. [30] proposed 12-DoF and 15-DoF models, respectively, incorporating elastic suspension/control lines to resolve turn dynamics. Zhang et al. [31] further developed an 18-DoF approach using quasi-coordinate Lagrange equations, treating canopy, payload, and connection points as rigid bodies. Cui et al. explored data-driven modeling of parafoil systems and analyzed the promoting effect of sparse models on parafoil path planning [32].
HIL has evolved from a traditional control algorithm verification platform into a comprehensive environment [33]. An innovative Immersive Marine Engine Room Simulation System integrates HIL simulation with 3D virtual reality through 5G networking [34]. In the context of the new energy field, a simulation model was built on the StarSim-HIL platform for the synchronization mechanism of wind power systems, and a comparative analysis was conducted on the small-signal stability characteristics of doubly-fed wind power systems [35]. The cooperative control strategy of multiple Unmanned Aerial Vehicles (UAVs) has been verified via HIL simulation in GPS-denied environments [36]. Its successful applications in fields such as robotics, energy, and shipbuilding highlight its irreplaceability in reducing development costs and accelerating system iteration. Computer technology also plays a pivotal role in HIL simulation platforms: enhancing dynamic robustness through adaptive path planning and neural ODE solvers [37] while optimizing HIL resource allocation via edge-centric computing and trust-aware task scheduling [38,39,40]. Regarding UAV-enhanced edge computing task offloading mechanisms [41,42,43], these studies provide trajectory optimization and resource scheduling methods, which directly support the integration of navigation control and low-cost performance evaluation for airdrop systems; deep reinforcement learning frameworks [44,45,46] and digital twin technology enable efficient simulation and dynamic model training, analogous to the comprehensive testing of an HIL simulation platform; meanwhile, uncertainty management strategies [47,48] address environmental interference through optimization algorithms to ensure data consistency. Collectively, these works lay a theoretical foundation and provide practical tools for the development of an HIL simulation platform.
The primary objective of this paper is to construct an HIL simulation platform to address the challenges of high costs and data acquisition difficulties associated with actual airdrop missions. First, the workflow of the precision airdrop system is introduced, and a full-process dynamics model for the recovery and landing phase is established. Subsequently, an open and scalable simulation framework suitable for precision airdrop system control is developed, and a relatively comprehensive HIL simulation platform is preliminarily constructed. Finally, HIL simulation tests and dynamic performance analysis of the parafoil system are conducted on this platform, providing preliminary validation of its feasibility.

2. Introduction of Precision Aerial Delivery Systems

PADS integrates advanced technologies such as navigation, sensors, and measurement and control, offering excellent controllability and maneuverability. It effectively improves many of the shortcomings of traditional airdrop methods and is gradually replacing conventional airdrop systems.

2.1. System Composition

PADS can be considered a complex multi-stage, multi-parachute recovery system. Its operation integrates the deceleration principles and working characteristics of various parachute systems, making it more complicated than a single-object parachute system. As shown in Figure 1, the PADS typically includes subsystems such as the parafoil system, deceleration parachute system, landing system, navigation control system, and cargo platform system.

2.2. Brief Introduction of Airdrop

The PADS workflow divides into three sequential stages: deceleration parachute operation, parafoil operation, and cluster parachute operation. A brief introduction to each stage is as follows:
(1)
Deceleration parachute working stage
The cargo system comes out of the cabin, then the deceleration parachute system straightens and inflates to decelerate the system. During the opening process of the deployment mechanism, the communication and navigation control system, the landing system, and the parafoil system are lifted, and the communication and navigation control system initiates the power supply. Once the deceleration parachute is straightened and fully inflated, it stabilizes the deceleration. Afterward, the release mechanism activates, releasing the parachute system, which then separates from the airdrop system.
(2)
Parafoil working stage
According to the predetermined control strategy and the pre-desired trajectory, the navigation control system manipulates the parafoil to fly to the predetermined target area.
(3)
Cluster parachute working stage
Upon reaching the target airspace, the control system issues a working command based on the set landing determination conditions, pulls out the riser parachute, inflates it to full size, and deploys the landing parachute. The landing parachute inflates fully and lands smoothly on the cargo platform; the landing release lock opens and the landing parachute is discarded.
The above process shows that the HIL development of the PADS involves a wide range of technical aspects, including the following:
  • Opening of the parachutes at all levels;
  • Parachute inflation;
  • System dynamics modeling and analysis of the object–parafoil assembly.

3. Dynamic Modeling of the Whole Process of PADS

The various stages of precise airdrop studied in this article all involve complex dynamic equations and require individual modeling. The research encompasses the dynamic modeling of both the parafoil autonomous flight to the target and the cluster parachute working stage. A key aspect of the proposed modeling approach is its consistency across different operational stages. Specifically, the dynamics of the deceleration parachute phase, the parafoil autonomous flight phase, and the cluster parachute phase are all modeled using a unified 9-Degree-of-Freedom (9-DoF) framework. While the fundamental kinematic and dynamic structure remains consistent, the distinct aerodynamic characteristics and force/moment generation mechanisms unique to each stage (e.g., the predominantly drag-based dynamics of the deceleration parachute vs. the lift-generating and controllable dynamics of the parafoil vs. the multi-body interactions in the cluster) are captured through stage-specific formulations of the aerodynamic forces and moments within this common 9-DoF model.

3.1. Dynamic Model for the Opening and Inflation Stages

3.1.1. Multi-Body Dynamics Model of Opening Process

Parachute opening is one of the key steps in the airdrop deceleration program and the first action in the deceleration phase. The opening process starts with the parachute opening process, in which the guide parachute pulls out the other parachute folded inside the pack in order. The smoothness of the opening process is directly related to whether normal inflation can be carried out. In this stage, the lines and canopy suit are subjected to a large overload, and under the influence of high-altitude wind field, the “line sail” phenomenon is likely to occur, causing damage to the canopy and even leading to airdrop failure. As shown in Figure 2, considering the characteristics that the flexible fabric can only be stretched but not compressed, and ignoring the bending effect of the line and the canopy, the canopy and the line segment can be processed as a semi-damped spring model with mass concentrated at both endpoints.
Based on the working principle of sequentially pulling the line segments and the canopy during the opening process, the following dynamic assumptions are made for the opening process using the parachute reverse pull method:
(1)
Under the action of the binding force, each segment of the line is pulled out of the pack in sequence;
(2)
Inflation commences only after the lines and the canopy are completely detached from the pack;
(3)
The canopy is pulled out of the pack in sequential succession;
(4)
The connecting sling between the deceleration parachute and the parachute pack is treated as a nonlinear damping spring.
Under the above assumptions, the object–parafoil system during opening can be viewed as a multi-body system consisting of the deceleration parachute, the parachute pack, the knots of the pulled-out line segments, and the cargo platform, so that the dynamical equations of each isolated body can be solved separately. A detailed dynamics model has been developed by the project team [49] and will not be repeated here.

3.1.2. Dynamics Model of Parachute Inflation Process

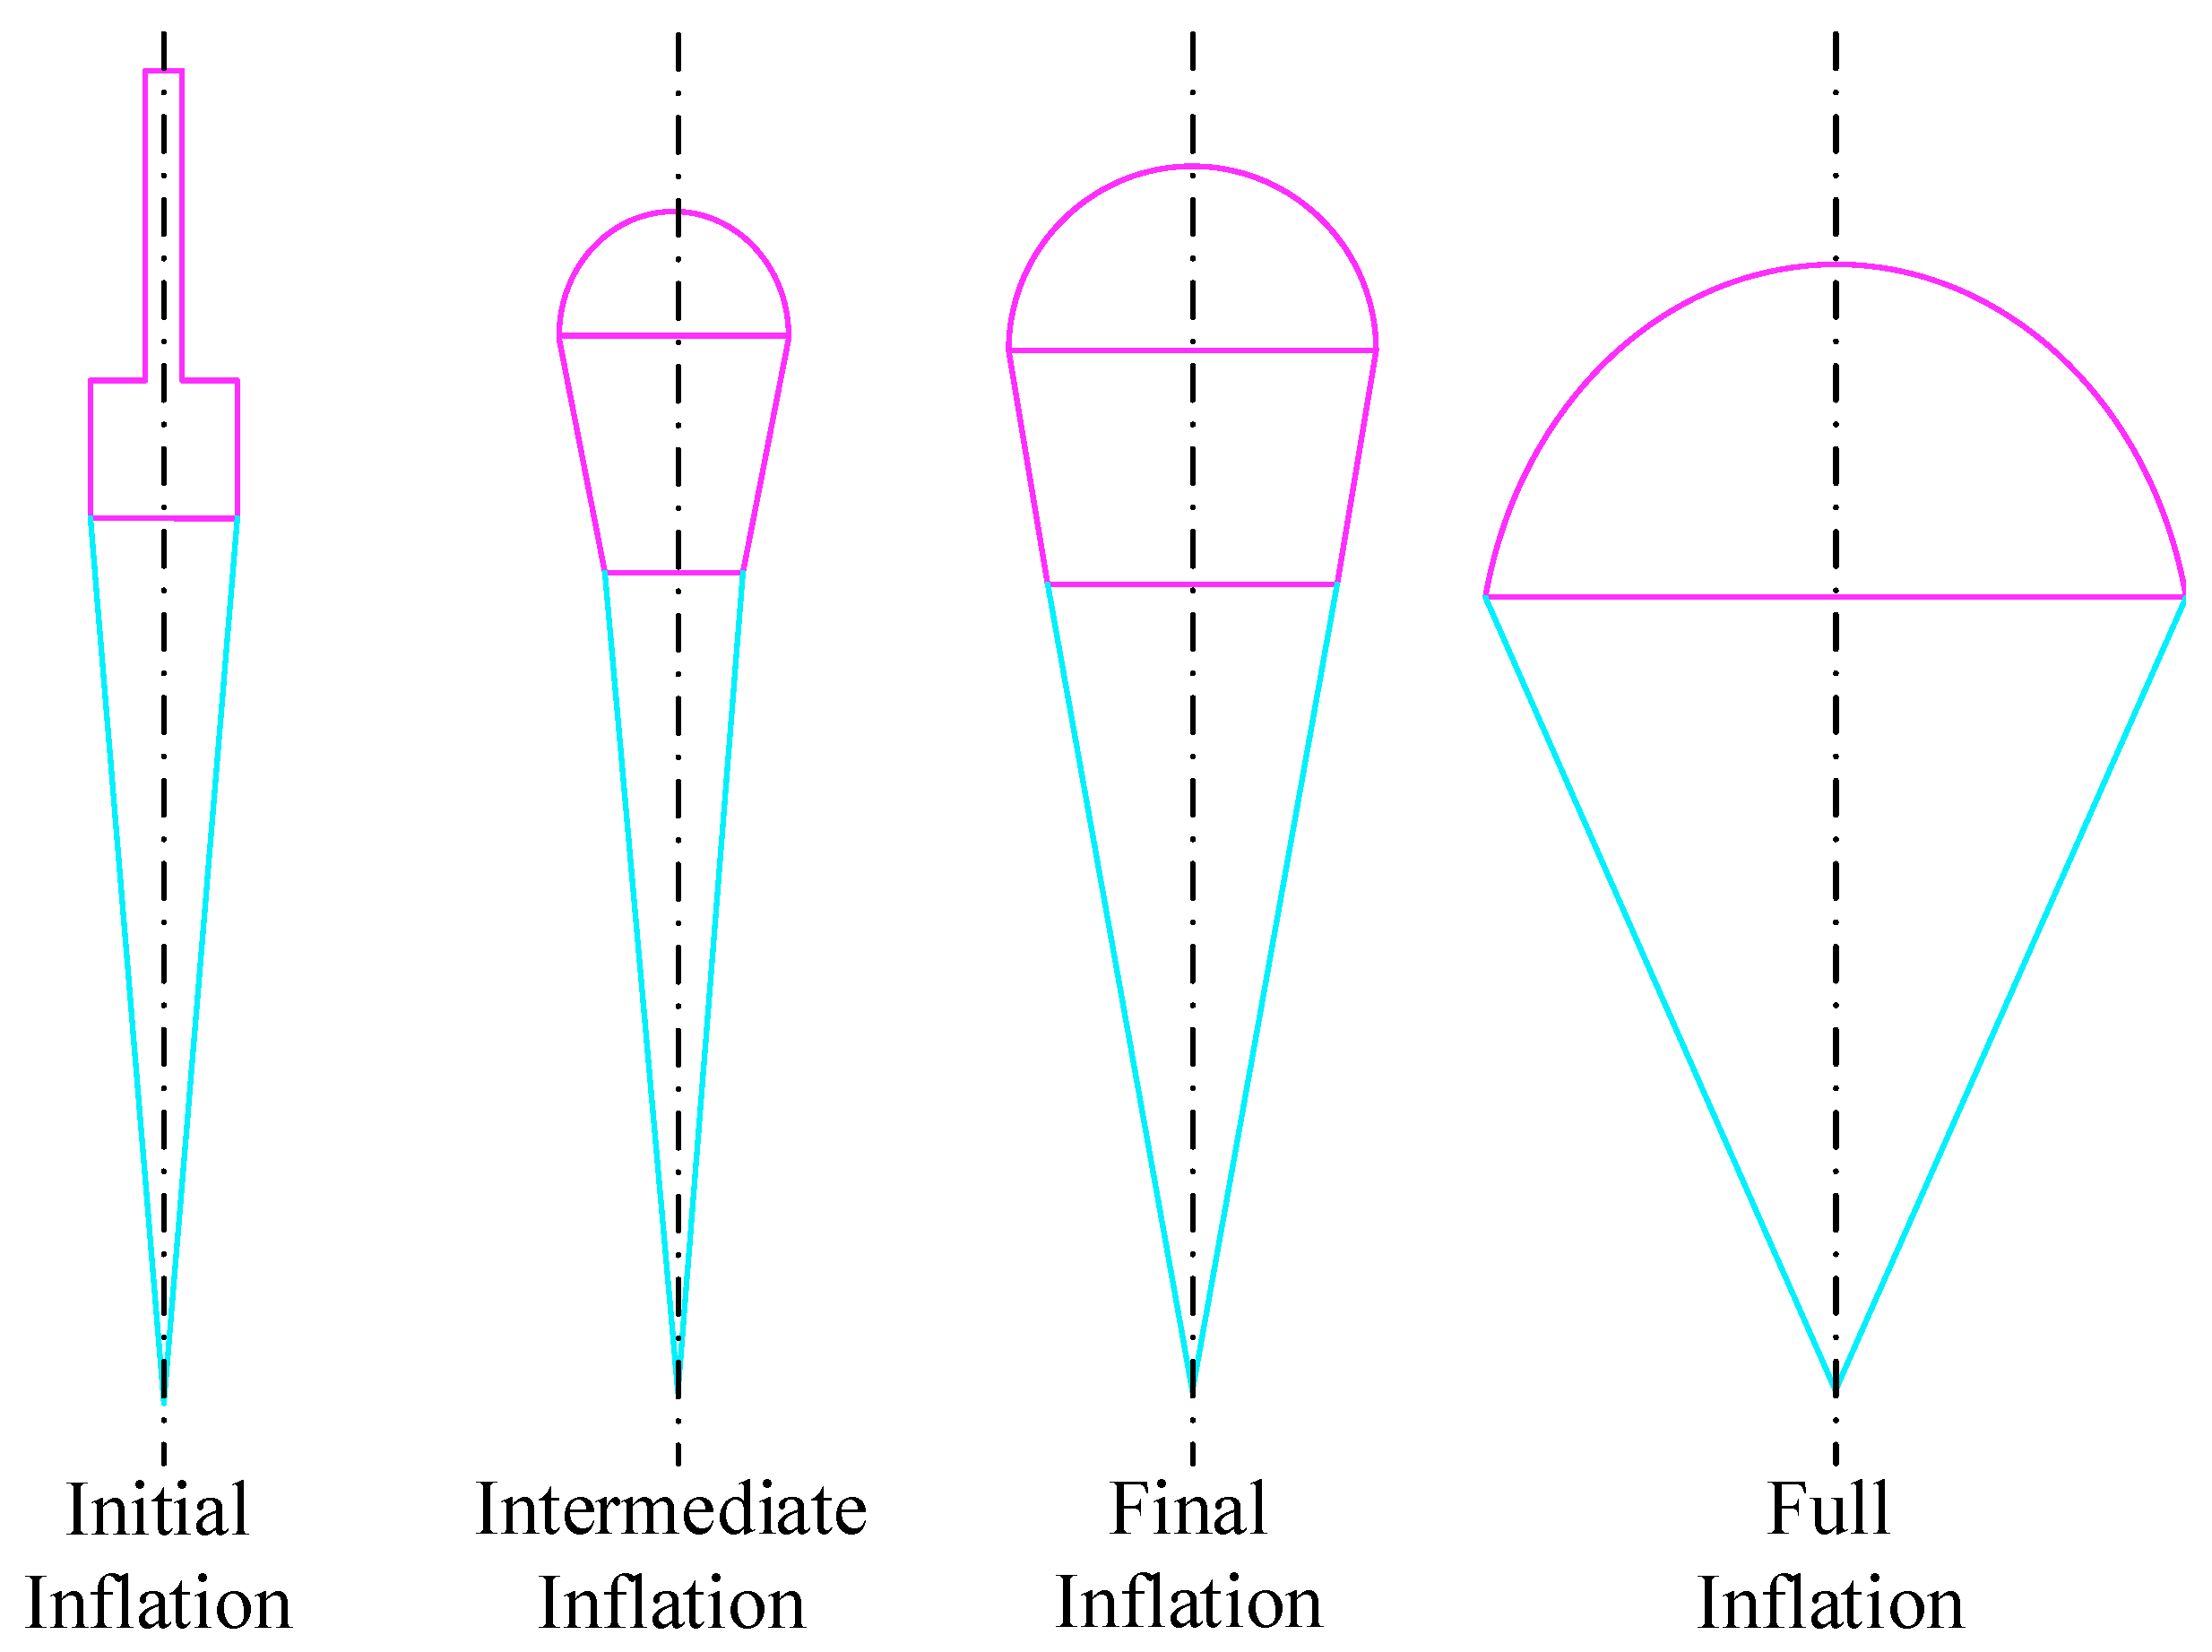
Although the parachute inflation process has very complex dynamics, the simplified inflation based on experimental modifications can well meet the engineering requirements of flight trajectory characterization. Therefore, by referring to the latest correction formula for the inflation process of NASA’s Orion spacecraft, a semi-empirical mathematical model is employed to describe the parachute opening process, considering that the drag area of the canopy, additional mass, and other relevant factors during inflation are closely associated with the canopy shape. For the large parachute recovery system, the parachute suit inflation process can be divided into initial inflation, main inflation, and inflation completion stages, and the canopy shape change process is shown in Figure 3. In the initial inflation stage, the airflow enters the canopy from the bottom and rushes to the top so that the canopy can be expanded into an approximate cylindrical shape. In the early stage of the main inflation stage, the parachute suit is like the shape of a “light bulb”, and its geometric shape can be approximated as a combination of a hemisphere and a conical platform. In the recovery process of large spacecraft, multi-stage closing technology is usually adopted in order to reduce the overload of the opening parachute, so the main inflation process can be further subdivided into level one, level two of inflation, and so on.
The literature [50] of flight test data show that the drag coefficient during inflation and its projected area have the same rule of change, so the parachute coat volume curve must be calculated to obtain the rate of change in the additional mass. The additional mass of the parachute is the sum of two parts: one is the internal mass (air mass contained inside the parachute suit), and the other is the air mass outside the parachute suit that follows the parachute along with the movement of the parachute, and the additional mass of the parachute can be expressed as follows:
m A = 1 + k A ρ
where ∀ is the internal volume of the canopy; k A is the ratio of additional mass to contained mass, which can be determined according to engineering experience [51].
According to the degree of deceleration of the parachute system in the process of parachute inflation and the characteristics of the surrounding flow field, the inflatable can be divided into two kinds of inflatable mode: “infinite mass” and “finite mass”. In this paper, we mainly refer to the empirical model of the parachute drag coefficient fitted in the recovery system test of the Orion spacecraft in the United States. In the inflation process of the large main parachute, the canopy will have a large deformation in a short time, which leads to a large change in the dynamics of the parachute system. Usually, the finite-mass inflation model is used for the dynamics analysis. However, in the deceleration phase of the small tractor parachute, the velocity of the recovered object or the return vehicle does not change much, and so the infinite-mass inflation model can be used for the dynamics analysis.
(1)
Finite mass inflation model
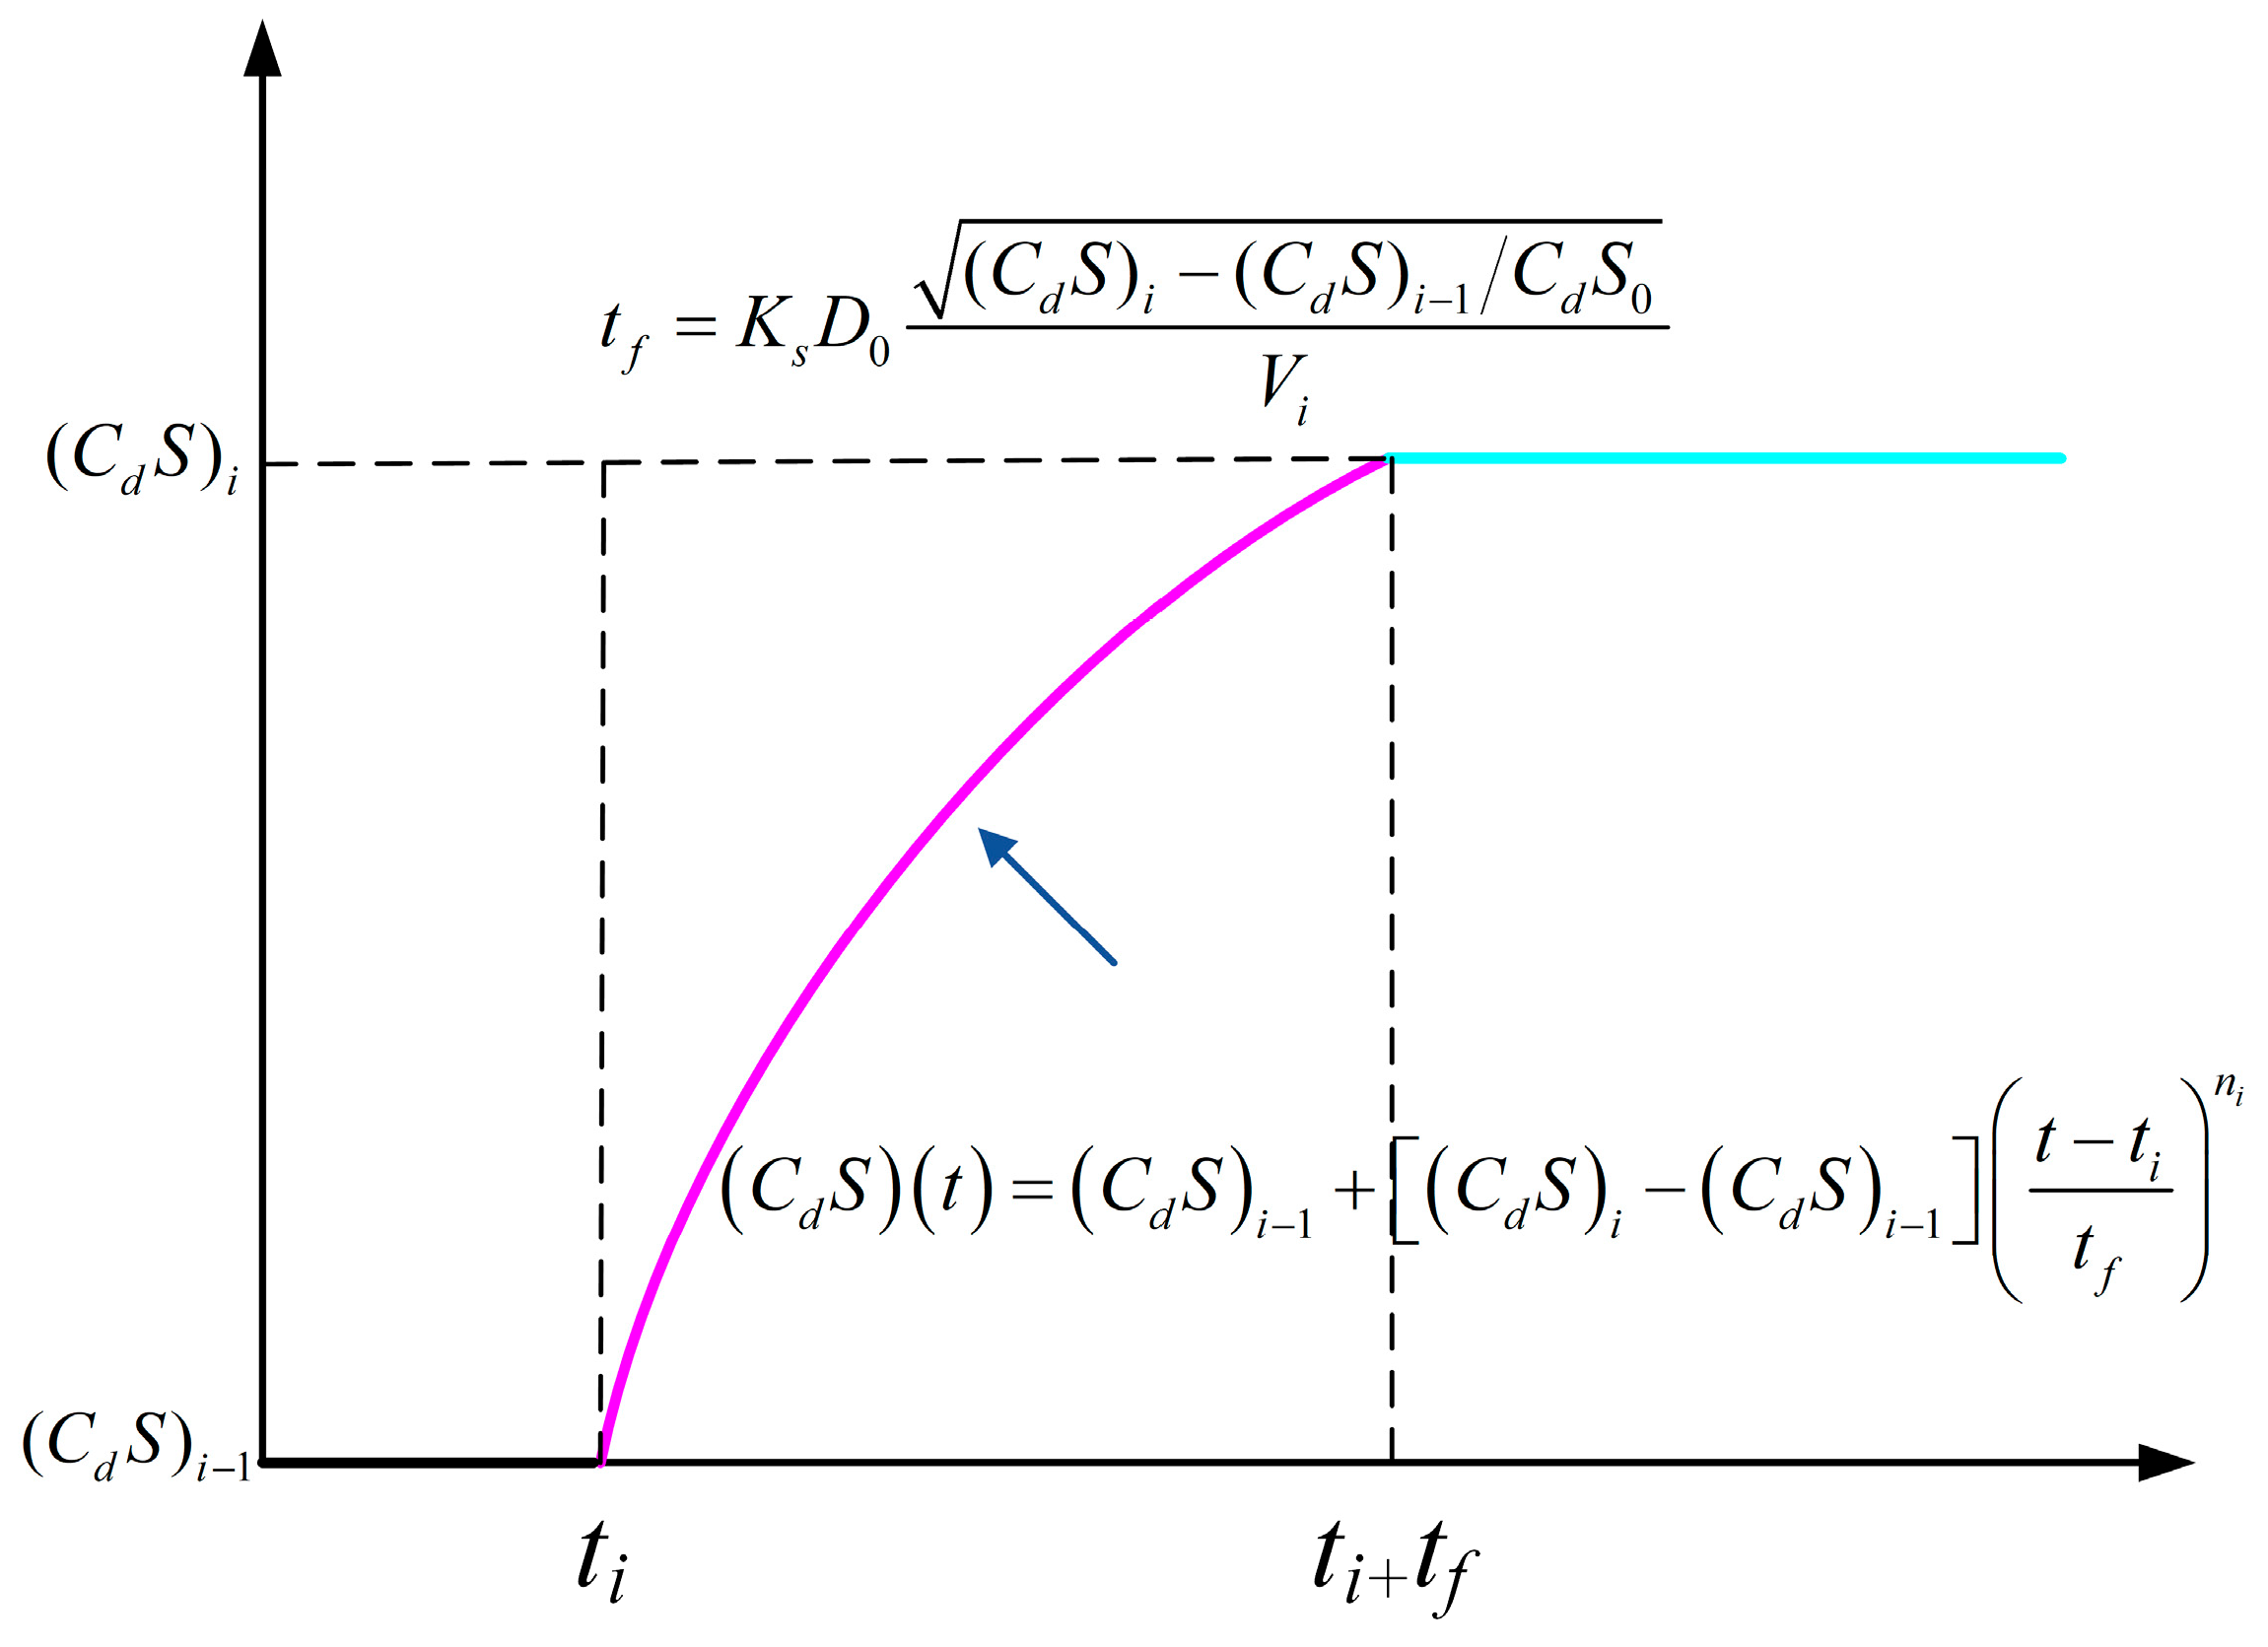
In the finite mass inflation process, as shown in Figure 4, in the i -th inflation phase, at the initial moment t i , the drag force of the parachute is C d S i 1 . After a time t f , the drag area of the parachute reaches a stable value C d S i . The variation in the parachute’s drag area within the time range t i , t i + t f can be represented as follows:
C d S t = C d S i 1 + C d S i C d S i 1 t t i t f n i
where n i is the inflation index of the i -th stage; and the formula for t f is outlined below:
t f = K s D 0 ( C d S ) i ( C d S ) i 1 / C d S 0 V i
where K s is the dimensionless inflation stroke parameter; D 0 is the nominal diameter of the canopy; V i is the relative velocity of the canopy during the inflation process; and C d S 0 is the stabilized drag area of the parachute after full inflation.
Additionally, for the landing phase using a cluster of parachutes for deceleration, this paper refers to the cluster parachute correction method proposed by J. Potvin et al., introducing ϕ j to correct the drag characteristics of the cluster parachute system relative to the single parachute system, that is
C d S j t = ϕ ( j ) C d S 1 t
where the coefficient ϕ j is related to the parachute type and inflation speed; and C d S 1 t indicates the rule of drag area change during single parachute inflation.
(2)
Infinite mass inflation model
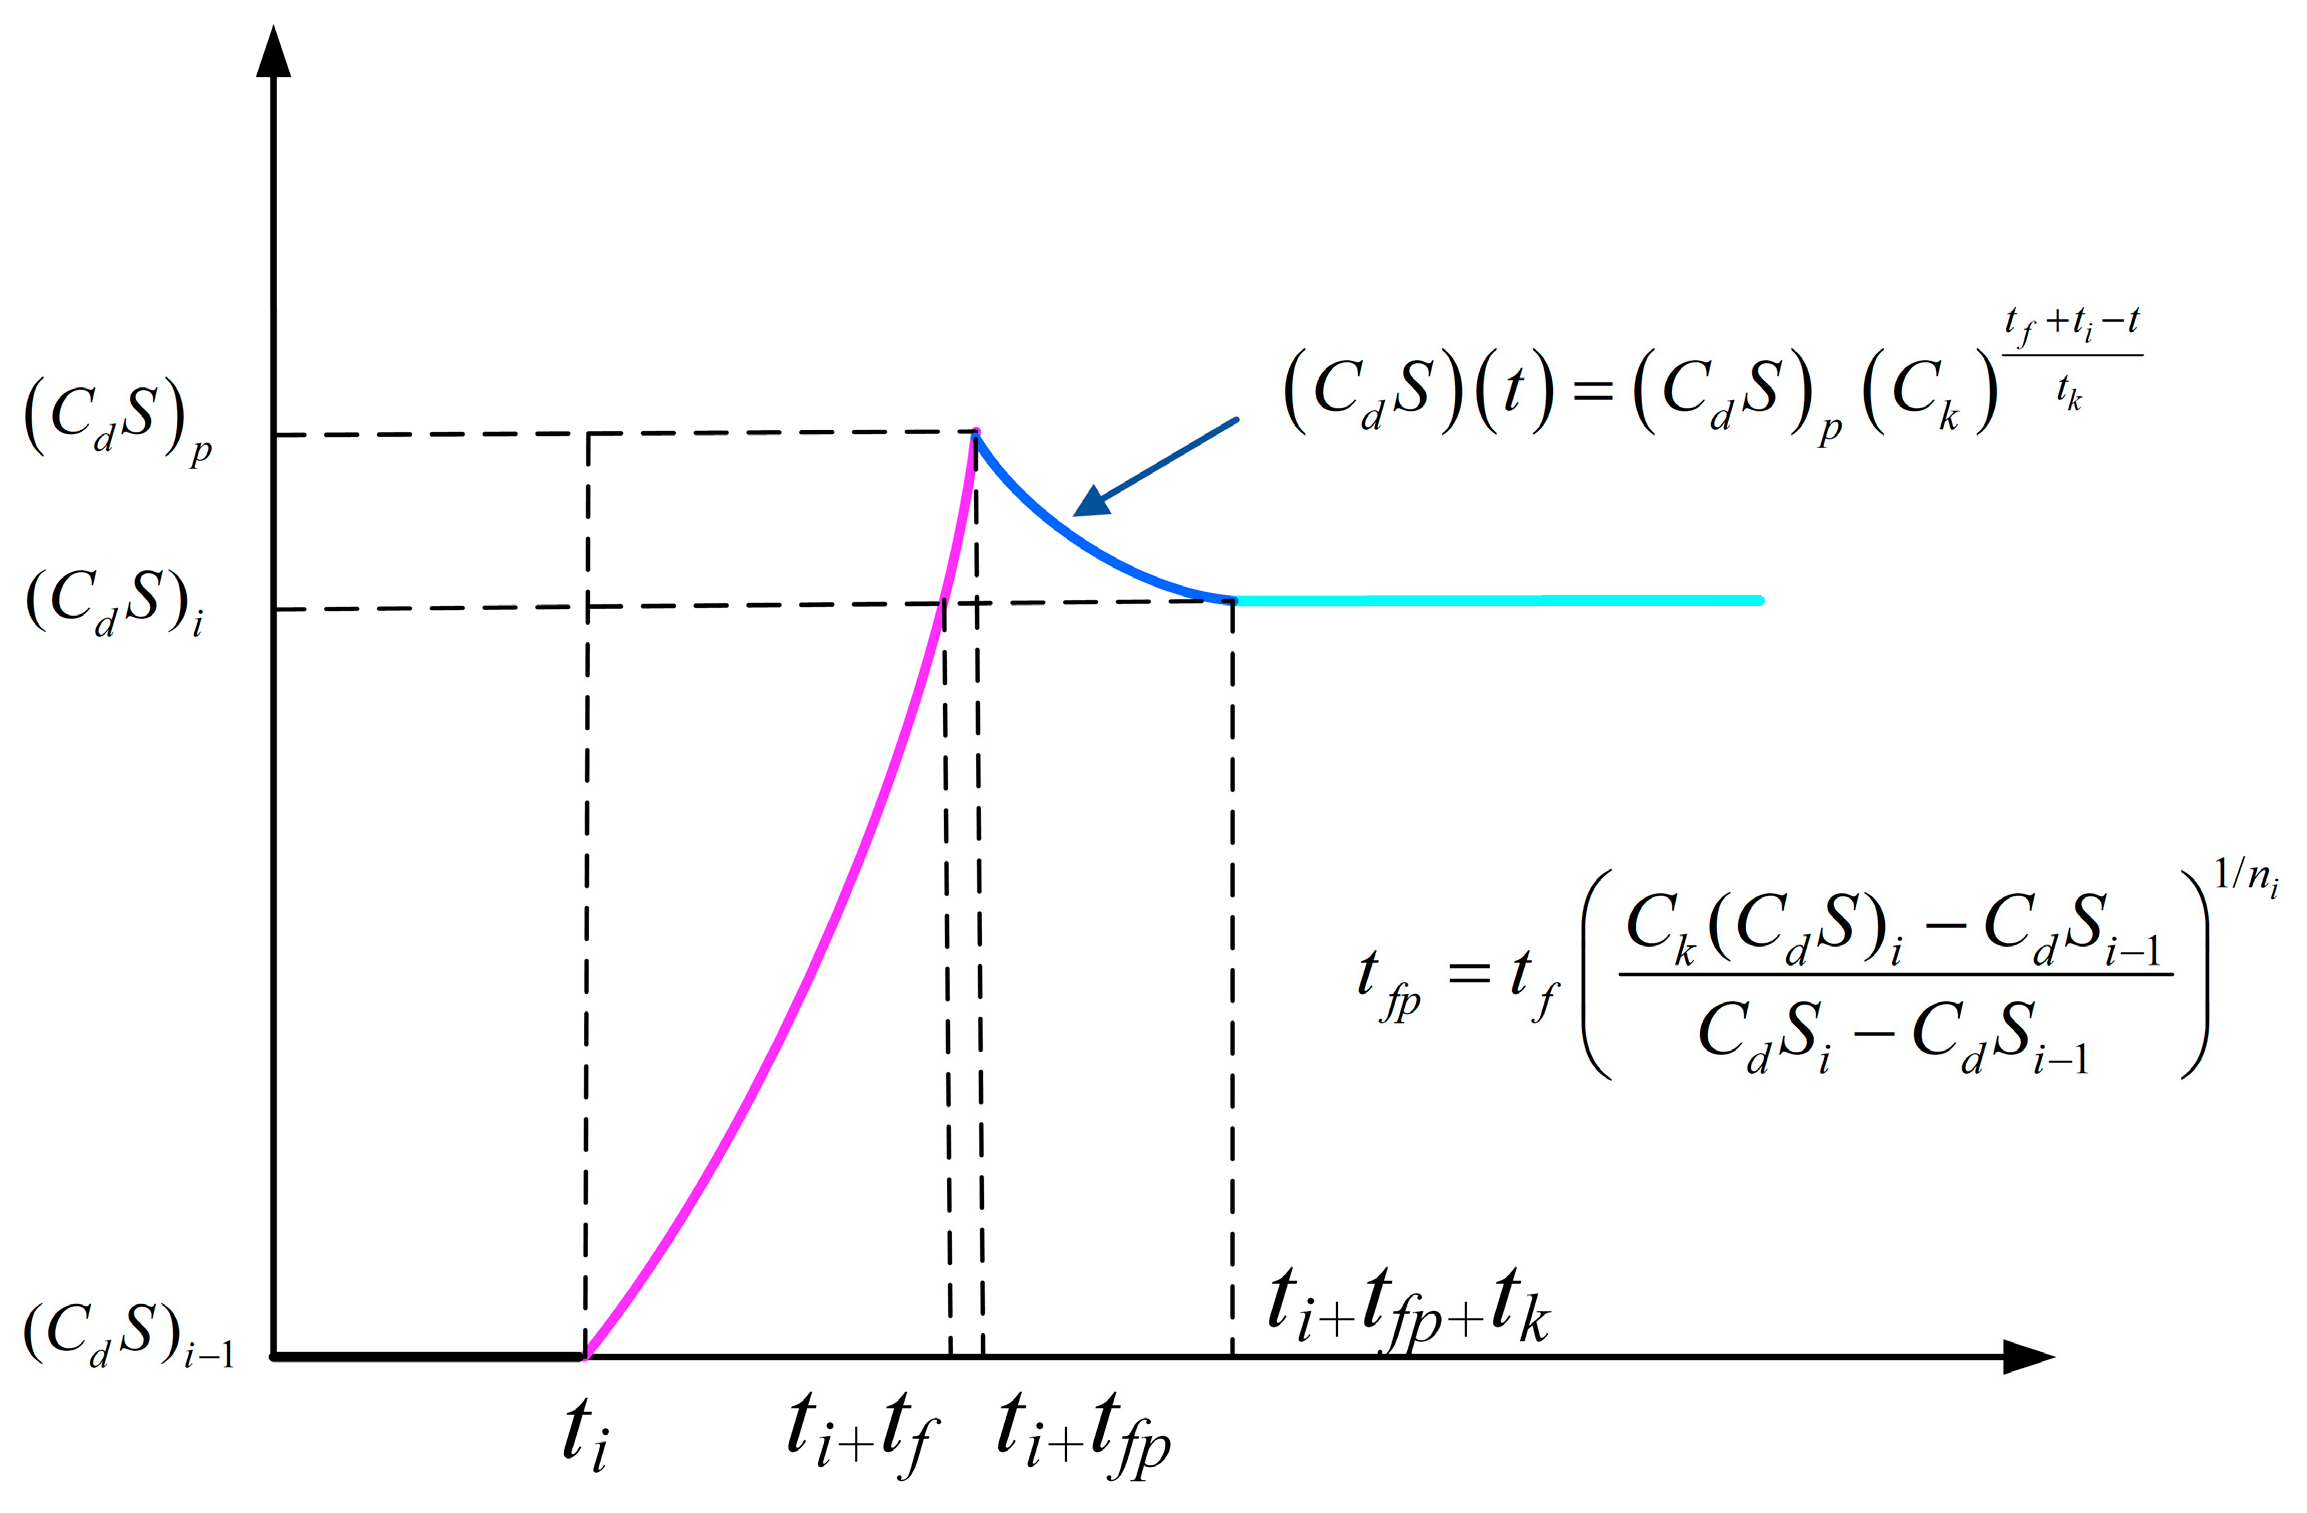
Generally, the overfilled phenomenon appears during the infinite mass inflation process. Figure 5 deploys the parachute drag area change curve of the infinite mass inflation process. It indicates that when the parachute is in the i -th inflation stage, the resistance area C d S i 1 of the initial moment t i reaches C d S i 1 after t f and reaches the peak C d S p after t f p . Then, after t k , it sharply drops to a stable resistance area C d S i . The inflation time t f p can be expressed by the following formula:
t f p = t f C k ( C d S ) i C d S i 1 C d S i C d S i 1 1 / n i
where C k is the peak overload coefficient; and n i is the inflation index. In the range of time t i + t f p , t i + t f p + t k , the drag area of the canopy decreases rapidly from the peak to the steady state, and its change relationship can be expressed as follows:
C d S t = C d S p C k t i + t f t t k

3.2. The 9-DoF Dynamic Model Framework

The mass of the parachute and the added mass are combined into a general mass matrix, m p , and a general moment matrix of the parachute, I p , the increments in aerodynamic force and moments induced by the unsteady motion of the parachute are represented by the apparent mass, thus, m p and I p are as follows:
m p = d i a g ( m c + a 11 , m c + a 33 , m c + a 33 )
I p = d i a g ( I x + a 44 , I y + a 66 , I z + a 66 )
where m c is the mass of the parachute; ( I x , I y , I z ) are the axial moments of the parachute on the joint O; ( a 11 , a 33 , a 44 , a 66 ) is the apparent mass of the parachute.
We can describe the parachute–payload system as outlined below:
m p d d t V p + Ω p × L p + m b d d t V o + Ω p × L p = m p g + m b g + F p + F b
d d t I b Ω b + m b L b × d d t V o = M b + L b × m b g
d d t I p Ω p + m p L p × d d t V o = M p + L p × m p g
where F p , M p , F b , M b denotes the aerodynamic forces and moments of the parachute and payload. To further develop the above equations, as follows:
m b V ˙ o + Ω p × v o + B b p Ω ˙ b × L b + Ω b × Ω b × L b + m p V ˙ o + Ω p × v o + Ω ˙ p × L p + Ω p × Ω p × L p = F b + F p + m b g + m p g
I b Ω ˙ b + Ω b × I b Ω b + m b L b × V ˙ 0 + Ω p × V 0 = M b + L b × m b g
I p Ω ˙ p + Ω p × I p Ω p + m p L p × V ˙ 0 + Ω p × V 0 = M p + L p × m p g
An anti-symmetric matrix is introduced for simulation, as follows:
L ˜ p = 0 L p y L p z L p y 0 L p x L p z L p x 0
L ˜ b = 0 L b y L b z L b y 0 L b x L b z L b x 0
Then, the dynamic equations can be further developed, and introducing the generalized mass matrix of the parachute system A m a s s and generalized force matrix B f o r c e :
A m a s s = m b E 3 × 3 + m p B b p m b L ˜ b m p L ˜ p m b L ˜ p I b O 3 × 3 m p L ˜ p O 3 × 3 I p
B f o r c e = m b E 3 × 3 + m p Ω p × V o Ω b × L b Ω b + m b L b × Ω b × B p b V o Ω b × L b Ω b + m p L b × Ω p × V o m b B b p Ω b × Ω b × L b + m p Ω p × Ω p × L p 0 0 + B b p F b + F b M b M p + m b g + m p g L b × m b g L p × m p g
where E is the unit matrix; and O is the zero matrix. Then, the vector form of the parachute–payload system dynamic equation is
V ˙ 0 Ω ˙ b Ω ˙ p = A m a s s 1 B f o r c e
Introducing the vector R from the connection point to the original point, the Euler angle’s differential equation of the system is
V 0 = B e p R ˙
γ ˙ p ψ ˙ p θ ˙ p = 1 tan θ p cos γ p tan θ p sin γ p 0 cos γ p / cos θ p sin γ p / cos θ p 0 sin γ p cos γ p Ω p
γ ˙ b ψ ˙ b θ ˙ b = 1 tan θ b cos γ b tan θ b sin γ b 0 cos γ b / cos θ b sin γ b / cos θ b 0 sin γ b cos γ b Ω b
In summary, this dynamic model can be used to simulate and analyze the dynamic characteristics, such as attitude, velocity, acceleration, and so on, of the parachute–payload system.
The theoretical foundation and validation of the 9-DoF dynamic model and its parameter system adopted in this work have been thoroughly elaborated and verified in prior research [52]. These studies confirmed the model’s sufficient accuracy and reliability. Therefore, the focus of this paper will shift to the model’s integration and application validation within the proposed HIL simulation platform.

4. HIL Simulation Platform

4.1. HIL Simulation Platform Overview

The PADS HIL simulation platform establishes dynamic and control models for key operational phases—including deceleration parachute deployment, parafoil operation, and cluster parachute operation—and provides a real-time simulation environment for analyzing motion characteristics, interface relationships, and timing sequences. It enables the emulation of flight control processes, real-time dynamic simulation with visualization of the full airdrop sequence, and comprehensive analysis of system-wide dynamic behaviors. Applications include visualized simulation analysis and verification for system architecture design, landing guidance algorithms, navigation scheme development, and critical component validation, as well as serving as an automated testing platform for homing procedure controllers.

4.2. HIL Simulation Platform Architecture

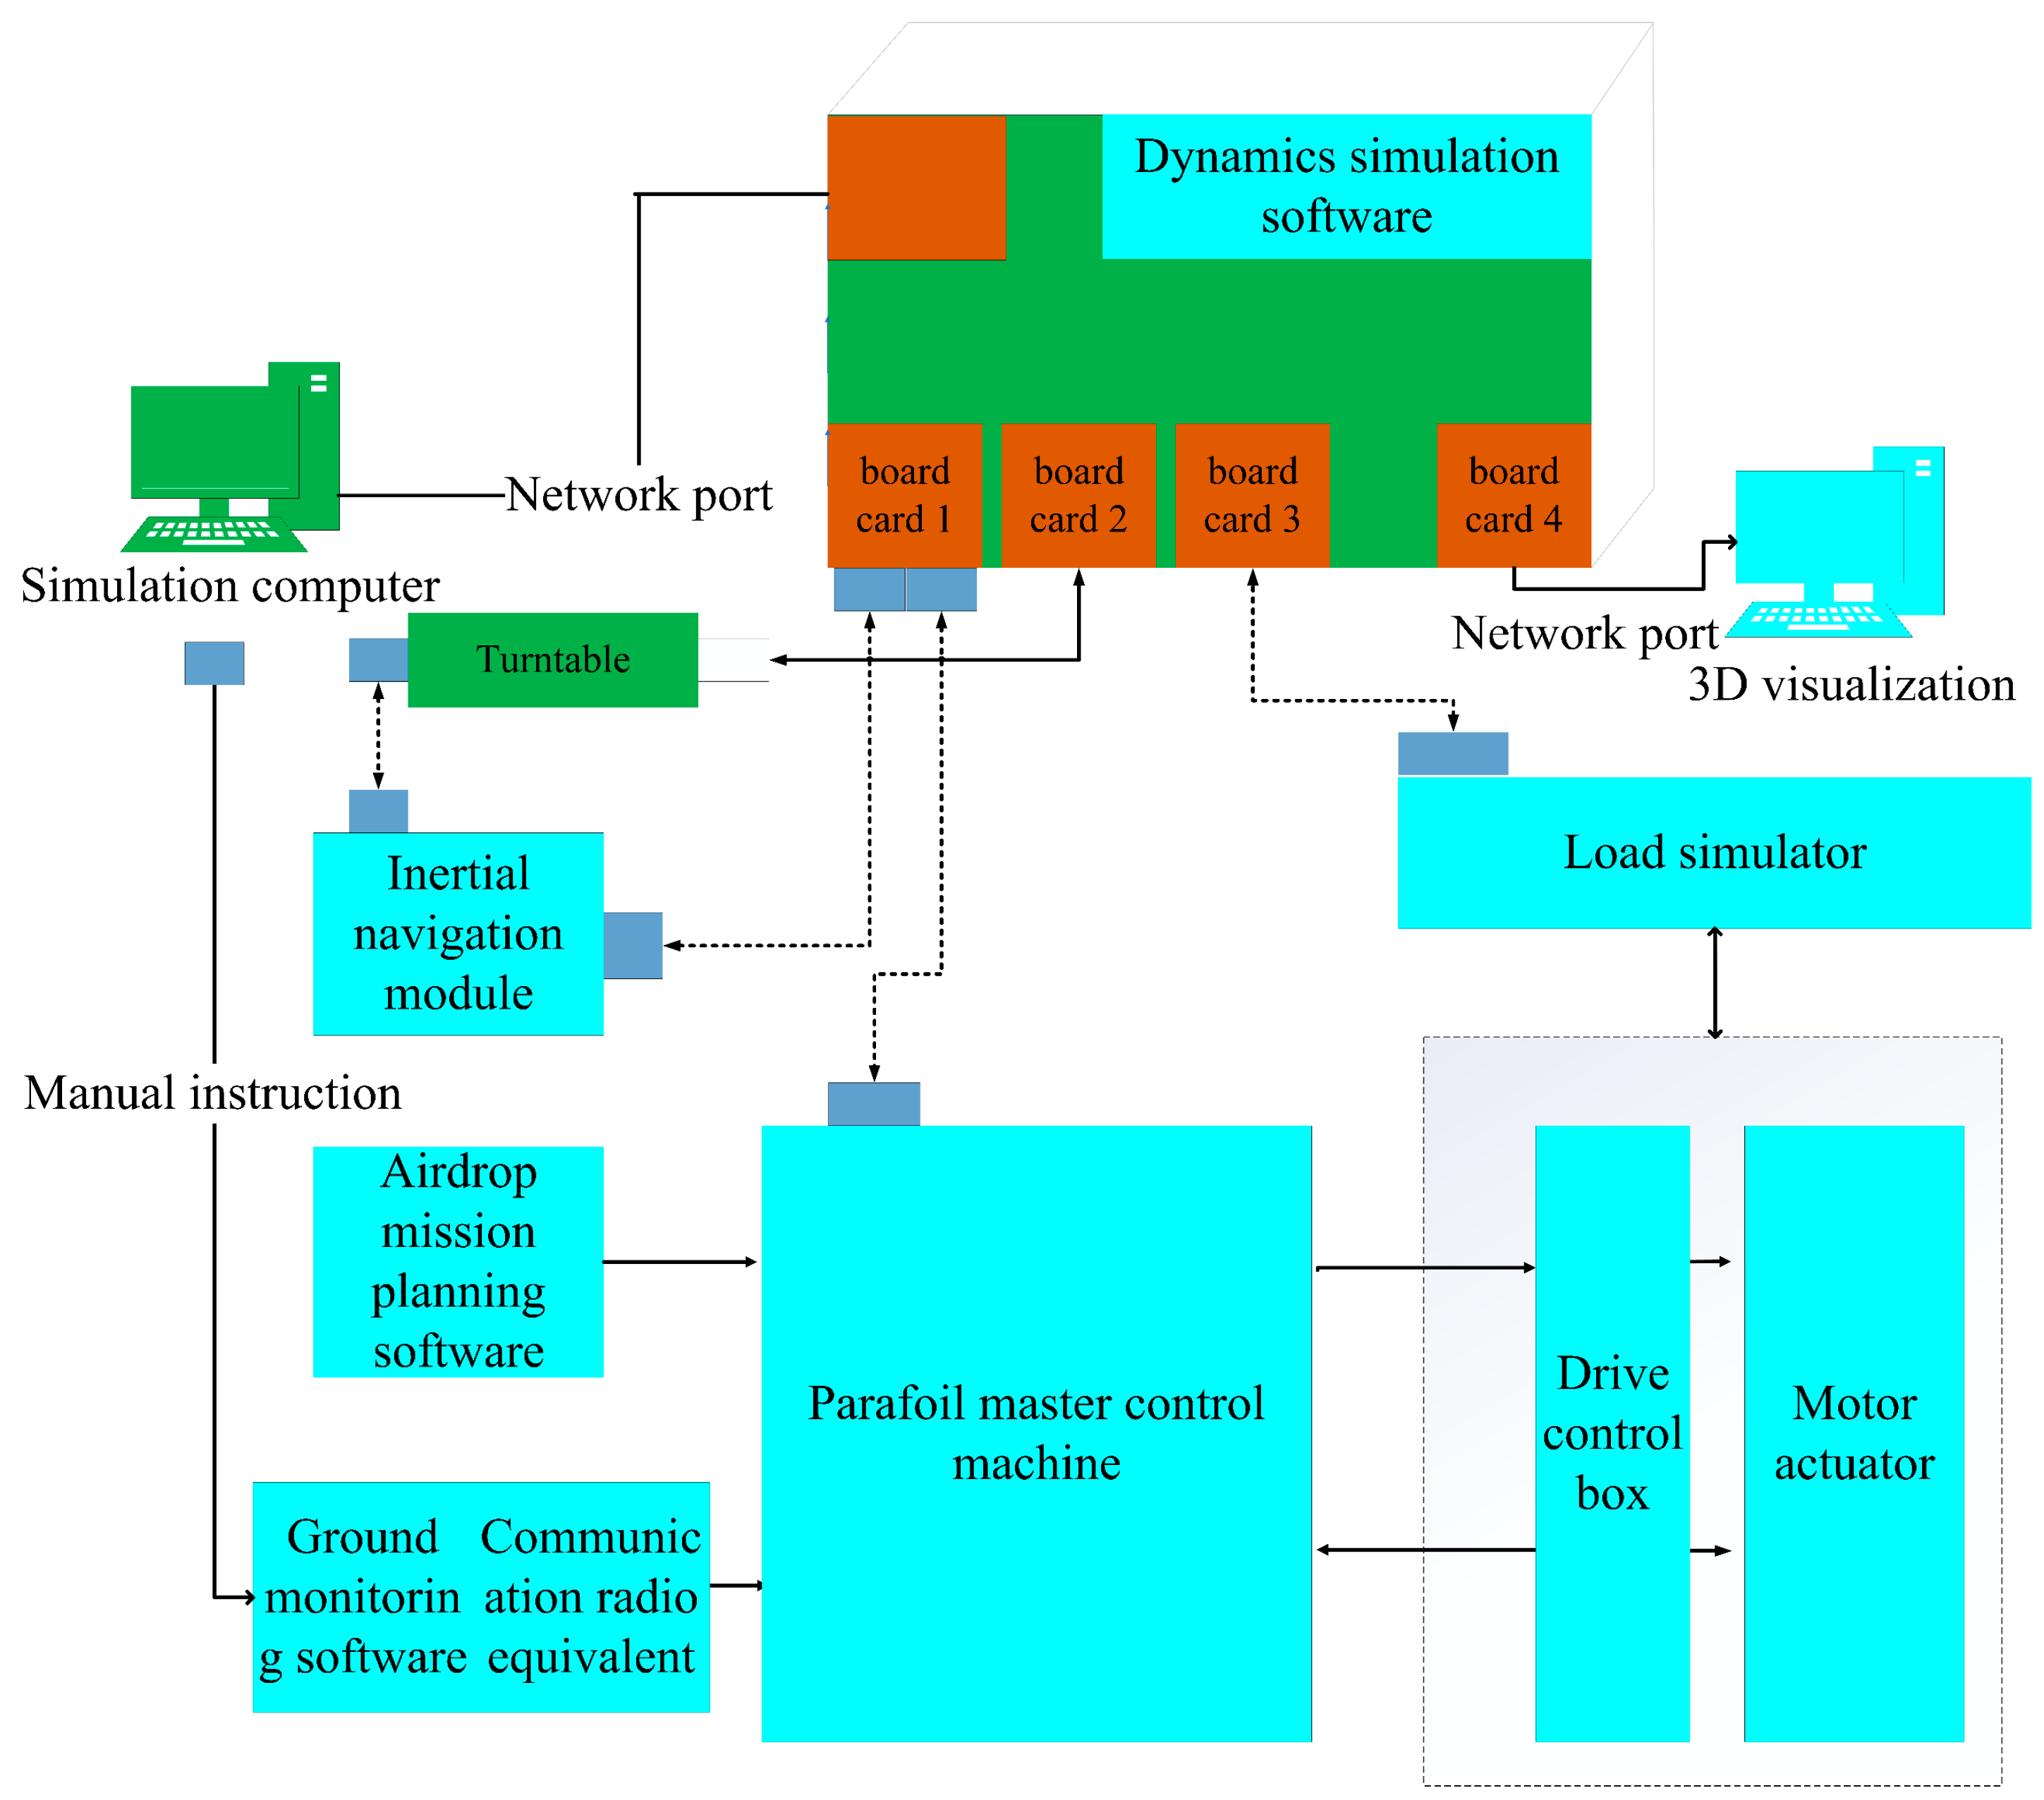
The PADS HIL simulation platform comprises four core components: Unit Under Test (UUT), Dynamic Models, Emulators, and Simulators. Their functions are shown in Table 1. The Airdrop HIL Simulation System consists of five core subsystems: Real-Time Simulation Platform Subsystem, Dynamic Simulation Model Subsystem, Three-Axis Electromechanical Rotary Table Subsystem, Visualization Scenario Display Subsystem, and Simulation Task Management Subsystem. The system architecture and structural framework are illustrated in Figure 6.

4.3. Operation Process of HIL Simulation Platform

The operating process of the airdrop HIL simulation platform comprises three phases: the preparation phase, the flight control phase, and the data playback and processing phase. Figure 7 depicts the HIL proof-of-concept prototype developed in this study, and the processes are summarized as follows:

4.3.1. System Preparation Phase (Airdrop Preparation Phase)

(1)
Integrated control box, simulation test computer, and display equipment power-up.
(2)
The communication and navigation control system (upper and lower chassis) and motorized three-axis rotary table (including inertial guidance module) are powered up.
(3)
The parafoil master control machine completes the initial parameter injection (target point, excitation point, hovering point, navigation mode, control mode, hovering radius, gliding ratio, etc.).
(4)
Start the ground monitoring software and read in the initial wind field data from the wind field environment toolkit.
(5)
Start the 3D view display software and read the geographic environment model from the Geographic Environment Modeling Toolkit.
(6)
Start the simulation task management software and set up the simulation task. Define the parameters of the parafoil system, select the aerodynamic data of the parafoil, the wind field environment data (initial wind field and real-time wind field), and the dynamics model.
(7)
The integrated control box downloads the parachute dynamics model, simulation initial parameters, and wind field data from the simulation task management software.

4.3.2. Real-Time Simulation Phase (Controlled Flight Phase)

(1)
The integrated control box collects the maneuvering line offset from the drive control box by means of parallel leads.
(2)
The integrated control box solves the wing and parachute dynamics model in real time, and uses the results to drive the load simulator, the guard-guide equivalent, the three-axis motorized rotary table, and the three-dimensional view display software, respectively.
(3)
The 3D view display software reads the flight state of the wing and parachute system from the dynamics simulation software and displays it online in real time.
(4)
The load simulator sends the simulated load control quantity to the load actuator to apply the simulated load to the maneuvering line.
(5)
The inertial guidance module rotates with the three-axis motorized rotary table and sends out the inertial guidance attitude data, which is corrected and supplemented (position, velocity, and heading data) and then transmitted to the guidance equivalent.
(6)
The guard-guidance-equivalent device integrates and processes the inertial guidance data, simulated guard guidance position, and altitude data, and sends them to the parafoil general control machine.
(7)
The master controller monitors the ground monitoring software for new control commands. If it monitors the valid ground instruction, it runs the control algorithm according to the ground instruction, calculates the control quantity, and sends it to the motor drive control box; if there is no valid ground instruction, it runs the pre-loaded control algorithm, calculates the control quantity, and sends it to the motor drive control box.
(8)
The motor controller issues commands to the parachute line manipulation actuator, which controls the motor to drive the winch to rotate and pull the manipulation line.
(9)
The potentiometer coaxial to the capstan follows the same angle of rotation and provides real-time feedback to the motor drive control box.
(10)
Repeat step (8) and continue with the new control action cycle until the system lands.

4.3.3. System Post-Processing Phase (Data Playback Phase)
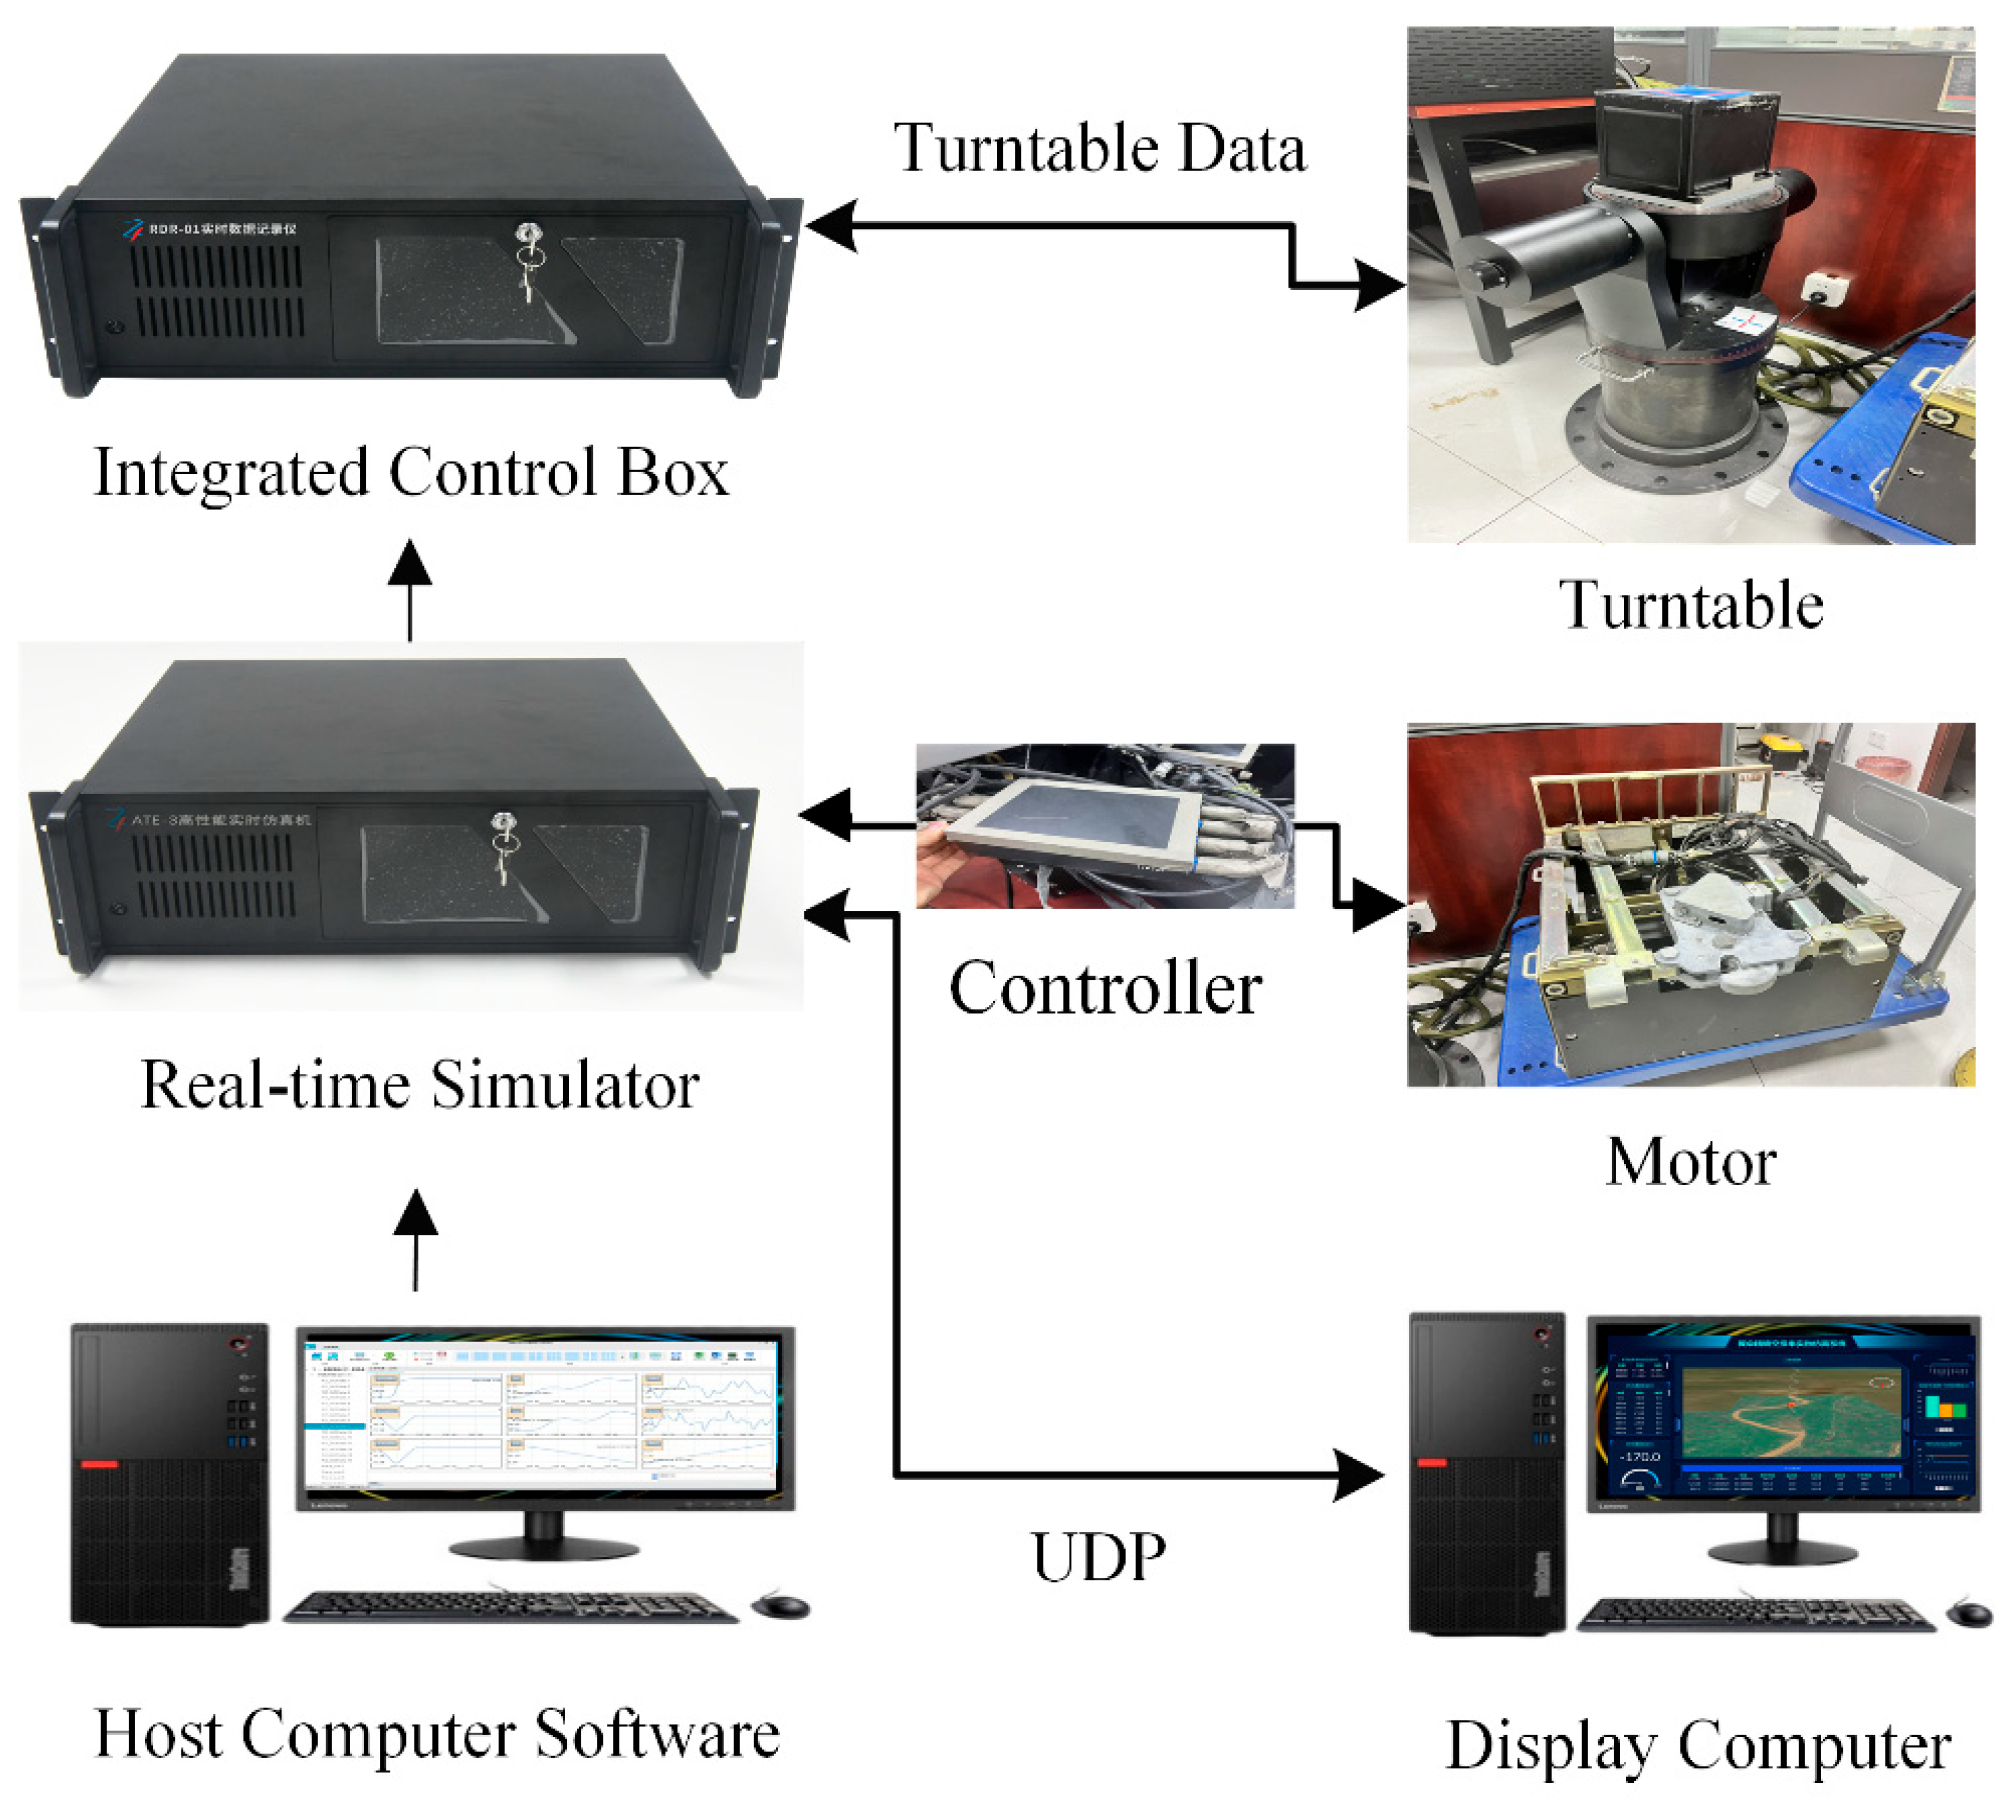
At the end of the simulation, the 3D view display software reads the downlinked flight data and performs data playback offline.
Figure 7. HIL proof-of-concept prototype.
Electronics 14 04285 g007

5. Simulation

5.1. Full Process Dynamics Simulation

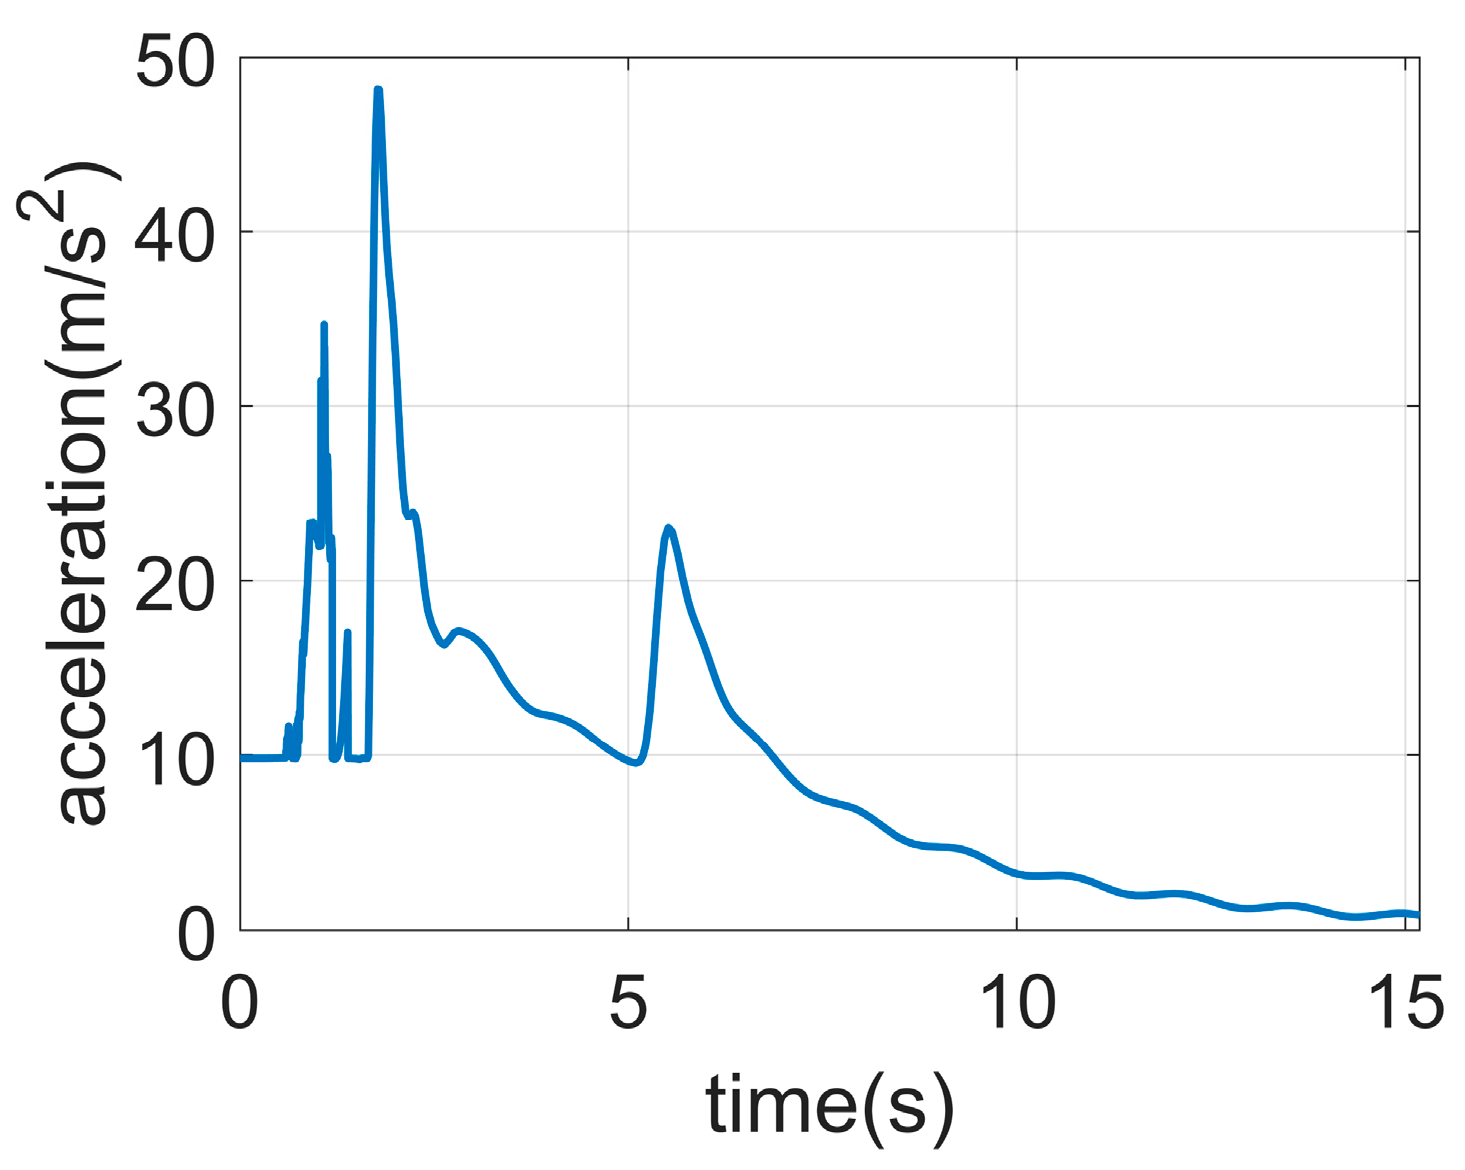
In this section, the airdrop process is simulated and analyzed to verify the accuracy and applicability of the established dynamics model. In the simulation, mainly for the plateau test state of an airdrop system, a multi-flexible body model is used to establish the dynamics model of the opening process, the opening process, and the steady descent process. In the opening process, the main parachute and its parachute line are divided into 120 flexible line segments, and the suspension lines are discretized into 20 flexible segments; the traction parachute is treated as a rigid body. Under the dropping speed of 120 m/s (completely horizontal direction), the opening time is about 1.076 s, the maximum opening force is 145.7 kN, and the maximum acceleration is about 48.13 m/s2.
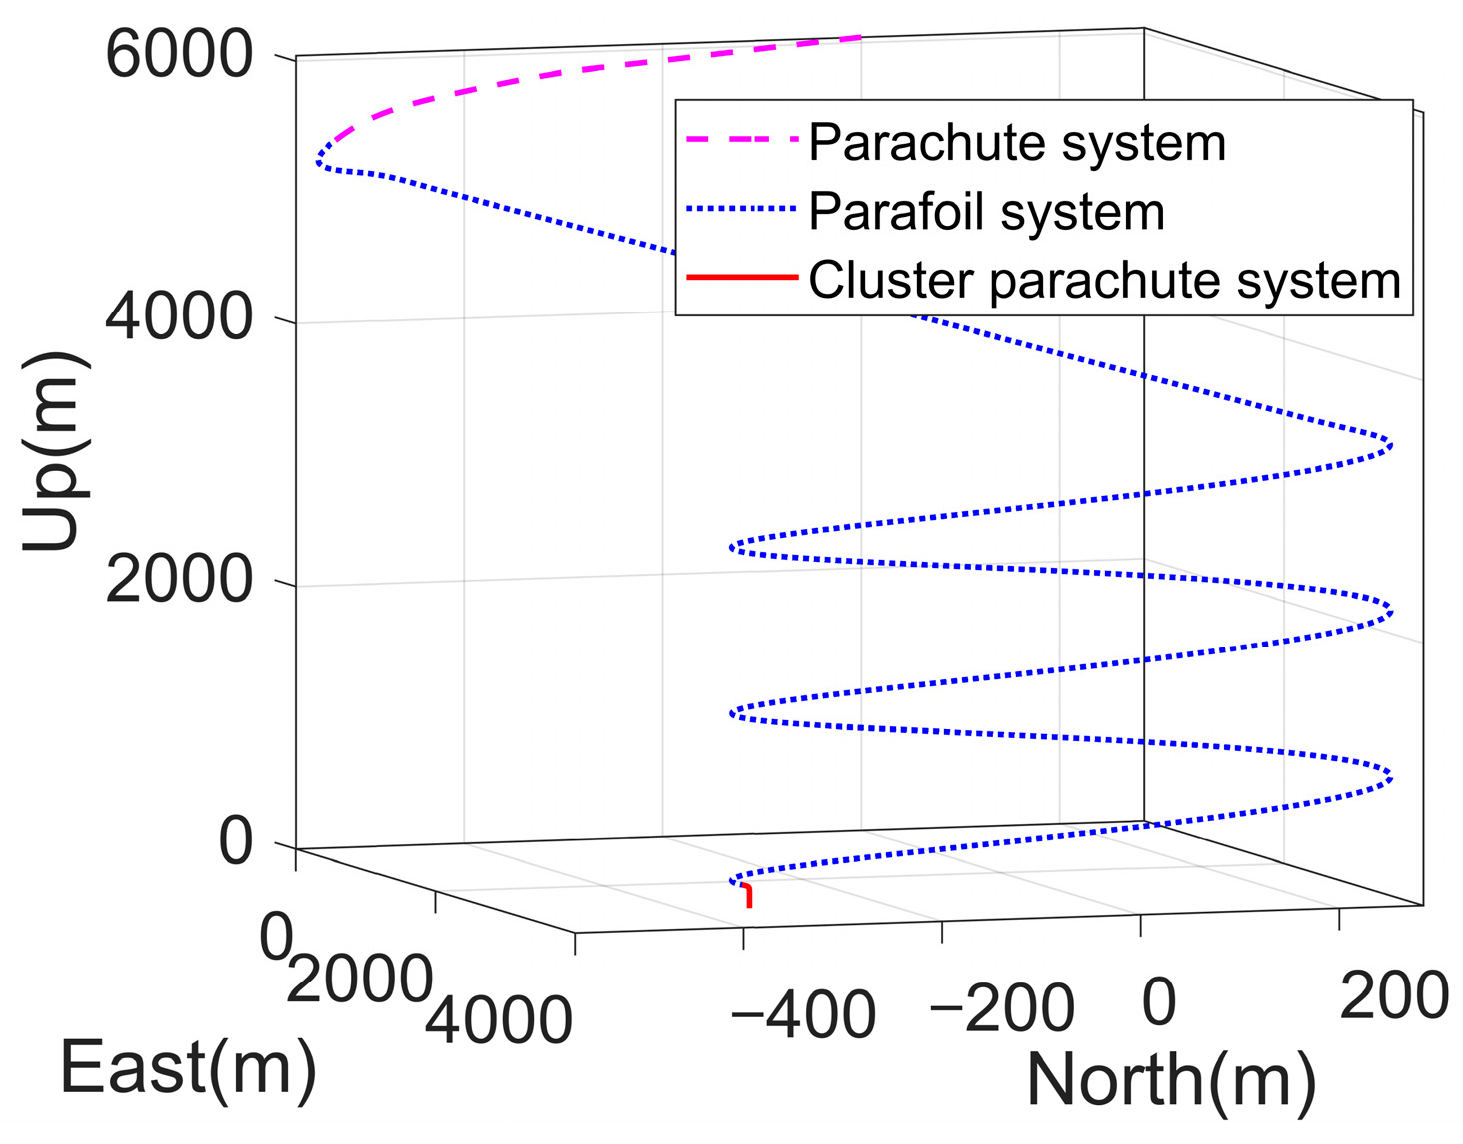
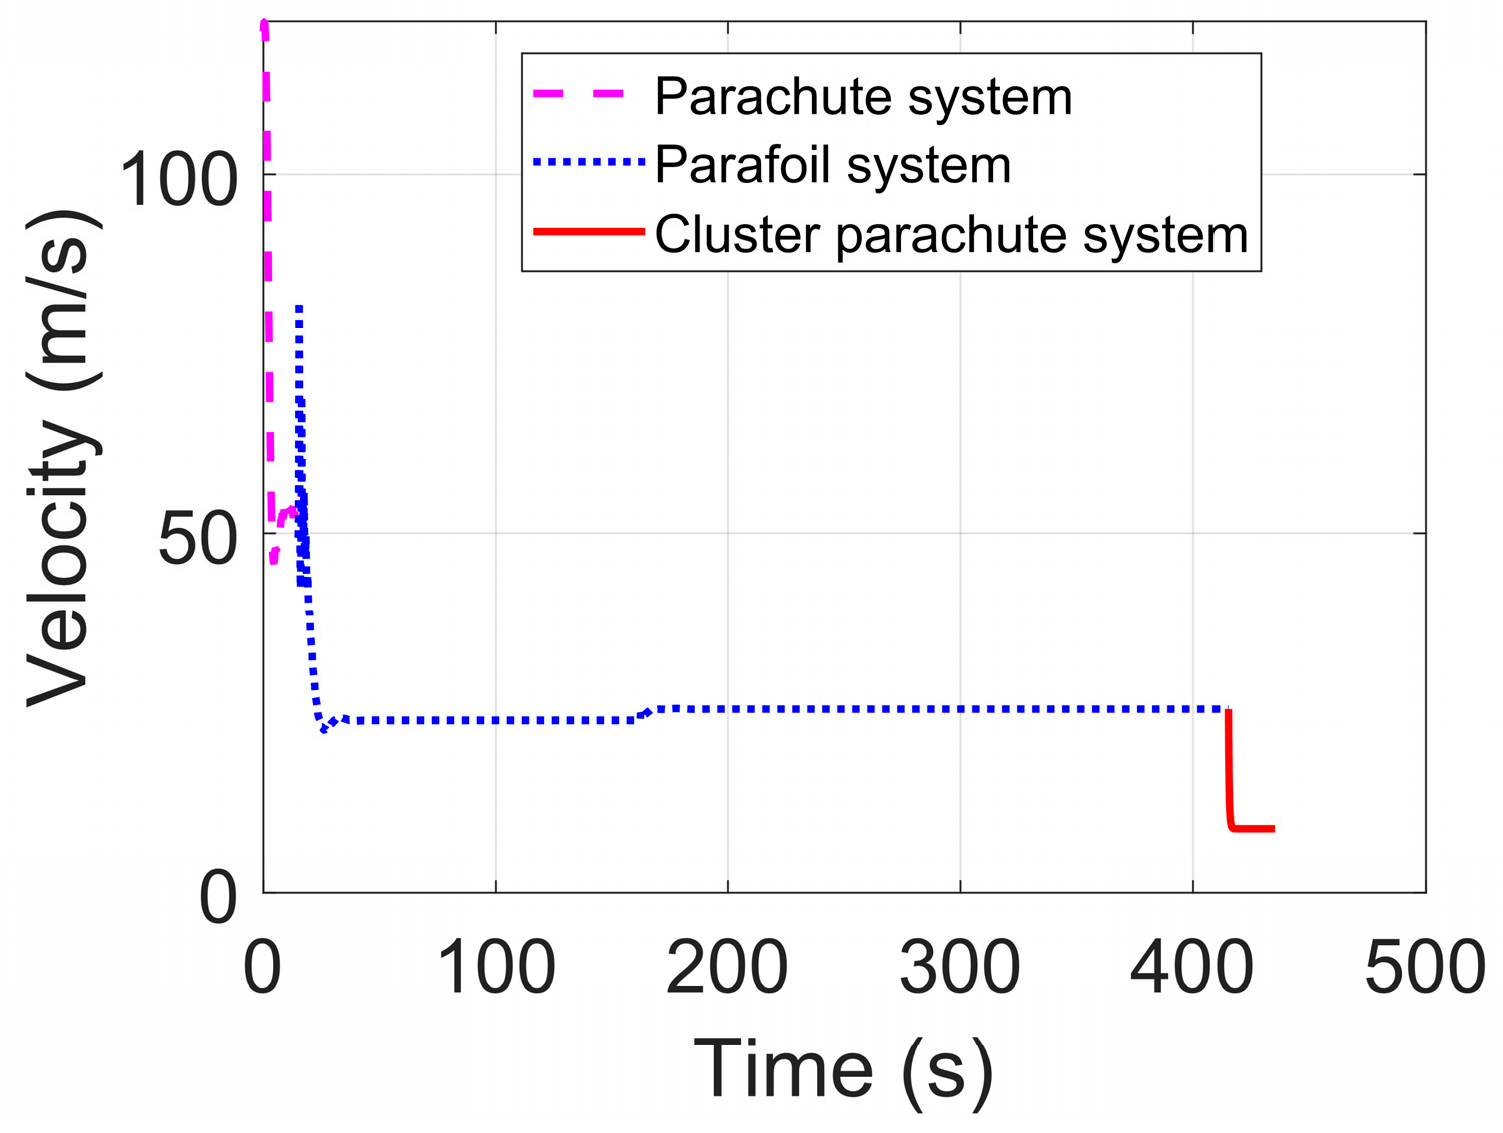
Figure 8 presents the acceleration variation in the cargo platform during the main parachute operation phase, while Figure 9 shows the motion state diagram of the parachute system during the deceleration parachute deployment process; specifically, the dots denote the deceleration parachute packs, the squares denote the cargo platform, and the connecting lines denote the parachute cords. Figure 10 illustrates the three-dimensional trajectory of the cargo platform throughout the airdrop process, and Figure 11 displays the combined velocity–time curve of the cargo platform during the airdrop. From the simulation results, it can be observed that the airdrop system first decelerates to approximately 50 m/s; after about 6 s, the parafoil starts to expand; and finally, the landing velocity under the action of the cluster parachutes is 8.8 m/s. To sum up, the dynamic model for the entire process of Precision Aerial Delivery Systems can effectively simulate the motion characteristics of the airdrop system, such as the parachute-opening overload, the steady-state flight velocity of the parafoil, and the acceleration of the cargo platform.

5.2. HIL Principle Prototype Verification

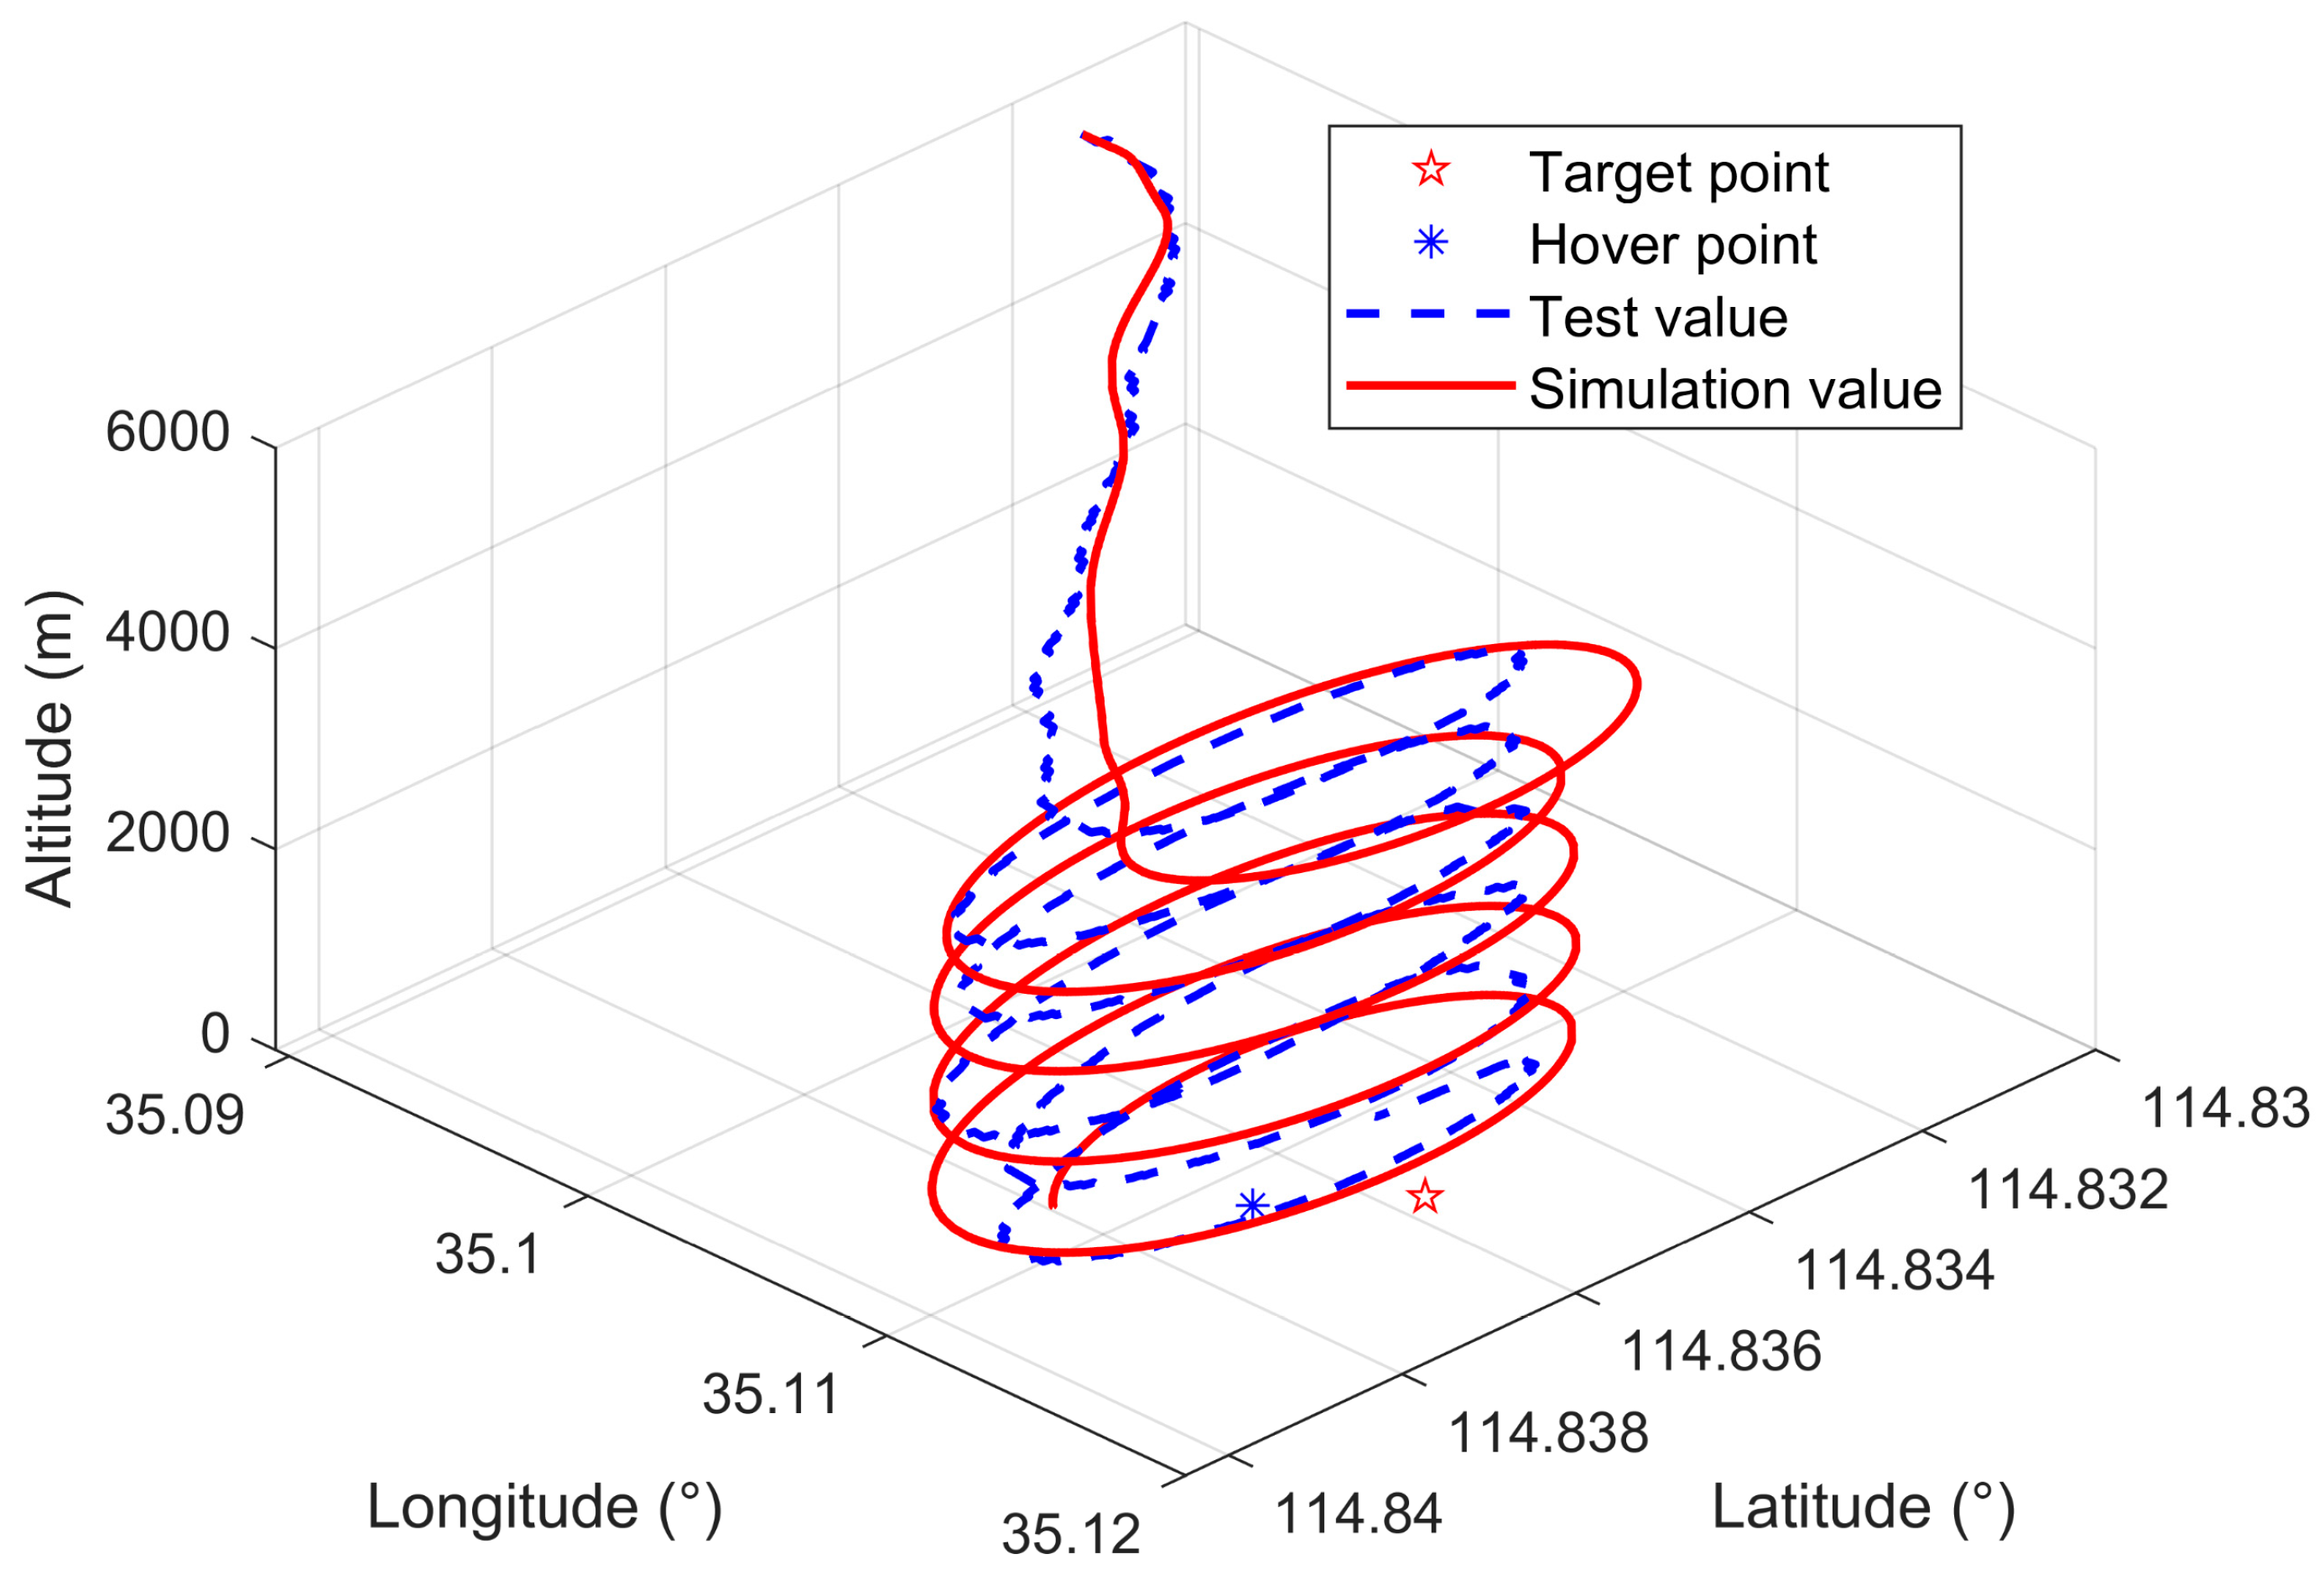
Under specific airdrop test conditions, we conducted full-process HIL simulation tests of the system to verify the hardware configuration, data interface, parameter definition, input/output signals, and display functions of the principle prototype. Figure 12 gives a comparison of the flight trajectory of the parachute system in the HIL simulation test and the airdrop test; from this, the following can be seen: Despite trajectory deviations attributable to wind field uncertainties and stochastic factors, the flight trajectory of the parafoil in the HIL simulation has the same movement trend as the airdrop test trajectory. It shows that the HIL simulation prototype basically has the ability of HIL simulation for the whole process of the precise airdrop. Real-time injection of test vectors enables the following:
  • Initial State Setting: Customization of initial conditions and system parameters, including initial position, paraglider parameters, target point settings, etc.
  • Real-Time Simulation Efficiency: Continuous monitoring of UUT parameters (Figure 13). The control quantity of simulation data is generated at a frequency of 4 Hz. The simulated motion delay of the simulator is less than 1 ms, and it can generate dynamic model results per millisecond.
  • Result Display: Three-dimensional visualization of wind fields, initial parameters, pitch–plane deviations, and real-time flight data.

6. Conclusions

Conventional aircraft-based precision airdrop testing is prohibitively costly and, due to constraints in resources, funding, and testing capability, has been limited to nominal atmospheric conditions and standard initialization scenarios—leaving performance in extreme environments unverified. To address the urgent need for rapid trajectory analysis in airdrop missions, this paper integrates previously developed models for parachute dynamics, parafoil dynamics, and a cluster parachute system. Key enhancements introduced in this work include dynamics models for parachute line stretch and inflation, a system-level airdrop process dynamics framework, and an HIL prototype that integrates parafoil navigation and control systems. Through hardware-in-the-loop simulations, the proposed framework thereby enables the supply of empirical data for optimizing the design of PADS.
The main contributions of this research are twofold, as follows:
(1)
Development and validation of a physics-based deceleration parachute model that accurately captures line-stretch and inflation dynamics; by integrating a 9-DoF dynamic framework, a full-process dynamic model for the three stages of deceleration of the parachutes, parafoils, and cluster parachutes was established.
(2)
Establishment of a hardware–software-integrated HIL simulation platform for end-to-end airdrop process emulation, which supports multi-scenario testing, flight performance evaluation under variable conditions, and serves as a physics-based virtual proving ground for system optimization.
Looking forward, future work will focus on extending the current framework to incorporate more complex environmental disturbances, such as turbulent wind fields and multi-aircraft interaction effects, as well as exploring adaptive control strategies to further enhance landing accuracy and system robustness under uncertain operational conditions.

Author Contributions

Conceptualization, Q.Z. and W.Z.; methodology, Z.C.; software, Z.C.; validation, W.Z. and J.L.; formal analysis, W.Z.; data curation, J.L.; writing—original draft preparation, W.Z.; writing—review and editing, Q.Z.; funding acquisition, Q.Z. All authors have read and agreed to the published version of the manuscript.

Funding

This research was funded by the National Natural Science Foundation of China (11772353).

Data Availability Statement

The original contributions presented in this study are included in the article. Further inquiries can be directed to the corresponding author.

Conflicts of Interest

The authors declare no conflicts of interest.

References

  1. Zhu, H.; Sun, Q.; Sun, H.; Chen, Z.; Zeng, X.; Soulat, D. Aerodynamic Prediction for Flight Dynamics Simulation of Parafoil System and Airdrop Test Validation. Nonlinear Dyn. 2023, 111, 11065–11085. [Google Scholar] [CrossRef]
  2. Zheng, Y.; Tao, J.; Sun, Q.; Sun, H.; Chen, Z.; Sun, M.; Xie, G. Sideslip Angle Estimation Based Active Disturbance Rejection 3D Trajectory Tracking Control for Powered Parafoil System and Hardware-in-the-Loop Simulation Verification. Aerosp. Sci. Technol. 2023, 141, 108497. [Google Scholar] [CrossRef]
  3. Toni, R. Theory on the Dynamics of Bag Strip for a Parachute Deployment Aidedby a Pilot Chute. In Proceedings of the 2nd Aerodynamic Deceleration Systems Conference, El Centro, CA, USA, 23 September 1968. [Google Scholar]
  4. McVey, D.F.; Wolf, D.F. Analysis of Deployment and Inflation of Large Ribbon Parachutes. J. Aircr. 1974, 11, 96–103. [Google Scholar] [CrossRef]
  5. Wolf, D. A Simplified Dynamic Model of Parachute Inflation. J. Aircr. 1974, 11, 28–33. [Google Scholar] [CrossRef]
  6. French, K. A First-Order Theory for the Effects of Line Ties on Parachute Deployment. In Proceedings of the 6th Aerodynamic Decelerator and Balloon Technology Conference, Houston, TX, USA, 5 March 1979. [Google Scholar]
  7. Purvis, J. Prediction of Parachute Line Sail during Lines-First Deployment. J. Aircr. 1983, 20, 940–945. [Google Scholar] [CrossRef]
  8. Purvis, J. Prediction of Line Sail during Lines-First Deployment. In Proceedings of the 21st Aerospace Sciences Meeting, Reno, NV, USA, 10 January 1983. [Google Scholar]
  9. Purvis, J. Numerical Prediction of Deployment, Initial Fill, and Inflation of Parachute Canopies. In Proceedings of the 8th Aerodynamic Decelerator and Balloon Technology Conference, Hyannis, MA, USA, 2 April 1984. [Google Scholar]
  10. Wang, H.; Qin, Z.; Song, X.; Tao, W. Analysis of the Phenomenon of Bull Whipping in the Deployment Process of Large Parachute. J. Natl. Univ. Def. Technol. 2025, 5, 34–38. [Google Scholar]
  11. Din, D.; Cheng, W. Validation of Large Parachute’s Dynamic Continuous Models for Linesail and Bullwhip. Spacecr. Recovery Remote Sens. 2010, 31, 22–26. [Google Scholar]
  12. White, F.M.; Wolf, D.F. A Theory of Three-Dimensional Parachute Dynamic Stability. J. Aircr. 1968, 5, 86–92. [Google Scholar] [CrossRef]
  13. Wolf, D.F.; Spahr, H.R. Parachute Cluster Dynamic Analysis. J. Aircr. 1977, 14, 321–322. [Google Scholar] [CrossRef]
  14. Wolf, D. Dynamic Stability of a Nonrigid Parachute and Payload System. J. Aircr. 1971, 8, 603–609. [Google Scholar] [CrossRef]
  15. Cockrell, D.; Haidar, N. Influence of the Canopy-Payload Coupling on the Dynamic Stability Inpitch of a Parachute System. In Proceedings of the Aerospace Design Conference, Irvine, CA, USA, 16 February 1993. [Google Scholar]
  16. Graham, W.R.; Moss, B.R. Comment on “A Theory of Three-Dimensional Parachute Dynamic Stability”. J. Aircr. 2017, 54, 853. [Google Scholar] [CrossRef]
  17. Tang, Q.; Wang, Y.; Zhang, Q.; Zhang, X.; YANG, T. Application of Dynamics and Kinematics of Parachute-Bomb System in Target Identification for a Target Sensitive Projectile | Request PDF. Acta Armamentarii 2007, 28, 796–799. [Google Scholar]
  18. Ginn, J.M.; Clark, I.G.; Braun, R.D. Parachute Dynamic Stability and the Effects of Apparent Inertia. In Proceedings of the AIAA Atmospheric Flight Mechanics Conference, Atlanta, GA, USA, 16 June 2014. [Google Scholar]
  19. Ray, E. A Symmetric Time-Varying Cluster Rate of Descent Model. In Proceedings of the 23rd AIAA Aerodynamic Decelerator Systems Technology Conference, Daytona Beach, FL, USA, 30 March 2015. [Google Scholar]
  20. Machin, R.; Ray, E. Pendulum Motion in Main Parachute Clusters. In Proceedings of the 23rd AIAA Aerodynamic Decelerator Systems Technology Conference, Daytona Beach, FL, USA, 30 March 2015. [Google Scholar]
  21. Ray, E.; Janssen, S.A. Orion Main Parachute Asymmetry Testing Revisited. In Proceedings of the 26th AIAA Aerodynamic Decelerator Systems Technology Conference, Toulouse, France, 16 May 2022. [Google Scholar]
  22. Edwards, T.; Loya, A.; Stickley, I.; Yechout, T. Stability Characterization of the Orion Parachute System during Final Re-Entry Phase. In Proceedings of the 2024 Regional Student Conferences, Region V-Mid-West, St. Louis, MI, USA, 5–6 April 2024. [Google Scholar]
  23. Pei, J. Nonlinear Analysis of a Two-Parachute System Undergoing Pendulum Motion. In Proceedings of the AIAA Aviation 2019 Forum, Dallas, TX, USA, 17 June 2019. [Google Scholar]
  24. Zhang, G.; Zou, W.; Zhang, Q.; Feng, Z.; Zhang, M.; Yang, T. Stability Analysis of the Parachute System with a Data-Driven Approach. J. Guid. Control Dyn. 2023, 46, 127–140. [Google Scholar] [CrossRef]
  25. Huang, X.; Xu, C.; Guo, M.; Li, M.; Hu, J.; Wang, X.; Zhao, Y.; Liu, W. Tianwen-1 Entry, Descent, and Landing Guidance, Navigation, and Control System Design and Validation. J. Spacecr. Rocket. 2023, 60, 1983–2002. [Google Scholar] [CrossRef]
  26. Goodrick, T. Comparison of Simulation and Experimental Data for a Gliding Parachute in Dynamic Flight. In Proceedings of the 7th Aerodynamic Decelerator and Balloon Technology Conference, San Diego, CA, USA, 21 October 1981. [Google Scholar]
  27. Slegers, N.; Costello, M. Aspects of Control for a Parafoil and Payload System. J. Guid. Control Dyn. 2003, 26, 898–905. [Google Scholar] [CrossRef]
  28. Toglia, C.; Vendittelli, M. Modeling and Motion Analysis of Autonomous Paragliders. Department of Computer and System Sciences Antonio Ruberti Technical Reports, 2, 2010. Available online: https://rosa.uniroma1.it/rosa00/index.php/dis_technical_reports/article/view/8850 (accessed on 3 March 2010).
  29. Vishniak, A. Simulation of the Payload-Parachute-Wing System Flight Dynamics. In Proceedings of the Aerospace Design Conference, Irvine, CA, USA, 16 February 1993. [Google Scholar]
  30. Yang, H.; He, W. Modeling and Simulation of 15-DOF Parafoil Dynmics. Spacecr. Recovery Remote Sens. 2018, 39, 45–52. [Google Scholar]
  31. Zhang, Q.; Gao, F.; Guo, R.; Feng, Z.; Ge, J. Multibody Dynamics Modeling of Powered Parafoil System Using Equations with Quasi-Coordinates. Acta Armamentarii 2019, 40, 1935–1942. [Google Scholar]
  32. Cui, Z.; Zou, W.; Feng, Z.; Zhang, Q.; Yang, T. Sparse Identification of Parafoil Dynamics Model for Path Planning. Aeronaut. J. 2025, 1–21. [Google Scholar] [CrossRef]
  33. Chang, H. GSWorld: Closed-Loop Photo-Realistic Simulation Suite for Robotic Manipulation. Master’s Thesis, University of California, Los Angeles, CA, USA, 2025. [Google Scholar]
  34. Deng, J.; Gong, M.; Du, Z.; Zhou, Z.; Chen, H.; Xiao, W.; Guan, C. Design and Implementation of Immersive Interactive Simulation System for Ship Engine Room. Chin. J. Ship Res. 2023, 18, 31–39. [Google Scholar] [CrossRef]
  35. Han, P.; Wang, Z.; Nan, G.; Xie, Y.; Li, J.; Zhang, Z. Small Disturbance Modeling and Stability Analysis of Doubly-Fed Wind Power System Considering Synchronization Mechanism. Electr. Power Autom. Equip. 2023, 43, 47–54. [Google Scholar]
  36. Huang, S.; Lu, Y.; Zhu, Q.; Li, K.; Shi, J. Cooperative Circumnavigating of Unknown Target by Multi-UAV Using Only Distance Measurements. Acta Aeronaut. Astronaut. Sin. 2024, 45, 341–361. [Google Scholar] [CrossRef]
  37. Liu, C.; Kou, G.; Zhou, X.; Peng, Y.; Sheng, H.; Alsaadi, F.E. Time-Dependent Vehicle Routing Problem with Time Windows of City Logistics with a Congestion Avoidance Approach. Knowl. Based Syst. 2020, 188, 104813. [Google Scholar] [CrossRef]
  38. Yang, Y.; Wu, Y.; Hou, M.; Luo, J.; Xie, X. Solving Emden–Fowler Equations Using Improved Extreme Learning Machine Algorithm Based on Block Legendre Basis Neural Network. Neural Process. Lett. 2023, 55, 7135–7154. [Google Scholar] [CrossRef]
  39. Chen, X.; Xu, G.; Xu, X.; Jiang, H.; Tian, Z.; Ma, T. Multicenter Hierarchical Federated Learning with Fault-Tolerance Mechanisms for Resilient Edge Computing Networks. IEEE Trans. Neural Netw. Learn. Syst. 2025, 36, 47–61. [Google Scholar] [CrossRef] [PubMed]
  40. Ouyang, Y.; Liu, W.; Yang, Q.; Mao, X.; Li, F. Trust Based Task Offloading Scheme in UAV-Enhanced Edge Computing Network. Peer-Peer Netw. Appl. 2021, 14, 3268–3290. [Google Scholar] [CrossRef]
  41. Dong, L.; Liu, Z.; Jiang, F.; Wang, K. Joint Optimization of Deployment and Trajectory in UAV and IRS-Assisted IoT Data Collection System. IEEE Internet Things J. 2022, 9, 21583–21593. [Google Scholar] [CrossRef]
  42. Liu, J.; Zhang, X. Truthful Resource Trading for Dependent Task Offloading in Heterogeneous Edge Computing. Future Gener. Comput. Syst. 2022, 133, 228–239. [Google Scholar] [CrossRef]
  43. Jiang, F.; Peng, Y.; Wang, K.; Dong, L.; Yang, K. MARS: A DRL-Based Multi-Task Resource Scheduling Framework for UAV with IRS-Assisted Mobile Edge Computing System. IEEE Trans. Cloud Comput. 2023, 11, 3700–3712. [Google Scholar] [CrossRef]
  44. Zhou, X.; Liang, W.; Yan, K.; Li, W.; Wang, K.I.-K.; Ma, J.; Jin, Q. Edge-Enabled Two-Stage Scheduling Based on Deep Reinforcement Learning for Internet of Everything. IEEE Internet Things J. 2023, 10, 3295–3304. [Google Scholar] [CrossRef]
  45. Jiang, F.; Wang, K.; Dong, L.; Pan, C.; Yang, K. Stacked Autoencoder-Based Deep Reinforcement Learning for Online Resource Scheduling in Large-Scale MEC Networks. IEEE Internet Things J. 2020, 7, 9278–9290. [Google Scholar] [CrossRef]
  46. Zhou, X.; Zheng, X.; Cui, X.; Shi, J.; Liang, W.; Yan, Z.; Yang, L.T.; Shimizu, S.; Wang, K.I.-K. Digital Twin Enhanced Federated Reinforcement Learning with Lightweight Knowledge Distillation in Mobile Networks. IEEE J. Sel. Areas Commun. 2023, 41, 3191–3211. [Google Scholar] [CrossRef]
  47. Cui, Y.; Hu, D.; Chen, X.; Xu, X.; Xu, Z. Capital Equilibrium Strategy for Uncertain Multi-Model Systems. Inf. Sci. 2024, 653, 119607. [Google Scholar] [CrossRef]
  48. Zhou, X.; Tian, J.; Wang, Z.; Yang, C.; Huang, T.; Xu, X. Nonlinear Bilevel Programming Approach for Decentralized Supply Chain Using a Hybrid State Transition Algorithm. Knowl. Based Syst. 2022, 240, 108119. [Google Scholar] [CrossRef]
  49. Zou, W. Multibody Dynamics Modeling of Parachute and Payload System and Homing Method Based on Data-Driven Approach. Ph.D. Thesis, National University of Defense Technology, Changsha, China, 2024. [Google Scholar]
  50. Desai, P.N.; Prince, J.L.; Queen, E.M.; Schoenenberger, M.M.; Cruz, J.R.; Grover, M.R. Entry, Descent, and Landing Performance of the Mars Phoenix Lander. J. Spacecr. Rocket. 2011, 48, 798–808. [Google Scholar] [CrossRef]
  51. Guo, P. Research on the Opening Process of Large Parachute System. Ph.D. Thesis, National University of Defense Technology, Changsha, China, 2012. [Google Scholar]
  52. Zou, W.; Cui, Z.; Li, G.; Feng, Z.; Wang, Z.; Gao, Q.; Zhang, Q.; Yang, T. Reentry Capsule Reachable Tube Boundary Prediction via Evolutionary Multiobjective Optimization. Int. J. Aerosp. Eng. 2024, 2024, 2311998. [Google Scholar] [CrossRef]
Figure 1. The overall composition of Precision Aerial Delivery Systems.
Electronics 14 04285 g001
Figure 2. The multibody dynamics model of the parachute opening process.
Electronics 14 04285 g002
Figure 3. The main deceleration parachute’s canopy profile changes when inflated (The magenta part is the parachute pack, and the cyan lines represent the parachute cords).
Electronics 14 04285 g003
Figure 4. Finite-mass inflatable drag area variation curve.
Electronics 14 04285 g004
Figure 5. Infinite-mass inflatable drag area variation curve.
Electronics 14 04285 g005
Figure 6. Parafoil Hardware-in-the-Loop (HIL) simulation system architecture diagram.
Electronics 14 04285 g006
Figure 8. Cargo platform acceleration during main deceleration parachute operation.
Electronics 14 04285 g008
Figure 9. Diagram of the motion state of the parachute system during deployment.
Electronics 14 04285 g009
Figure 10. Trajectory of cargo platform during airdrop.
Electronics 14 04285 g010
Figure 11. Resultant velocity of cargo platform during airdrop.
Electronics 14 04285 g011
Figure 12. Comparison between HIL simulation data and airdrop test data.
Electronics 14 04285 g012
Figure 13. Real-time monitoring diagram of parameters for tested equipment.
Electronics 14 04285 g013
Table 1. System composition and functions.
ComponentElementsFunction
Unit Under Test (UUT)
  • Master Control Computer
  • INS Module
  • Drive Control Unit
  • Motor Actuators
Physical hardware embedded in the simulation loop for performance validation
Dynamic Models
  • Object–Parachute Dynamics Model
Real-time emulation of airdrop physics (deceleration/gliding/landing)
Emulators
  • GNSS Signal Emulator
  • Communication Radio Emulator
  • Load Simulator
Interface fidelity preservation and
environmental simulation:
GNSS Emulator:
Receives kinematic parameters from dynamics model
Processes data with navigation error/fault injection
Outputs via authentic electrical interfaces
Radio Emulator:
Bridges ground commands to airborne systems
Maintains hardware protocol compliance
Load Simulator:
Replicates aerodynamic loads on control lines
Enables realistic actuator testing
Simulators
  • Real-Time Computing Platform
  • Visualization Engine
Execute models and render outputs
Disclaimer/Publisher’s Note: The statements, opinions and data contained in all publications are solely those of the individual author(s) and contributor(s) and not of MDPI and/or the editor(s). MDPI and/or the editor(s) disclaim responsibility for any injury to people or property resulting from any ideas, methods, instructions or products referred to in the content.