Abstract
With the continuous increase in power capacity of spacecraft radio frequency payloads, low-pressure discharge effects have become a significant factor threatening the safe operation of spacecraft payloads. Clarifying the low-pressure discharge effects and their plasma evolution mechanisms is of great importance for elucidating the underlying discharge processes and proposing effective preventive measures. Based on the characteristics of the actual operating environment of spacecraft microwave payloads, this paper proposes a global simulation model for low-pressure discharge plasma in humid air. The validity of the model was verified through online diagnostic experiments on low-pressure discharge plasma. Using the constructed global plasma model, the influence of key parameters such as pressure and humidity on electron and ion densities in the plasma was investigated, revealing the impact mechanisms of initial discharge conditions on plasma characteristics. The potential hazards of these factors to spacecraft microwave payloads were also discussed. This model provides a foundation for improving the accurate prediction of key parameters in low-pressure discharge.
1. Introduction
The low-pressure discharge effect easily occurs in aerospace microwave components, as the narrow gap structure within the microwave components and the continuous injection of microwave power during the working process provide the necessary conditions for the occurrence of discharge. The plasma generated by the low-pressure discharge can block the signal transmission and, more seriously, cause damage to the materials of microwave components. Therefore, the low-pressure discharge effect on aerospace microwave components has been widely studied in recent years [1,2,3,4,5]. Current plasma simulation models constructed for low-pressure RF discharge effects on aerospace microwave components rarely model complex gas compositions as the working gases because complex gas compositions dramatically increase the abundance of species as well as the complexity of the plasma chemical reaction network, which significantly increases the computational capacity and reduces the convergence of the simulation program [6,7,8]. However, the gas composition determines the nature of the low-pressure discharge plasma and the characteristic parameters of the discharge, such as the gas gap breakdown threshold, plasma temperature, electron density, and temperature [9,10]. Dry air composed of N2 and O2 is the main component of the Earth’s atmosphere, and it is also the main component of the residual gas inside the microwave components of spacecraft after launching into orbit [11]. However, in addition to N2 and O2, the Earth’s atmosphere also contains abundant water vapor, and the electronegative molecule H2O has good affinity with the metal materials and most of the dielectric materials in the microwave components, so it is also the main impurity of the desorption gas of the component materials [12]. The discharge plasma model is constructed by using an “air (N2 + O2) + H2O” gas mixture as the work gas, which can fit the gas environment of the low-pressure discharge effect of the aerospace microwave components very well.
A global model is an efficient simulation model for plasma reaction kinetic processes [13,14,15]. Inside the plasma, a global model adopts the assumption of spatial normalization, which ignores the diffusion and migration of particles in the space, as well as spatial structures such as the sheath layer and the orthoclastic region; i.e., it is considered that any point in the space has the same concentration and energy distribution of particles, and only the chemical reaction is considered, thus greatly simplifying the calculation capacity [16,17]. Global models have become ideal models for studying the kinetic process of discharge reaction due to their advantages of covering many reactions and fast calculation speed, and have been widely used [18]. At present, the most commonly used global model in the international arena is mainly used for steady-state calculations for RF-driven plasmas. For the discharge process driven by a high-frequency electric field in the microwave band, the global model has strong applicability [19,20].
In this paper, a multi-parameter adjustable “air + H2O” discharge plasma global model is constructed for the low-pressure discharge effect of aerospace microwave components, and the effect of humidity on the discharge characteristics is investigated. At the same time, a diagnostic platform of low-pressure discharge plasma emission spectra is built to obtain the emission spectra of the discharge plasma in the cavity resonator and verify the validity of the constructed plasma model.
2. Model
Figure 1 shows the schematic structure of the “Air + H2O” plasma global model. Without loss of generality, the electrode structure is a pair of parallel circular metal electrodes with an adjustable radius r of the electrode plates as well as an adjustable size of the gas gap h. The input power is an RF signal in the microwave band, and the input power is adjustable in size from 1 W to 100 W. Discharge is carried out at room temperature, 300 K. The gap gas composition is a mixture of air and H2O, and the composition of the dry air is set to 79% N2 and 21% O2. The relative humidity of the gas mixture is adjustable in the range of 0.1% to 100%. At 300 K, humid air with 30% relative humidity corresponds to an absolute doping concentration of 1% H2O. The selection of these parameters is the result of a comprehensive consideration: in order to maintain the diffusivity of the plasma, it is preferable to use a round electrode plate, which reduces the abrupt changes caused by the corners. The radius of the electrode plate is generally in the range of 0.5~2 cm, which is too small to affect the radial uniformity and too large to be easily verified experimentally for the simulation model under the existing conditions. The electrode gap is generally 0.5~10 mm, which is in line with the actual size of the gap within the microwave components commonly used in spacecraft. The power setting also needs to be within a certain range; if the power is too low, the discharge will be difficult to excite, and if the power is too high, it may exceed the available experimental setup. The air temperature is generally set at room temperature, about 300 K. This temperature parameter also matches the actual conditions of ground discharge testing of spacecraft microwave components.
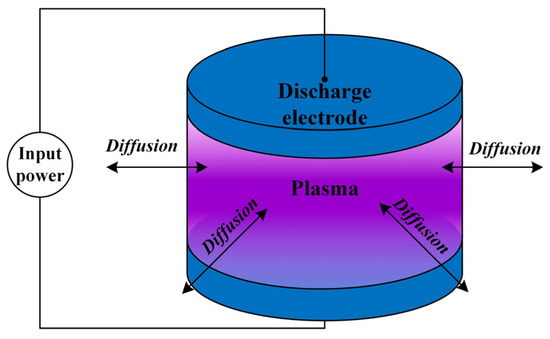
Figure 1.
Schematic structure of the “Air + H2O” plasma global model.
The species and chemical reactions considered in existing simulation models of air discharges are already relatively well-developed, among which the filamentary discharge model constructed by Sakiyama et al. at the University of California, Berkeley, has a high degree of recognition [21]. For the low-pressure “air + H2O” plasma studied in this paper, some of the three-body reactions and some of the species generated by them have been simplified on the basis of the model constructed in reference [22] to be close to the actual situation. This is due to the high density of gas molecules under atmospheric-pressure conditions, where the three molecules required for the three-body reaction have a significant probability of colliding simultaneously and causing the reaction to occur. However, under low-pressure conditions, the molecular density is small, and thus, the probability of three gas molecules colliding at the same time is negligible, and if too many three-body reactions are considered instead, the convergence of the program is reduced. This model finally synthesizes 49 kinds of species. The species considered in the global model contain electrons, positive ions, negative ions, excited-state species, and ground-state species, as shown in Table 1.

Table 1.
The species considered in the global model.
Generally, neutral species diffuse toward the boundary of the plasma during the discharge. Therefore, an important parameter in the model is the diffusion coefficient of various neutral species in air. In this paper, the formula with the Leonard–Jones parameter is used to calculate the diffusion coefficients of various neutral species:
where kb is the Boltzmann constant, Tgas is the gas temperature, ptot is the gas pressure, μij is the approximate mass, calculated using Equation (2), σij is the two-body collision parameter, calculated using Equation (3), and ΩD is the dimensionless diffusion integral, calculated using Equation (6), as a function of Ψ, which is the dimensionless temperature.
where A, B, C, D, E, F, G, and H are constants obtained from the literature [23] and σ(Å) and ε(K) are the Leonard–Jones coefficients, which are generally obtained by consulting the literature [24], and the diffusion coefficients of the neutral particles can be obtained through Equation (1).
The air + H2O plasma model in this paper contains a total of 689 space chemistry reactions covering the major physicochemical processes, including electron collisional ionization, decomposition, excitation, attachment, and complexation, charge transfer reactions, positive–negative ion complexation, Penning’s ionization, collisional bursting of excited-state particles, and reactions between neutral particles.
In addition to spatial reactions, on the surface of the electrode, various particles also interact with each other in surface chemical reactions. For example, positive ions obtain electrons to become neutral particles, excited-state particles collide with the electrode to reduce to ground-state particles, and neutral particles collide to synthesize molecules. The surface chemical reactions and reaction possibilities considered in the model are listed in Table 2.
Table 2.
The surface chemical reactions and reaction possibilities considered in the model.
For the air + H2O discharge plasma distribution region, a large number of chemical reactions occur, and accurately obtaining their reaction rate coefficients is an important part of solving the global model. For most of the reactions, the reaction rate coefficients are generally obtained from the experiments in the literature. There are also some reactions that can be estimated empirically [28,29]. For electron-related reactions, their electron collision cross sections can be obtained by referring to their electron collision cross sections in the literature or open-source databases [30] and then solving to obtain the corresponding reaction rate coefficients. In this paper, the electron energy distribution formula (EEDF) of the plasma is set according to the Maxwell distribution because under low-pressure discharge conditions, the electron energy conforms to the Maxwell distribution. For this paper, BOLSIG+ software (Version 12/2019)was employed to calculate the EEDF [31]. The table of electron collision reaction coefficients was obtained during the calculation process; these reaction coefficients and the corresponding electron temperatures are discrete values, so it was necessary to interpolate the algorithm to obtain the actual values needed. In the calculation process, the gas composition is constantly changing, so the EEDF and the reaction coefficients are also constantly changing. For this paper, we used BOLSIG+ software with the program BOLSIG- to calculate the new EEDF and the reaction coefficients at each time step of the simulation and automatically couple them into the model, so as to obtain more accurate simulation results.
The calculation of the global model of the plasma requires coupling the mass conservation equation and the energy conservation equation to solve for various physical quantities inside the plasma (particle density, energy consumption, electron temperature, etc.). The mass conservation equation is shown in Equation (7):
where nk denotes the number density/m−3 of the kth particle; the four terms on the right side of the equation denote, in order, the rate of generation of the kth particle due to reaction inside the plasma (NR), the rate of generation and removal at the electrode surface (NS), the rate of loss or gain by diffusion at the side boundaries of the plasma (ND), and the rate of change in the concentration of the particles at the side boundaries of the plasma due to air blowing loss or gain (NF).
The energy conservation equation is shown in Equation (8):
where We represents the total energy change of electrons per unit volume of plasma per unit time (in W), which is equal to the input power density (Pin) minus the power density lost by electrons colliding with heavy particles (PC), the power density lost by electrons colliding with the electrodes (PE), and the power density gained by positive ions crossing the sheath (PS).
As mentioned earlier, charged particles undergo boundary reactions at the electrode boundaries. For positive ions, the flux of positive ions in the sheath layer is generally estimated using the Bohm rate, which is shown in Equation (9):
where mi+ is the mass density of particle i/kg·m−3.
For negative ions, since the drift velocity of electrons is much larger than that of negative ions with the same electrical properties, it is assumed that the flux of negative ions at electrode boundaries Γi− = 0. Since the plasma maintains macroscopic electroneutrality, the flux of electrons at the electrode boundaries can be expressed as the sum of the flux of positive ions:
For neutral particles in the plasma, where the more reactive particles such as H, O, OH, and various excited-state neutral particles will undergo boundary reactions when they reach the electrode boundaries, these particles will be changed from the excited state to the ground state or synthesized into molecules at the electrode boundaries, and their fluxes at the electrode boundaries are calculated using Equation (11) [32]:
where Dk is the diffusion coefficient of the kth particle/m2·s−1, g is the air gap length/m, vk is the average thermal motion rate of neutral particle k/m·s−1, and the average thermal motion rate of the neutral particle is shown in Equation (13):
where Tg is the gas temperature/K.
At the side boundary of the plasma, the outside air will diffuse into the inside of the plasma due to the concentration difference, and the neutral particles generated inside will diffuse freely to the outside. In this paper, the air outside the plasma is mainly considered as N2, O2, and H2O, and Equation (14) is used to calculate the fluxes of these three kinds of particles at the side boundary:
where nk is the concentration of N2, O2, and H2O in the plasma/m−3, nk,ext is the concentration of N2, O2, and H2O in the external background gas/m−3, and R is the radius/m of the plasma.
A large number of neutral particles are generated inside the plasma, and these particles will diffuse outward through the plasma side boundaries. Most of the existing global models ignore the boundary fluxes of the neutral particles, and a small number of them use the average density of one kind of particles multiplied by one-fourth of the average thermal motion rate of the neutral particles to carry out the calculation of the fluxes of this kind of particles at the boundary, as shown in Equation (15):
where nk is the number density/m−3 of the kth neutral particle in the plasma.
The simulation was mainly performed using the COMSOL 5.5 chemical reaction engineering module. Firstly, the program set parameters such as electrode structure (electrode radius and air gap distance), air doping ratio, input power, temperature, and so on as the externally applied conditions of the discharge. Then, the initialization of the simulation program was carried out by setting a small initial value of 1 × 10⁶ m−3 for the particle density and setting the electron temperature to 2 eV.
Under microwave-excited discharge conditions, the input power can be considered as a constant value. The associative mass and energy conservation partial differential equations can be solved directly, and the electron collision reaction coefficients need to be used in the solution process; they are calculated by BOLSIG- software (Version 12/2019) according to the gas composition as well as the collision cross-section data, and they can be updated automatically in the process of simulation continuously. Through repeated iterations, when the densities of various particles are basically unchanged (the maximum change in particle density is less than 1‰ in one calculation step), the solution in the quasi-steady state is obtained.
The plasma boundary and sheath effect have a significant influence on particle transport and energy exchange processes at the plasma boundary. In this work, the Bohm velocity is used to calculate the loss of positive ions at the boundary (see Equation (9)), and the energy balance equation also accounts for the energy exchange induced by the sheath (see the PS term in Equation (8)). Of course, the trade-off of this approach is its inability to provide any detailed information about the sheath interior (such as the Ion Energy Distribution Function, IEDF). To obtain such information, more complex sheath models or kinetic simulations are still required. This study is primarily concerned with the plasma reaction kinetics within the discharge gap. Consequently, the simplified treatment of plasma boundary and sheath effects is appropriate and valid given the research scope.
3. Experimental Setup
In order to verify the validity of the simulation model, a microwave cavity resonator was designed in this paper, and the gap structure of the cavity resonator was the same as the gas gap structure of the simulation model, being a parallel circular flat plate electrode structure. The detailed structural parameters of the microwave cavity resonator can be seen in reference [11]. Briefly, by designing the resonance parameters of the cavity resonator, this paper constructed a discharge gap with an electrode diameter of 4 mm and a gap length of 4 mm, thus realizing the fitting of the simulation model structure. In order to realize the direct observation of the plasma in the discharge gap, a 3.2 mm diameter probe hole was made in the resonator cavity wall facing the gas gap to place the fiber-optic probe. The fiber-optic probe, model CF100 (Xinray, Shenzhen, China), with an outer diameter of 3.15 mm, was inserted into the hole in the resonator wall and fixed, with the top of the fiber-optic probe not exceeding the plane of the inner wall of the resonator cavity to avoid the influence of the fiber-optic probe on the discharge channel, which was then centered in the discharge gap.
In order to carry out online diagnosis of the discharge characteristics, a low-pressure discharge plasma spectroscopy diagnostic platform was built in this paper, and the detailed information of this platform can be seen in reference [11]. The vacuum chamber was made of stainless steel with a diameter of 25 cm and a height of 30 cm. The gas pressure was regulated by a set of mechanical pumps and molecular pumps to achieve a high-vacuum environment with a minimum gas pressure of 10−5 Pa. The gas pressure was monitored by a Pirani vacuum gauge. The continuous wave signal generated by the signal generator was fed to a power amplifier with a small signal gain of about 49 dB and a saturated output power of 100 W. The amplified signal was transmitted via a circulator and a two-way coupler to a cavity resonator inside the vacuum cavity and finally absorbed by a high-power matched load. A circulator was used to protect the measurement system from the reflected power of the plasma formed after the discharge had occurred. The power entering and reflected from the cavity was received by a 30 dB directional coupler and measured by a power meter. Adapter losses between the coaxial cable and the components were calibrated after the measurement.
A two-channel spectrometer (MX2500-2PLUS, Ocean Optics, Orlando, FL, USA) was used to diagnose the emission spectra of the discharge plasma. The spectral measurement range of channel 1 of the spectrometer was 200–400 nm with a resolution of 0.22 nm, and the measurement range of channel 2 was 400–840 nm with a resolution of 0.32 nm. A vacuum fiber-optic feed-through flange was mounted on the vacuum chamber to realize the transmission of spectral signals captured in the course of the experiment from the vacuum side to the atmosphere side. The fiber-optic flange was sealed by vacuum adhesive and other processes, and the air leakage rate met 10–8 Pa-L/s. In order to obtain the emission spectra of the discharge plasma at the same point, the first channel of the spectrometer was used to acquire the spectral data of the 200 nm–400 nm band, and then the second channel of the spectrometer was used to acquire the emission spectra of the 400–840 nm band in the measurement process, and the two were combined to form a complete spectrum in the post-processing of data. The spectral signals were acquired and visualized by the accompanying Oceanview software (2.0 Version). The integration time of the spectra was set to 100 ms to improve the signal-to-noise ratio.
After each test, the input power was turned off, the vacuum chamber inlet valve was opened, and the air pressure inside the chamber was restored to standard atmospheric pressure. After the resonance chamber cooled down for three minutes, the vacuum chamber inlet valve was closed, and then the vacuum pump was turned on to pump the vacuum chamber air pressure to the target pressure and carry out the next discharge experiment. The spectral signal appeared as the signal of the discharge, and the spectral data were read after the spectra were stabilized. The maintenance time of each discharge was about 10 s. The discharge was then measured by the vacuum pump.
4. Results
4.1. Verification of the Model Validation
In this paper, the emission spectroscopy method is utilized to detect the particle concentration in the discharge plasma, and the validity of the calculation results of the simulation model is verified by comparing the experimental detection results with the simulation calculation results under the same conditions. Generally speaking, this method requires the use of emission spectroscopy to obtain the emission intensity of certain excited particles in the plasma and then directly compare it with the simulation results. However, the emission intensity of excited particles measured by emission spectroscopy is related to parameters such as probe diameter, optical gain, integration time, etc., and it is impossible to obtain the absolute density of excited particles directly. Therefore, it is more reasonable to obtain the trends of the simulation results and the experimental detection results of the particle concentration under different parameter conditions, so as to verify the validity of the simulation model. Based on the low-pressure discharge plasma spectroscopy diagnostic platform constructed in this paper, the trend of the concentration change of excited-state particles in the discharge plasma under different air pressure conditions is detected and compared with the calculation results of the simulation model under the same parameter conditions.
The difference between low-pressure discharge and atmospheric-pressure or high-pressure discharge is that the density of gas molecules under low-pressure conditions is small, and the probability of collision between electrons and molecules and between molecules and molecules is positively correlated with the gas pressure. Therefore, under very-low-pressure conditions (generally below tens of Pa), the density of gas molecules is extremely low, and the reaction between particles is dominated by the two-body reaction, i.e., the reaction that occurs after the collision of two particles. With the increase in air pressure, the probability of three particles colliding at the same time increases, and the three-body reaction will be included in the discharge reaction system. The three-body reaction will introduce not only some particle generation pathways, but also some particle consumption pathways. At the same time, as the air pressure increases, the probability of collision of electrons under electric field acceleration (i.e., the electron free range) in one RF half-cycle decreases, and therefore the average electron energy decreases. These factors act synergistically to cause the density of some particles after discharge to increase not monotonically with increasing air pressure, but to show a density inflection point with increasing air pressure. This phenomenon has been found in several studies. In this paper, the validity of the constructed global model of air + H2O low-pressure RF discharge plasma will be verified by using the density inflection point of particles as a criterion.
The concentration of excited-state particles in the plasma was examined using the constructed diagnostic platform for low-pressure discharge plasma emission spectroscopy. The experimental conditions are as follows: gap distance of 4 mm, electrode radius of 4 mm, gas of air with 20% relative humidity, input power of 10 W, and RF signal frequency of 2.6 GHz. The normalized emission spectral intensities of excited-state O atoms and OH are shown in Figure 2. It can be seen that the emission intensity of these two particles shows a trend of increasing and then decreasing with the increase in air pressure, where the highest emission intensity of the O atom is at an air pressure of 600 Pa, and that of OH is at 500 Pa. This result indicates that the density inflection points of these two particles are 600 Pa and 500 Pa, respectively.
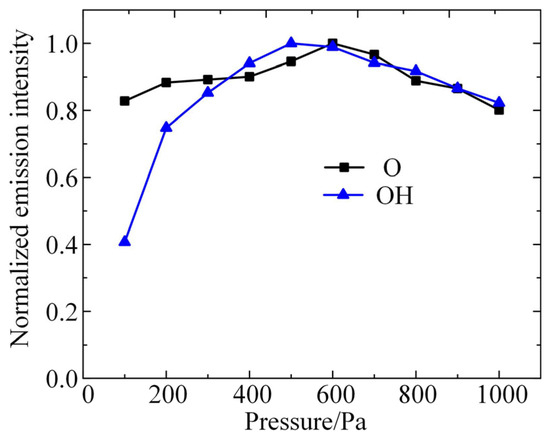
Figure 2.
The normalized emission spectral intensities of excited-state O atoms and OH detected by experiments.
According to the conditions in the experiment, after inputting the same parameters for the plasma global model constructed in this paper, the densities of O and OH in the plasma under different air-pressure conditions are calculated, and the results are shown in Figure 3a,b. As shown in the figures, the densities of these two kinds of particles obtained from the model calculations all show a trend of first increasing and then decreasing with the increase in air pressure. The density inflection point of O atoms corresponds to the air pressure of 250 Pa, and the density inflection point of OH corresponds to the air pressure of 800 Pa. A comparison with the experimental results in Figure 3 reveals that the trends of the particle densities calculated by the simulation model with the increase in air pressure are in high agreement with the experimental results, and the corresponding air pressures of the density inflection points are in the same order of magnitude. This result verifies the validity of the simulation model constructed in this paper.
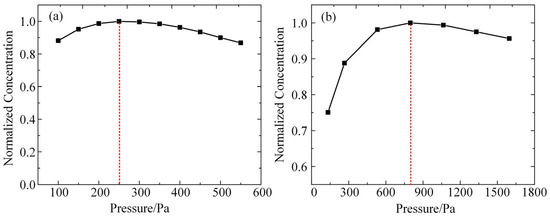
Figure 3.
Simulation modeling of the pattern of change in the density of particles obtained with increasing air pressure: (a) O atoms; (b) OH.
4.2. Effect of Gas Pressure on Electron Density and Temperature
When the relative humidity is 20% (corresponding to the air moisture content of 0.66%), the trends of electron density and electron mean temperature in the air + H2O discharge plasma with gas pressure are shown in Figure 4. It is shown that the electron density decreases with the increase in gas pressure in the range from 0.1 Torr to 1 Torr. The electron density decreases substantially in the initial stage, and the rate of density decrease decreases with the increase in gas pressure. The energy input in the discharge gap is consumed through reaction pathways such as collisional ionization, decomposition, and excitation in the plasma. Under conditions of constant input energy, as the gas molecules become less dense, reactions need to occur more frequently to consume the input energy. Thus, when the air pressure is lower, the discharge plasma has a higher ionization rate and a higher electron density for the same discharge power. From a microscopic point of view, lower air pressure also means a longer electron free range; i.e., the probability of an electron encountering a gas molecule in the accelerated phase and surrendering its kinetic energy is also smaller. Thus, at lower air pressure, electrons have higher kinetic energy; i.e., they exhibit higher temperatures. Thus, the average electron temperature in Figure 4 also decreases with increasing air pressure. Although the mean electron free range is linearly related to air pressure, the rate of the ionization reaction is not linearly related to the magnitude of the electron energy.
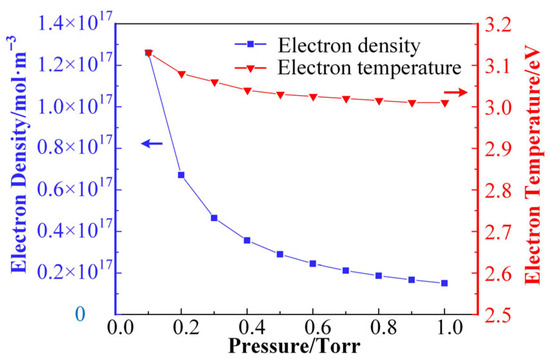
Figure 4.
The trends of electron density and electron mean temperature in the air + H2O discharge plasma with gas pressure.
4.3. Effect of Humidity on Plasma Properties
As mentioned in the previous section, the doping of H2O has a significant effect on the reaction kinetics of the plasma. Therefore, the effect of H2O doping on the kinetic properties of the discharge plasma reaction is simulated based on the constructed global model. In this model, the discharge power is fixed at 10 W/cm3, and the air pressure is fixed at 0.1 Torr. In this model, the doping amount of H2O is expressed in terms of relative humidity, which ranges from 20% to 100%, and the corresponding absolute doping concentration of H2O ranges from 0.66% to 3.3% at the temperature of 300 K.
Figure 5 shows the trends of electron density and average electron temperature calculated by the global model as a function of the relative humidity in the gas mixture. As shown in the figure, the electron density in the plasma tends to decrease linearly as the humidity increases. This is because H2O is an electronegative molecule with strong adsorption of electrons, and H2O can react with electrons to generate hydrated electrons, so the density of electrons in the plasma will decrease with the increase in H2O doping concentration. The doping of H2O also increases the reaction path of electron consumption, which further reduces the electron density in the plasma. Meanwhile, the average electron temperature of the plasma shows a linearly increasing trend as the H2O doping concentration increases. The average electron temperature characterizes the magnitude of the average kinetic energy of the electrons in the plasma, and the increase in the electron energy implies that the electrons can ionize molecules with higher ionization energies during the discharge process, which introduces more species in the discharge system. Therefore, changes in humidity can significantly affect the kinetic process of the discharge plasma reaction.
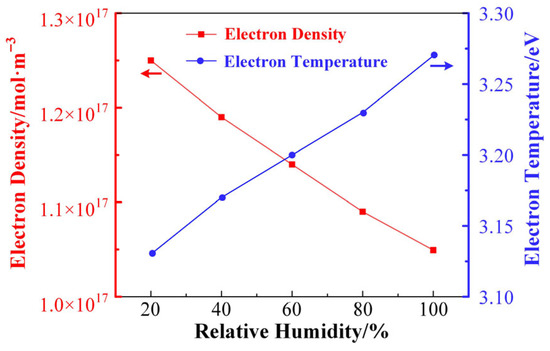
Figure 5.
The trends of electron density and average electron temperature calculated by the global model as a function of the relative humidity.
Figure 6 shows the variation in the concentrations of several typical cations with the increase in relative humidity as calculated by the global model of air + H2O plasma. As shown in the figure, the concentrations of N2+, N+, O2+, and O+ show a decreasing trend with the increase in the H2O doping concentration, among which the concentrations of N2+ and O+ show a large decrease, and the concentrations of the other two ions show a small decrease. Although the increase in H2O doping concentration decreases the absolute concentration of N2 and O2 under the condition of constant air pressure, the doping concentration of H2O is only 3.3% even under the condition of saturated humidity, and thus the percentage of decrease in the absolute concentration of N2 and O2 caused by the increase in humidity is much lower than that of N2+ and O+ in the plasma. This is due to the large variety of particles involved in the discharge plasma and the complexity of the reaction network, which result in the concentration of some particles not varying linearly with the concentration of reactants. On the contrary, the concentrations of H2O+, H+, and H3O+ in the plasma are substantially increased with the increase in the H2O doping ratio. This is due to the fact that these three cations are the products of the H2O molecule through the plasma reaction, and the increase in humidity will inevitably cause an increase in the concentration of these three ions. It is important to note that the concentration of H+ increases dramatically with increasing humidity. H+, or protons, are strongly acidic and strongly corrosive to metals. When an air discharge doped with H2O molecules produces a plasma, H+ is accelerated by the electric field to bombard the electrode surface, which in turn reacts with the electrode surface. This is one of the mechanisms inherent in the damage effect of low-pressure discharge on microwave components. As the concentration of H2O doping increases, the concentration of H+ in the plasma increases dramatically, and thus the etching effect on the metal electrodes also increases dramatically, which in turn may cause permanent damage to the RF components.
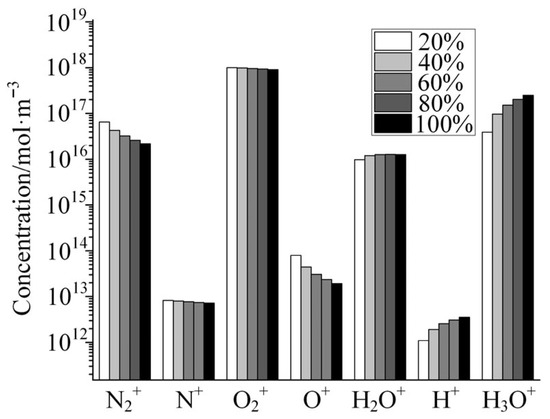
Figure 6.
Variation in the concentrations of several typical cations with the increase in relative humidity.
Figure 7 shows the variation in the concentrations of several typical anions with increasing relative humidity in the gas mixture as calculated by the global model of air + H2O plasma. As shown in the figure, the concentration of O− decreases dramatically with increasing humidity in the gas mixture, but the concentrations of the other four anions change relatively little with increasing humidity. Among these anions, OH− is strongly alkaline and hydrolyzable for a variety of polymer media materials, such as polyimide. Although the concentration of OH− varies little with humidity, its absolute concentration is high, even higher than the density of electrons in the plasma. Therefore, when moisture is doped into the discharge channel, the plasma generated by the discharge has a serious damaging effect on polyimide and other similar polymer dielectric materials.
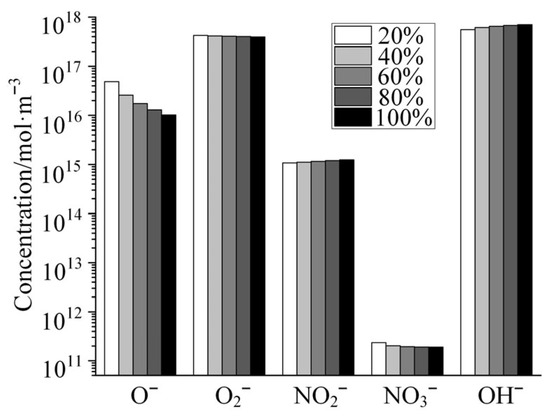
Figure 7.
Variation in the concentrations of several typical anions with the increase in relative humidity.
Figure 8 shows the variation in the concentrations of several neutral species with increasing relative humidity in the gas mixture as calculated by the global model. As shown in the figure, the concentrations of the neutral species composed only of the element oxygen decrease with the increase in humidity, among which the concentrations of the O and O1D decrease slightly, and the concentration of O3 decreases significantly. O atoms, as a kind of strong oxidizing species, have a strong erosive effect on spacecraft materials and are an important factor threatening the safe operation of spacecraft. As shown in Figure 8 the concentration of O is extremely high, with more than 1020 particles per cubic meter. The relative concentration in the gas mixture reaches 0.02% at 20% humidity. The destructive effect of the presence of this high concentration of O atoms on the RF components will be significant. The concentration of H-containing neutral species in the plasma, including OH, H2, and HNO3, increases dramatically with humidity compared to neutral species consisting only of the O element. This is due to the fact that the H element in these species is supplied by doped H2O molecules, and when the doping concentration of H2O increases, the number of H-containing species generated through discharge reaction increases accordingly. It is worth mentioning that among these H-containing species, OH is a strong oxidizing species, and it also has an erosive effect on RF components. HNO3, on the other hand, is a strong acid and has a strong corrosive effect on metal materials. In the field of high-reliability electronics, the detrimental effects of H2 on amplifiers are a complex yet well-documented phenomenon. H2 can significantly lead to gain attenuation, linearity degradation, an increase in noise figure, and even the destruction of amplifiers [33,34]. If H2, produced by low-pressure discharges of water-vapor-containing gases in the radio frequency channel, diffuses into the amplifiers within the link, serious consequences may ensue. Therefore, in addition to the damage caused to microwave components through thermal effects and bombardment by charged particles, the various reactive species contained in the plasma generated by the discharge can also cause damage to component materials through chemical reactions.
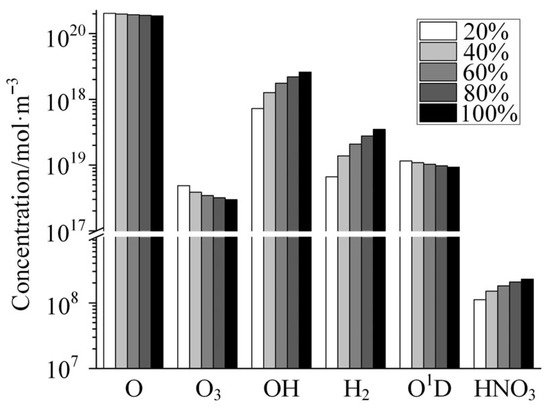
Figure 8.
Variation in the concentrations of several typical neutral species with the increase in relative humidity.
It is worth noting that the gas desorption process from plasma-facing materials can release a substantial number of gas molecules—sufficient to significantly influence the discharge characteristics. Notably, once a discharge plasma is initiated, it can enhance the desorption of adsorbed gases from these materials. Additionally, the water vapor content within the chamber can vary due to different launch conditions and operational environments of spacecraft. Given that these factors may considerably affect the plasma properties, this study has specifically investigated plasma reaction kinetics across a wide range of gas humidity levels—from 20% relative humidity to 100% saturated humidity.
5. Conclusions
This study investigates potential low-pressure discharge effects during operation by establishing a multi-parameter adjustable global model of “air + H2O” discharge plasma. The reaction kinetics of discharge plasma were simulated and analyzed. Simulation results indicate that as the discharge gap pressure increases, both the electron density and average electron energy in the plasma exhibit a declining trend. Meanwhile, with rising humidity, the densities of various cations, anions, and neutral particles in the plasma display distinct variation trends. These include particles such as H+, OH−, and high-concentration O, which possess erosive and damaging effects on both metallic and dielectric materials in RF components. Therefore, engineering measures must be taken to eliminate water vapor in the gaps of RF components and adsorbed water molecules on material surfaces. This will enhance the low-pressure discharge threshold of RF components and prevent the damaging effects of low-pressure discharge on microwave components.
Author Contributions
Conceptualization, Z.C.; methodology, R.W.; software, Z.C.; validation, Z.C., H.B. and T.H.; formal analysis, W.C.; investigation, R.W.; resources, H.B. and Y.L.; data curation, R.W.; writing—original draft preparation, Z.C.; writing—review and editing, W.C. and Z.C.; supervision, W.C. All authors have read and agreed to the published version of the manuscript.
Funding
This research was funded by the Key Laboratory Research Funding, grant numbers 2023-JCJQ-LB-007 and 2024-CXPT-GF-JJ-013.
Data Availability Statement
The data presented in this study are openly available in [Plasma Data Exchange Project] at [http://fr.lxcat.net/], accessed on 2 May 2024, reference number [30].
Conflicts of Interest
The authors declare no conflict of interest.
References
- Aloisio, M.; Casini, E.; Ginesi, A. Evolution of space traveling-wave tube amplifier requirements and specifications for modern communication satellites. IEEE Trans. Electron Dev. 2007, 54, 1587–1596. [Google Scholar] [CrossRef]
- Arregui, I.; Teberio, F.; Arnedo, I.; Percaz, J.M.; Martin-Iglesias, P.; Lopetegi, T.; Laso, M.A. High-power filter design in waveguide technology: Future generation of waveguide satellite filters in payloads handling increasing bit rates and numbers of channels. IEEE Microw. Mag. 2020, 21, 46–57. [Google Scholar] [CrossRef]
- Mao, Z.; Li, Y.; Cai, Y.; He, Y.; Yu, M. Experimental Investigation of Material and Geometry Effects on Microwave Breakdown of Evanescent-Mode Cavity Resonators. IEEE. Trans. Microw. Theory 2021, 69, 4001. [Google Scholar] [CrossRef]
- Li, Z. The properties of Paschen breakdown and their applications in design of space high voltage module. Space Electron. Technol. 2015, 12, 8–13. [Google Scholar]
- Zhang, N.; Cui, W.; Hu, T.; Wang, X. Advances in Research on Multipactor. Space Electron. Technol. 2011, 1, 38–43. Available online: https://www.zhangqiaokeyan.com/academic-journal-cn_space-electronic-technology_thesis/0201240412784.html (accessed on 27 October 2025).
- Birdsall, C. Particle-in-cell charged-particle simulations, plus Monte Carlo collisions with neutral atoms, PIC-MCC. IEEE Trans. Plasma Sci. 1991, 19, 65–85. [Google Scholar] [CrossRef]
- Zhou, Y.; Cao, L.; Ma, X.; Deng, L.; Xin, Y. Diagnosis of capacitively coupled plasma driven by pulse-modulated 27.12 MHz by using an emissive probe. Acta Phys. Sin. 2020, 69, 085201. [Google Scholar] [CrossRef]
- Mao, Z.; Li, Y.; Ye, M.; He, Y. Monte Carlo simulation of microwave air breakdown in parallel plates considering electron-surface interaction. Phys. Plasmas 2020, 27, 093502. [Google Scholar] [CrossRef]
- Liu, D.; Bruggeman, P.; Iza, F.; Rong, M.; Kong, M. Global model of low-temperature atmospheric-pressure He+H2O plasmas. Plasma Sources Sci. Technol. 2010, 19, 025018. [Google Scholar] [CrossRef]
- Khan, A.; Ahmed, M.; Rafique, U. Experimental Study of RF–Plasma Interaction Using a Low-Pressure DC Glow Discharge Tube for MPC. Electronics 2023, 12, 551. [Google Scholar] [CrossRef]
- Chen, Z.; Wang, R.; Cui, W. Source analysis of multipactor-induced low-pressure gas of microwave component in spacecraft. Chin. Space Sci. Technol. 2023, 43, 35–42. [Google Scholar]
- Rowntree, P.; Parenteau, L.; Sanche, L. Electron stimulated desorption via dissociative attachment in amorphous H2O. J. Chem. Phys. 1991, 94, 8570–8576. [Google Scholar] [CrossRef]
- Kim, D.; Jung, H.; Gweon, B.; Moon, S.; Rhee, J.; Choe, W. The driving frequency effects on the atmospheric pressure corona jet plasmas from low frequency to radio frequency. Phys. Plasmas 2011, 18, 043503. [Google Scholar] [CrossRef]
- Stalder, K.; Vidmar, R.; Nersisyan, G.; Graham, W. Modeling the chemical kinetics of high-pressure glow discharges in mixtures of helium with real air. J. Appl. Phys. 2006, 99, 093301. [Google Scholar] [CrossRef]
- Murakami, T.; Niemi, K.; Gans, T.; O’Connell, D.; Graham, W. Chemical kinetics and reactive species in atmospheric pressure helium–oxygen plasmas with humid-air impurities. Plasma Sources Sci. Technol. 2012, 22, 015003. [Google Scholar] [CrossRef]
- Sun, B.; Liu, D.; Iza, F.; Wang, S.; Yang, A.; Liu, Z.; Rong, M.; Wang, X. Global model of an atmospheric-pressure capacitive discharge in helium with air impurities from 100 to 10000 ppm. Plasma Sources Sci. Technol. 2019, 28, 035006. [Google Scholar] [CrossRef]
- Liu, D.; Rong, M.; Wang, X.; Iza, F.; Kong, M.; Bruggeman, P. Main species and physicochemical processes in cold atmospheric-pressure He+O2 Plasmas. Plasma Process. Polym. 2010, 7, 846–865. [Google Scholar] [CrossRef]
- Monahan, D.; Turner, M. Global models of electronegative discharges: Critical evaluation and practical recommendations. Plasma Sources Sci. Technol. 2008, 17, 045003. [Google Scholar] [CrossRef]
- Nam, S.; Verboncoeur, J. Global Model for High Power Microwave Breakdown at High Pressure. Comput. Phys. Commun. 2009, 180, 628–635. [Google Scholar] [CrossRef]
- Yanguas-Gil, A.; Cotrino, J.; Gonzalez-Elipe, A. Global model of a low pressure ECR microwave plasma applied to the PECVD of SiO2 thin films. J. Phys. D Appl. Phys. 2007, 40, 3411. [Google Scholar] [CrossRef]
- Sakiyama, Y.; Graves, D.; Chang, H.; Shimizu, T.; Morfill, G. Plasma chemistry model of surface microdischarge in humid air and dynamics of reactive neutral species. J. Phys. D Appl. Phys. 2012, 45, 425201. [Google Scholar] [CrossRef]
- Vahedi, V.; Surendra, M. A Monte Carlo collision model for the particle-in-cell method: Applications to argon and oxygen discharges. Comput. Phys. Commun. 1995, 87, 179–198. [Google Scholar] [CrossRef]
- Perrin, J.; Leroy, O.; Bordage, M. Cross-Sections, Rate Constants and Transport Coefficients in Silane Plasma Chemistry. Contrib. Plasma Phys. 1996, 36, 3–49. [Google Scholar] [CrossRef]
- McGee, B.; Hobbs, M.; Baer, M. Exponential 6 Parameterization for the JCZ3-EOS; Energetic and Multi-Phase Processes; Sandia National Labs: Albuquerque, NM, USA, 1998. [Google Scholar]
- Henriques, J.; Tatarova, E.; Ferreira, C. Microwave N2-Ar plasma torch. I. Modeling. J. Appl. Phys. 2011, 109, 023301. [Google Scholar] [CrossRef]
- Fuller, E.; Schettler, P.; Giddings, J. New method for prediction of binary gas-phase diffusion coefficient. Ind. Eng. Chem. 1966, 58, 18–27. [Google Scholar] [CrossRef]
- Gordiets, B.; Ferreira, C.; Guerra, V.; Loureiro, J.; Vialle, M. Kinetic model of a low-pressure N2-O2 flowing glow discharge. IEEE Trans. Plasma Sci. 1995, 23, 750–768. [Google Scholar] [CrossRef]
- Kushner, M. Strategies for rapidly developing plasma chemistry models. Bull. Am. Phys. Soc. 1999, 44, 63. [Google Scholar]
- Kossyi, I.; Silakov, V. Kinetic scheme of the non-equilibrium discharge in nitrogen-oxygen mixture. Plasma Sources Sci. Technol. 1992, 1, 207–220. [Google Scholar] [CrossRef]
- Available online: http://fr.lxcat.net/ (accessed on 2 May 2024).
- Hagelaar, G.; Pitchford, L. Solving the Boltzmann equation to obtain electron transport coefficients and rate coefficients for fluid models. Plasma Sources Sci. Technol. 2005, 14, 722. [Google Scholar] [CrossRef]
- Ding, K.; Lieberman, M.; Lichtenberg, A. Hybrid model of neutral diffusion, sheaths, and the α to γ transition in an atmospheric pressure He/H2O bounded RF discharge. J. Phys. D Appl. Phys. 2014, 47, 305203. [Google Scholar] [CrossRef]
- Pankove, J.; Wance, R.; Berkeyheiser, J. Neutralization of acceptors in silicon by atomic hydrogen. Appl. Phys. Lett. 1984, 45, 1100. [Google Scholar] [CrossRef]
- Ren, F.; Lee, J.; Abernathy, C.; Pearton, S.; Shul, R.; Constantine, C.; Barrat, C. Hydrogenation effects during high-density plasma processing of GaAs MESFETS. Semicond. Sci. Technol. 1997, 12, 1154. [Google Scholar] [CrossRef]


Disclaimer/Publisher’s Note: The statements, opinions and data contained in all publications are solely those of the individual author(s) and contributor(s) and not of MDPI and/or the editor(s). MDPI and/or the editor(s) disclaim responsibility for any injury to people or property resulting from any ideas, methods, instructions or products referred to in the content. |
© 2025 by the authors. Licensee MDPI, Basel, Switzerland. This article is an open access article distributed under the terms and conditions of the Creative Commons Attribution (CC BY) license (https://creativecommons.org/licenses/by/4.0/).