Article

Enhanced Research on YOLOv12 Detection of Apple Defects by Integrating Filter Imaging and Color Space Reconstruction

1
International Academy of Arts, Dalian University of Foreign Languages, Dalian 116044, China
2
Research Institute of Photonics, Dalian Polytechnic University, Dalian 116034, China
*
Author to whom correspondence should be addressed.
These authors contributed equally to this work.
Electronics 2025, 14(21), 4259; https://doi.org/10.3390/electronics14214259
Submission received: 18 September 2025 / Revised: 14 October 2025 / Accepted: 22 October 2025 / Published: 30 October 2025

Abstract

This study aims to improve the accuracy and efficiency of apple defect detection under complex lighting conditions. A novel approach is proposed that integrates filtered imaging with color space reconstruction, utilizing YOLOv12 as the detection framework. “Red Fuji” apples were selected, and an imaging platform featuring adjustable illumination and RGB filters was established. Following pre-experimental optimization of imaging conditions, a dataset comprising 1600 images was constructed. Conversions to RGB, HSI, and LAB color spaces were performed, and YOLOv12 served as the baseline model for ablation experiments. Detection performance was assessed using Precision, Recall, mAP, and FPS metrics. Results indicate that the green filter under 4500 K illumination combined with RGB color space conversion yields optimal performance, achieving an mAP50–95 of 83.1% and a processing speed of 15.15 FPS. This study highlights the impact of filter–color space combinations on detection outcomes, offering an effective solution for apple defect identification and serving as a reference for industrial inspection applications.

1. Introduction

Fruit quality inspection constitutes a critical component of the agricultural supply chain, directly influencing both the market value of produce and consumer health. Among these, apples—one of the most extensively cultivated and consumed fruits worldwide—occupy a pivotal economic position in the horticultural sector, with an annual yield exceeding 80 million tons [1]. However, apples are highly susceptible to surface defects such as scratches, bruises, and rot during harvesting, transportation, and storage, which substantially diminish their grading and market competitiveness. Consequently, the development of efficient and precise automated detection technologies is essential for post-harvest grading and quality control. Traditional manual inspection remains prevalent in many stages of fruit processing; however, its outcomes are easily compromised by subjective judgment, visual fatigue, and differences in inspectors’ experience [2,3], resulting in low efficiency and poor consistency. In contrast, computer vision technology—characterized by its non-destructive nature, high throughput, and objectivity—has emerged as a key approach for automated fruit inspection [4]. Early computer vision-based detection methods primarily relied on handcrafted features such as color, texture, and shape [5,6], employing threshold segmentation or edge detection for defect identification. Nevertheless, these approaches exhibit limited robustness under complex illumination or background variations [7]. The advent of deep learning has fundamentally revolutionized research in fruit appearance detection, allowing models to automatically extract high-dimensional features directly from raw images. Convolutional neural networks (CNNs) and their variants [8] have been extensively applied to a wide range of visual tasks in agriculture, including fruit classification, ripeness evaluation, and surface defect detection.

1.1. Background and Related Work

In recent years, deep learning-based detection algorithms, particularly those in the YOLO series, have exhibited remarkable real-time performance and detection accuracy in agricultural visual inspection. The YOLOv11s-Brinjal model proposed by Tamilarasi et al. [9] reduced the model size to 8.2 MB and the inference time to 10.1 ms through channel pruning and weight fine-tuning, while achieving an mAP of 98.1%. Unai et al. [10] further enhanced the YOLOv12n-Seg model by incorporating the GhostConv module and a global attention mechanism into the network neck structure, significantly improving detection performance for citrus maturity and red wax scale infestations. In the broader domain of precision agriculture, Angelo Cardellicchio et al. [11] conducted a study on tomato disease detection using a multispectral YOLOv7 framework, evaluating multiple attention mechanisms and achieving an mAP of 92.3%. Meanwhile, David Ribeiro et al. [12] provided a comprehensive review of YOLOv11 and YOLOv12 applications in agricultural vision tasks, noting that real-time detection performance can be effectively enhanced through lightweight network structures and attention mechanisms. Chen et al. [13] compared RT-DETR, RT-DETRv2, and other Transformer-based models with the YOLO series, establishing a benchmark for pear surface defect detection via transfer learning. Among these models, YOLO demonstrated superior performance in balancing accuracy and speed, offering essential technical support for pear quality grading systems. Collectively, these studies underscore that through architectural optimization and modular integration, deep learning models can effectively reconcile computational efficiency with detection precision, rendering them particularly well-suited for complex agricultural vision applications such as crop detection, maturity evaluation, and disease identification.

1.2. Research Motivation and Contributions

To address these challenges, researchers have increasingly explored the integration of multispectral imaging, color space transformation, and optical filtering. Multispectral imaging enhances defect recognition by capturing spectral information beyond the visible range [14], while color space transformation re-encodes image color data through mathematical modeling to adapt to diverse detection scenarios and mitigate environmental interference [15]. Among these methods, the RGB color space remains widely used in industrial vision inspection systems due to its structural simplicity and computational efficiency. However, its luminance and chromaticity components are highly interdependent, rendering it extremely sensitive to variations in illumination and surface reflectance [16]. In contrast, color spaces such as HSI and LAB mathematically decouple luminance and chromaticity, thereby reducing the influence of illumination variations on color distribution and significantly improving the robustness of color features under non-uniform lighting conditions [17,18]. Meanwhile, red, green, and blue optical filters enhance the spectral contrast of defect regions through band selectivity, thereby improving the separability of model features [19]. From a deep learning perspective, the combination of filtered imaging and color space reconstruction functions not merely as a data preprocessing step but also as a spectral-level feature enhancement mechanism. Similarly to traditional image enhancement techniques such as contrast stretching [20], color jitter [21], or noise perturbation [22], this strategy enriches the input data distribution during network training by generating “suboptimal” samples with varied spectral response characteristics, thus enhancing the model’s feature representation capacity and generalization performance [23]. Building upon this rationale, the present study hypothesizes that under a unified neural network framework, the concurrent incorporation of optical filtering and color space transformation can yield complementary effects at both the physical and computational levels—enhancing spectral saliency through optical modulation while optimizing feature separability via color space reconstruction—thereby achieving superior detection accuracy and stability.
Therefore, this study centers on the concept of “jointly optimizing optical filtering and color space reconstruction” and proposes an enhanced YOLOv12-based method for apple surface defect detection. The proposed approach systematically examines the combined effects of red, green, and blue optical filtering alongside RGB, HSI, and LAB color space transformations under multiple color temperature conditions (3000 K, 4500 K, 6000 K), aiming to elucidate the influence of their interaction on detection performance. Furthermore, the generalizability of the method is validated and extended to open environments through experiments on public datasets.
The main innovations of this article are as follows:
(1)
A high-quality multi-filter and multi-illumination dataset of “Red Fuji” apples was established, providing a reproducible and reliable data foundation for this research.
(2)
The proposed system systematically compared the integration of RGB, HSI, and LAB color spaces with filtered imaging, evaluating their comprehensive performance across multiple dimensions, including detection accuracy, inference speed, and stability, with particular attention to performance variations under complex illumination conditions.
(3)
Experimental results demonstrate that the combination of green filtering and RGB reconstruction (G-RGB) achieves the optimal balance between accuracy and computational efficiency. Furthermore, external validation confirms that this configuration maintains high performance in open scenarios and significantly surpasses other color space (HSI, LAB) and filtered imaging combinations in apple defect detection reported in this study.

2. Materials and Methods

2.1. Sample Selection and Experimental Setup

2.1.1. Sample Selection

For this experiment, “Red Fuji”—a widely available commercial apple cultivar—was selected for image acquisition. A total of 100 apples, all confirmed to be Intact and free from visible damage, were procured. These apples were then randomly assigned into four categories based on induced surface conditions: Intact, Puncture, Scratch, and Rot, as detailed in Table 1. Each apple subjected to damage received the same defect type on two opposing sides; that is, after one side was damaged, the apple was rotated 180° and the same type of defect was applied to the opposite side [24]. Notably, all defects were restricted to the equatorial (transverse) region of the fruit. This decision is grounded in empirical evidence and post-harvest handling studies, which indicate that surface defects predominantly occur on the lateral areas due to increased exposure during logging and transportation [25,26]. In contrast, the calyx and stem regions, being recessed, are less susceptible to external damage. This sampling strategy ensures comprehensive coverage of high-incidence defect zones while simplifying image acquisition and enhancing model compatibility [27]. Focusing exclusively on the side surface enables the imaging system to avoid the calyx and stem cavities, which are characterized by complex morphology and texture variations. These regions often resemble genuine defects and may result in false positives within detection models [28]. Excluding them from image capture improves image consistency and reduces computational overhead [29], thereby aligning the setup more closely with practical industrial grading systems. In conveyor belt-based processing environments, apples are typically scanned from the side [30,31]. Prior to experimentation, a minimum spacing of 5 mm was maintained between apples. All samples were stored at room temperature (24 ± 1 °C) for 24 h. Damage induction was performed by a single trained operator using calibrated tools, with precision verified by a vernier caliper (tolerance ± 0.1 mm), to ensure consistency and repeatability across all defect types.

2.1.2. Experimental Setup

The experiment was conducted in a dedicated laboratory space measuring 3.3 × 4.9 m (Figure 1a). To minimize environmental interference, all surrounding walls were draped in black cloth. As illustrated in Figure 1a,b, the imaging platform was assembled using three 600 × 800 mm and two 600 × 600 mm wooden boards, mounted on an experimental bench measuring 2000 × 650 × 750 mm. Illumination was provided by LED downlights (beam angle: 86°, color temperature adjustable between 3000 K and 6000 K), affixed to a vertical panel positioned 30 cm above the platform. A single apple was placed on an electrically driven rotating platform (height: 50 mm), elevated by a 200 mm base, enabling 360° rotation to fully expose the lateral surface. Image acquisition was performed using a Canon 500D camera equipped with an EF-S 18–55 mm f3.5–5.6 IS image-stabilized lens, positioned perpendicularly to the equatorial plane of the apple. Images were captured at a resolution of 2448 × 2048 pixels with a frame rate of 15 fps. Four images were collected for each apple, with 90° rotational intervals. Both the lighting color temperature and platform rotation were precisely controlled via a Python script. To enhance defect visibility under varying spectral conditions, red filter, green filter, and blue filter were employed during image capture (Figure 1c). The surface defects on apples exhibit distinct reflectance profiles across these wavelengths [32]. Given that the red hue predominates on Red Fuji apples, the red filter—centered at 680 nm with a ±30 nm bandwidth (covering the 650–710 nm range)—was particularly effective in accentuating surface damage. The green filter, centered at 535 nm with a ±35 nm bandwidth (covering 500–570 nm), was advantageous for identifying defects within green-toned regions. Conversely, the blue filter, centered at 460 nm with a ±30 nm bandwidth (covering 430–490 nm), revealed fewer distinct damage patterns in red- or green-dominated areas. Multi-channel imaging using RGB filters enabled the extraction of complementary spectral features, thereby enhancing the overall accuracy of defect detection across various defect types. When combined with adjustable lighting color temperature, this approach offered a versatile and effective solution for acquiring high-contrast images tailored to different defect characteristics.

2.2. Pre-Experiment and Dataset

2.2.1. Pre-Experiment

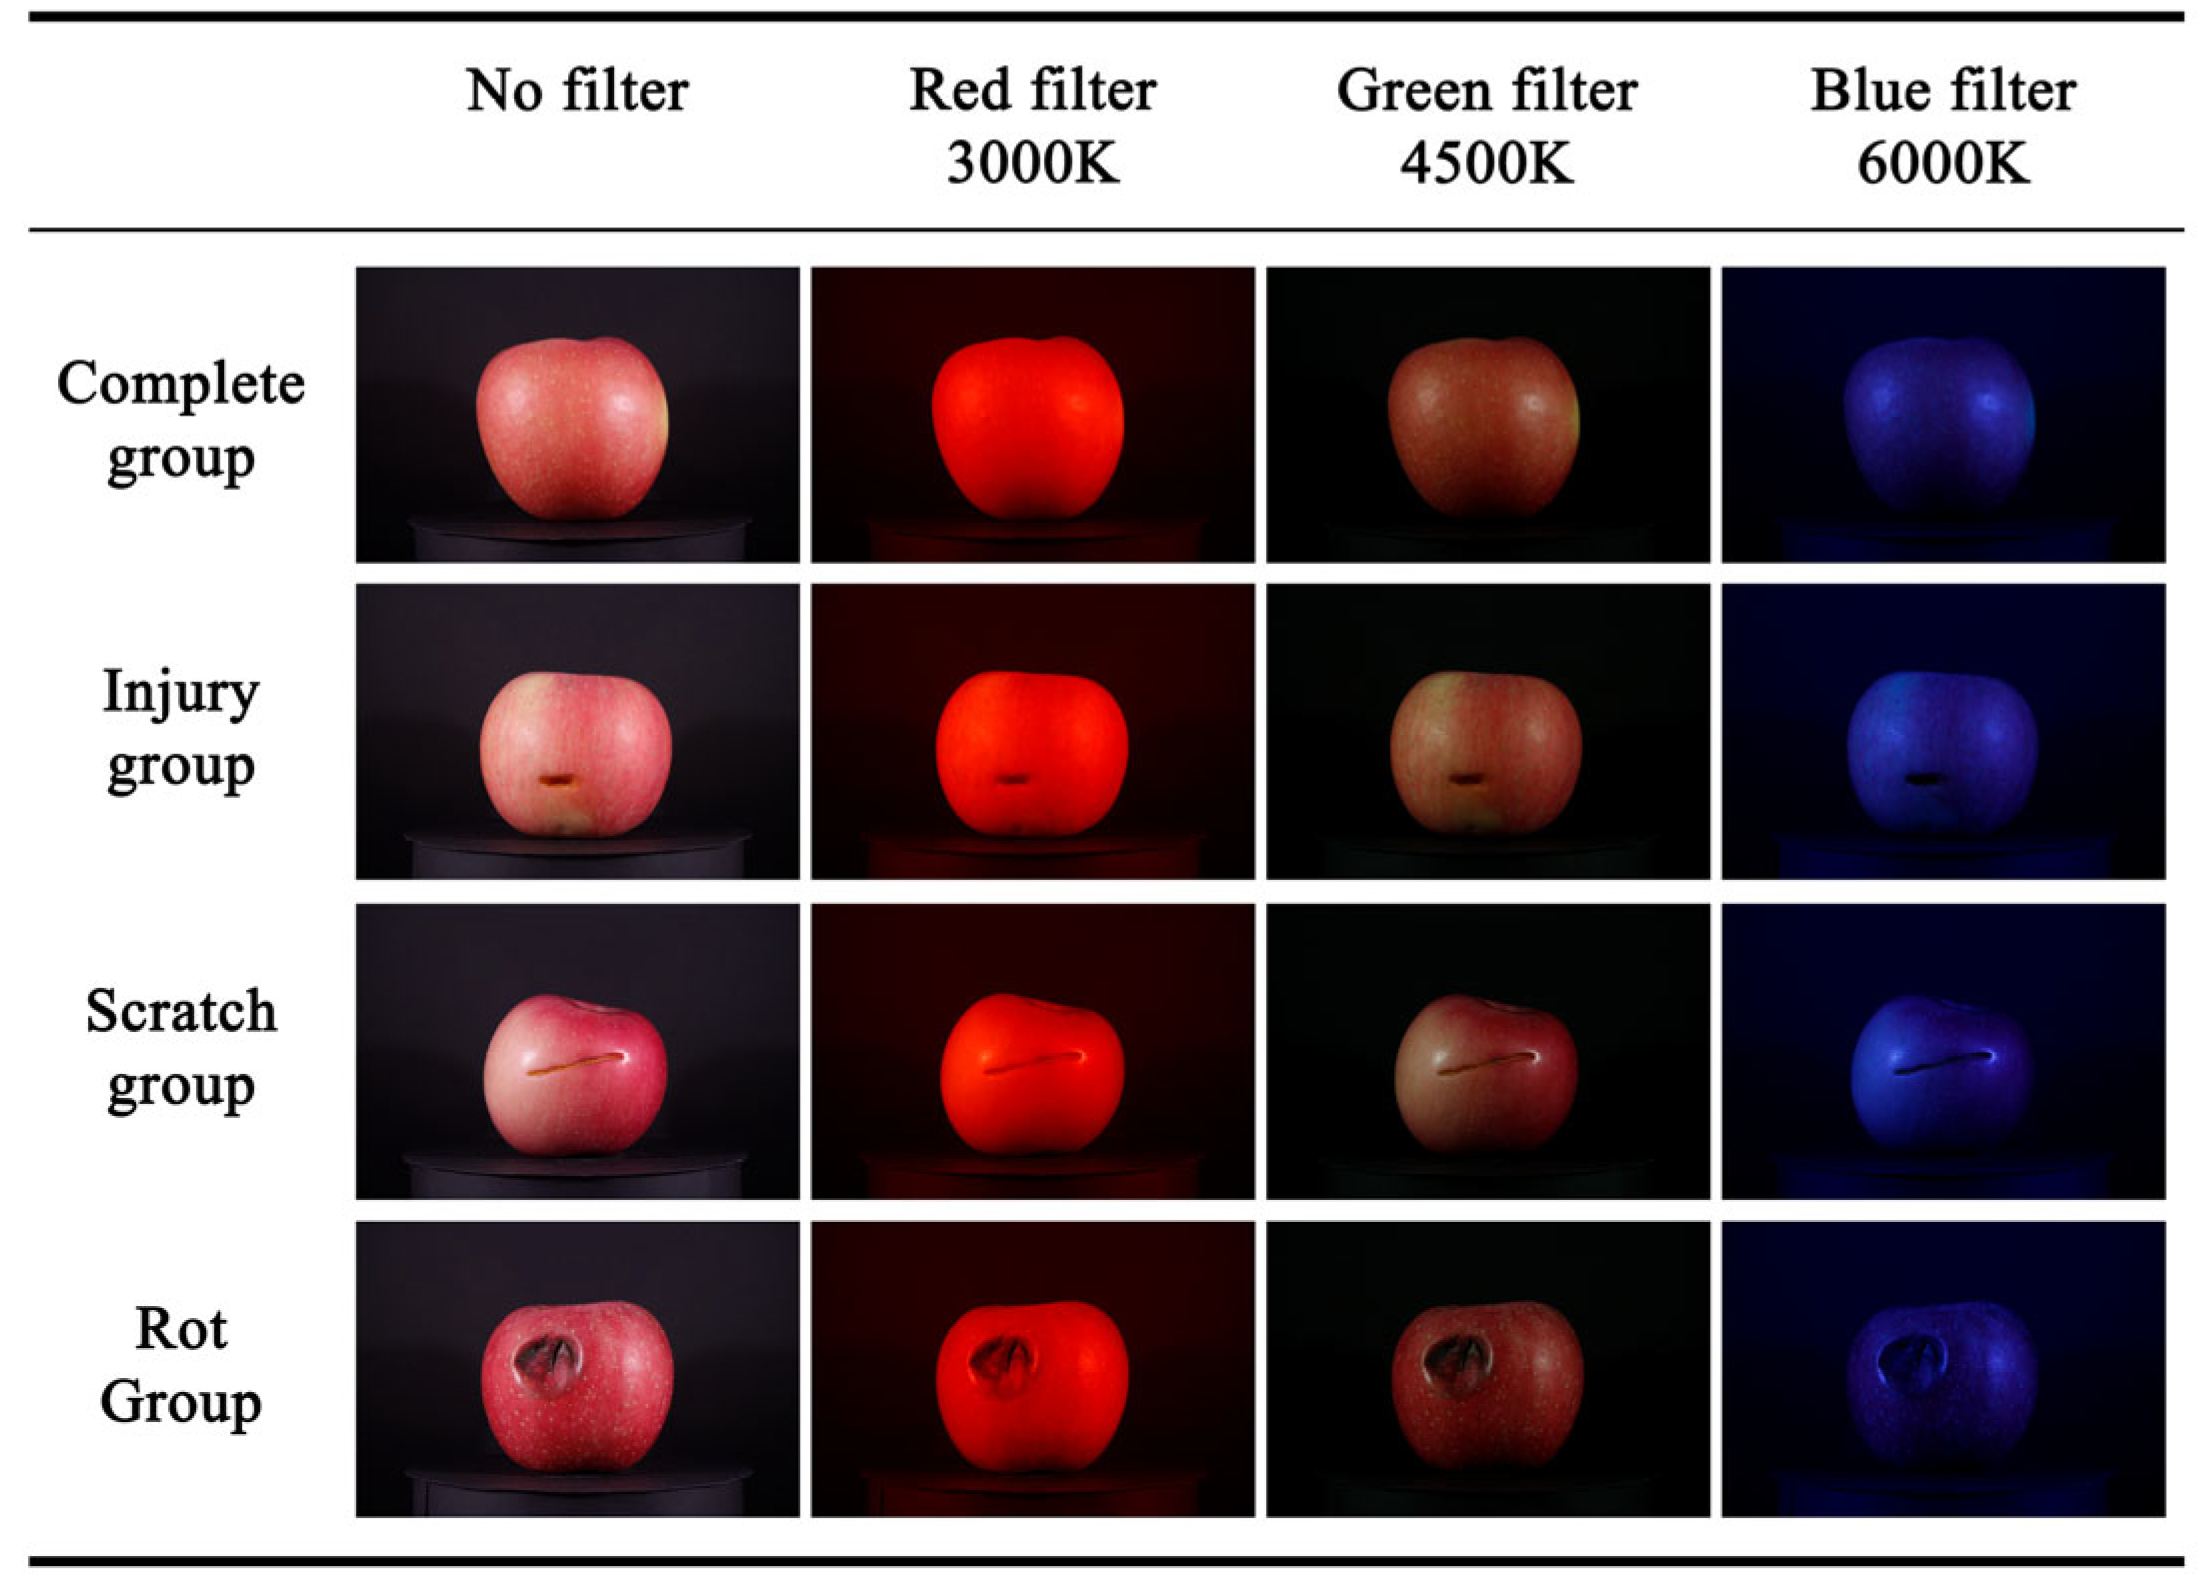
The pre-experiment was designed to identify the optimal imaging parameters for capturing apple surface defects, specifically focusing on filter type and color temperature. A full-factorial experimental design was employed, comprising four filter conditions—No filter, red filter, green filter, and blue filter—and three color temperatures (3000 K, 4500 K, and 6000 K), resulting in twelve distinct imaging configurations. Representative images from these combinations are presented in Figure 2. The influence of color temperature is particularly emphasized due to its direct impact on surface reflectance and defect visibility [33]. A low color temperature (3000 K) imparts warm tones that mitigate surface glare while accentuating defect details. The medium color temperature (4500 K) approximates neutral daylight, offering balanced brightness and contrast. Conversely, a high color temperature (6000 K) yields cool tones that enhance clarity and contrast, effectively highlighting subtle surface variations [34]. In the absence of filters, color temperature effects are more pronounced: 3000 K reduces ambient light interference but results in insufficient contrast; 4500 K delivers optimal color fidelity; 6000 K risks overexposure of highlights, compromising defect discernment. Upon assessing sharpness and contrast across all twelve conditions, three filter–color temperature pairings emerged as superior: (1) red filter with 3000 K, capturing crisp details at minimal reflectance; (2) green filter with 4500 K, balancing color accuracy, detail resolution, and background contrast; and (3) blue filter with 6000 K, maximizing clarity and enhancing the detection of fine defects [35]. These combinations were subsequently adopted as the standard imaging conditions for the formal experimental phase.

2.2.2. Dataset Construction

The formal experiment involved acquiring system images under the optimized combinations of three filters and color temperatures identified in the pre-experiment. The experimental environment was rigorously controlled: all external light sources were eliminated, and illumination was provided exclusively by adjustable OPPLE ceiling spotlights. Light color temperature was modulated via a Python script, while apple rotation was precisely managed using a dial set to 90° increments. Each apple was imaged from four orthogonal angles following the protocol of “4 angles × 4 filtering conditions,” as depicted in Figure 3. For each apple, four sequential images were captured: (1) No filter, (2) red filter + 3000 K, (3) green filter + 4500 K, and (4) blue filter + 6000 K, yielding 16 images per apple. As summarized in Table 2, the sample comprised four groups—Intact, Puncture, Scratch, and Rot—each containing 25 apples. Consequently, 400 images were obtained per group, culminating in a total of 1600 images across all groups. Among these, 400 images correspond to No filter conditions, while the remaining 1200 constitute system images produced through the combinations of filters and color temperatures. The composition of this dataset affords a robust and diverse classification foundation for multi-condition imaging comparisons in subsequent deep learning analyses.

2.3. Color Space Conversion

The color model offers a mathematical representation of image chromatic characteristics and serves as a foundational element in computer vision and image processing tasks [36,37]. Commonly employed color spaces—such as RGB, HSI, and LAB—reflect different aspects of human visual perception and are tailored to meet distinct application requirements.
The RGB color model is grounded in the trichromatic theory of vision, which corresponds to the human eye’s sensitivity to red, green, and blue wavelengths. Each pixel is represented as a three-dimensional vector of intensity values [38]. This relationship is expressed by Formula (1):
C R G B = R , G , B
R, G, B ∈ [0, 255], where [255, 255, 255] denotes white, [0, 0, 0] represents black, and all other colors arise from weighted combinations of the three primary light components: red, green, and blue.
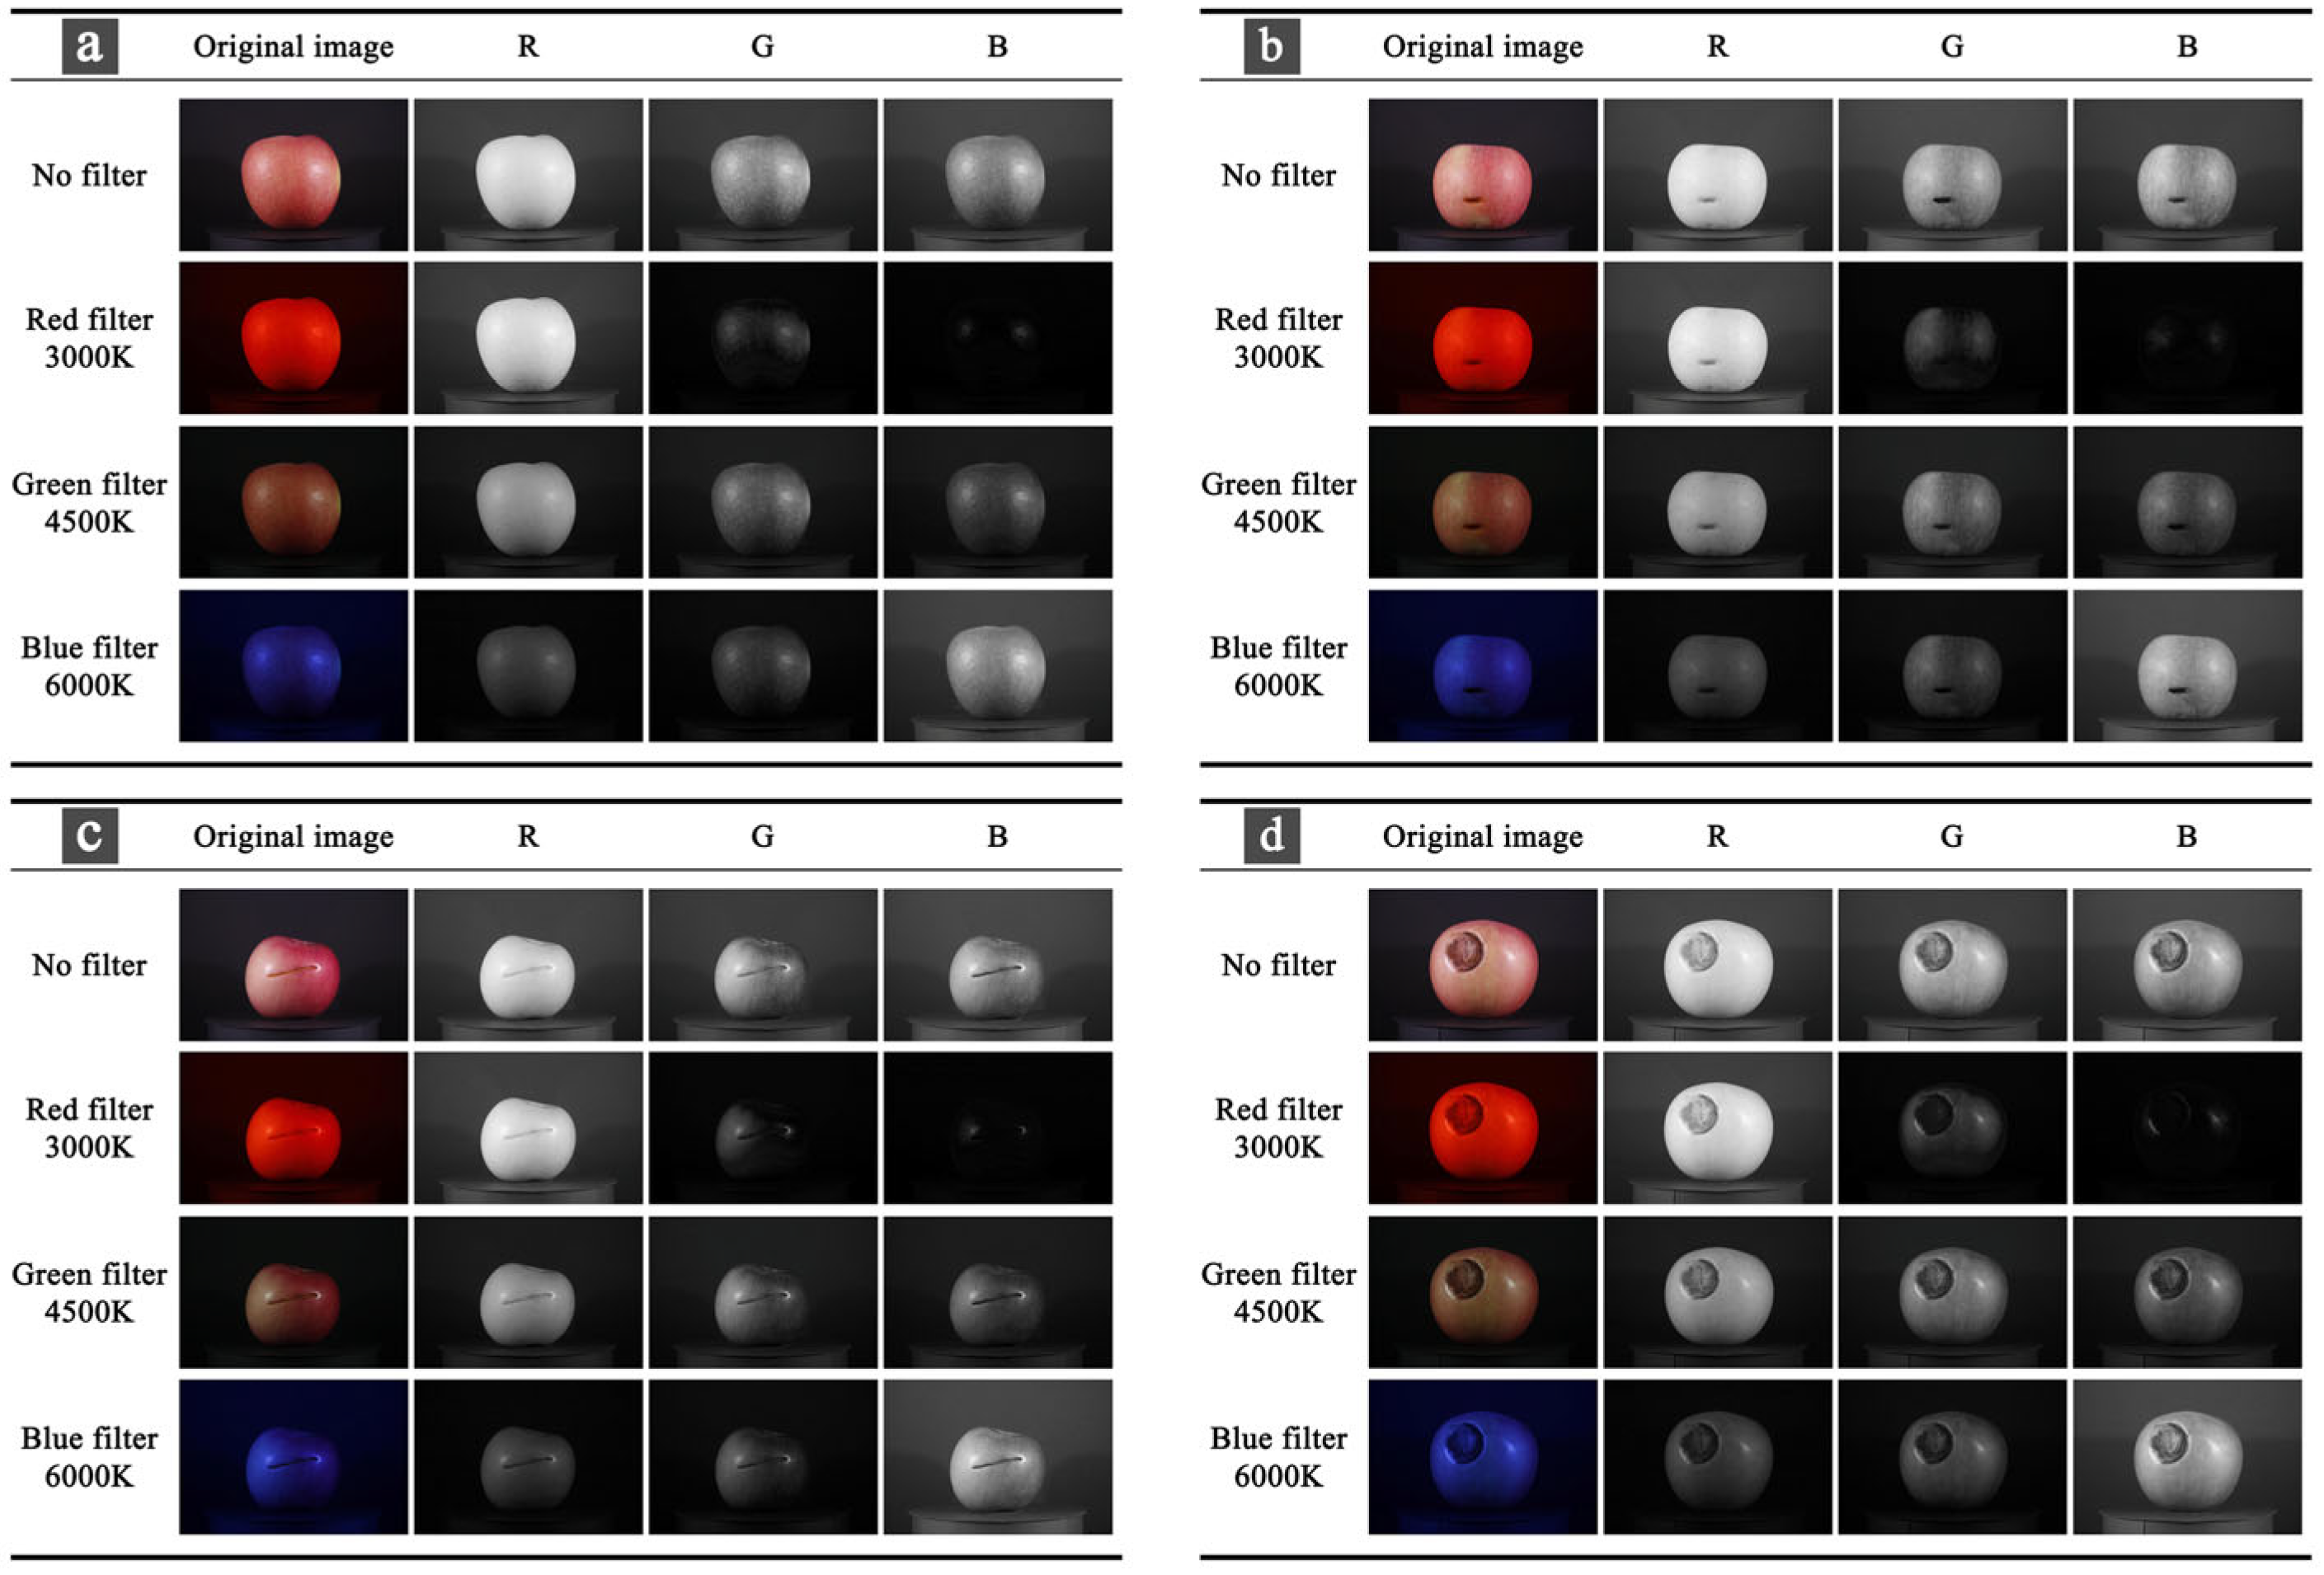
As shown in Figure 4a,b, the red filter at 3000 K markedly enhances the grayscale contrast and edge sharpness of apple regions, whereas the green and blue filters yield lower channel separation and blurred contours. These findings indicate that while RGB imaging offers efficiency and direct pixel representation, it lacks the perceptual depth required for stable color analysis under variable illumination. To address this limitation, the HSI model is introduced, encoding color through Hue (H), Saturation (S), and Intensity (I), thereby decoupling chromatic and luminance components [39]. The RGB-to-HSI transformation process involves normalizing the RGB values, followed by the sequential computation of intensity, saturation, and hue, as defined in Equations (2)–(5):
R = R 255 , G = G 255 , B = B 255
I = R + G + B 3
S = 1 3 min R , G , B R + G + B
H = cos 1 1 2 R G + R B R G 2 + R B G B
Here R’, G’ and B’ denote normalized values (0–1), I indicating brightness, S denotes color purity, and H specifies hue.
Figure 4. Image comparison across RGB color channels: (a) Intact group; (b) Puncture group; (c) Scratch group; (d) Rot group.
Electronics 14 04259 g004
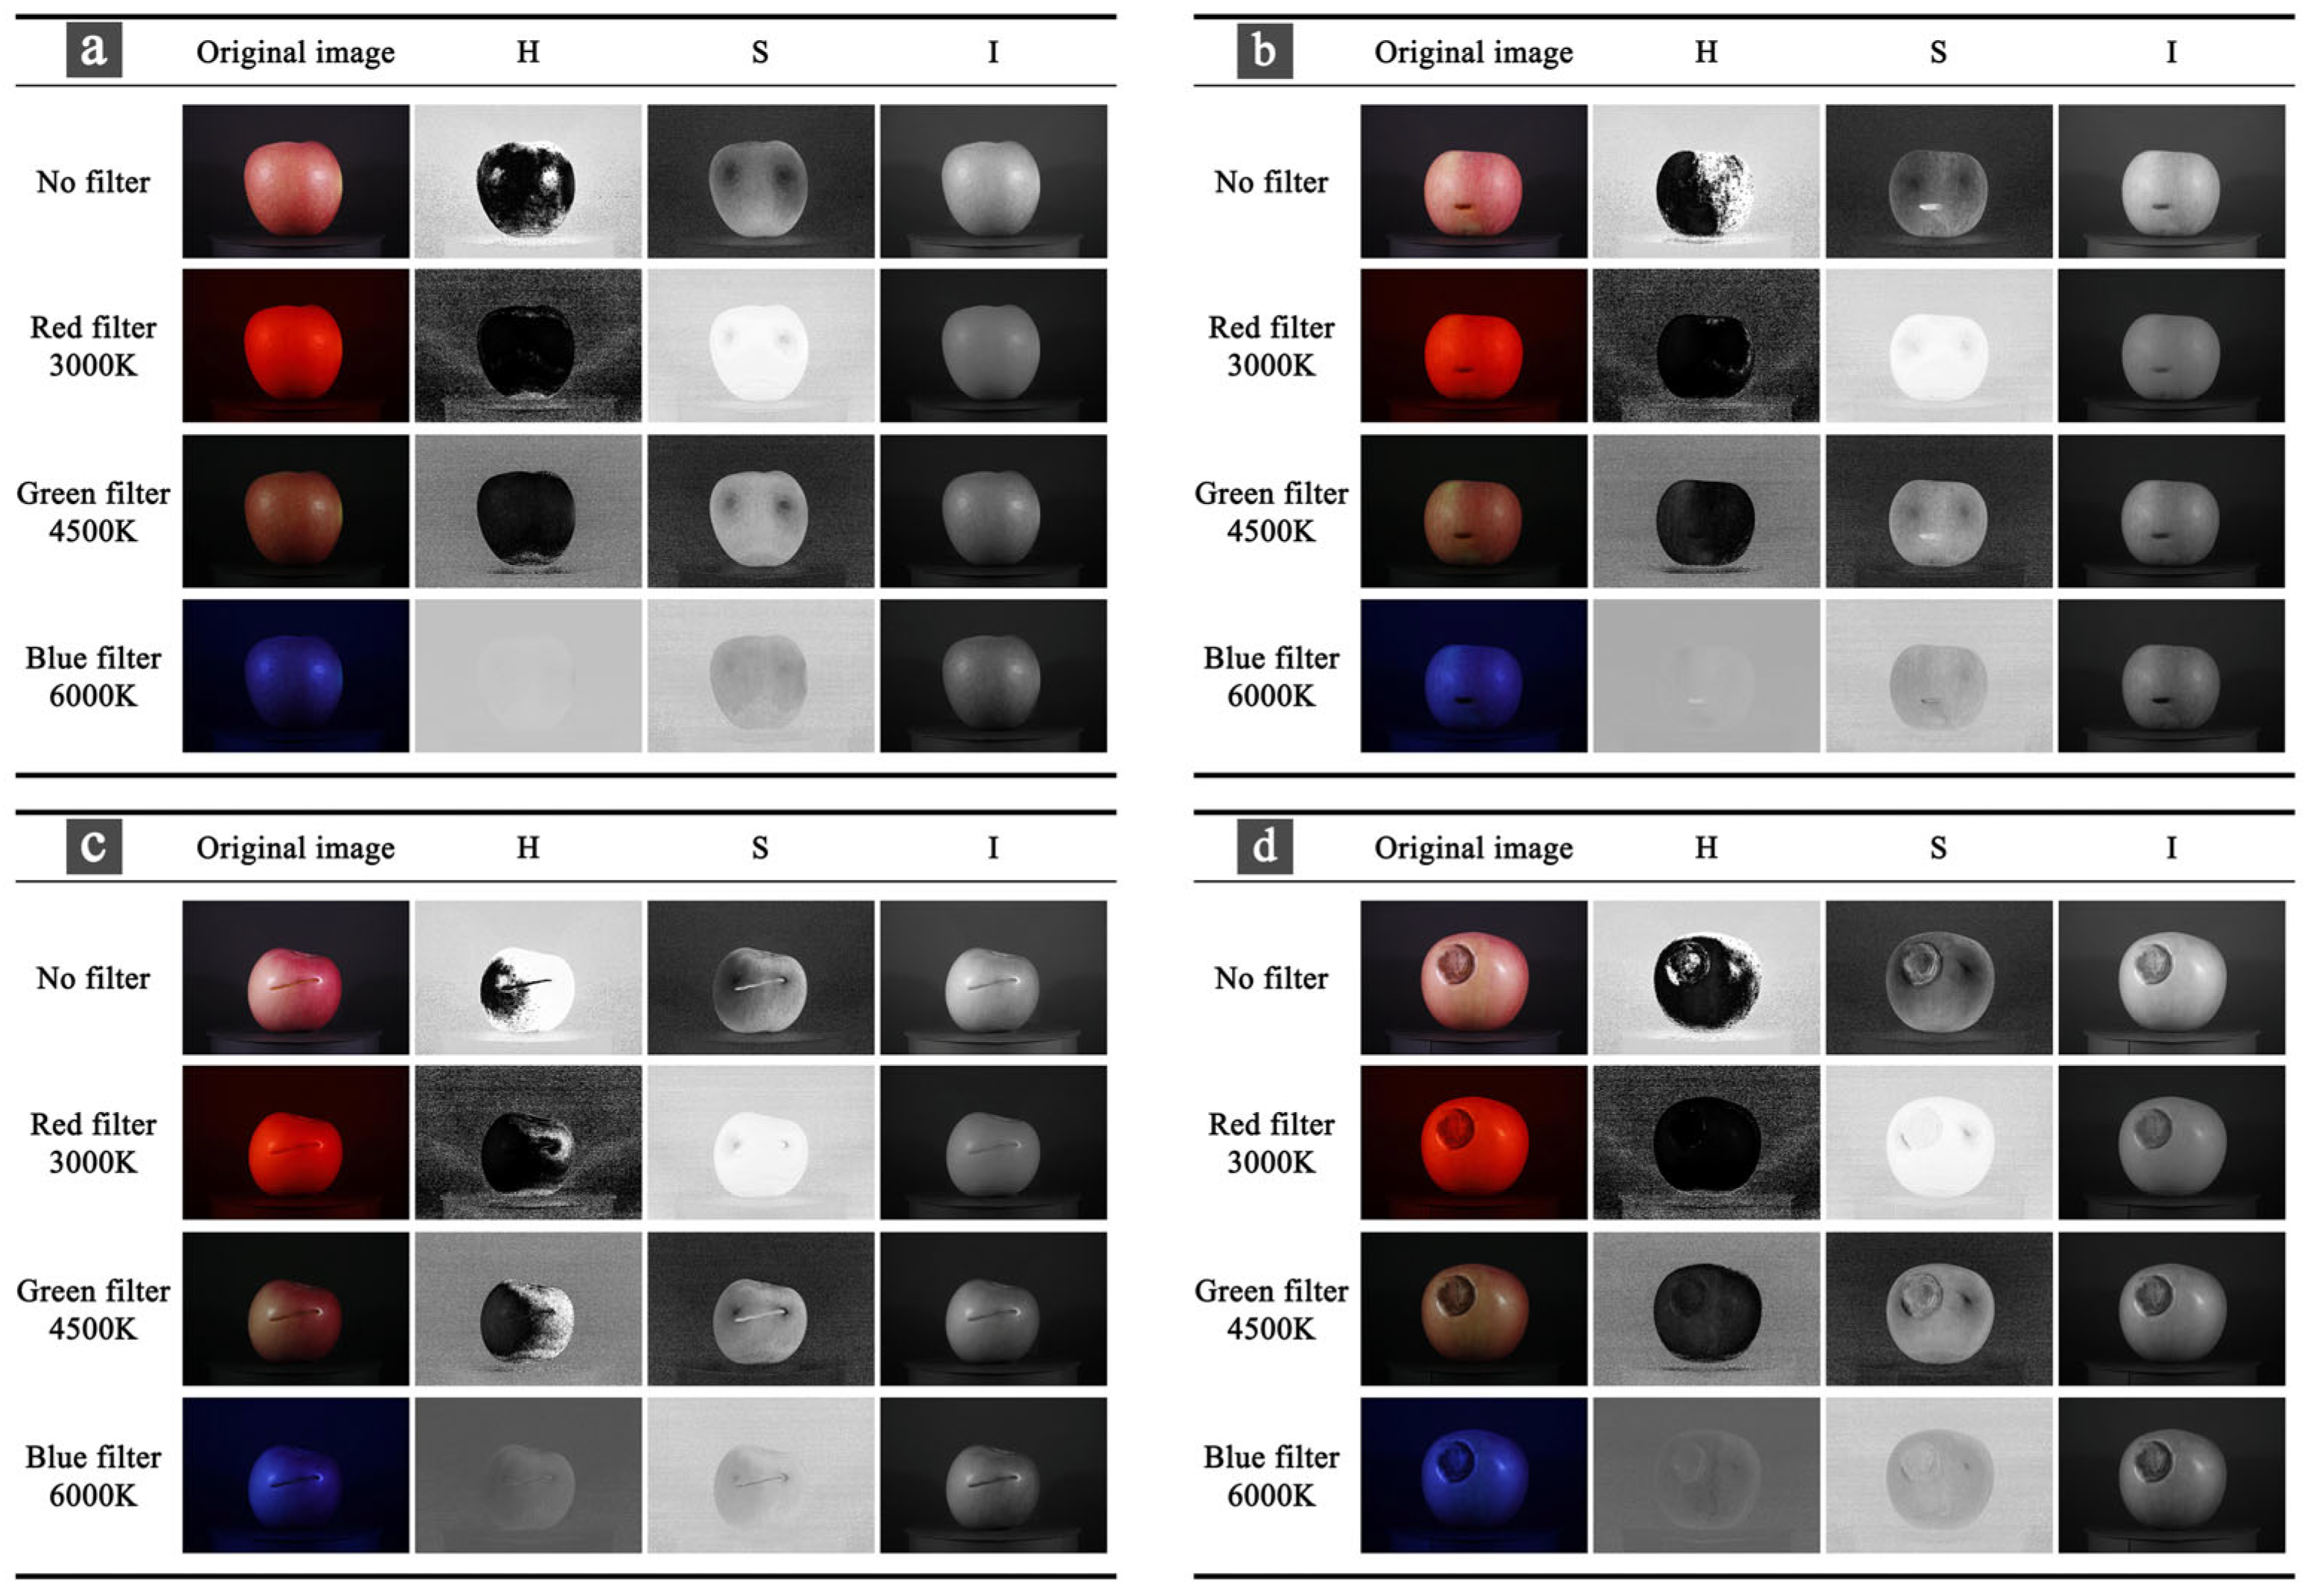
As illustrated in Figure 5a,b, the HSI representation enhances chromatic differentiation, particularly under green filtering and 4500 K illumination. Compared with RGB, the HSI model exhibits greater resilience to illumination variations and improves the visibility of surface defects through more distinct hue–intensity separation.
The LAB color model, standardized by the International Commission on Illumination (CIE), emphasizes perceptual uniformity and device independence [40]. It encodes lightness (L) and two opponent color channels: red–green (A) and yellow–blue (B). The conversion from RGB to LAB is achieved via an intermediate XYZ color space transformation, as defined in Equations (6)–(8):
X Y Z = 0.4124 0.3576 0.1805 0.2126 0.7152 0.0722 0.0193 0.1192 0.9505 R G B
Convert the XYZ value to the LAB value. The conversion formula is shown in Equation (7):
L = 116 × f ( Y Y n ) 16 A = 500 × f ( X X n ) f ( Y Y n ) B = 200 × f ( Y Y n ) f ( Z Z n )
Among them, Xn, Yn, and Zn are reference white points, and their standard values are: Xn = 0.9505, Yn = 1.0000, Zn = 1.0890. The nonlinear compensation function is shown in Formula (8):
f ( t ) = t 1 3 , t > δ 3 1 3 δ 2 t + 4 29 , t δ 3
Among them, δ = 6/29. Through these related conversion methods, the final values of L, A, and B can be obtained.
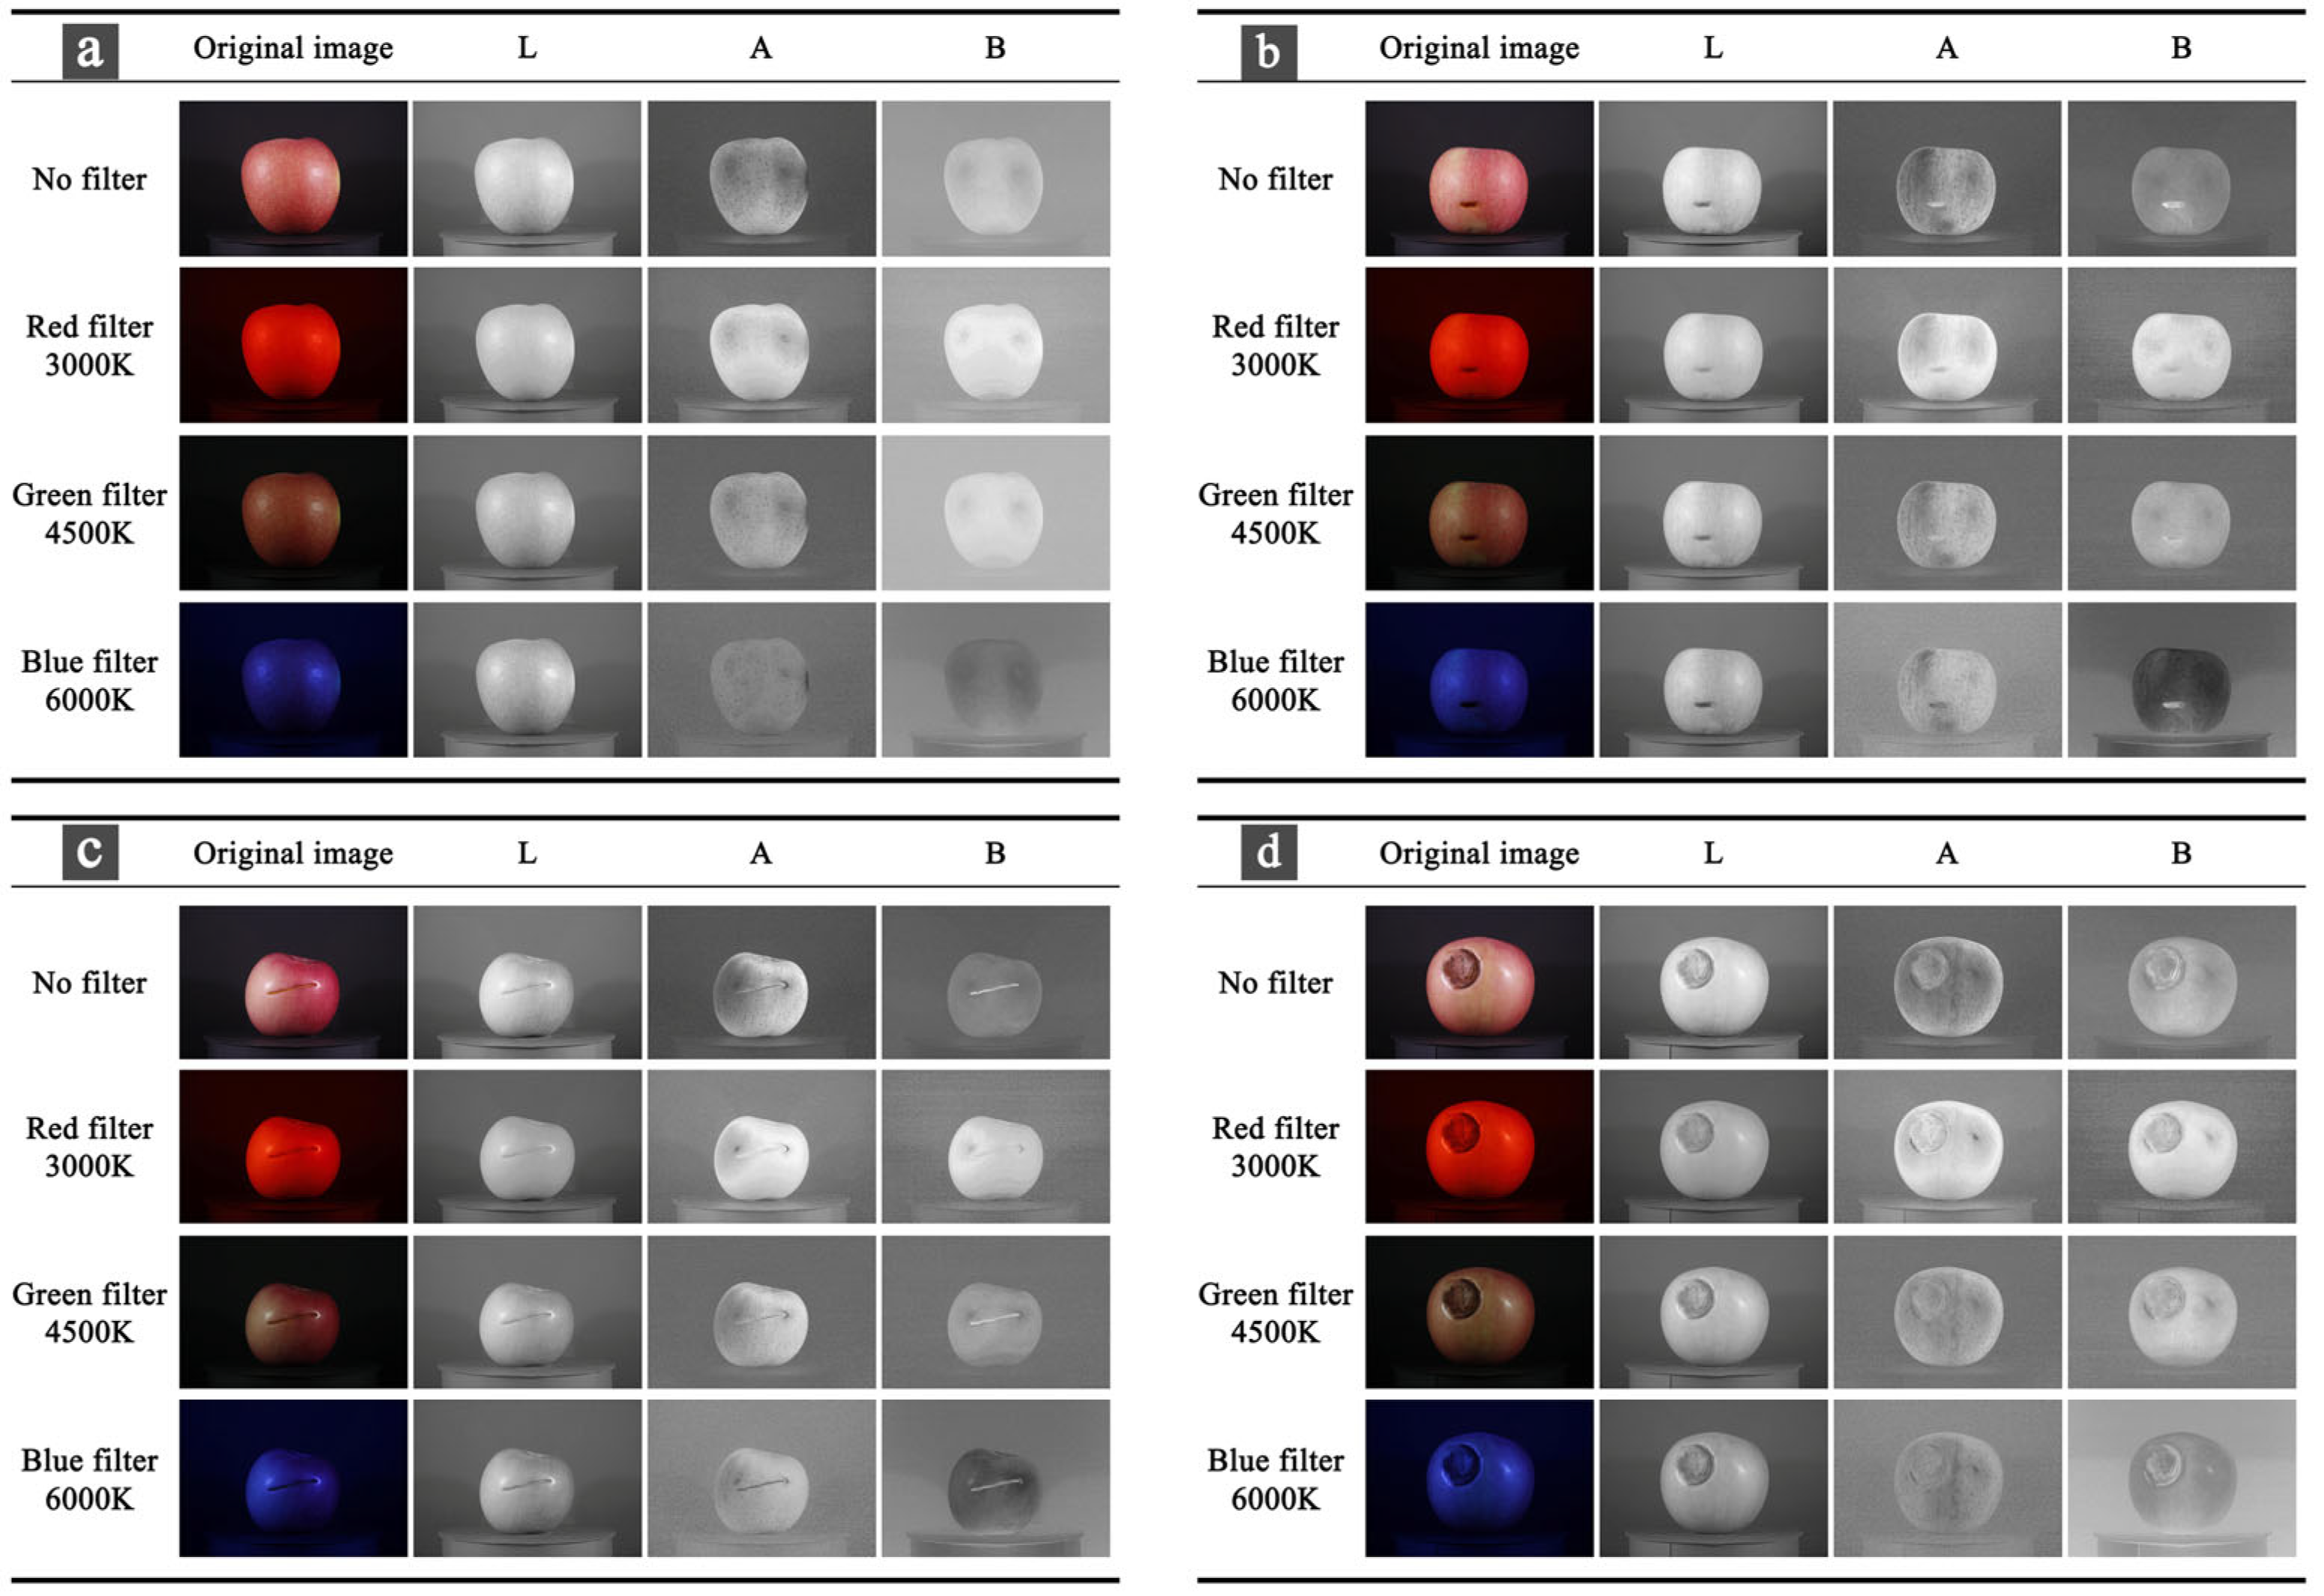
As shown in Figure 6, the LAB color space exhibits superior feature separability, particularly when combined with the red filter under 3000 K illumination. This configuration enhances surface brightness, suppresses background noise, and produces more distinct boundary contours. Compared with RGB and HSI, the LAB model more accurately reflects human perceptual differences in brightness and color, rendering it particularly advantageous for precise defect localization and classification.

2.4. Apple Damage Detection Methods

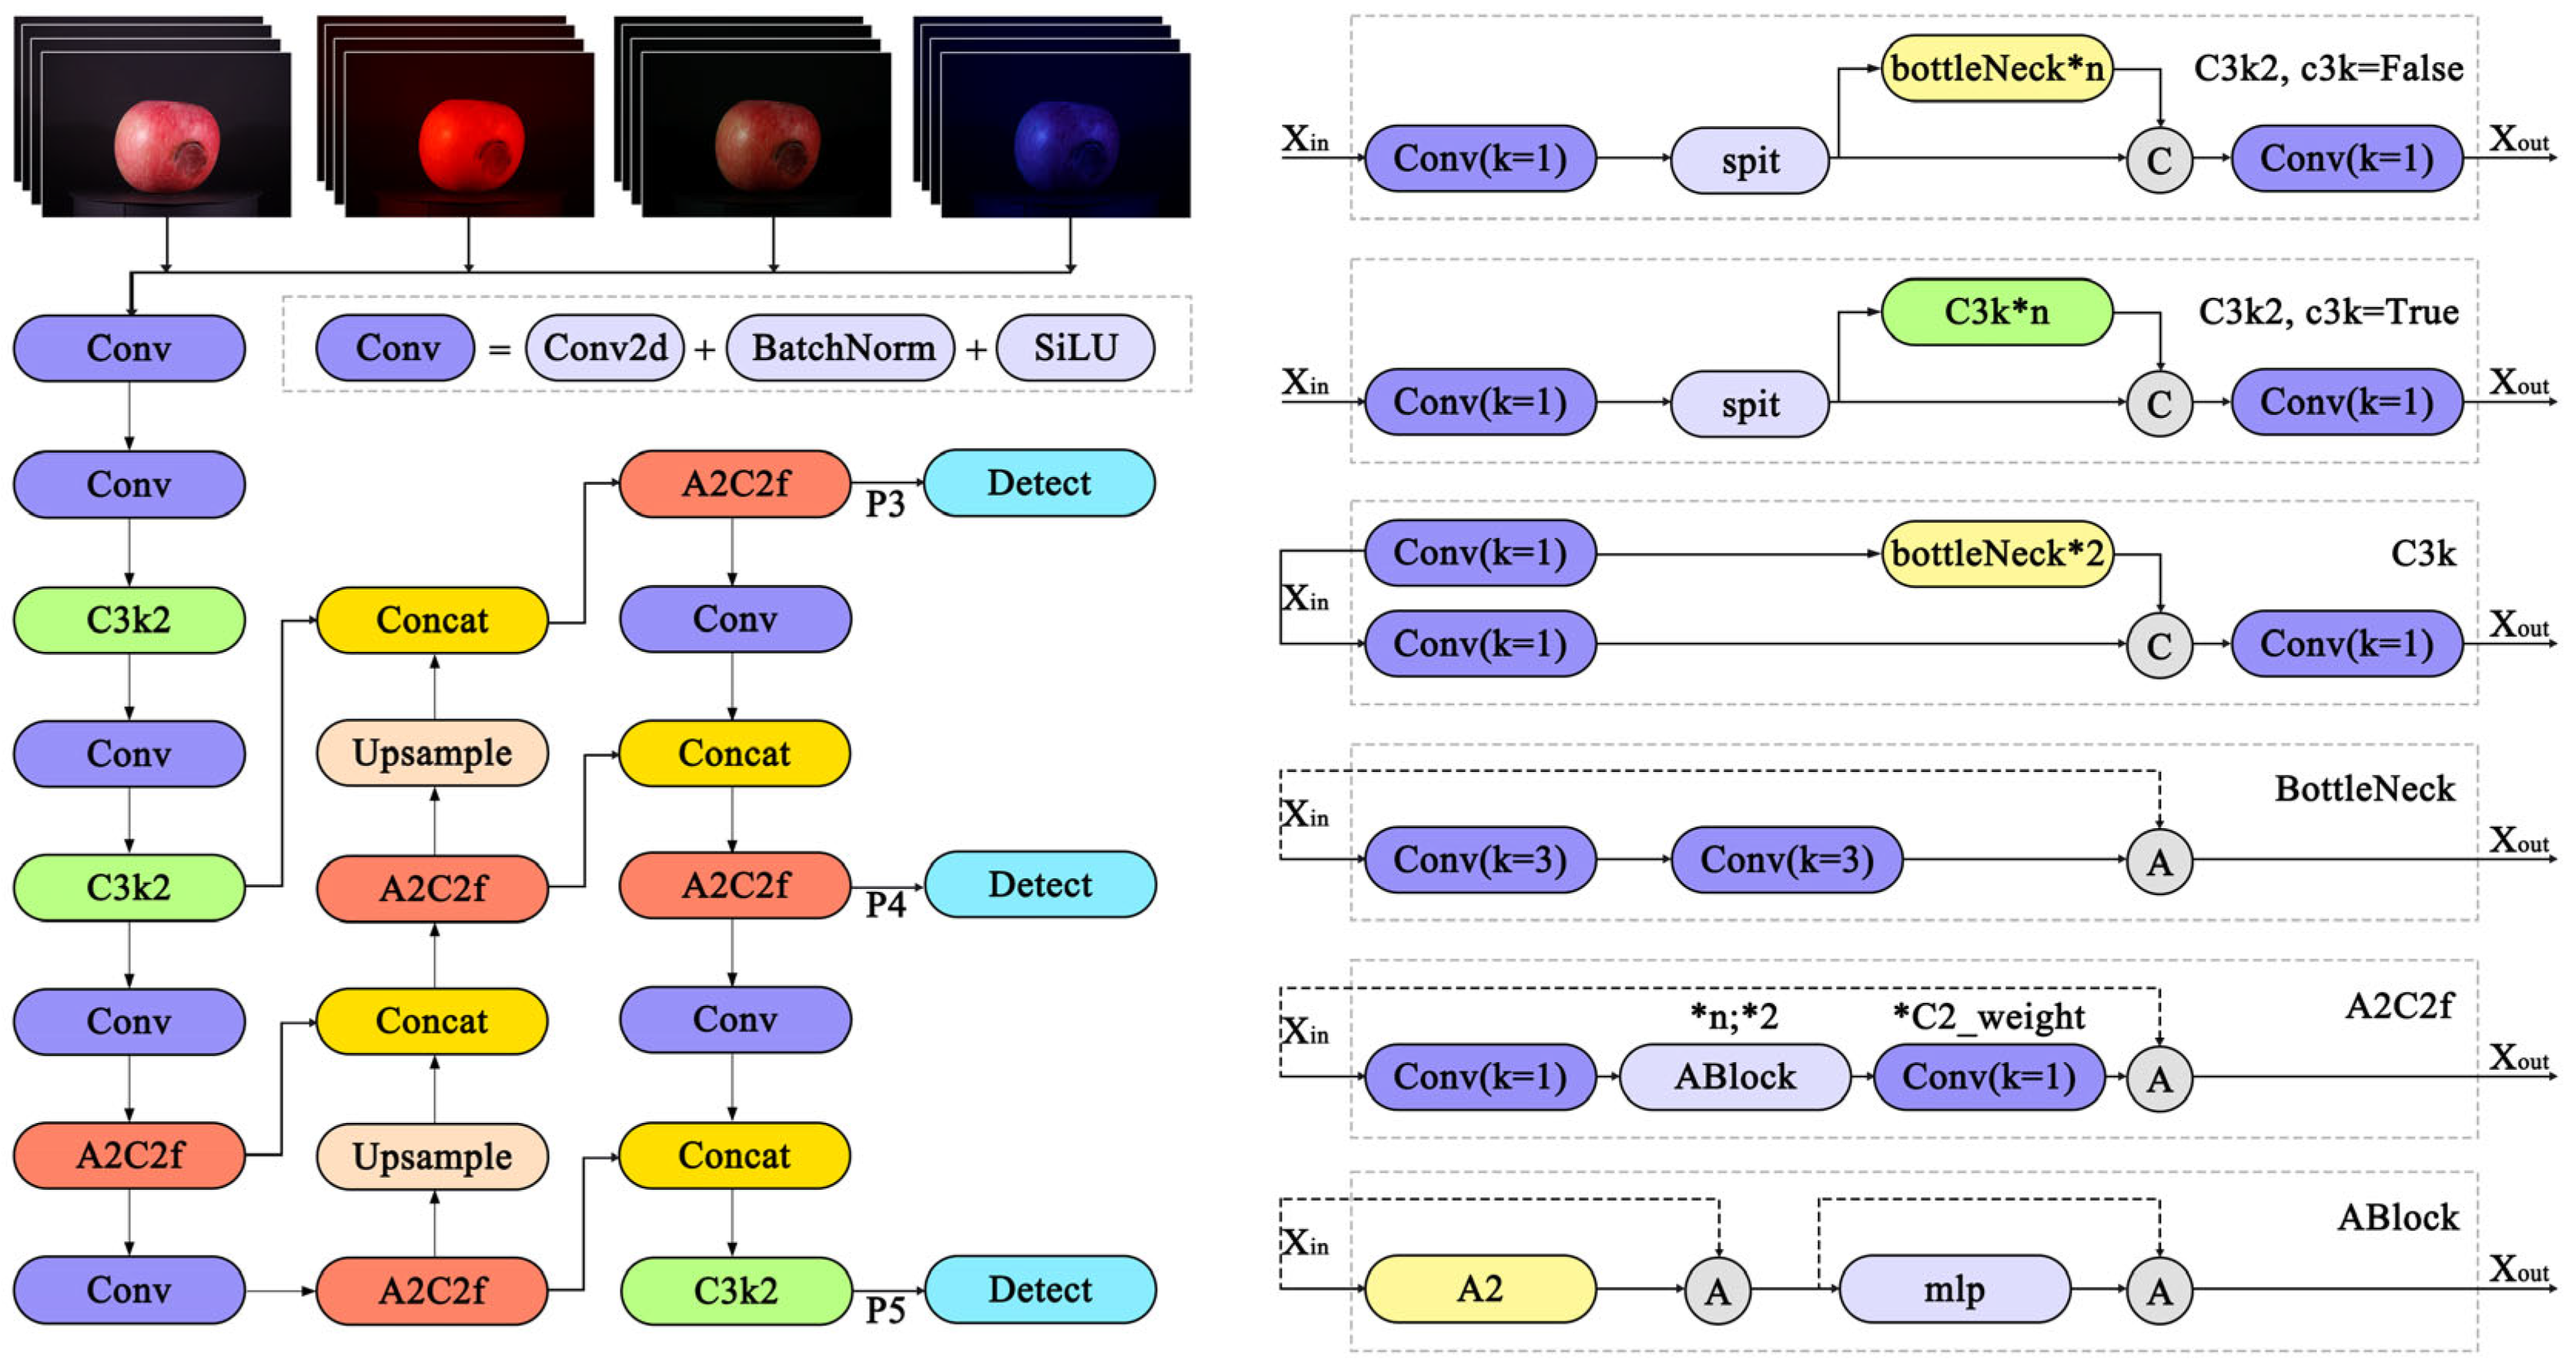
YOLOv12, as an advanced single-stage object detection model within the YOLO family, refines both architecture and performance on the foundation of its predecessors. Its framework comprises three core components: the backbone, the neck, and the detection head. The backbone integrates an enhanced C2f-Lite module with a dynamic attention mechanism to improve the efficiency of apple defect feature extraction. The neck employs BiFPN for cross-scale feature fusion, thereby strengthening the recognition of small-scale defects such as fine scratches. The detection head incorporates a decoupled design alongside an improved CIoU loss function to increase the precision of defect classification and localization. Furthermore, it supports lightweight deployment and offers broad compatibility across hardware platforms, delivering an efficient and practical solution for apple defect detection.
The experimental platform is equipped with a 13th-generation Intel® Core™ i7-13700H processor and a high-performance NVIDIA GeForce RTX 4060 laptop GPU with 8 GB of dedicated memory, ensuring stable and efficient model training. The system runs on Windows 11, utilizes the PyTorch 1.12 deep learning framework, and employs Python 3.8 as the primary programming language. Model training requires pairing each original image with its corresponding apple annotation. For this purpose, damaged regions were labeled using the LabelImg tool, and the annotations were subsequently converted into .txt format for efficient training. Apple defect detection is an object inspection task involving both apple localization and defect classification (intact, scratched, punctured, rotten). In this study, YOLOv12-s was adopted as the baseline model (Figure 7), employing an optimized single-stage design for end-to-end recognition [41,42]. Its architecture comprises a backbone for feature extraction, a BiFPN neck for cross-scale fusion, and a decoupled detection head designed to improve CIoU loss. The model was initialized with COCO 2017 pre-trained weights and trained using the Adam optimizer with a composite loss function combining cross-entropy, improved CIoU, and binary cross-entropy. Data augmentation strategies included random flipping and brightness/contrast adjustment. Training was performed with an initial learning rate of 0.01, batch size of 16, momentum of 0.937, and mixed-precision computation. An early stopping strategy was applied, terminating training if mAP50-95 failed to improve over 10 consecutive validations. The model was trained for 120 epochs, with validation conducted after each epoch.
To systematically assess the influence of filter imaging and color space conversion on detection performance, an ablation study was conducted. The experiment examined the individual effects of single filters (red, green, blue), single color space transformations (RGB, HSI, LAB), and their combination strategies using the control variable method. YOLOv12 was employed as the unified baseline model to ensure consistency in training parameters, including learning rate, batch size, and mixed-precision settings. By comparing Precision, Recall, mAP, and FPS across different configurations, the independent contributions and synergistic benefits of each module were quantified, thereby establishing a foundation for selecting the optimal detection strategy.

2.5. Evaluation Methods

To assess object detection performance, this study employs Precision, Recall, and mean Average Precision (mAP) as primary evaluation metrics, supplemented by Accuracy and F1-score as auxiliary indicators. Adhering strictly to the COCO dataset standards, mAP@50 and mAP@95 are selected, reflecting their widespread adoption in computer vision and related disciplines. The calculation methods for Precision, Recall, Accuracy, and F1-score [43] are detailed in Formulas (9)–(12):
P r e c i s i o n = T P T P + F P
R e c a l l = T P T P + F N
A c c u r a c y = T P + T N T P + T N + F P + F N
F 1 s c o r e = 2 × ( P r e c i s i o n × R e c a l l ) P r e c i s i o n + R e c a l l
where TP denotes the number of true positives in the positive category, FN represents the number of false negatives in the positive category, FP indicates the number of false positives in the negative category, and TN refers to the number of true negatives in the negative category.
MAP represents the area under the Precision-Recall curve, serving as a comprehensive performance metric that averages the average precision across all categories. mAP@50 denotes the mean average precision at an Intersection over Union (IoU) threshold of 0.5. In contrast, mAP@50-95 employs a more stringent evaluation by computing average precisions at multiple IoU thresholds—from 0.5 to 0.95 in increments of 0.05—and averaging these values. This approach offers a more thorough assessment of the model’s detection capabilities. The calculation formulas are presented in Equations (13) and (14):
m A P 50 = 1 N i = 1 N A P i
m A P 50 95 = 1 N i = 1 N 1 10 j = 1 10 A P i , j
N denotes the total number of categories, while APi represents the average precision of the i-th category. APi,j refers to the average precision for the i-th category at the j-th IoU threshold.
Furthermore, to assess the model’s real-time performance, this study incorporates Frames Per Second (FPS) as an additional metric [44,45], defined as the number of images processed by the model per second. FPS is calculated by continuously processing test images on the experimental platform and averaging the time consumed, thereby reflecting the method’s practical applicability in industrial settings. As expressed in Formula (15):
F P S = 1000 P r o c e s s i n g   T i m e
Here, the unit of FPS is fps, representing “frames per second,” a quantifiable measure of processing speed. Processing Time encompasses the total duration for preprocessing, inference, loss computation, and postprocessing per image.

3. Results

To validate the proposed YOLOv12-based method for apple defect detection, comparative experiments were conducted against YOLOv9s, YOLOv10s, and YOLOv11s under a unified parameter configuration. The “Red Fuji” dataset, comprising 1600 images across four defect categories, was partitioned into training, validation, and testing sets in a 7:1:2 ratio by individual apples to prevent data leakage. As presented in Table 3, YOLOv12s consistently outperformed the other models. Its overall mAP50-95 (79.6%) exceeded that of YOLOv11s (70.1%), YOLOv10s (66.2%), and YOLOv9s (63.3%) by 9.5, 13.4, and 16.3 percentage points, respectively. Even for the “Rot” defect, which exhibited the weakest performance under the single-filter evaluation, YOLOv12s achieved an mAP50-95 of 64.6%, surpassing YOLOv11s and YOLOv9s by 4.3 and 12.2 percentage points, respectively, thereby demonstrating its robustness in capturing irregular defect features. In terms of efficiency, YOLOv12s attained a processing speed of 10.52 FPS, which is 0.4 and 1.27 times faster than YOLOv11s (10.12 FPS) and YOLOv9s (9.25 FPS), respectively, fulfilling the real-time application requirements of apple defect detection in industrial sorting lines as outlined in this study.

3.1. Comparison of Model Results Under Four Filtered Datasets

As illustrated in Figure 8, the LabelImg tool was employed to annotate the Scratch areas without applying color conversion. The model demonstrated stable performance across varying lighting conditions, with results summarized in Table 4. In the Original (No filter) model, the average precision reached 99.4%, recall was 97.5%, mAP50 stood at 98.6%, mAP50-95 at 79.6%, and processing speed was 10.52 fps. Among the categories, the Intact class achieved the highest mAP50-95 of 98.8%, while the Rot category registered the lowest at 64.6%. Comparing filter conditions: under the red filter, overall performance slightly declined relative to the Original dataset, with mAP50-95 at 76.8%, and the Scratch category performing worst at 64%; processing speed decreased by 2.26 fps. The green filter exhibited the best results, achieving mAP50-95 of 82.7% (88.2% for Puncture), with a processing speed 0.26 fps faster than the Original. Notably, detection accuracy for both Scratch and Rot improved under this filter. Conversely, the blue filter underperformed relative to the Original dataset (mAP50-95 of 77.8%), with the Scratch category exhibiting the lowest mAP50-95 among all categories and the slowest processing speed (6.74 fps). Overall, Puncture defects were more readily detected under green and Original (No filter) conditions, whereas Rot detection was more pronounced with the red filter, indicating that wavelength-specific light enhancement plays a critical role in optimizing defect feature recognition [46]. Additionally, processing speed varied significantly across filters, with the green filter offering a clear advantage in balancing detection performance and computational efficiency.

3.2. Comparison of Model Results of RGB Channels Under Four Filtering Conditions

Compared to individual lighting modes, the RGB channel combination optimizes performance across multiple key metrics. As detailed in Table 5, under the No filter RGB (O-RGB) condition—where only RGB color space conversion is applied without filters—the average precision reached 98.9%, marginally lower than the 99.4% observed in the original No filter (O) mode. However, recall significantly improved to 99.6%, and mAP50-95 attained 79.8%. Processing speed measured 13.33 fps, yielding a more balanced overall performance. In the red filter RGB (R-RGB) mode, accuracy increased to 99.3%, while mAP50 slightly declined to 99.0%, resulting in more stable detection performance. The green filter RGB (G-RGB) mode exhibited the best outcomes (Figure 9), maintaining a high average precision of 98.8% and recall of 98.5%, with mAP50-95 rising to 83.1% alongside an elevated processing speed of 15.15 fps. This configuration ensured enhanced detection stability and superior computational efficiency. Although the blue filter RGB (B-RGB) mode showed slightly lower accuracy at 98.5%, it achieved a recall of 99.5%, mAP50-95 of 80.8%, and processing speed of 11.83 fps, demonstrating robust localization capability while preserving high recall. Overall, relative to combination modes lacking color conversion, the G-RGB mode significantly enhances detection accuracy, narrows performance disparities among channels, and offers marked advantages in computational efficiency. These findings underscore that integrating RGB channels effectively improves the stability and speed of apple surface defect detection under complex lighting conditions.

3.3. Comparison of Model Results of HSI Channels Under Four Filtering Conditions

The detection performance under HSI conditions exhibits a relatively low recognition rate for apple defects. As presented in Table 6, the No filter HSI (O-HSI) mode—applying only color space conversion without filters—achieves an average precision of 97.5%, an average recall of 95.3%, with mAP50 and mAP50-95 values of 97.8% and 76.6%, respectively, and a processing speed of 6.87 fps. In the red filter HSI (R-HSI) mode, average precision, recall, and mAP50-95 register at 98.7%, 90.3%, and 73.3%, respectively, indicating relatively modest recognition performance; however, it attains the highest processing speed of 10.78 fps among the four modes. The green filter HSI (G-HSI) mode demonstrates more balanced results (Figure 10), with an average recall rate exceeding R-HSI by 2%, an mAP50-95 of 79.1%—the highest among the HSI conditions—and a processing speed of 7.30 fps. The blue filter HSI (B-HSI) mode slightly outperforms R-HSI in recall and precision by 0.07% and 0.017%, respectively, and achieves an mAP50-95 of 78.5%, marginally surpassing both O-HSI and R-HSI. Overall, compared to the conventional RGB mode, the mAP50-95 metric under HSI conditions decreases by an average of 3.45%.

3.4. Comparison of Model Results of LAB Channels Under Four Filtering Conditions

As detailed in Table 7 and Figure 11, all four channels within the LAB model demonstrate superior detection performance. Specifically, in the No filter LAB (O-LAB) mode, color space conversion yields an average precision of 99.0% and an mAP50 of 98%, slightly surpassing the corresponding values in the O-HSI mode, with a processing speed of 10.60 fps. Under the red filter LAB (R-LAB) condition, the average mAP50-95 improves by 0.9% and 5.2% relative to the R-RGB and R-HSI modes, respectively, achieving the highest mAP50-95 of 78.5% among red filter color space conversions. While exhibiting robust target coverage, this mode registers the slowest processing speed at 6.70 fps. The green filter LAB (G-LAB) mode delivers balanced metrics, with an accuracy of 98.6%, recall of 98%, mAP50 of 99%, mAP50-95 of 81.8%, and a processing speed of 10.60 fps, representing the most comprehensive performance within the LAB configurations. Although the blue filter LAB (B-LAB) mode attains the highest accuracy of 99.4%, its other metrics slightly trail those of G-LAB, coupled with a relatively modest processing speed of 7.69 fps. Overall, compared to the HSI mode, the LAB mode exhibits an average increase of 2.1% in mAP50-95 and an average processing speed gain of 1.36 fps. Conversely, relative to the RGB mode, the LAB mode shows an average mAP50-95 decrease of 3.7% and a processing speed reduction of 3.85 fps.

3.5. Comparison of Model Results of Green Filters in Four Color Spaces

The overall experimental results indicate that single-module optimization yields limited gains: employing only the green filter (G mode) achieves an mAP50-95 of 82.7%, representing a 3.1% improvement over the No filter original mode (79.6%), thereby confirming the enhancement effect of the green filter on defect features. In contrast, isolated color space conversion—exemplified by the No filter RGB mode (O-RGB, 79.8%)—produces less than a 0.2% increase compared to the original mode, underscoring the limited efficacy of standalone color space transformations. Consequently, this study prioritizes the synergistic interaction between the green filter and various color space conversions, systematically investigating their combined effects to identify the optimal detection strategy.
As presented in Table 8, the green channel exhibits the superior performance in apple defect detection. Specifically, the mAP50-95 in the G-RGB mode attains 83.1%, marginally surpassing both the G mode (82.7%) and G-LAB mode (81.8%), with a processing speed of 15.15 fps. This represents a 40.5% increase over the G mode (10.78 fps) and outperforms G-HSI (7.30 fps) and G-LAB (12.11 fps), thereby reducing computational complexity while preserving critical information. This advantage stems from the high contrast inherent in the green band and underscores that combining the green filter with suitable color space conversions—such as RGB—effectively balances accuracy and speed, offering an optimized solution for practical deployment.
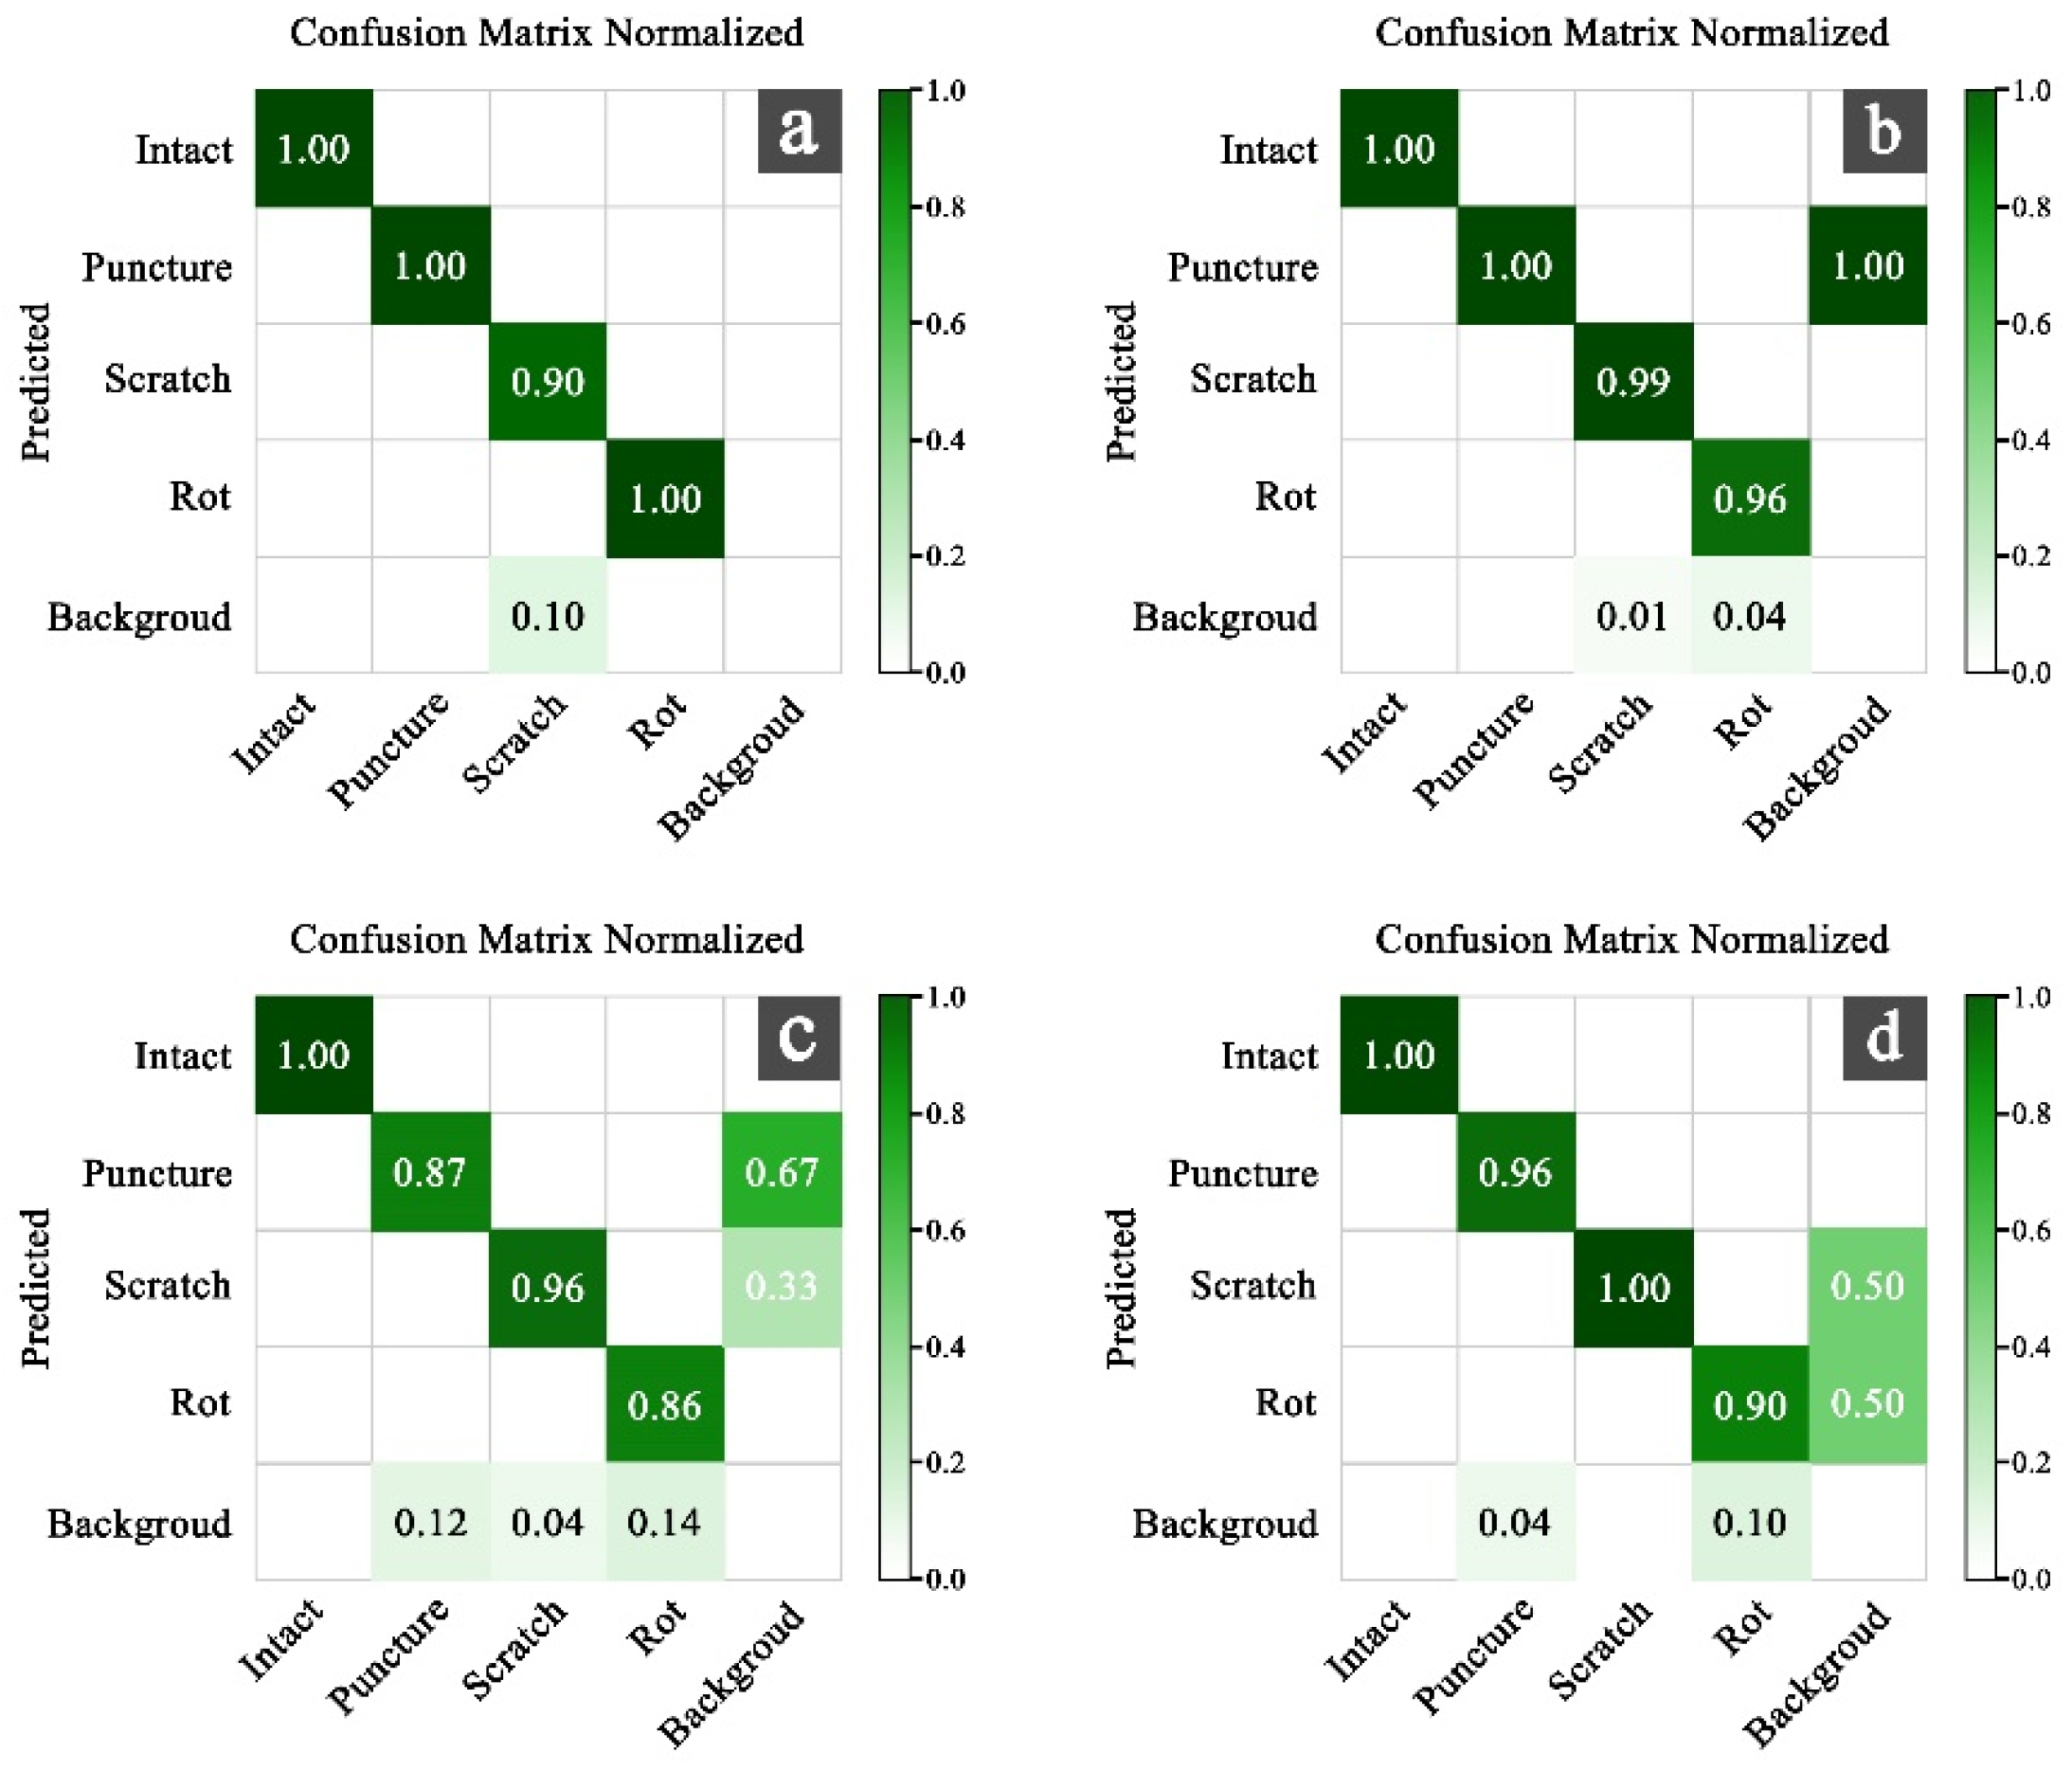
As illustrated in Figure 12, the confusion matrices of the four models under the green filter are analyzed based on category-specific recognition rates and overall accuracy: In the Original image, Intact, Puncture, and Rot categories are flawlessly identified (recognition rate of 1.0), whereas Scratch achieves a lower recognition rate of 0.9. Under the RGB channel, Intact, Puncture, and Rot maintain perfect recognition, with Scratch improving slightly to 0.96. Conversely, the HSI channel yields recognition rates of only 0.87 and 0.86 for Puncture and Rot, respectively, with overall accuracy dispersed and no categories perfectly recognized. The LAB channel achieves perfect identification for Intact and Scratch categories, while recognition rates for Puncture and Rot decline modestly to 0.96 and 0.90, respectively. These results indicate that the RGB channel offers the most comprehensive and balanced accuracy across all defect categories.
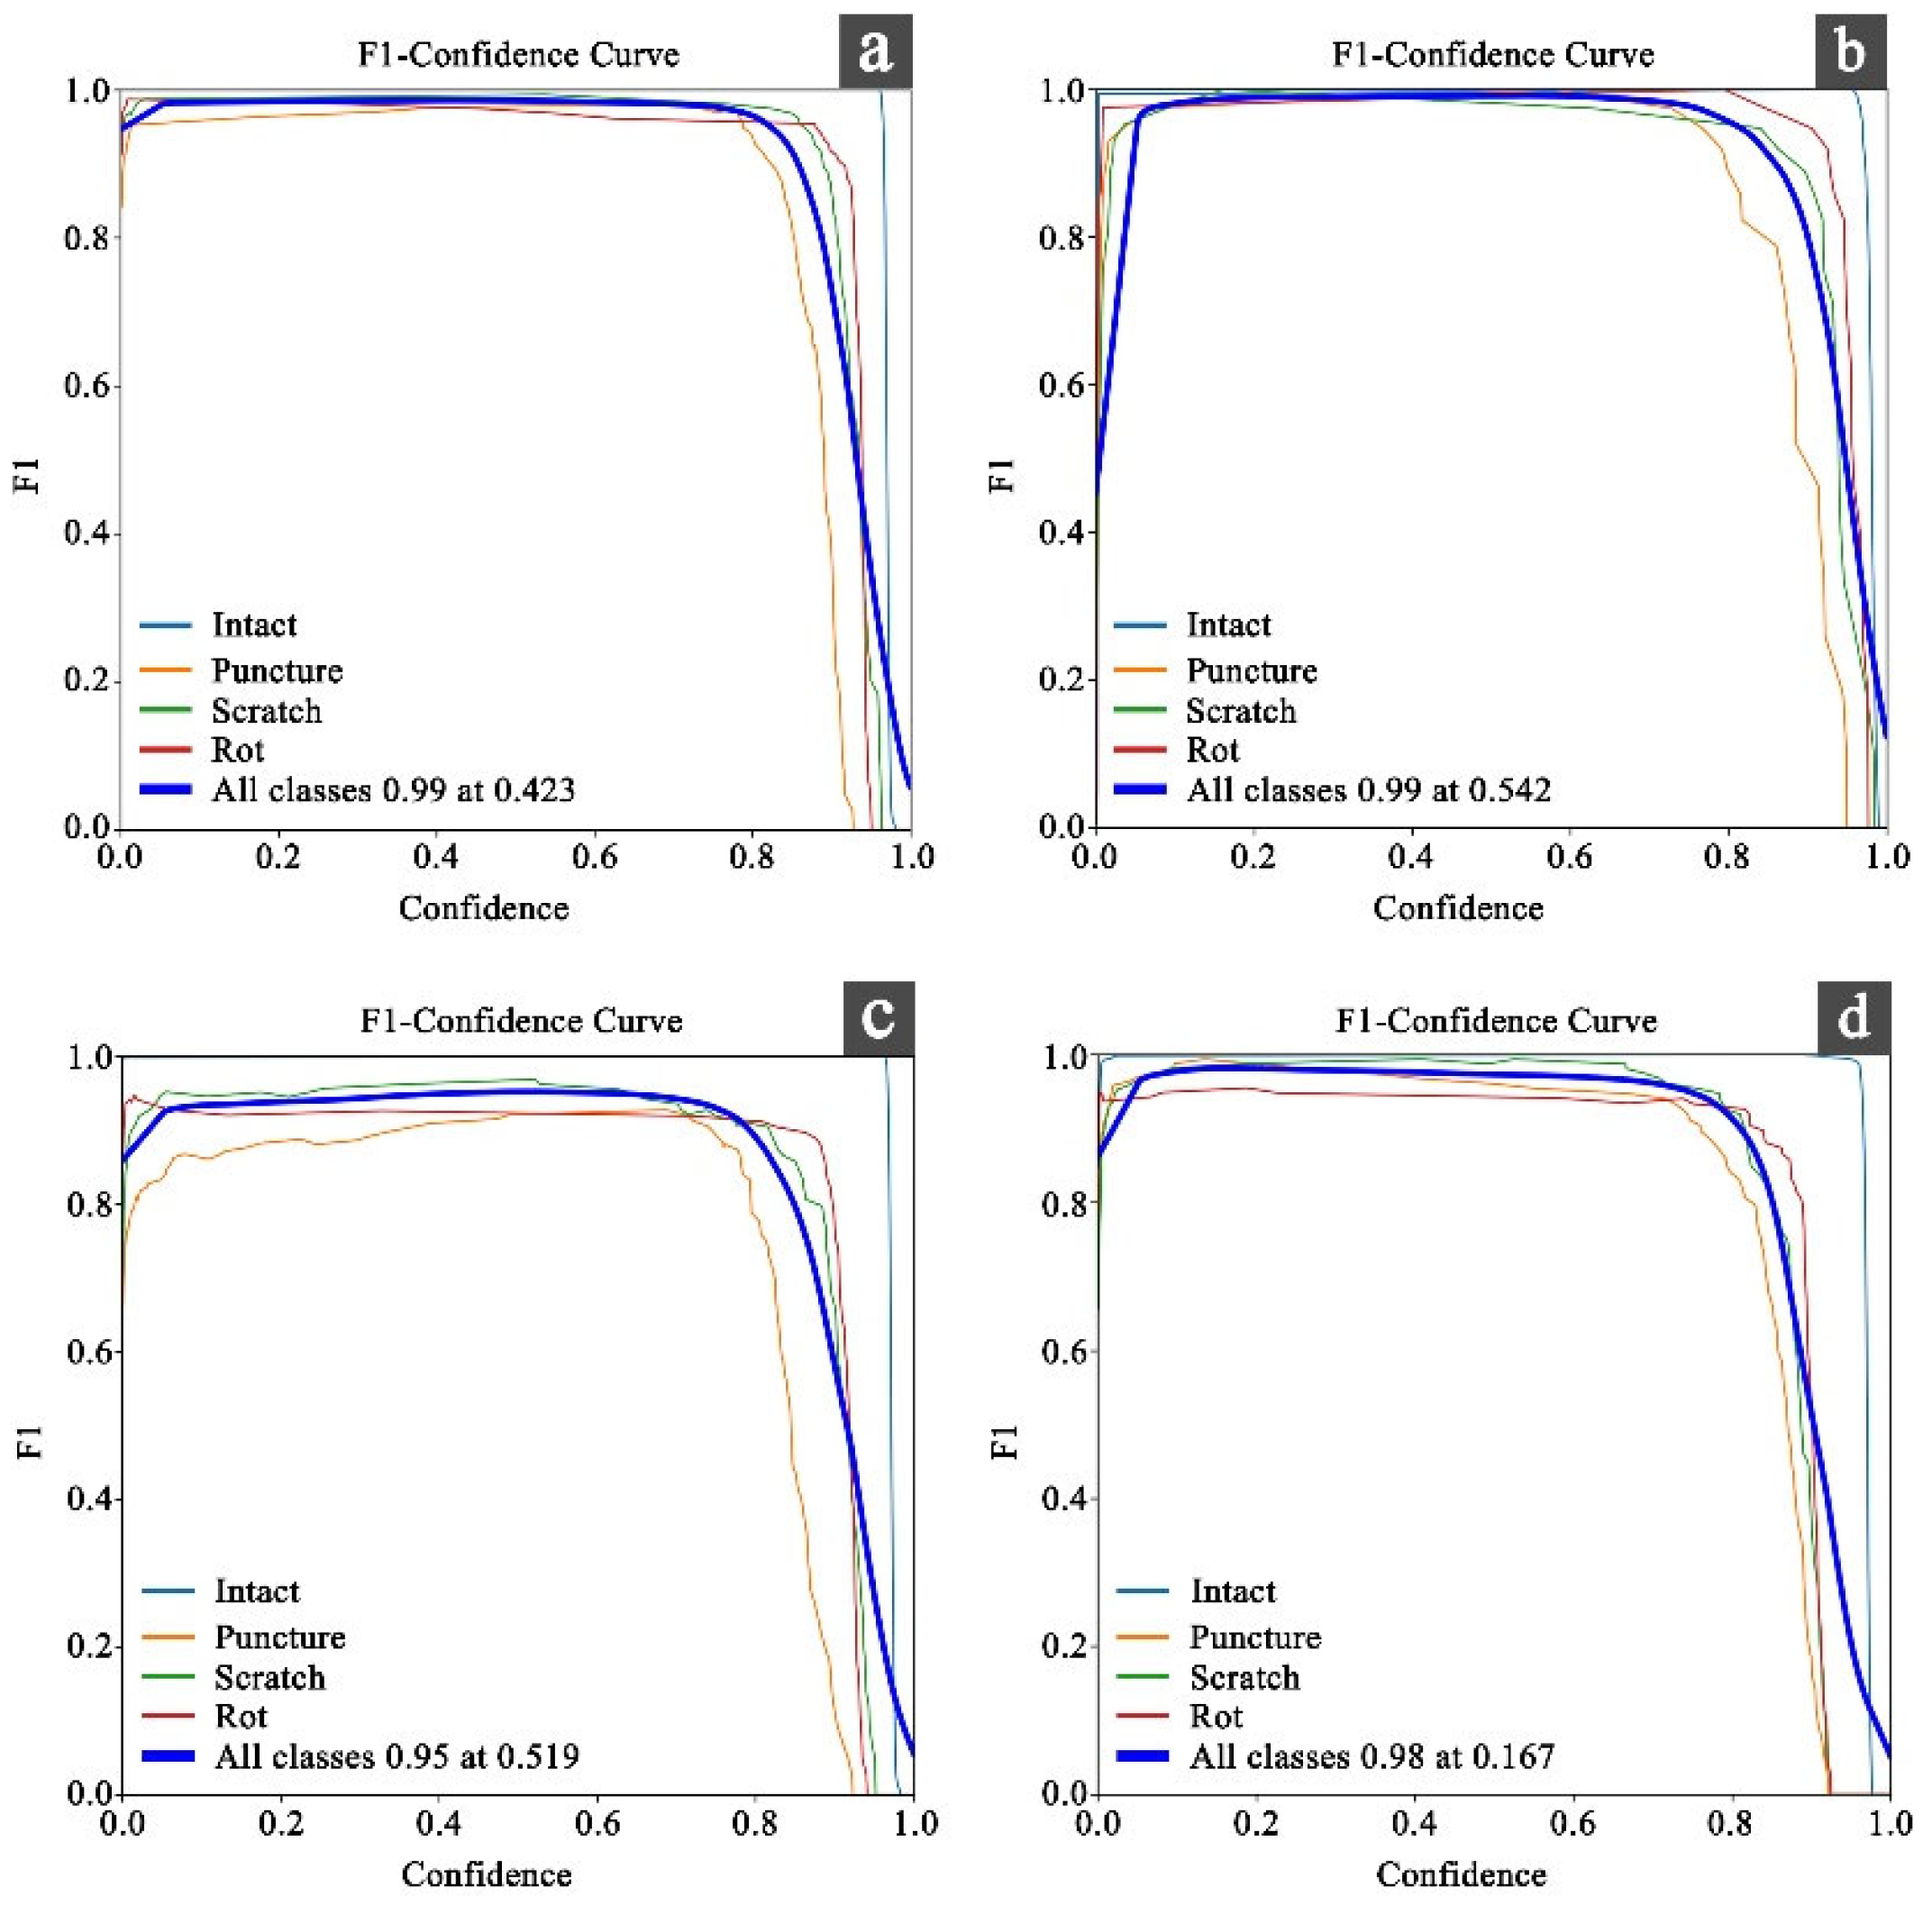
The F1-confidence curve—where the horizontal axis denotes the confidence level and the vertical axis represents the F1 score—evaluates the model’s performance across four defect categories: Intact, Scratch, Puncture, Rot, and the overall dataset under varying confidence thresholds. As depicted in Figure 13a, the F1 scores for each category and the aggregate rapidly approach nearly 1 at low confidence levels. Beyond approximately 0.8 confidence, the scores decline sharply, exhibiting a pattern of “initial steep rise, followed by a gradual decrease, and concluding with a pronounced drop.” Notably, at a confidence level of 0.99, the overall F1 score plummets to 0.423, indicating a marked reduction in model accuracy at high confidence thresholds. Figure 13b shows a similar trend but with a more prolonged period of high F1 maintenance; at 0.99 confidence, the F1 score is 0.542, reflecting superior overall performance relative to Figure 13a. In Figure 13c, the sustained high F1 interval ends earlier, around 0.7–0.8 confidence, with an F1 of 0.519 at 0.95 confidence, signaling an earlier onset of performance degradation. Figure 13d exhibits the poorest results, characterized by a brief high F1 maintenance phase followed by a steep decline; at 0.98 confidence, the F1 score drops sharply to 0.167, revealing the model’s limited classification stability on high-confidence samples and rapid deterioration in performance.
In summary, the four F1-confidence curves from Figure 13a–d uniformly demonstrate outstanding classification performance at low confidence thresholds. However, the onset and extent of F1 decline at elevated confidence levels vary, highlighting the differing trade-offs between confidence and accuracy across models or configurations. Notably, Figure 13b sustains superior performance within the high-confidence range, whereas Figure 13d exhibits the most pronounced attenuation.
Based on the comparative analysis of individual and combined models, Table 9 reveals the exceptional performance of the model under the G-RGB channel. The detection accuracy and recall rates achieved 98.8% and 98.5%, respectively, while mAP50 and MAP50-95 reached 98.9% and 83.1%. Among all categories, recognition of Intact and Scratch defects was most optimal, with the Scratch category attaining an MAP50-95 of 86.3%. Although the Recall for Puncture injuries was perfect at 100%, its Precision was comparatively lower at 95.4%, resulting in an MAP50-95 of only 64.4% and a slightly elevated false detection rate. For the Rot category, Precision reached 100%, but Recall was marginally lower at 95.3%, indicating some missed detections. Overall, the G-RGB model achieves a harmonious balance of high overall accuracy and robust category-wise recognition, confirming its superiority under green filter conditions.
To evaluate the generalizability of this method in open scenarios and further assess its effectiveness beyond self-constructed controlled datasets, we performed external validation using public apple defect datasets from the open-source repository (https://gitcode.com/open-source-toolkit/59276, accessed on 14 October 2025). The G-RGB model, which demonstrated the highest performance on the self-built dataset, was employed as the benchmark, with identical training and evaluation parameters to ensure comparability. The validation results of the G-RGB model on the public dataset are presented in Table 10. Overall, the external validation yielded an accuracy of 0.994, a recall of 0.975, an mAP50 of 0.986, and an mAP50-95 of 0.769 across 80 test images encompassing 140 defect instances. For the Puncture category, the model sustained high performance (Precision 0.997, Recall 1.0, mAP50 0.995, mAP50-95 0.986), consistent with its performance on the self-constructed dataset, effectively detecting prominent mechanical damage in open-field backgrounds. For Scratch, the model achieved Precision 0.992, Recall 1.0, mAP50 0.995, and mAP50-95 0.665, slightly lower than the 86.3% observed in controlled datasets, likely due to light-obscured fine textures. In the Rot category, it attained Precision 0.990, Recall 0.900, mAP50 0.958, and mAP50-95 0.780, with high Precision minimizing false detections of rot-like background features.
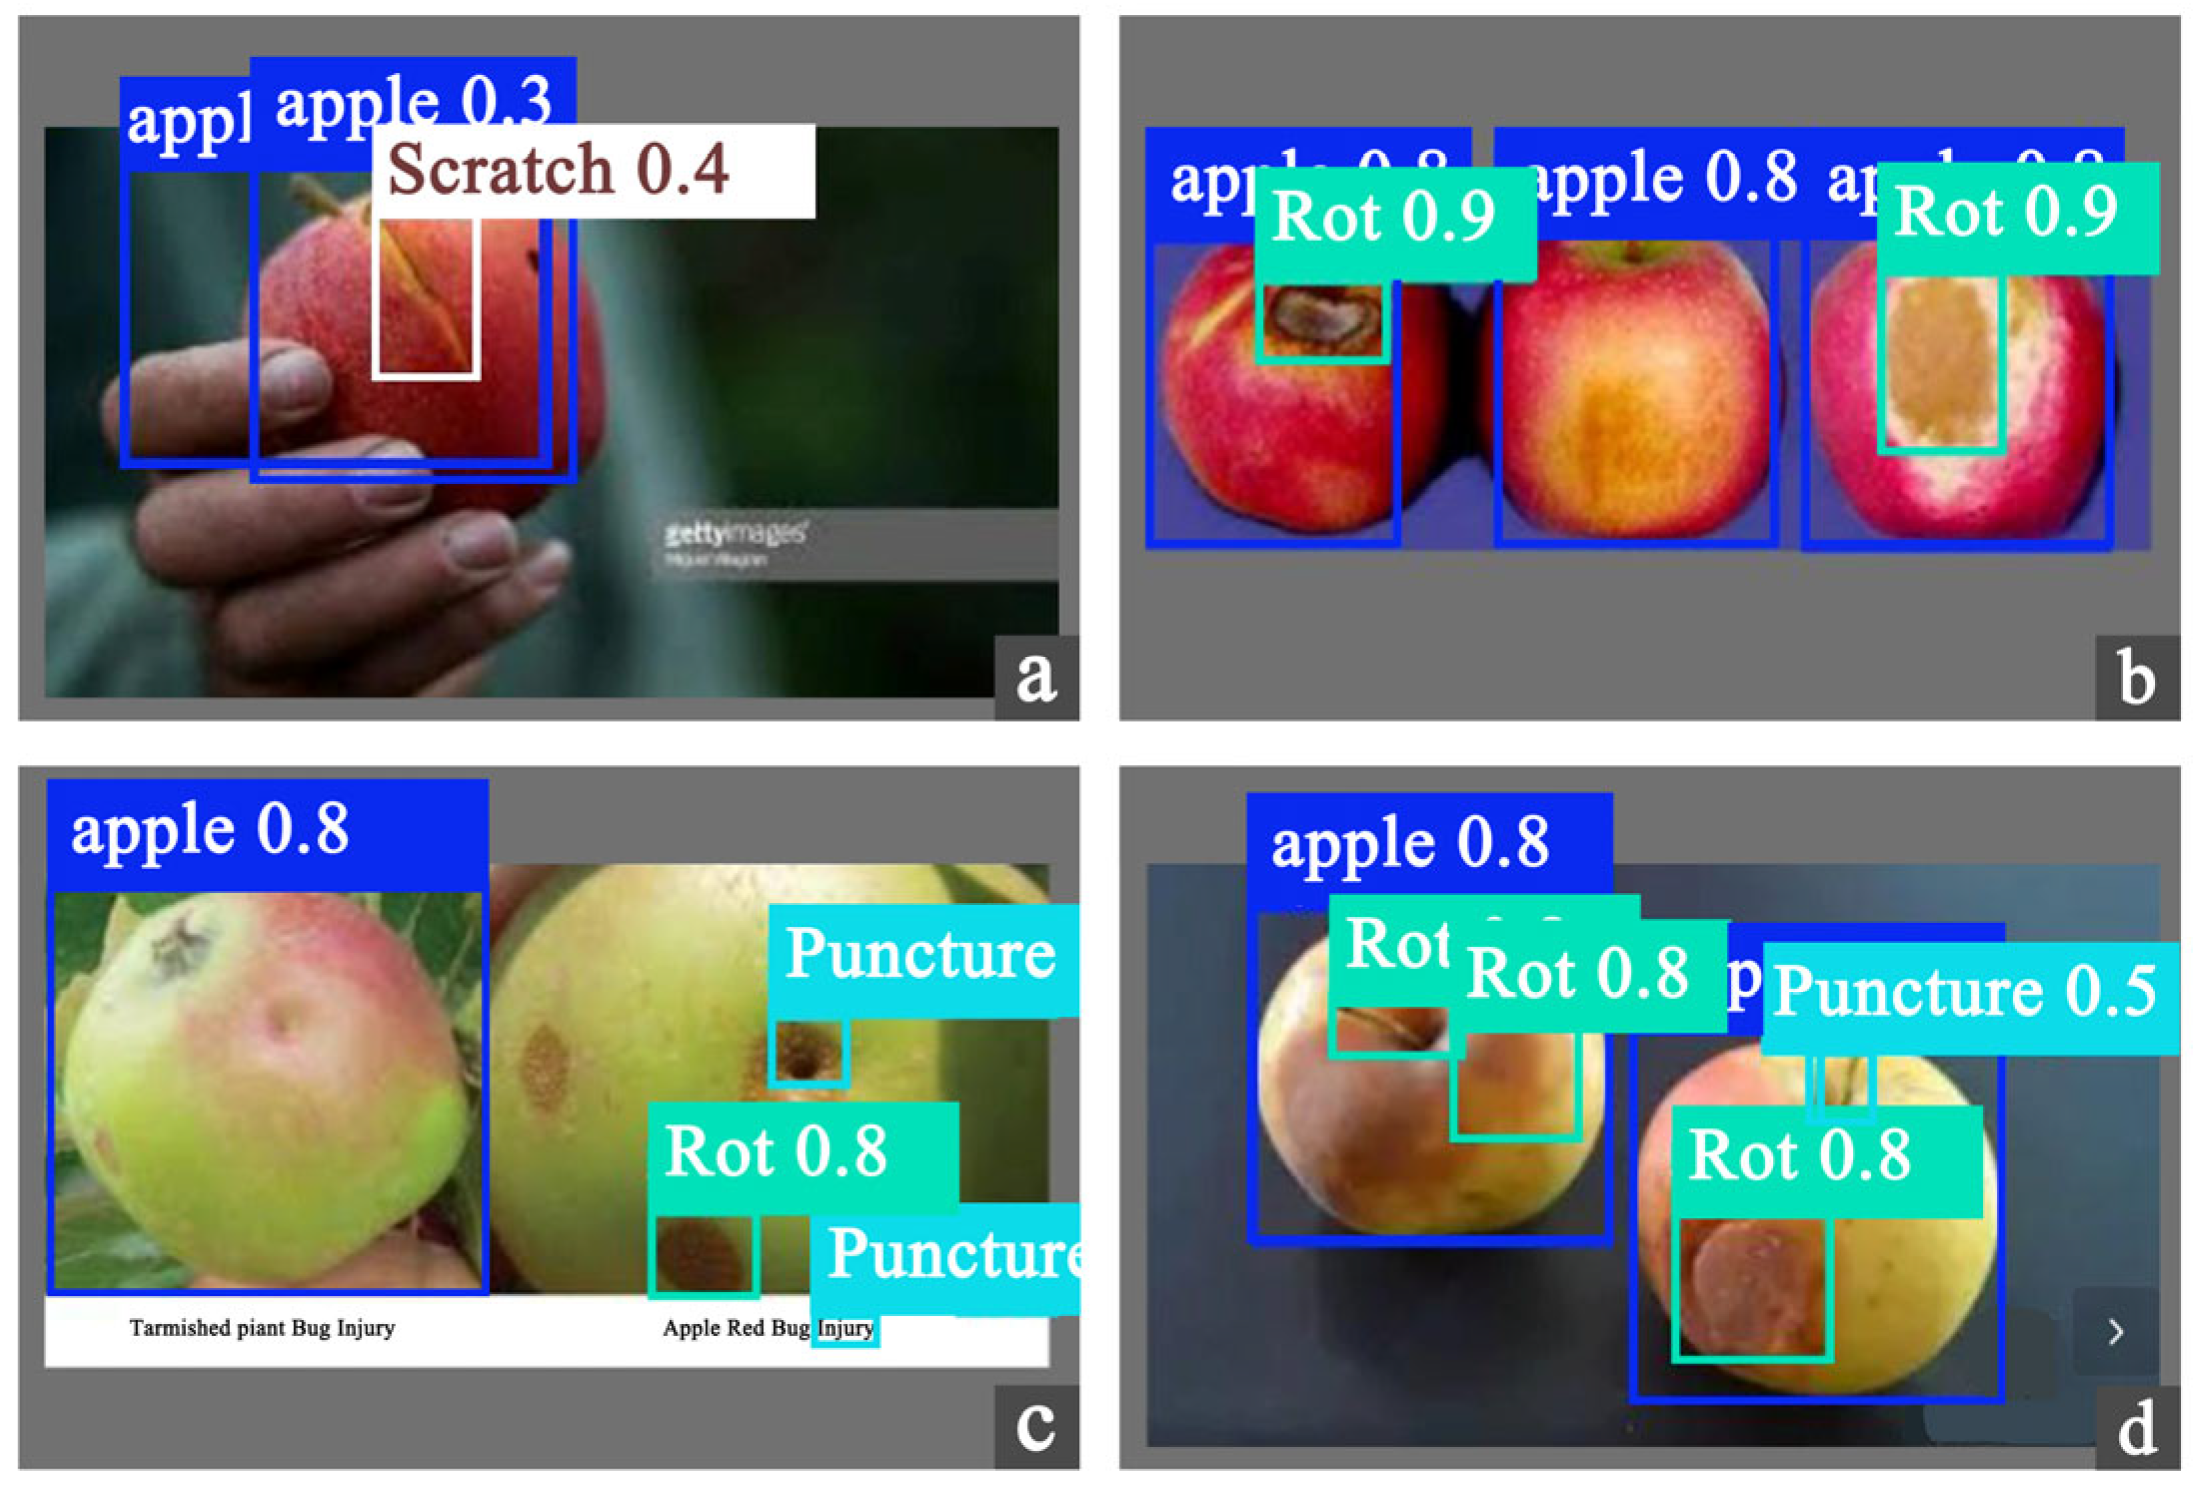
Regarding real-time performance, the G-RGB model exhibited a preprocessing time of 67.2–73.3 ms during validation on public datasets. Compared with tests on the controlled dataset, efficiency remained largely unaffected, and the inference time continued to satisfy recognition requirements. As illustrated in Figure 14, the model’s defect detection capability in open scenarios is further demonstrated, confirming its generalizability and reinforcing the practical applicability of the proposed method in apple defect detection.

4. Discussion

4.1. Optimal Color Filter Space Combination and Its Mechanism of Action

This study systematically investigated the impact of various filters and color space transformations on apple surface defect detection using the YOLOv12s model. The findings indicate that both filter selection and color space significantly influence the model’s perceptual input and feature learning capabilities. Under test conditions, the green filter combined with a color temperature of 4500 K achieved the optimal balance between detection accuracy and processing efficiency. This configuration preserves multi-channel information within the RGB space, effectively enhancing subtle texture features, such as scratches, while maintaining structural clarity. Quantitatively, it yielded the highest mAP50-95 (0.864) and FPS (72), demonstrating robust performance in both accuracy and real-time processing. In contrast, the red filter at 3000 K improves the gray-scale contrast of the R channel but suppresses information in the G and B channels, reducing feature dimensionality and multi-scale representation. These results suggest that excessive spectral bias may enhance visual contrast yet restrict the model’s generalizability across defect categories. External validation using a public apple defect dataset further confirmed that the green filter–RGB configuration effectively mitigates this limitation, maintaining strong detection accuracy and real-time performance in open scenarios. Consequently, the green filter–RGB setup represents the most effective compromise, providing comprehensive texture information alongside spectral balance.

4.2. Compared with Previous Studies

From a quantitative standpoint, the results in Table 6 indicate that under identical lighting conditions, the green filter (4500 K) achieves the highest detection performance across all color spaces, with an mAP50-95 of 0.864, an accuracy of 93.7%, and an inference speed of 72 FPS. In contrast, although the red filter (3000 K) markedly enhances the gray-scale contrast of the R channel at the visual level, it concurrently suppresses information in the G and B channels, reducing feature dimensionality. Consequently, its mAP50-95 is limited to 0.832, with an FPS of 61. The blue filter (6000 K) provides some spectral enhancement but is prone to overexposure and color shifts, resulting in an mAP50-95 of 0.819 and an FPS of 58. These findings suggest that green filters with balanced spectral transmission offer the most stable input representation, thereby optimizing deep feature extraction.
Regarding color space, the RGB model consistently outperforms HSI and LAB under all filtering conditions. On average, RGB improves mAP by approximately 4–7% over HSI and LAB and increases inference speed by 10–15%, highlighting its superior compatibility and real-time performance for convolutional feature extraction. Although HSI and LAB are theoretically more aligned with human visual perception of hue and brightness, their nonlinear transformations inevitably induce information loss, weaken spatial consistency, and prolong inference time. This aligns with Safren et al. [47], who observed RGB’s efficiency in fruit and vegetable detection, and corroborates Zhao et al. [48], who noted that HSI conversion requires network redesign to preserve information integrity. Moreover, it supports Guerri et al. [49], who reported that HSI’s high spectral richness and computational complexity constrain real-time application.
These quantitative outcomes further substantiate prior research on spectral selection and fusion. Ariana et al. [50] and Lee et al. [51] demonstrated that multi-band imaging enhances defect detection accuracy by enriching spectral dimensions, while Coello et al. [52] highlighted that specific bands (e.g., 660 nm) can improve defect profile contrast. Building on this, the present study shows that controllable visible-light filtering can achieve similar performance gains without additional hardware, markedly surpassing the baseline model without filtering. Overall, the green filter–RGB configuration provides the optimal balance among detection accuracy, stability, and computational efficiency, confirming its suitability for industrial inspection applications.

4.3. Restriction

Although this study offers valuable insights, it is subject to certain limitations. First, the dataset comprises only a single apple variety (Red Fuji), constraining the model’s generalizability to other cultivars with differing skin colors and textures. Future research should include multiple varieties, such as green, yellow, and bi-colored apples, to evaluate cross-variety adaptability. Second, the current system relies exclusively on visible-light imaging. The omission of ultraviolet (UV) and near-infrared (NIR) spectral bands restricts the detection of chemical residues and internal decay, which are critical for comprehensive quality assessment. Expanding spectral coverage and investigating dual-branch architectures (e.g., RGB/LAB) or physically guided models could further enhance model robustness. Third, although YOLOv12s achieves a favorable balance between speed and accuracy, real-world industrial conditions—such as motion blur on conveyor belts or uneven illumination—may introduce additional challenges. Consequently, future implementations should incorporate adaptive exposure control and image stabilization algorithms.

4.4. Practical Significance and Future Development Direction

The findings of this study hold both theoretical and industrial significance. From an engineering standpoint, integrating green filters with the RGB color space effectively mitigates the effects of lighting instability in high-speed sorting lines. Compared to unfiltered imaging, this approach increases the frame rate by approximately 15% and enhances mAP by over 6%, demonstrating that optical optimization can substantially improve visual data quality without modifying the network architecture. From a software–hardware co-optimization perspective, adaptive color temperature control, green-filter LED strip configuration, and attention-guided image fusion facilitate the development of scalable and efficient automated fruit detection vision systems. These results align with Fan et al. [53], who leveraged near-infrared imaging combined with a lightweight YOLO architecture to enhance real-time recognition performance. Future research will expand spectral sensing through UV/NIR filters, employ physically modeled data synthesis to augment limited datasets, and explore next-generation YOLO architectures to improve the detection of small or occluded defects.

5. Conclusions

This study presents a YOLOv12s-based apple defect detection approach that integrates filter imaging with color space reconstruction to improve detection accuracy and efficiency under complex lighting conditions. Experimental results demonstrate that the green filter paired with a 4500 K color temperature and RGB color space conversion (G-RGB mode) delivers optimal performance, achieving an mAP50-95 of 83.1% and a processing speed of 15.15 fps, thereby striking the best balance between detection precision and real-time capability. Comparative analysis reveals the green filter’s superiority over red and blue filters in accentuating defect features, particularly subtle scratches. While HSI and LAB color spaces theoretically align better with human visual perception, RGB exhibits greater stability in industrial applications and superior compatibility with YOLOv12s. Ablation experiments validate that the synergistic integration of filter imaging and color space reconstruction compensates for the shortcomings of single-module optimization, offering a viable technical strategy to bolster detection system robustness in complex lighting environments. Future work will expand the sample diversity, incorporate multi-band filter arrays, and investigate multi-filter image fusion techniques to further enhance the system’s adaptability to challenging industrial settings.

Author Contributions

All authors contributed to the study conception and design. Formal analysis, investigation and writing—original draft were performed by X.Z. and Y.C.; methodology, material preparation and data collection analysis were performed by X.Z., J.L., R.L. and T.Z.; project administration, supervision, funding acquisition and writing—review and editing were performed by Z.W. and L.W. All authors have read and agreed to the published version of the manuscript.

Funding

This research was funded by the Liaoning Provincial Science and Technology Program Project (Project No. 2025JH5/10400099).

Data Availability Statement

The original contributions presented in this study are included in the article. Further inquiries can be directed to the corresponding author.

Conflicts of Interest

The authors declare no conflicts of interest.

References

  1. Vasylieva, N.; James, H. Production and Trade Patterns in the World Apple Market. Innov. Mark. 2021, 17, 16–25. [Google Scholar] [CrossRef]
  2. Cubero, S.; Lee, W.S.; Aleixos, N.; Albert, F.; Blasco, J. Automated Systems Based on Machine Vision for Inspecting Citrus Fruits from the Field to Postharvest—A Review. Food Bioprocess Technol. 2016, 9, 1623–1639. [Google Scholar] [CrossRef]
  3. Blasco, J.; Aleixos, N.; Moltó, E. Machine vision system for automatic quality grading of fruit. Biosyst. Eng. 2003, 85, 415–423. [Google Scholar] [CrossRef]
  4. Chen, H.; Qiao, H.; Lin, B.; Xu, G.; Tang, G.; Cai, K. Study of modeling optimization for hyperspectral imaging quantitative determination of naringin content in pomelo peel. Comput. Electron. Agric. 2019, 157, 410–416. [Google Scholar] [CrossRef]
  5. Li, Q.; Wang, M.; Gu, W. Computer vision based system for apple surface defect detection. Comput. Electron. Agric. 2002, 36, 215–223. [Google Scholar] [CrossRef]
  6. Du, C.; Sun, D. Learning techniques used in computer vision for food quality evaluation: A review. J. Food Eng. 2006, 72, 39–55. [Google Scholar] [CrossRef]
  7. Safari, Y.; Nakatumba-Nabende, J.; Nakasi, R.; Nakibuule, R. A Review on Automated Detection and Assessment of Fruit Damage Using Machine Learning. IEEE Access 2024, 12, 21358–21381. [Google Scholar] [CrossRef]
  8. Xu, B.; Cui, X.; Ji, W.; Yuan, H.; Wang, J. Apple Grading Method Design and Implementation for Automatic Grader Based on Improved YOLOv5. Agriculture 2023, 13, 124. [Google Scholar] [CrossRef]
  9. Ünal, İ.; Eceoğlu, O. A Lightweight Instance Segmentation Model for Simultaneous Detection of Citrus Fruit Ripeness and Red Scale (Aonidiella aurantii) Pest Damage. Appl. Sci. 2025, 15, 9742. [Google Scholar] [CrossRef]
  10. Alam, M.D.N.; Ullah, I.; Al-Absi, A.A. Deep Learning-Based Apple Defect Detection with Residual SqueezeNet. In Proceedings of the International Conference on Smart Computing and Cyber Security, Gyeongsan, Republic of Korea, 7–8 July 2020; Springer: Gyeongsan, Republic of Korea, 2023. [Google Scholar] [CrossRef]
  11. Cardellicchio, A.; Renò, V.; Cellini, F.; Summerer, S.; Petrozza, A.; Milella, A. Incremental learning with domain adaption for tomato plant phenotyping. Smart Agric. Technol. 2025, 12, 101324. [Google Scholar] [CrossRef]
  12. Ribeiro, D.; Tavares, D.; Tiradentes, E.; Santos, F.; Rodriguez, D. Performance Evaluation of YOLOv11 and YOLOv12 Deep Learning Architectures for Automated Detection and Classification of Immature Macauba (Acrocomia aculeata) Fruits. Agriculture 2025, 15, 1571. [Google Scholar] [CrossRef]
  13. Chen, J.; Fu, H.; Lin, C.; Liu, X.; Wang, L.; Lin, Y. YOLOPears: A novel benchmark of YOLO object detectors for multi-class pear surface defect detection in quality grading systems. Front. Plant Sci. 2025, 16, 1483824. [Google Scholar] [CrossRef]
  14. Lu, Y.; Lu, R. Non-Destructive Defect Detection of Apples by Spectroscopic and Imaging Technologies: A Review. Trans. Asabe 2017, 60, 1765–1790. [Google Scholar] [CrossRef]
  15. Huang, Z.; Hou, Y.; Cao, M.; Du, C.; Guo, J.; Yu, Z.; Sun, Y.; Zhao, Y.; Wang, H.; Wang, X.; et al. Mechanisms of Machine Vision Feature Recognition and Quality Prediction Models in Intelligent Production Line for Broiler Carcasses. Intell. Sustain. Manuf. 2025, 2, 10016. [Google Scholar] [CrossRef]
  16. Kondoyanni, M.; Loukatos, D.; Templalexis, C.; Lentzou, D.; Xanthopoulos, G.; Arvanitis, K.G. Computer Vision in Monitoring Fruit Browning: Neural Networks vs. Stochastic Modelling. Sensors 2025, 25, 2482. [Google Scholar] [CrossRef] [PubMed]
  17. Ji, Y.; Zhao, Q.; Bi, S.; Shen, T. Apple Grading Method Based on Features of Color and Defect. In Proceedings of the 37th Chinese Control Conference (CCC), Wuhan, China, 25–27 July 2018. [Google Scholar] [CrossRef]
  18. Yang, L.; Mu, D.; Xu, Z.; Huang, K. Apple Surface Defect Detection Based on Gray Level Co-Occurrence Matrix and Retinex Image Enhancement. Appl. Sci. 2023, 13, 12481. [Google Scholar] [CrossRef]
  19. Gómez-Sanchis, J.; Lorente, D.; Soria-Olivas, E.; Aleixos, N.; Cubero, S.; Blasco, J. Development of a Hyperspectral Computer Vision System Based on Two Liquid Crystal Tuneable Filters for Fruit Inspection. Application to Detect Citrus Fruits Decay. Food Bioprocess Technol. 2014, 7, 1047–1056. [Google Scholar] [CrossRef]
  20. Chakour, E.; Mrad, Y.; Mansouri, A.; Elloumi, Y.; Benatiya Andaloussi, I.; Hedi Bedoui, M.; Ahaitouf, A. Enhanced Retinal Vessel Segmentation Using Dynamic Contrast Stretching and Mathematical Morphology on Fundus Images. Appl. Comput. Intell. Soft Comput. 2025, 2025, 8831503. [Google Scholar] [CrossRef]
  21. Lee, S.; Lee, S. Efficient Data Augmentation Methods for Crop Disease Recognition in Sustainable Environmental Systems. Big Data Cogn. Comput. 2025, 9, 8. [Google Scholar] [CrossRef]
  22. Hu, Q.; Guo, Y.; Xie, X.; Cordy, M.; Ma, W.; Papadakis, M.; Ma, L.; Le Traon, Y. Assessing the Robustness of Test Selection Methods for Deep Neural Networks. ACM Trans. Softw. Eng. Methodol. 2025, 34, 1–26. [Google Scholar] [CrossRef]
  23. Khan, Z.; Shen, Y.; Liu, H. ObjectDetection in Agriculture: A Comprehensive Review of Methods, Applications, Challenges, and Future Directions. Agriculture 2025, 15, 1351. [Google Scholar] [CrossRef]
  24. Zhang, J.; Chen, L.; Shi, R.; Li, J. Detection of bruised apples using structured light stripe combination image and stem/calyx feature enhancement strategy coupled with deep learning models. Agric. Commun. 2025, 3, 100074. [Google Scholar] [CrossRef]
  25. Komarnicki, P.; Stopa, R.; Szyjewicz, D.; Kuta, A.; Klimza, T. Influence of Contact Surface Type on the Mechanical Damages of Apples Under Impact Loads. Food Bioprocess Technol. 2017, 10, 1479–1494. [Google Scholar] [CrossRef]
  26. Kleynen, O.; Leemans, V.; Destain, M.F. Selection of the most efficient wavelength bands for ‘Jonagold’ apple sorting. Postharvest Biol. Technol. 2003, 30, 221–232. [Google Scholar] [CrossRef]
  27. Bennedsen, B.S.; Peterson, D.L.; Tabb, A. Identifying defects in images of rotating apples. Comput. Electron. Agric. 2005, 48, 92–102. [Google Scholar] [CrossRef]
  28. Siddiqi, R. Automated apple defect detection using state-of-the-art object detection techniques. Sn Appl. Sci. 2019, 1, 1345. [Google Scholar] [CrossRef]
  29. Cubero, S.; Aleixos, N.; Moltó, E.; Gómez-Sanchis, J.; Blasco, J. Advances in Machine Vision Applications for Automatic Inspection and Quality Evaluation of Fruits and Vegetables. Food Bioprocess Technol. 2011, 4, 487–504. [Google Scholar] [CrossRef]
  30. Leemans, V.; Magein, H.; Destain, M. Defects Segmentation on ‘golden Delicious’ Apples by Using Colour Machine Vision. Comput. Electron. Agric. 1998, 20, 117–130. [Google Scholar] [CrossRef]
  31. Mehl, P.M.; Chao, K.; Kim, M.; Chen, Y.R. Detection of Defects on Selected Apple Cultivars Using Hyperspectral and Multispectral Image Analysis. Appl. Eng. Agric. 2002, 18, 219–226. [Google Scholar] [CrossRef]
  32. Soltani Firouz, M.; Sardari, H. Defect Detection in Fruit and Vegetables by Using Machine Vision Systems and Image Processing. Food Eng. Rev. 2022, 14, 353–379. [Google Scholar] [CrossRef]
  33. Ren, Z.; Fang, F.; Yan, N.; Wu, Y. State of the Art in Defect Detection Based on Machine Vision. Int. J. Precis. Eng. Manuf.-Green Technol. 2022, 9, 661–691. [Google Scholar] [CrossRef]
  34. Bataineh, B.; Almotairi, K.H. Enhancement Method for Color Retinal Fundus Images Based on Structural Details and Illumination Improvements. Arab. J. Sci. Eng. 2021, 46, 8121–8135. [Google Scholar] [CrossRef]
  35. Burambekova, A.; Shamoi, P. Comparative Analysis of Color Models for Human Perception and Visual Color Difference. arXiv 2024, arXiv:2406.19520. [Google Scholar] [CrossRef]
  36. Sirisathitkul, Y.; Dinmeung, N.; Noonsuk, W.; Sirisathitkul, C. Accuracy and precision of smartphone colorimetry: A comparative analysis in RGB, HSV, and CIELAB color spaces for archaeological research. Sci. Technol. Archaeol. Res. 2025, 11, e2444168. [Google Scholar] [CrossRef]
  37. Goel, V.; Singhal, S.; Jain, T.; Kole, S. Specific Color Detection in Images using RGB Modelling in MATLAB. Int. J. Comput. Appl. 2017, 161, 38–42. [Google Scholar] [CrossRef]
  38. Saravanan, G.; Yamuna, G.; Nandhini, S. Real time implementation of RGB to HSV/HSI/HSL and its reverse color space models. In Proceedings of the 2016 International Conference on Communication and Signal Processing (ICCSP), Melmaruvathur, India, 6–8 April 2016. [Google Scholar] [CrossRef]
  39. Smith, T.; Guild, J. The C.I.E. Colorimetric Standards and Their Use. Trans. Opt. Soc. 1931, 33, 73–134. [Google Scholar] [CrossRef]
  40. Wang, M.; Li, F. Real-Time Accurate Apple Detection Based on Improved YOLOv8n in Complex Natural Environments. Plants 2025, 14, 365. [Google Scholar] [CrossRef]
  41. Han, B.; Lu, Z.; Dong, L.; Zhang, J. Lightweight Non-Destructive Detection of Diseased Apples Based on Structural Re-Parameterization Technique. Appl. Sci. 2024, 14, 1907. [Google Scholar] [CrossRef]
  42. Sikdar, A.; Igamberdiev, A.U.; Sun, S.; Debnath, S.C. Deep learning for horticultural innovation: YOLOv12s revolutionizes micropropagated lingonberry phenotyping through unified phenomic-genomic-epigenomic detection. Smart Agric. Technol. 2025, 12, 101388. [Google Scholar] [CrossRef]
  43. Zhao, X.; Lin, L.; Guo, X.; Wang, Z.; Li, R. Evaluation of Rural Visual Landscape Quality Based on Multi-Source Affective Computing. Appl. Sci. 2025, 15, 4905. [Google Scholar] [CrossRef]
  44. Allebosch, G.; Van Hamme, D.; Veelaert, P.; Philips, W. Efficient Detection of Crossing Pedestrians from a Moving Vehicle with an Array of Cameras. Opt. Eng. 2023, 62, 031210. [Google Scholar] [CrossRef]
  45. Gündüz, M.Ş.; Işık, G. A new YOLO-based method for real-time crowd detection from video and performance analysis of YOLO models. J. Real-Time Image Process. 2023, 20, 5. [Google Scholar] [CrossRef]
  46. Chen, D.; Kang, F.; Chen, J.; Zhu, S.; Li, H. Effect of light source wavelength on surface defect imaging in deep-water concrete dams. NDT E Int. 2024, 147, 103198. [Google Scholar] [CrossRef]
  47. Safren, O.; Alchanatis, V.; Ostrovsky, V.; Levi, O. Detection of Green Apples in Hyperspectral Images of Apple-Tree Foliage Using Machine Vision. Trans. Asabe 2007, 50, 2303–2313. [Google Scholar] [CrossRef]
  48. Zhao, J.; Kechasov, D.; Rewald, B.; Bodner, G.; Verheul, M.; Clarke, N.; Clarke, J.L. Deep Learning in Hyperspectral Image Reconstruction from Single RGB images—A Case Study on Tomato Quality Parameters. Remote Sens. 2020, 12, 3258. [Google Scholar] [CrossRef]
  49. Guerri, M.F.; Distante, C.; Spagnolo, P.; Bougourzi, F.; Taleb-Ahmed, A. Deep learning techniques for hyperspectral image analysis in agriculture: A review. Isprs Open J. Photogramm. Remote Sens. 2024, 12, 100062. [Google Scholar] [CrossRef]
  50. Ariana, D.; Guyer, D.E.; Shrestha, B. Integrating multispectral reflectance and fluorescence imaging for defect detection on apples. Comput. Electron. Agric. 2006, 50, 148–161. [Google Scholar] [CrossRef]
  51. Lee, H.; Yang, C.; Kim, M.S.; Lim, J.; Cho, B.; Lefcourt, A.; Chao, K.; Everard, C.D. A Simple Multispectral Imaging Algorithm for Detection of Defects on Red Delicious Apples. J. Biosyst. Eng. 2014, 39, 142–149. [Google Scholar] [CrossRef]
  52. Coello, O.; Coronel, M.; Carpio, D.; Vintimilla, B.; Chuquimarca, L. Enhancing Apple’s Defect Classification: Insights from Visible Spectrum and Narrow Spectral Band Imaging. In Proceedings of the 2024 14th International Conference on Pattern Recognition Systems (ICPRS), London, UK, 15–18 July 2024. [Google Scholar] [CrossRef]
  53. Elsherbiny, O.; Zhou, L.; He, Y.; Qiu, Z. A novel hybrid deep network for diagnosing water status in wheat crop using IoT-based multimodal data. Comput. Electron. Agric. 2022, 203, 107453. [Google Scholar] [CrossRef]
Figure 1. Schematic diagram of the experimental setup. (a) Floor plan; (b) Elevation drawing; (c) Red, green and blue color filters.
Electronics 14 04259 g001
Figure 2. Comparison chart of 12 imaging conditions.
Electronics 14 04259 g002
Figure 3. Schematic diagram of multi-angle shooting of an apple.
Electronics 14 04259 g003
Figure 5. Image comparison across HSI color channels: (a) Intact group; (b) Puncture group; (c) Scratch group; (d) Rot group.
Electronics 14 04259 g005
Figure 6. Image comparison across LAB color channels: (a) Intact group; (b) Puncture group; (c) Scratch group; (d) Rot group.
Electronics 14 04259 g006
Figure 7. Network structure diagram of Yolov12 (* denotes module repetition).
Electronics 14 04259 g007
Figure 8. Shows the marking of the scratch area without color conversion. (a) Original, (b) red filter, (c) green filter, (d) blue filter.
Electronics 14 04259 g008
Figure 9. Defect annotation diagram in G-RGB mode. (a) Green filter, (b) R, (c) G, (d) B.
Electronics 14 04259 g009
Figure 10. Defect annotation diagram in G-HSI mode. (a) Green filter, (b) H, (c) S, (d) I.
Electronics 14 04259 g010
Figure 11. Defect annotation diagram in G-LAB mode. (a) Green filter, (b) L, (c) A, (d) B.
Electronics 14 04259 g011
Figure 12. Comparison of the confusion matrices of the four color Spaces under the green filter: (a) G; (b) G-RGB; (c) G-HSI; (d) G-LAB.
Electronics 14 04259 g012
Figure 13. Comparison of F1-Confidence Curves: (a) G, (b) G-RGB, (c) G-HSI, (d) G-LAB.
Electronics 14 04259 g013
Figure 14. The detection results of the G-RGB model on public datasets. (a) Intact, (b) Scratch, (c) Puncture, (d) Rot.
Electronics 14 04259 g014
Table 1. Details of apple sample grouping and defect types.
TypeNumberParticulars
Intact25no matter
Scratch25Use a screwdriver to prick the surface of the apple.
The depth is 5 mm, the length is 1 cm, and the width is 5 mm.
Puncture25Make cuts on the surface of the apple with a knife,
with a depth of 2 mm, a length of 1.5 cm, and a width of 2 mm.
Rot25Hammer the surface of the apple with the tail of the screwdriver, fixing one position and hammering five times. And place it at a constant temperature indoors for 7 days
Table 2. Statistics of the number of image captures of apples in each group.
TypeNo FilterRed Filter (3000 K)Green Filter (4500 K)Blue Filter (6000 K)Total (Pieces)
All apples4004004004001600
Intact100100100100400
Scratch100100100100400
Puncture100100100100400
Rot100100100100400
Table 3. Performance comparison between YOLO models.
TypePrecisionRecallmAP50mAP50-95FPS
YOLOv9sIntact95.3%92.1%93.2%85.7%
Scratch88.6%75.2%82.3%60.1%
Puncture92.5%88.3%90.4%55.2%
Rot90.8%86.7%88.7%52.4%
All91.8%85.6%88.6%63.3%9.25
YOLOv10sIntact96.1%93.5%94.8%87.2%
Scratch90.2%78.5%84.6%63.5%
Puncture93.4%90.1%91.7%58.3%
Rot91.7%88.9%90.3%55.7%
All92.8%87.8%90.4%66.2%8.83
YOLOv11sIntact97.2%95.3%96.3%89.5%
Scratch92.5%82.3%87.4%68.2%
Puncture95.1%92.4%93.7%62.5%
Rot93.6%90.8%92.2%60.3%
All94.6%90.2%92.4%70.1%10.12
YOLOv12sIntact99.7%100%99.5%98.8%
Scratch99.2%90.0%95.8%78.0%
Puncture99.7%100%99.5%66.5%
Rot99.0%100%99.5%64.6%
All99.4%97.5%98.6%79.6%10.52
The calculation method for the “All” row is arithmetic mean, “%” indicates percentage, and the unit of FPS is fps.
Table 4. Performance of Baseline YOLOv12s Model Under Different Filter Conditions.
TypePrecisionRecallmAP50mAP50-95FPS
OriginalIntact99.7%100%99.5%98.8%
Scratch99.2%90.0%95.8%78.0%
Puncture99.7%100%99.5%66.5%
Rot99.0%100%99.5%64.6%
All99.4%97.5%98.6%79.6%10.52
RIntact98.5%97.0%98.0%92.0%
Scratch98.5%93.0%97.0%76.0%
Puncture98.0%99.0%98.5%64.0%
Rot97.0%96.0%96.5%75.0%
All98.0%96.3%97.8%76.8%8.26
GIntact99.5%100%99.5%99.4%
Scratch100%95.5%99.5%88.2%
Puncture94.5%100%99.0%69.4%
Rot98.3%100%99.5%80.6%
All98.1%98.9%99.4%82.7%10.78
BIntact98.5%98.0%98.5%92.0%
Scratch98.0%95.0%97.0%78.0%
Puncture99.0%100%99.0%62.0%
Rot97.5%98.0%98.0%79.0%
All98.1%97.0%98.1%77.8%6.74
The calculation method for the “All” row is arithmetic mean, “%” indicates percentage, and the unit of FPS is fps.
Table 5. Recognition of RGB color space transformation results under different filters.
PrecisionRecallmAP50mAP50-95FPS
O-RGB98.9%99.6%99.4%79.8%13.33
R-RGB99.3%96.9%99.0%77.6%12.20
G-RGB98.8%98.5%98.9%83.1%15.15
B-RGB98.5%99.5%99.4%80.8%11.83
O-RGB98.9%99.6%99.4%79.8%13.33
“%” indicates percentage, the unit of FPS is fps.
Table 6. Recognition of HSI color space transformation results under different filters.
PrecisionRecallmAP50mAP50-95FPS
O-HSI97.5%95.3%97.8%76.6%6.87
R-HSI98.7%90.3%96.9%73.3%10.78
G-HSI98.7%92.3%97.1%79.1%7.30
B-HSI98.4%97.3%98.6%78.5%6.70
O-HSI97.5%95.3%97.8%76.6%6.87
“%” indicates percentage, the unit of FPS is fps.
Table 7. Recognition of LAB color space transformation results under different filters.
PrecisionRecallmAP50mAP50-95FPS
O-LAB99.0%94.0%98.0%77.2%6.70
R-LAB97.0%98.1%99.3%78.5%10.60
G-LAB98.6%98.0%99.0%81.8%12.11
B-LAB99.4%97.7%98.5%78.8%7.69
O-LAB99.0%94.0%98.0%77.2%6.70
“%” indicates percentage, the unit of FPS is fps.
Table 8. Performance of Green (G) Filter Under Four Input Modes for Apple Defect Detection.
PrecisionRecallmAP50mAP50-95FPS
G98.1%98.9%99.4%82.7%10.78
G-RGB98.8%98.5%98.9%83.1%15.15
G-HSI98.7%92.3%97.1%79.1%7.30
G-LAB98.6%98.0%99.0%81.8%12.11
“%” indicates percentage, the unit of FPS is fps.
Table 9. Comparison of internal recognition results of G-RGB models.
PrecisionRecallmAP50mAP50-95
Intact100%100%99.5%99.5%
Scratch99.1%98.8%99.4%86.3%
Puncture95.4%100%98.2%64.4%
Rot100%95.3%98.5%82.3%
All98.8%98.5%98.9%83.1%
“%” indicates percentage.
Table 10. Validation results of the G-RGB model on the public apple defect dataset.
PrecisionRecallmAP50mAP50-95
Intact99.7%100%99.5%98.6%
Scratch99.2%90.0%95.8%78.0%
Puncture99.7%100%99.5%66.5%
Rot99.0%100%99.5%64.6%
All99.4%97.5%98.6%76.9%
“%” indicates percentage.
Disclaimer/Publisher’s Note: The statements, opinions and data contained in all publications are solely those of the individual author(s) and contributor(s) and not of MDPI and/or the editor(s). MDPI and/or the editor(s) disclaim responsibility for any injury to people or property resulting from any ideas, methods, instructions or products referred to in the content.