Abstract
The safety and reliability of modern power systems are increasingly challenged by adverse environmental conditions. (1) Background: Ice accumulation on power transmission lines is recognized as a severe threat to grid stability, as tower collapse, conductor breakage, and large-scale outages may be caused, thereby making accurate monitoring essential. (2) Methods: A rule-driven and interpretable stereo vision framework is proposed for three-dimensional (3D) detection and quantitative measurement of transmission line icing. The framework consists of three stages. First, adaptive preprocessing and segmentation are applied using multiscale Retinex with nonlinear color restoration, graph-based segmentation with structural constraints, and hybrid edge detection. Second, stereo feature extraction and matching are performed through entropy-based adaptive cropping, self-adaptive keypoint thresholding with circular descriptor analysis, and multi-level geometric validation. Third, 3D reconstruction is realized by fusing segmentation and stereo correspondences through triangulation with shape-constrained refinement, reaching millimeter-level accuracy. (3) Result: An accuracy of 98.35%, sensitivity of 91.63%, specificity of 99.42%, and precision of 96.03% were achieved in contour extraction, while a precision of 90%, recall of 82%, and an F1-score of 0.8594 with real-time efficiency (0.014–0.037 s) were obtained in stereo matching. Millimeter-level accuracy (Mean Absolute Error: 1.26 mm, Root Mean Square Error: 1.53 mm, Coefficient of Determination = 0.99) was further achieved in 3D reconstruction. (4) Conclusions: Superior accuracy, efficiency, and interpretability are demonstrated compared with two existing rule-based stereo vision methods (Method A: ROI Tracking and Geometric Validation Method and Method B: Rule-Based Segmentation with Adaptive Thresholding) that perform line icing identification and 3D reconstruction, highlighting the framework’s advantages under limited data conditions. The interpretability of the framework is ensured through rule-based operations and stepwise visual outputs, allowing each processing result, from segmentation to three-dimensional reconstruction, to be directly understood and verified by operators and engineers. This transparency facilitates practical deployment and informed decision making in real world grid monitoring systems.
1. Introduction
1.1. Background
Power transmission line icing has long been recognized as a severe natural disaster that threatens the stability of power systems [1]. Severe icing has been reported to cause the collapse of towers and widespread power outages [2], resulting in substantial economic losses [3,4]. The first recorded accident due to icing on overhead lines occurred in the United States in 1932, followed by incidents in Britain (1935, 1962) and Italy (1964) [5]. Between 1980 and 2000, multiple icing disasters were reported in North America, Europe, and Asia, affecting cities such as Ohio, Chicago, Idaho, Quebec, Ontario, and others, which led to significant transmission failures [6]. In the 21st century, major icing disaster were recorded in the Czech Republic, Alberta (Canada) [7], China (2005 and 2008), and Texas, USA (2021), demonstrating that severe ice accumulation continues to threaten power transmission networks globally [8]. More recently, in 2023, severe icing on power transmission lines in North China caused four high-voltage transmission lines to fail, leaving over 100,000 households without electricity [9]. Table 1 presents a summary of major icing disasters, illustrating their impacts on electricity supply and infrastructure.

Table 1.
Major icing disasters at home and abroad.
As shown in Table 1, severe icing disasters on transmission lines have repeatedly resulted in tower collapses, conductor damage, and widespread power outages. These cases highlight the serious risks that icing on power transmission lines poses to system stability and highlight the critical importance of establishing dependable ice monitoring systems. Advanced computer vision methods, such as binocular stereo vision, have been identified as a promising approach for three-dimensional monitoring of ice accumulation to address these challenges. Accurate ice thickness measurements are one way to establish an ice monitoring system on power transmission lines.
1.2. Related Works
The impact of ice sheet disasters on electricity transmission networks has been reported in many countries, highlighting the urgent requirement for more effective monitoring systems [10,11]. Monitoring ice accumulation on transmission lines is complicated by adverse weather conditions [12], such as low visibility and poor image contrast [13], which significantly reduce the accuracy of image-based detection methods [14]. A variety of monitoring strategies have been developed to overcome these challenges, which are generally categorized into manual inspection [15], vehicle-based inspection, meteorological and mechanical models, sensor-based approaches, and machine vision methods.
Manual inspection has traditionally been performed by visually detecting ice using the human eye or telescopes. This method has been regarded as time-consuming, labor-intensive, and often inaccurate, particularly for remote or inaccessible segments [16]. Vehicle-based inspection platforms equipped with laser scanners, Global Positioning System (GPS), Inertial Navigation System (INS), cameras, and additional sensors have been introduced [17]. Although greater flexibility has been achieved, such methods have remained limited to urban areas and are constrained by cost and accessibility. Estimation of ice accumulation through meteorological and mechanical models has also been investigated [18]. However, these methods have been considered highly location-dependent and difficult to generalize due to the complexity of environmental factors. Sensor-based methods involving the installation of electrodes or strain gauges on lines and towers have been employed to directly monitor ice mass and thickness. Nevertheless, issues such as electromagnetic interference, reduced durability under high humidity, and limited precision for partial icing have been reported.
With advancements in image processing technology, machine vision has increasingly been adopted as a promising solution, due to its efficiency and capability for real-time monitoring [19]. Early investigations primarily focused on two-dimensional (2D) image processing, in which contour and edge information were extracted from cameras mounted on towers or unmanned aerial vehicles (UAVs) [20]. These approaches, however, were constrained by geometric ambiguities, making the quantitative measurement of ice thickness difficult. As a result, the research focus has gradually shifted towards binocular or stereo vision methods, through which 2D imagery can be transformed into accurate three-dimensional (3D) reconstructions of icing structures [21]. Nevertheless, challenges remain in robust segmentation and feature matching under variable illumination, low contrast, thin ice layers, and complex backgrounds.
More recently, deep learning-based approaches have been introduced for icing detection and thickness estimation. While deep learning models can achieve high accuracy, they typically require large labeled datasets and operate as black-box models, limiting interpretability and posing challenges for real-time applications. Classical stereo vision approaches have been regarded as data-efficient and computationally lightweight. However, their robustness has remained insufficient under challenging conditions such as varying illumination, low contrast, or thin ice layers. Consequently, their reliability in outdoor environments has been limited.
In previous studies, various vision-based and stereo reconstruction approaches have been explored for monitoring power transmission line icing. For example, Nusantika et al. [22] proposed a region-of-interest (ROI) tracking and geometric validation scheme to improve feature correspondence stability under varying illumination and viewing conditions. This method, which forms the basis of Method A in this paper, effectively enhances the accuracy of feature matching but remains limited in adaptability to background interference. In subsequent work, Nusantika [5] introduced a rule-based segmentation framework incorporating adaptive preprocessing and multi-threshold analysis for accurate ice region identification. This approach, referenced as Method B in this study, demonstrates improved detection performance yet lacks direct 3D reconstruction capability.
Both prior studies share structural similarities with the proposed framework, as they encompass stages of line identification, keypoint matching, and geometric-based measurement. Therefore, they were selected as comparative benchmarks in the experimental analysis to ensure fair and methodologically relevant evaluation of the proposed rule-driven stereo vision framework.
Despite significant advancements, achieving reliable, accurate, and real-time 3D measurement of ice accretion on transmission lines remains an open research challenge. Current methods often struggle with issues such as low-light conditions, thin ice layers, and environmental disturbances. There is a need for the development of integrated frameworks that combine the speed and interpretability of classical stereo vision with the robustness and adaptability of deep learning techniques. Such hybrid systems could enable continuous monitoring, accurate ice thickness estimation, and timely risk assessment in operational power transmission networks.
1.3. Research Objectives and Contributions
The primary objective of this research is to develop a fully analytical, interpretable, and data-efficient framework for the detection and three-dimensional measurement of ice thickness on power transmission lines. The proposed system is designed to achieve high accuracy and robustness while addressing the limitations of existing approaches, including reliance on large training datasets, low interpretability, and reduced reliability under varying environmental conditions.
The main contributions of this work are summarized as follows:
- Adaptive Preprocessing and Segmentation: A comprehensive image enhancement and segmentation pipeline was developed, integrating multiscale Retinex with nonlinear color restoration, adaptive grayscale conversion, and graph-based segmentation with contextual constraints. Hybrid edge refinement, combining gradient and morphological operations, enables precise contour detection of both upper and lower ice boundaries, providing critical structural information for subsequent 3D reconstruction. The method achieves high accuracy, sensitivity, specificity, and precision in isolating ice-covered regions.
- Stereo Feature Extraction and Matching: Robust stereo feature detection and correspondence were implemented using entropy-based adaptive cropping, self-adaptive keypoint detection, and bidirectional matching with multi-level geometric validation. This approach improves the accuracy and density of stereo correspondences, maintains robustness against illumination variations, low-texture regions, and partial occlusions, and ensures reliable depth estimation for accurate 3D reconstruction.
- Three-Dimensional Reconstruction: Triangulation-based reconstruction combined with shape-constrained refinement using cylindrical and parabolic priors produces millimeter-level accuracy in ice thickness measurement. This method accounts for geometric stability in regions affected by low texture, occlusion, or surface complexity, enabling quantitative evaluation of ice accumulation along the transmission line structure.
- System-Level Advancements: The framework demonstrates real-time processing capability, interpretability, and resource efficiency. Its modular and scalable design enables deployment in diverse operational conditions, supporting continuous monitoring and reliable early warning of icing hazards.
Collectively, these contributions establish a novel, rule-driven stereo vision framework that is accurate, interpretable, and suitable for real-world monitoring of ice accumulation on power transmission lines.
2. Materials and Methods
2.1. Material
2.1.1. Image Acquisition Device
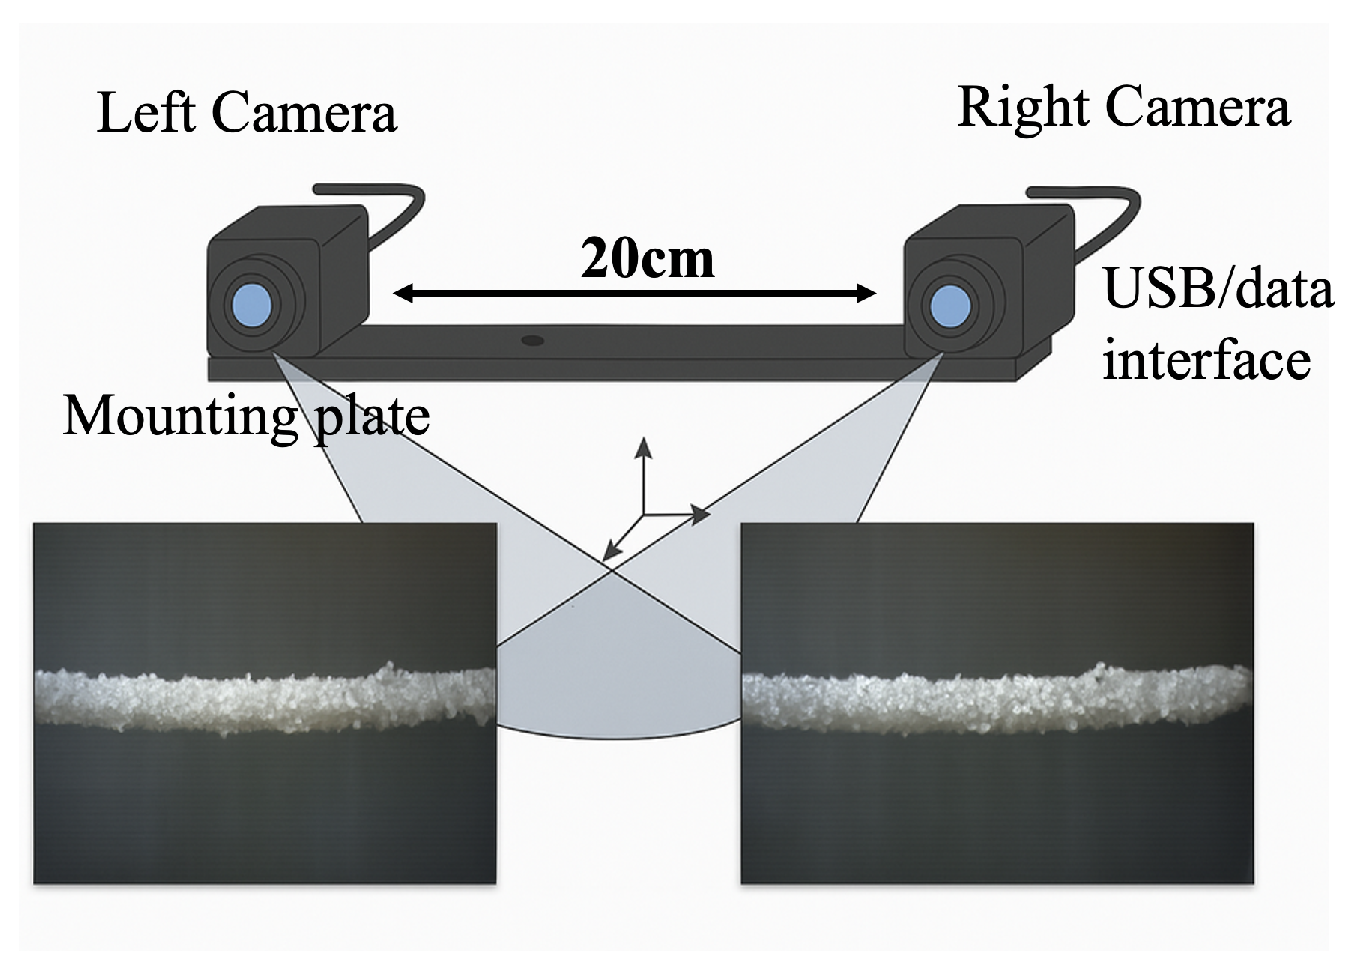
This subsection presents the construction of the hardware platform proposed to support developing and testing a 3D monitoring system. The platform is designed to ensure the accuracy of binocular image data acquisition and provide a realistic testing environment for transmission line ice formation scenarios. The physical image of the camera is shown in Figure 1. Its design includes two lenses oriented side by side with a distance of 20 cm between them. The platform uses a binocular camera system equipped with two DH-HV1351UM-ML cameras produced by Daheng Image Vision Co., Ltd. (Beijing, China).These industrial-grade cameras with ultra-high resolution and accuracy guarantee the data produced by these services for 3D measurement. These cameras form the core of the binocular vision system, where the precision of the camera directly affects the accuracy of the subsequent measurement results.

Figure 1.
Daheng binocular vision camera structure.
2.1.2. Simulation and Dataset
Power transmission line icing (PTLI) simulation is designed to support the development of reliable ice monitoring methods. Specially selected materials are used in the simulation to represent the characteristics of transmission lines and icing realistically. The resulting dataset covers a wide range of environmental conditions to ensure that the proposed transmission line icing monitoring scheme can perform optimally in real scenarios. The two primary materials proposed in this simulation are Expandable Polyethylene (EPE) and Expanded Polystyrene (EPS):
- (1)
- EPE is chosen to simulate the transmission line because it is lightweight, flexible, and resembles the shape of an electric cable. The transmission line is simulated by a long cylinder of pearl cotton (EPE material).
- (2)
- EPS is used to simulate the ice layer because its texture is similar to natural ice. In this simulation, EPS is applied to the surface of EPE to create a visual effect like ice sticking.
As a background, pearl cotton is used to imitate the ice-covered ground surface, creating a more realistic simulation environment.
The simulation process is conducted with the following steps:
- (1)
- The EPE cylinder is shaped to resemble a transmission line cable.
- (2)
- A layer of EPS is applied to the surface of the EPE to create a visual effect like ice sticking.
- (3)
- Pearl cotton is used as a background to simulate the condition of the ice-covered ground.
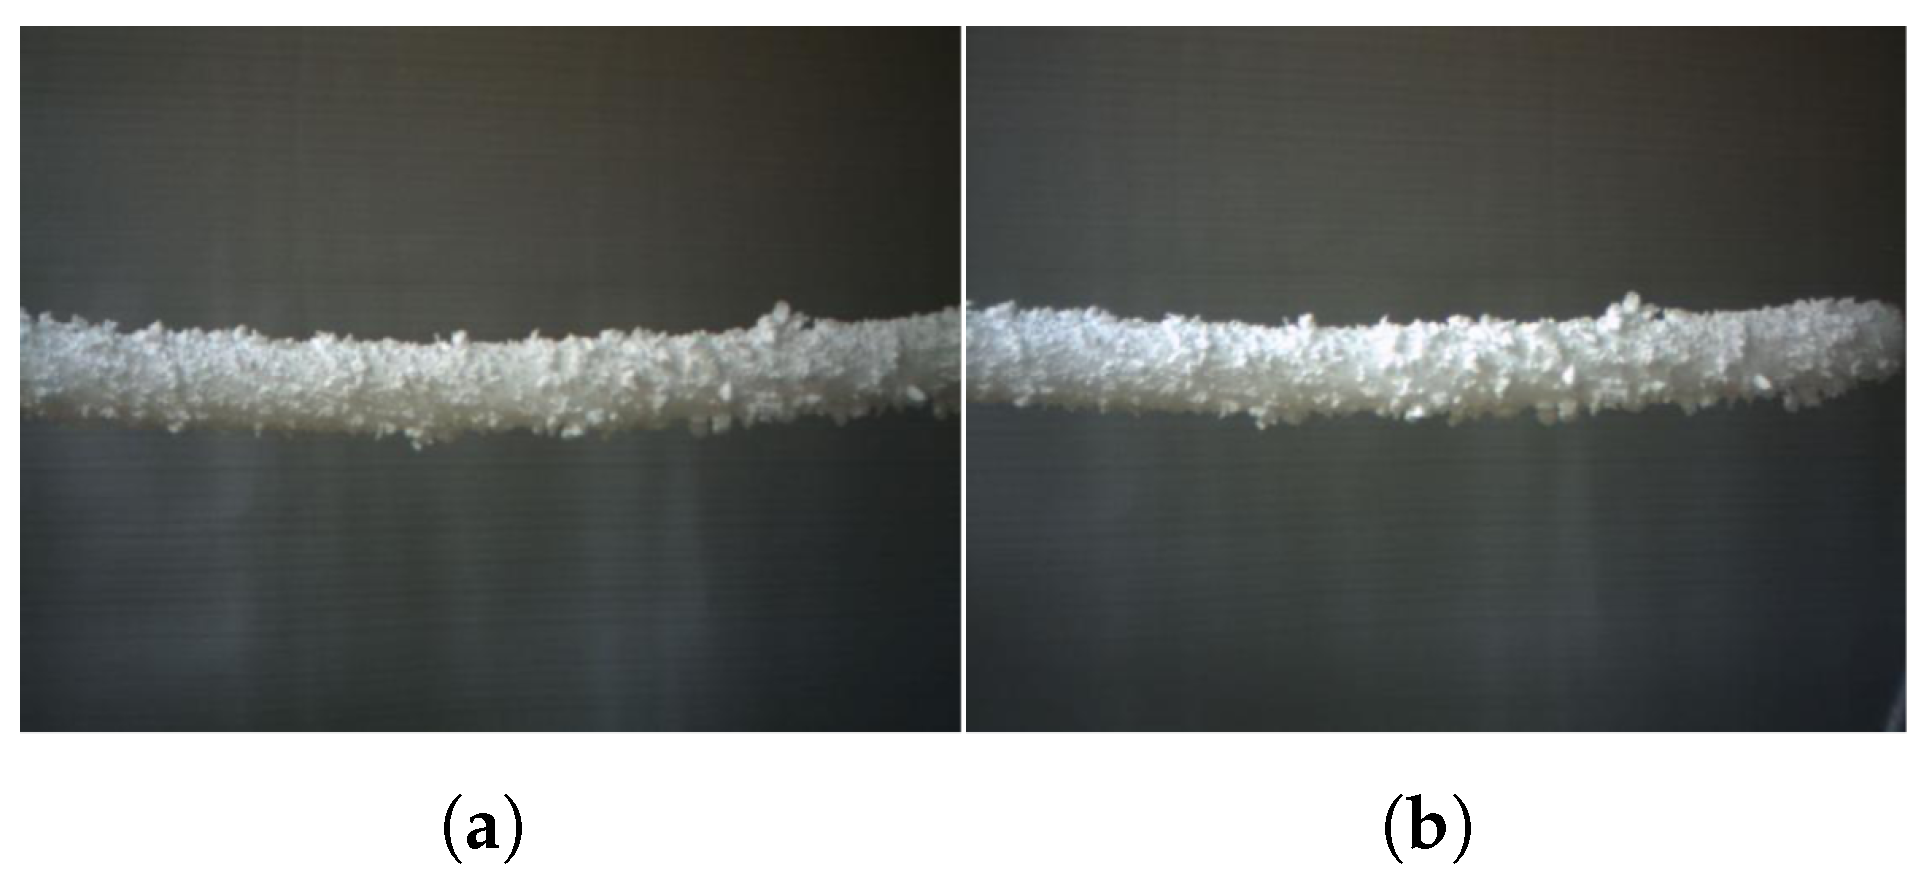
The resulting dataset consists of PTLI images taken in controlled lighting conditions, and the density and precision of true disparities are high when using structured light measurement. The images represent artificial ice attached to the transmission line, with a white sky background and an ice-covered ground surface. The dataset consists of 200 images taken randomly for experimental studies. However, the results of processing 20 PTLI images will be presented in this dissertation. This test aims to ensure the efficiency of the proposed scheme. The proposed scheme covers all aspects of the simulation, thus enabling the monitoring of ice formation on power transmission lines with a high degree of accuracy. Figure 2 shows the PTLI simulation from the left and right images.
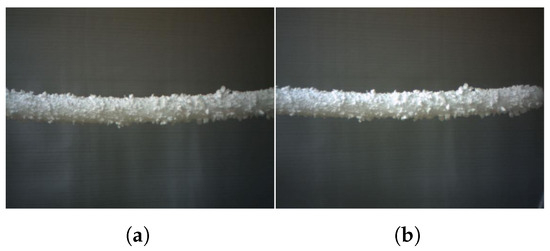
Figure 2.
PTLI image simulation: (a) left image; (b) right image.
Figure 3 illustrates the stereovision image acquisition process, showcasing the visual image capture flow, including the key steps from image capture to initial analysis for 3D processing. The image acquisition sensor is a binocular vision camera for industrial applications. Its design includes two lenses oriented side by side with a distance of 20 cm between them (as illustrated in Figure 3), thus enabling the system to identify depth correctly. This baseline distance (20 cm) is selected to capture objects about 2 m in front of the camera while providing an adequate depth resolution and field of view. The camera array records stereoscopic image pairs at the same time, which is a critical step in 3D measurement and reconstruction.
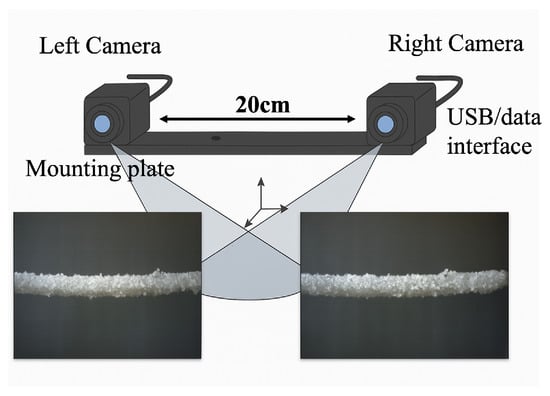
Figure 3.
Schematic diagram of ice thickness measurement system.
2.2. System Overview
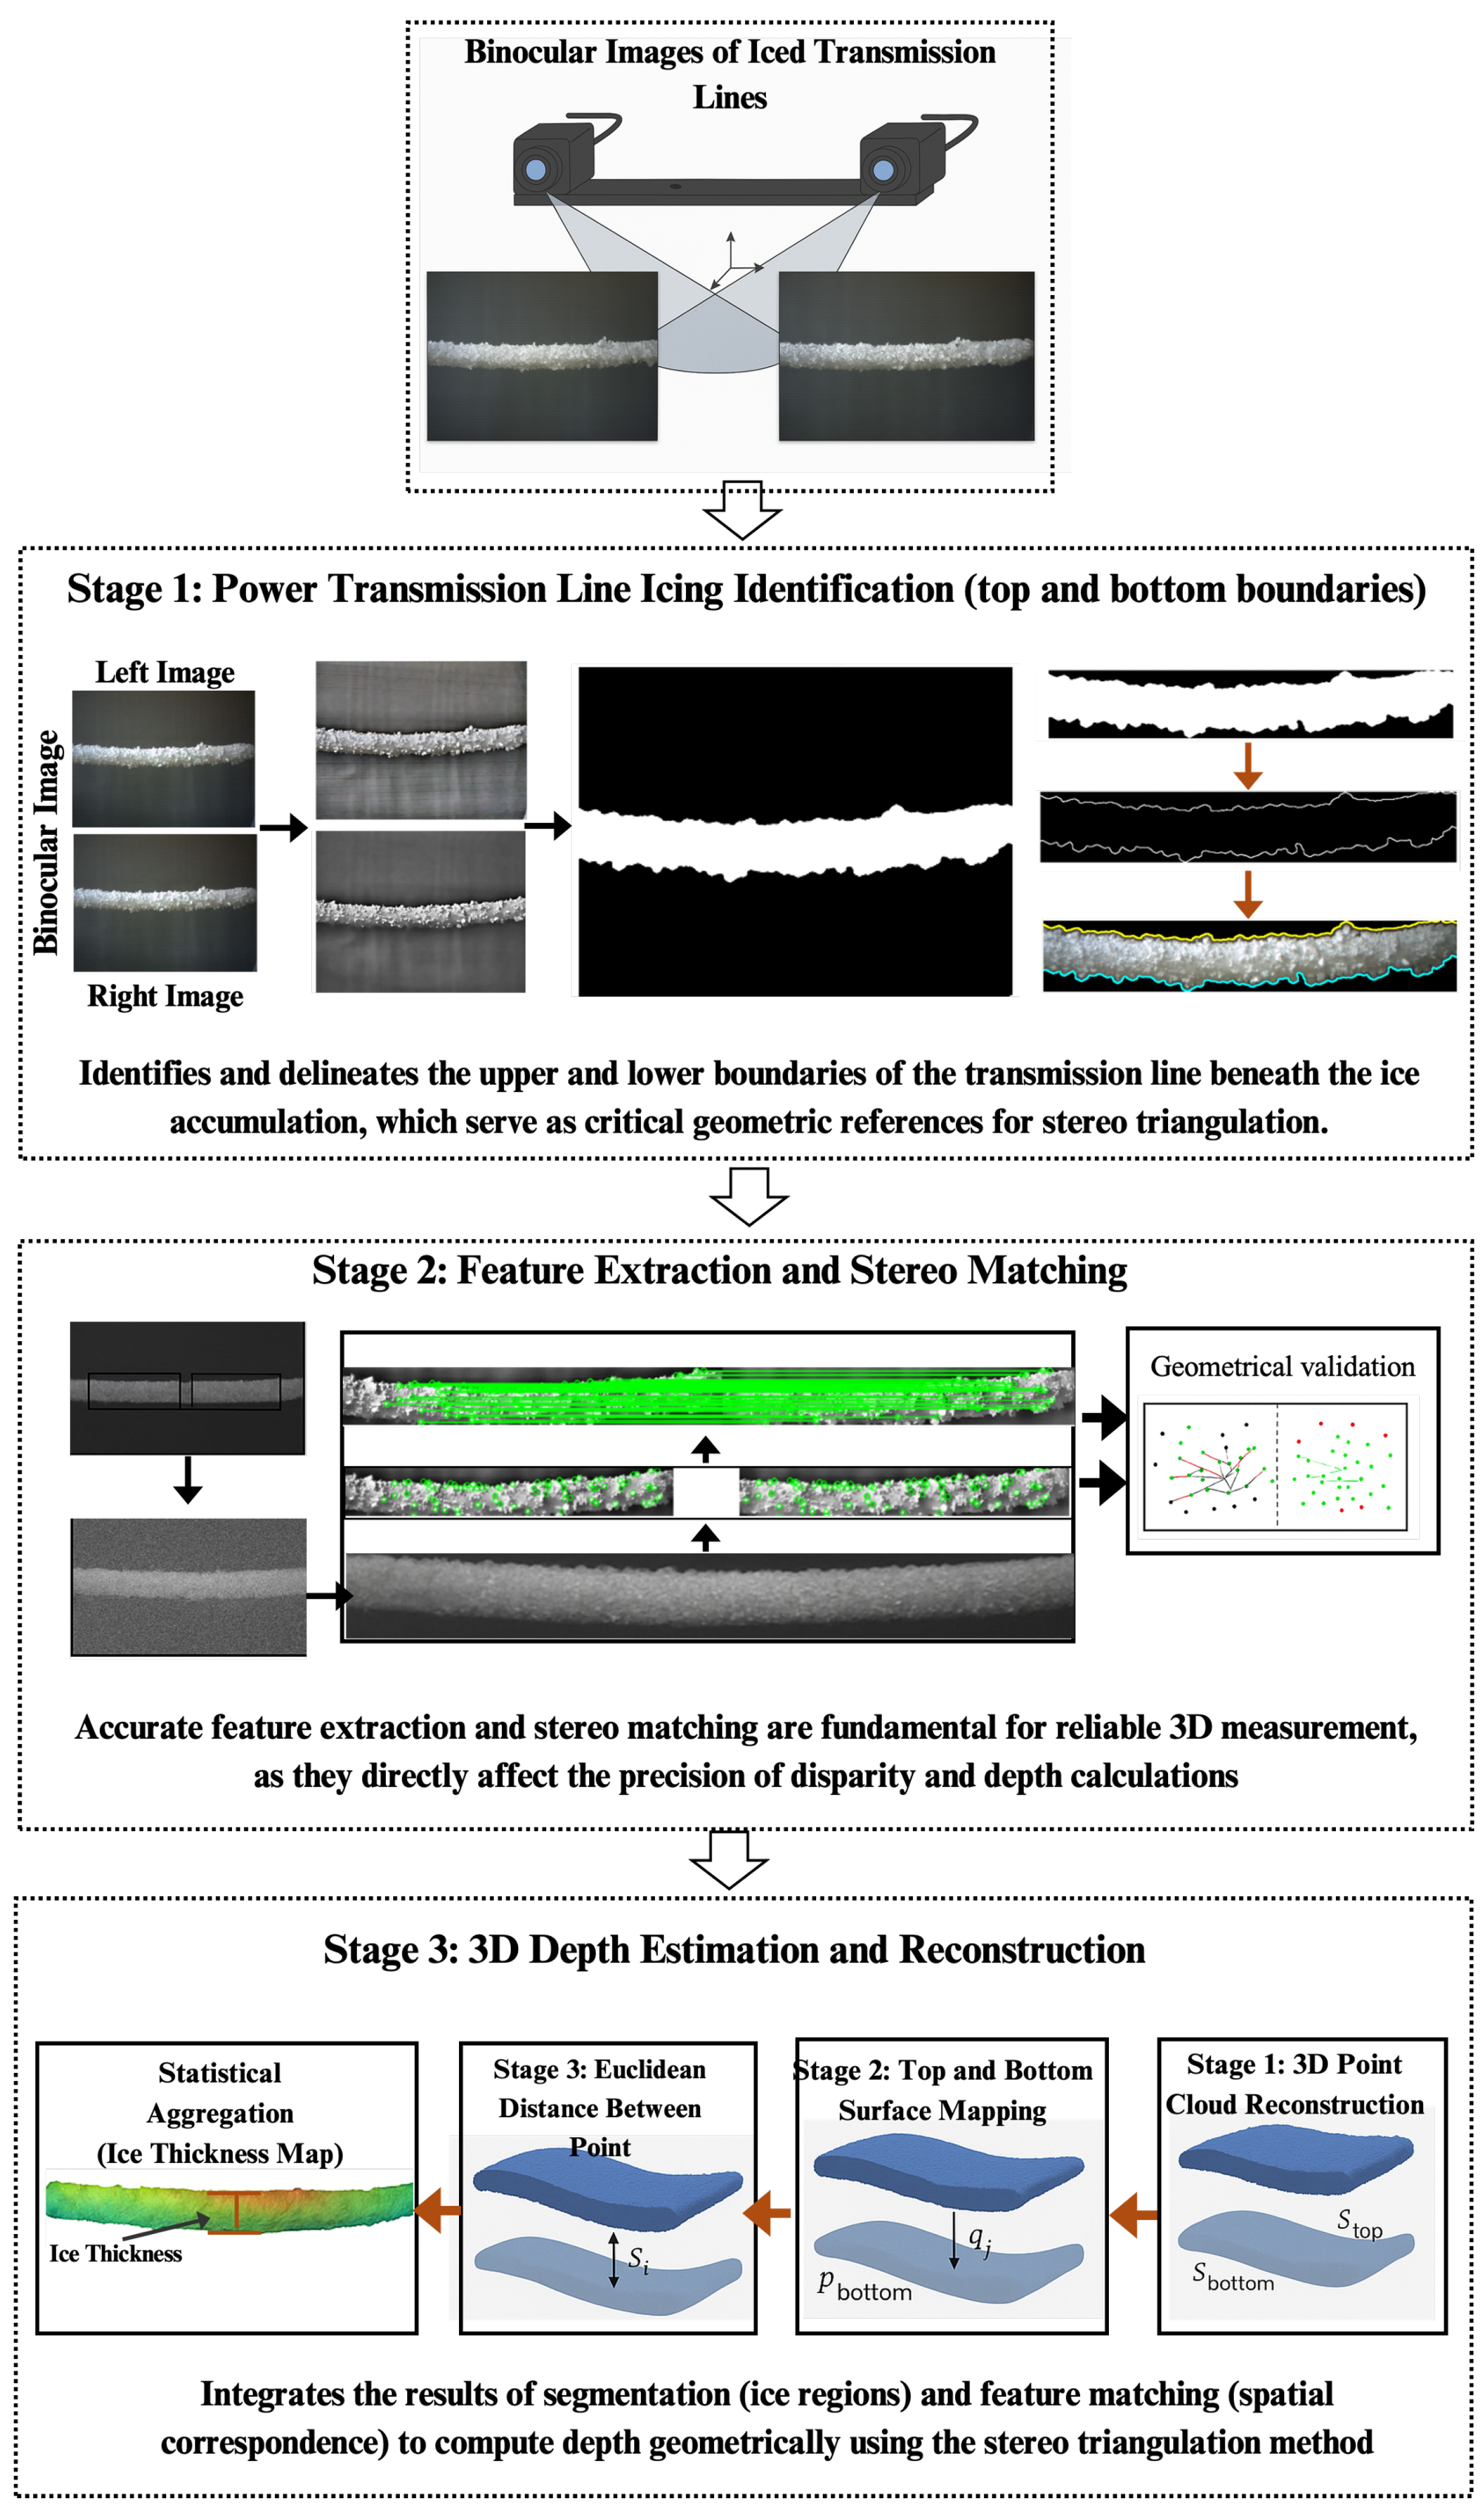
The proposed framework for three-dimensional monitoring of power transmission line icing consists of three main stages: (1) adaptive preprocessing and segmentation, (2) stereo feature extraction and matching, and (3) three-dimensional reconstruction of ice thickness. The overall pipeline is illustrated in Figure 4, where the input binocular images are progressively processed through the designed modules until the final output of a millimeter-level ice thickness profile is obtained. The system is implemented using a binocular stereo camera setup with a baseline of 20 cm mounted on a stable platform.
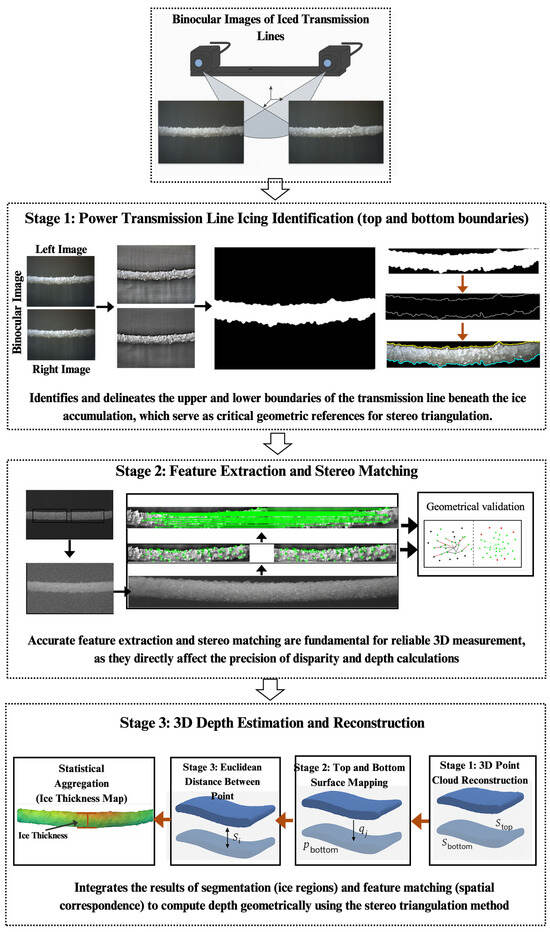
Figure 4.
System Overview.
Image acquisition and processing are performed on a workstation equipped with an Intel® Core™ i5 CPU, NVIDIA RTX™ GPU, and 32 GB RAM, ensuring real-time or near real-time capability. The algorithms are implemented in Python 3.11 using widely adopted libraries such as OpenCV and NumPy, which guarantee reproducibility and compatibility with existing computer vision frameworks.
2.3. Adaptive Preprocessing and Segmentation
The first stage aims to enhance image quality and isolate the ice-covered regions of the power transmission line. This stage comprises three functional modules: illumination correction, noise suppression and structure preservation, and context-driven segmentation and edge refinement, as detailed below.
Illumination and Color Normalization. The raw stereo images often exhibit uneven illumination and low contrast due to outdoor or simulated lighting. To correct this, the multiscale Retinex with nonlinear color restoration (MSRCR) algorithm is applied using three Gaussian surround functions with scales , , and . The restoration gain and offset parameters are fixed to 125 and 46, respectively. The logarithmic ratio formulation is given by
where equal weights are used for each color channel . This procedure effectively balances the illumination and color saturation across the image.
Adaptive Grayscale Conversion and Noise Filtering. The enhanced RGB image is transformed to grayscale using an adaptive weighted luminance model:
where adjusts brightness according to local color variance. The grayscale image is then filtered using a multiscale bilateral guided filter with kernel sizes , , and , spatial standard deviation , and range standard deviation . This preserves edges while removing high-frequency noise and reflections.
Graph-Based Context-Aware Segmentation. A modified Felzenszwalb–Huttenlocher (FH) graph segmentation is implemented. The similarity measure between pixels p and q is defined as
where balances intensity and gradient terms. The adaptive threshold k is set as
allowing region merging to adapt to texture complexity. Superpixels obtained are fused based on contrast-aware similarity using in CIELab space, ensuring continuity along the line surface.
Hybrid Multiscale Edge Detection and Semantic Contour Refinement. To delineate precise ice boundaries, a hybrid gradient–morphology operator is used:
where and S is a structuring element. Directional filtering at , , , and ensures detection of both horizontal and oblique lines.
The resulting edge map is refined by connected component analysis, eliminating regions smaller than 50 pixels and merging adjacent regions sharing boundary continuity above 80%. Finally, a semantic contour extraction isolates the top and bottom conductor–ice boundaries using positional heuristics relative to the central axis of the line. This step yields continuous and accurately localized contours that define the geometric envelope for the subsequent stereo correspondence process.
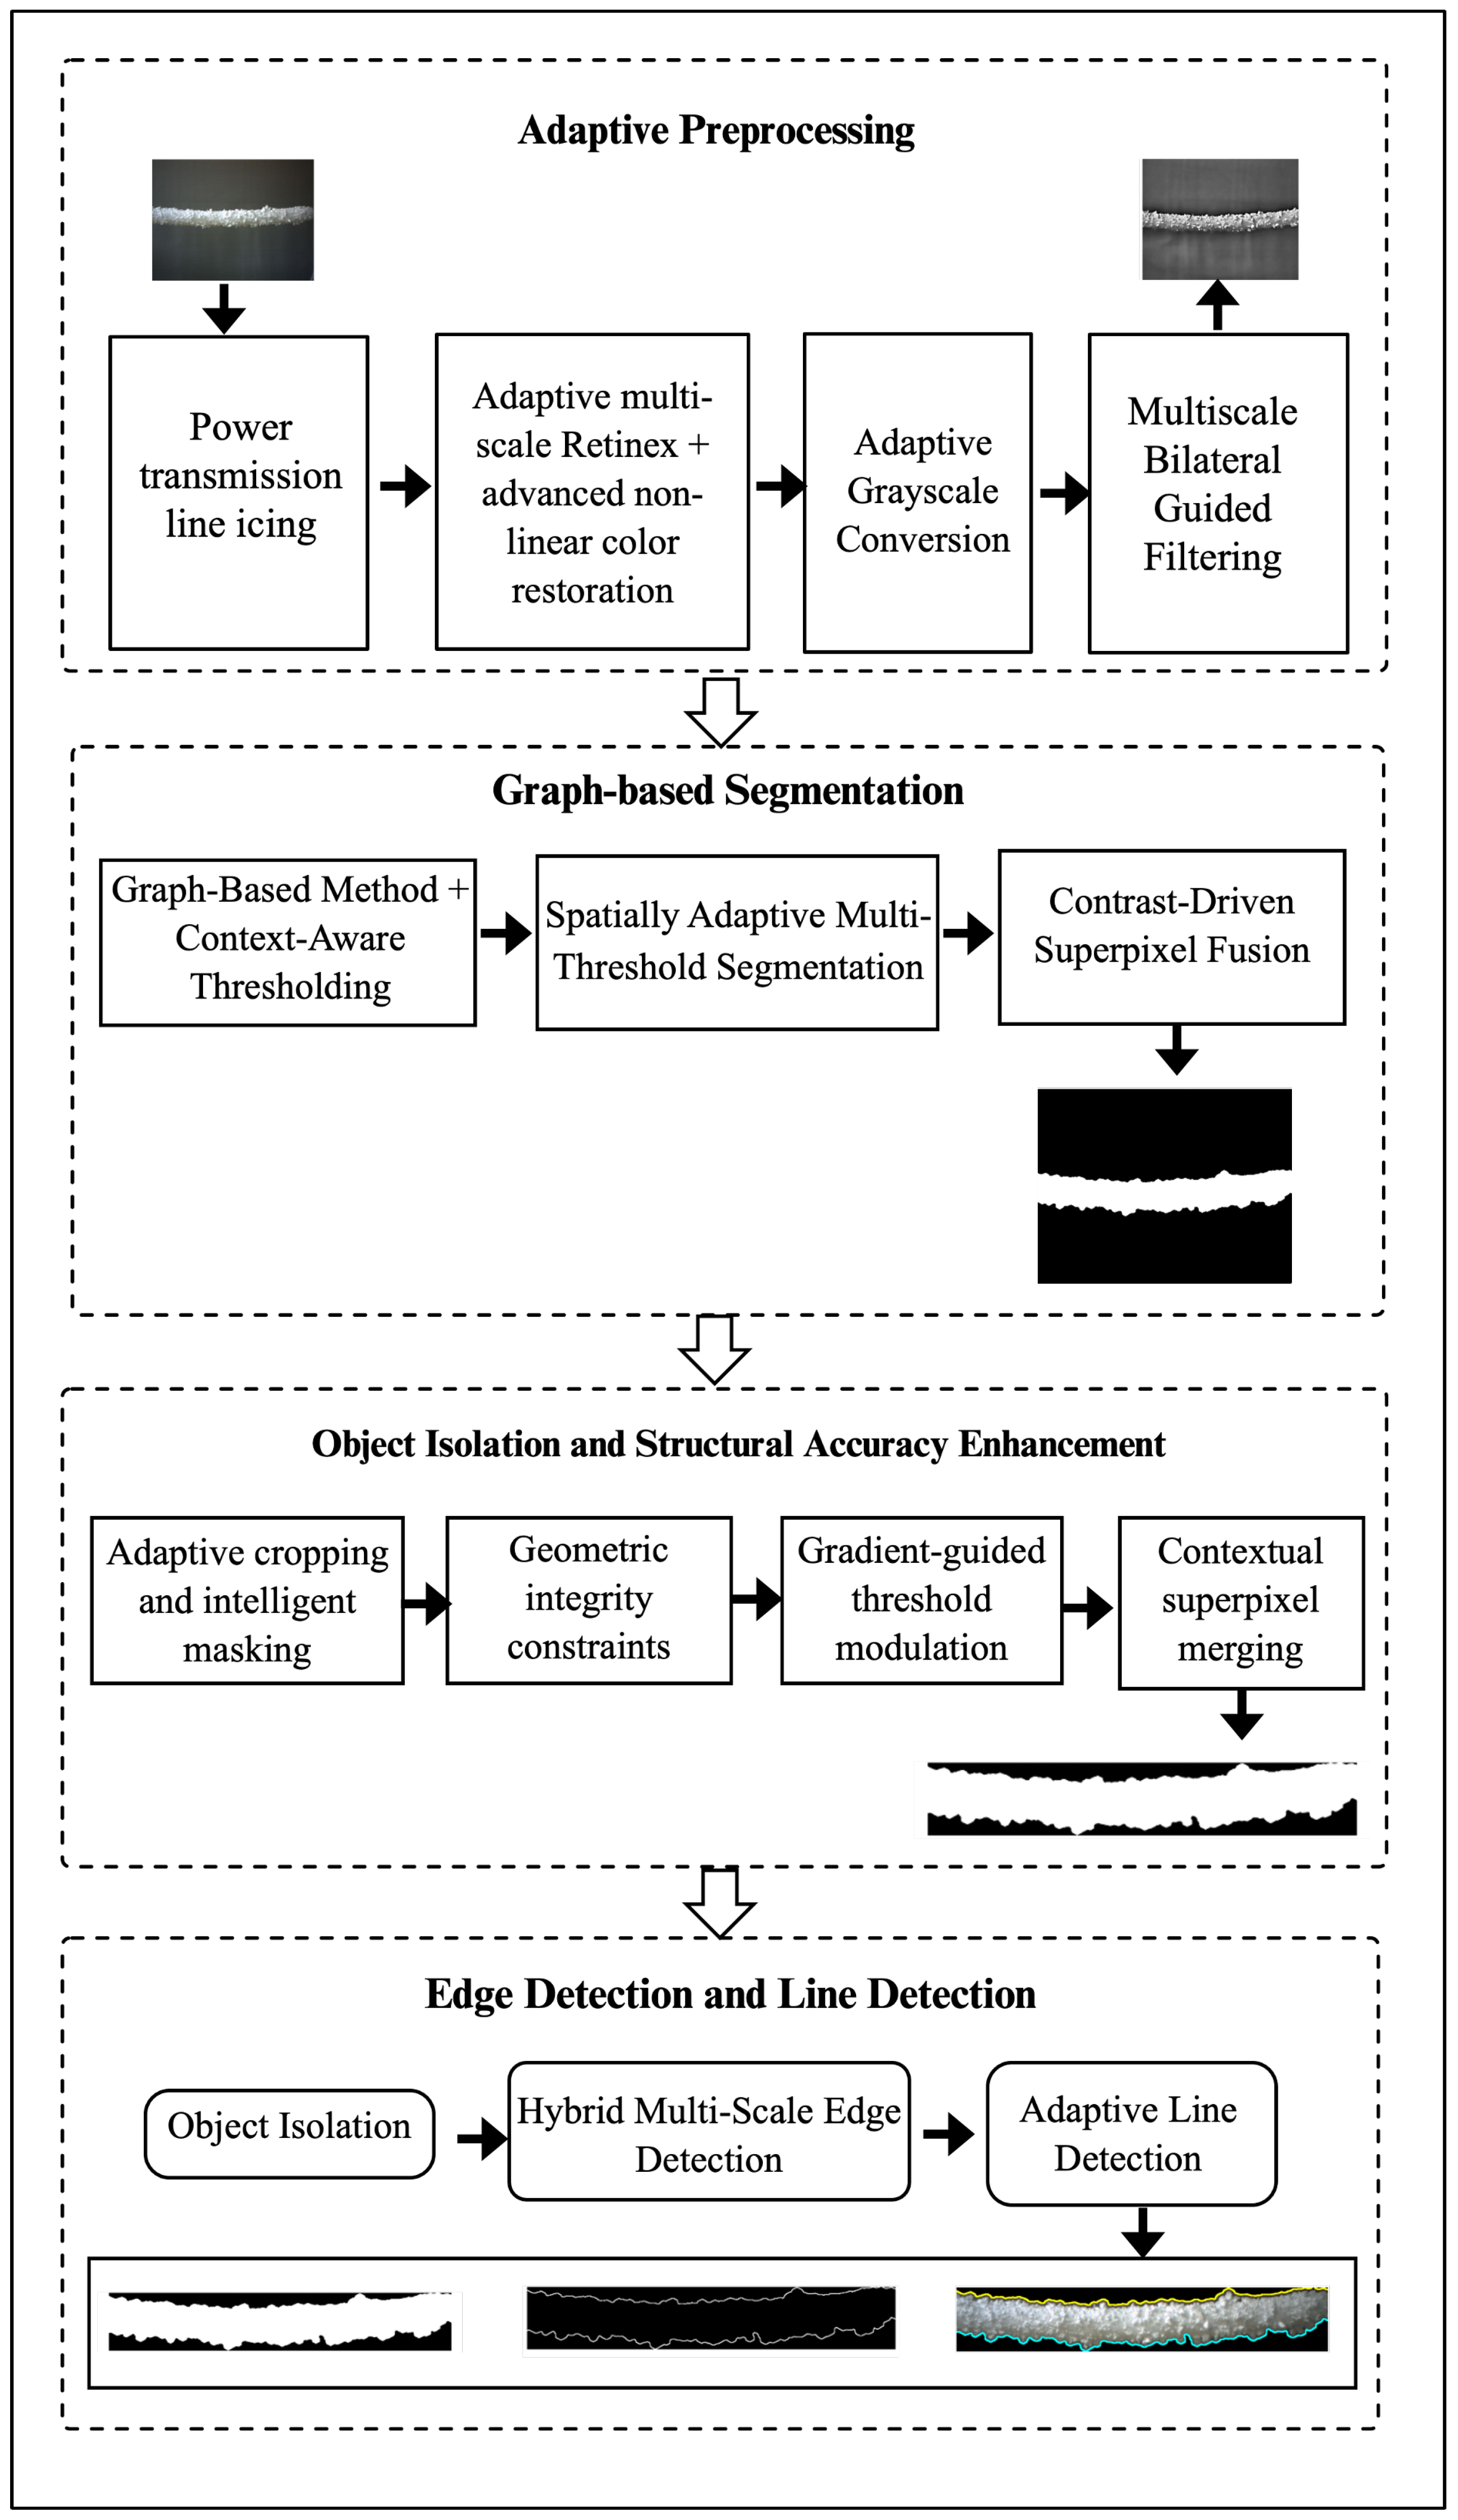
The workflow of this stage is presented in Figure 5, which outlines the preprocessing, segmentation, and identification of top and bottom ice structures. The refined ice contours extracted in this stage provide the geometric foundation for stereo correspondence in Stage 2 and serve as reference structures for accurate 3D reconstruction in Stage 3. Accurate identification of the top and bottom ice structure lines is crucial to ensure reliable disparity estimation and precise ice thickness measurement.
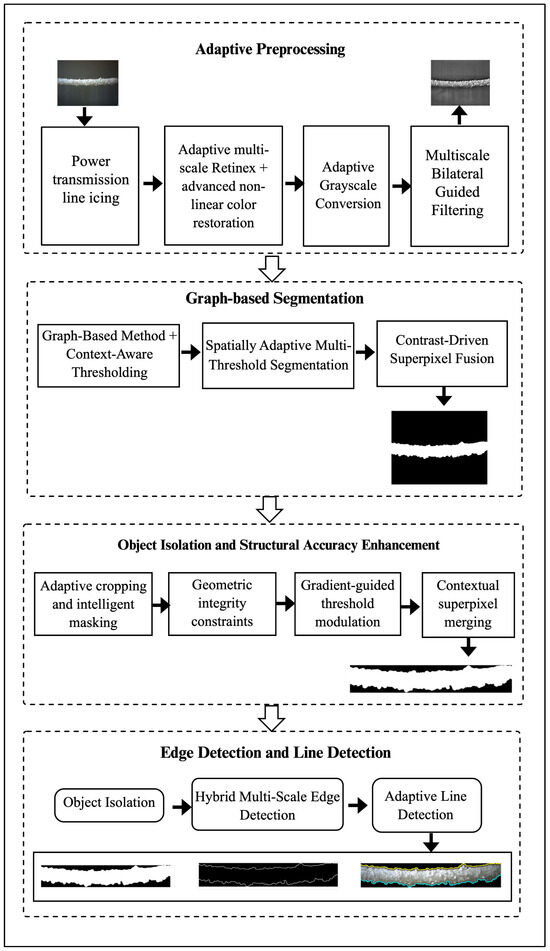
Figure 5.
The workflow of adaptive preprocessing and segmentation.
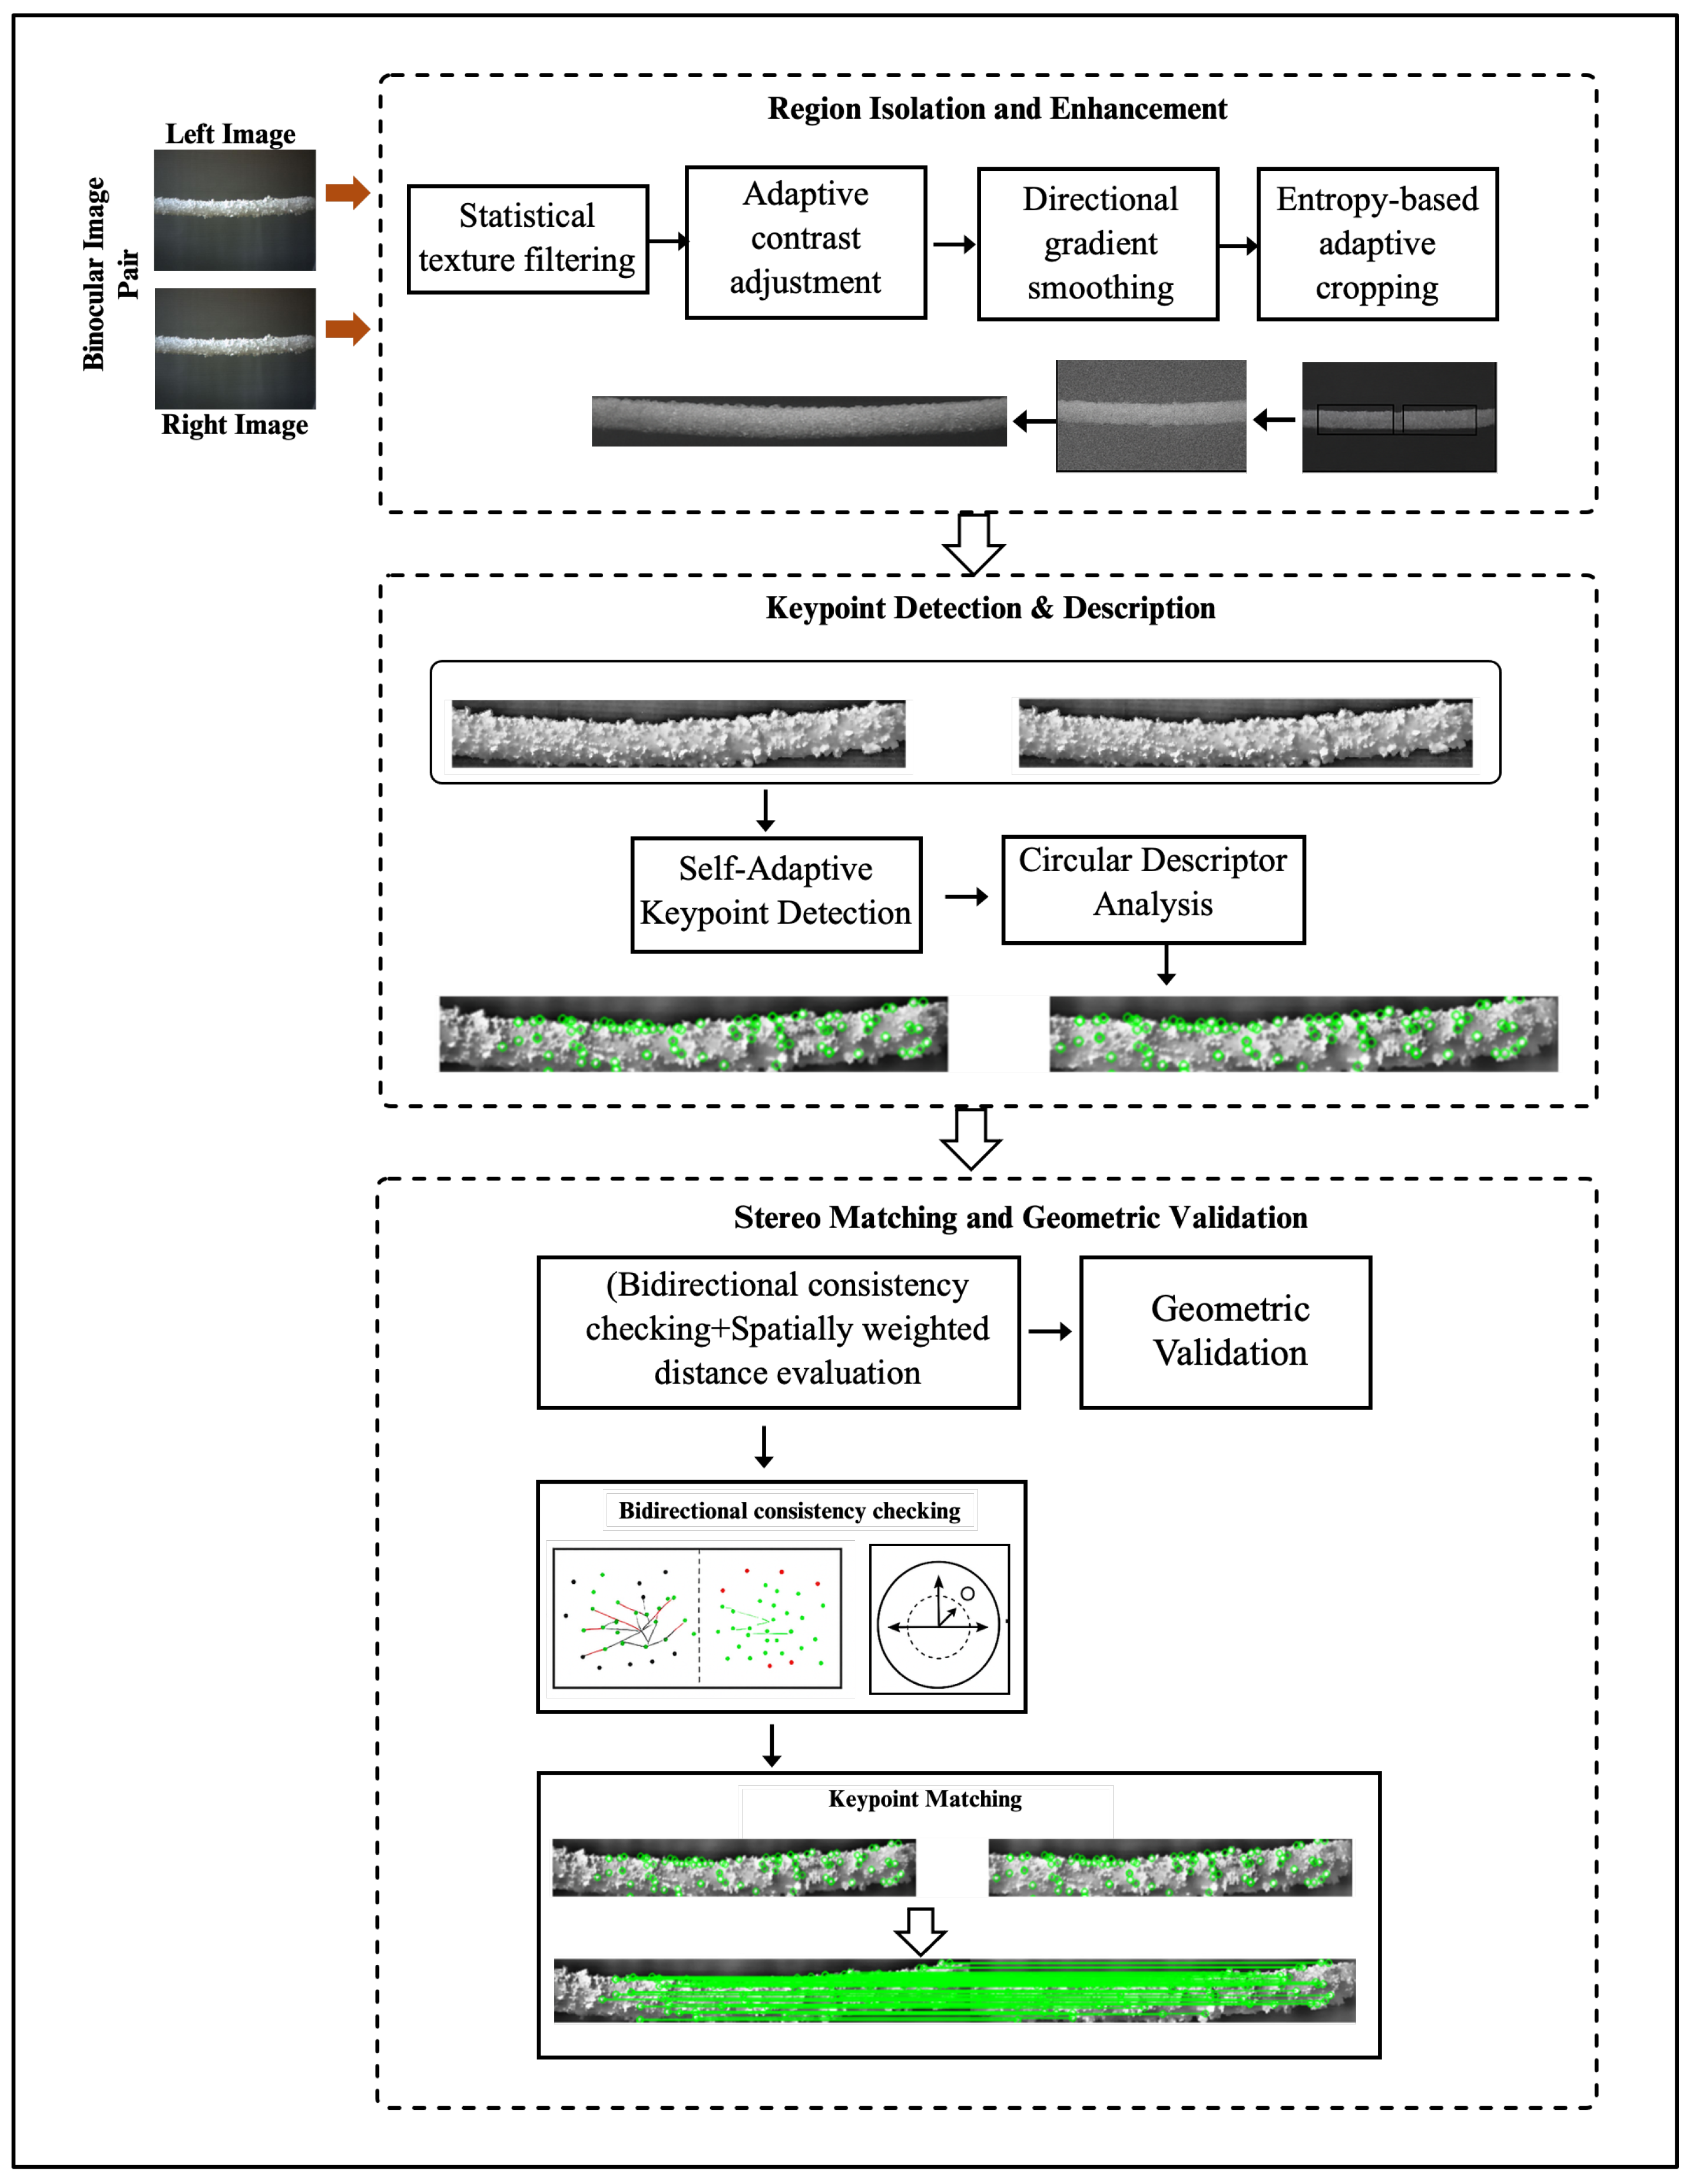
2.4. Feature Extraction and Stereo Matching
This stage establishes accurate correspondences between the enhanced left and right images. The procedure integrates entropy-based region selection, adaptive keypoint detection, and multi-level geometric validation.
Entropy-Based Adaptive Cropping. The Shannon entropy is computed as
in sliding windows (size = pixels) across the image. Windows with are considered low-information regions and excluded, restricting matching to areas with sufficient texture near the line and ice. This reduces computation by approximately 40% and avoids background mismatches.
Directional Gradient Enhancement. To improve feature visibility, a directional smoothing filter (3 × 3 kernel) is applied along the dominant gradient orientation obtained from the Sobel operator. Local contrast is further enhanced by an adaptive gain function defined as
scaled within the range [1, 2].
Self-Adaptive Keypoint Detection. Keypoints are detected using an improved ORB–Shi–Tomasi hybrid method. The initial threshold is dynamically modulated by local variance , yielding
For each keypoint, a circular descriptor of radius pixels and 256-bit BRIEF pattern is generated. The number of keypoints is capped at per image to balance density and computational load.
Bidirectional Matching and Ratio Test. Matching is performed using the Hamming distance metric in a bidirectional brute-force matcher (OpenCV BFMatcher). A ratio test with threshold is applied, and only mutual nearest-neighbor pairs satisfying cross-consistency are retained. Spatial proximity weighting is defined as
to prioritize geometrically plausible matches.
Multi-Level Geometric Validation.
- (a)
- RANSAC Epipolar Filtering: Applied with a reprojection error threshold pixels to remove outliers.
- (b)
- M-Estimator Sample Consensus (MSAC): Further refines the inlier set using adaptive confidence and maximum iterations = 1000.
- (c)
- Least-Median-of-Squares (LMedS): Minimization recalculates the fundamental matrix F for final correction.
These hierarchical validations ensure that the retained correspondences conform to the physical geometry of the stereo pair.
Output for 3D Reconstruction. The final disparity map is computed for each validated correspondence, producing dense, reliable matches concentrated on the conductor and ice regions. These disparities serve as direct input for the triangulation process described in Section 2.5.
This stage provides the dense and reliable stereo correspondences that serve as the input for triangulation in Stage 3. The accuracy of disparity estimation directly influences the precision of the reconstructed 3D ice surface and, consequently, the ice thickness measurement. The detailed workflow of this stage is illustrated in Figure 6, showing the progression from adaptive cropping to geometric validation within the stereo matching process.
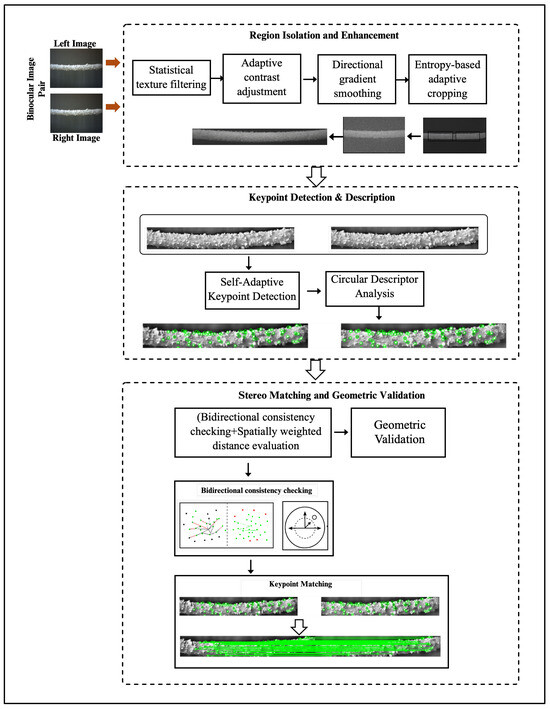
Figure 6.
The workflow of the stereo matching process.
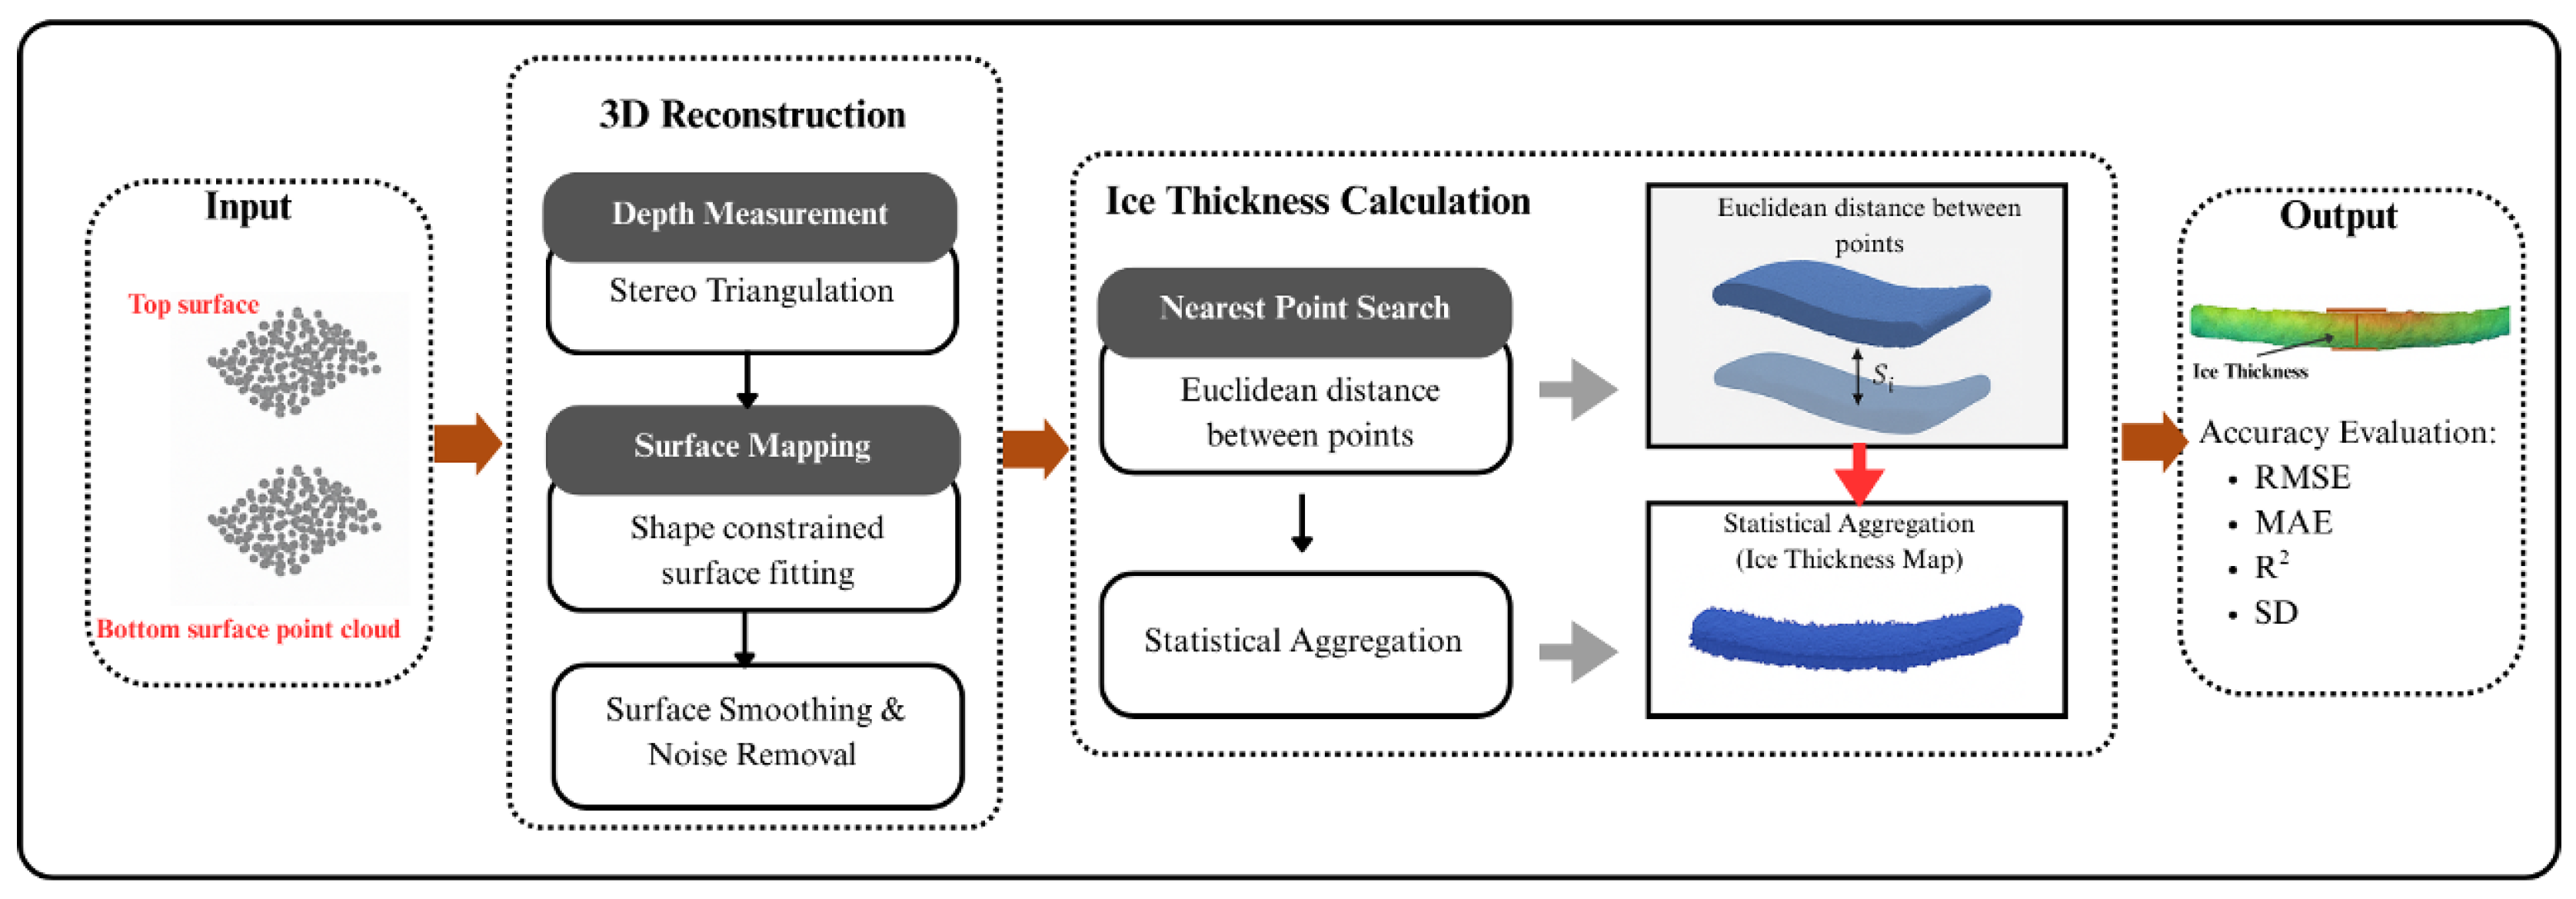
2.5. 3D Reconstruction of Ice Thickness
The final stage of the framework focuses on the three-dimensional reconstruction of ice thickness based on stereo vision. Initially, disparity maps are obtained from the robust stereo correspondence results in Stage 2. For a calibrated binocular stereo system with focal length f, baseline distance B, and disparity value d, the depth Z of a pixel point can be derived as:
Using this depth information, the three-dimensional coordinates of each point in the world coordinate system are calculated from its image coordinates as:
where represent the principal point of the stereo camera. This formulation yields a dense point cloud that represents both the transmission line and the attached ice.
To improve reconstruction reliability, a shape-constrained refinement is introduced, considering that the transmission line approximates a cylindrical geometry while the ice accumulation tends to form parabolic or semi-cylindrical layers around it. A parametric model is thus fitted to the reconstructed data by minimizing the deviation between observed 3D points and the assumed geometric prior. For a cylindrical model with radius r and axis line L, the fitting error can be expressed as:
where denotes the reconstructed point coordinates and is the perpendicular distance of the point to the line axis.
Similarly, for parabolic fitting, the vertical deviation of point coordinates from a parabola is minimized:
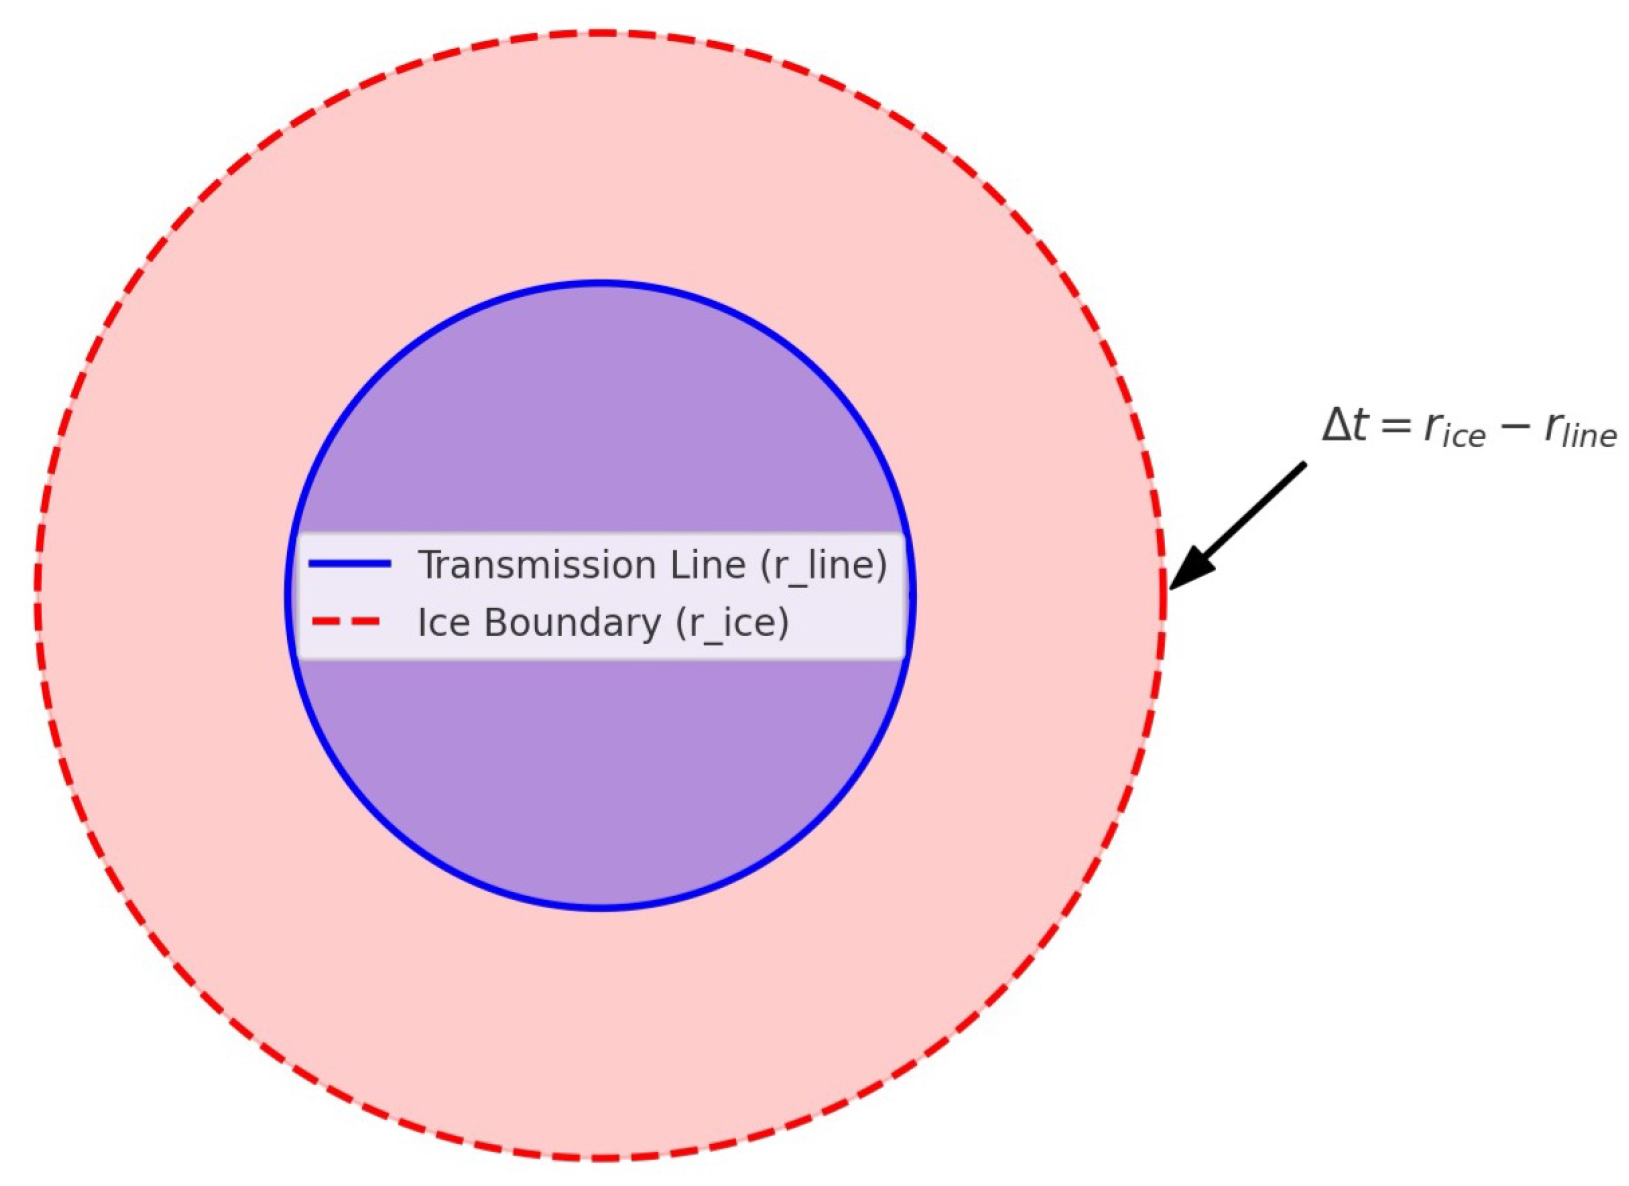
The final ice thickness at a given cross-section is obtained by computing the radial difference between the refined outer ice contour and the estimated conductor surface:
where is the radius of the reconstructed ice boundary and is the radius of the bare conductor.
Through this process, the framework delivers millimeter-level quantitative estimations of ice thickness along the transmission line. The outputs of this stage include the reconstructed 3D point cloud, refined geometric surface, and detailed thickness profile that can be directly used for risk assessment and icing hazard mitigation. A schematic illustration of this stage is shown in Figure 7, highlighting the flow from disparity maps to thickness estimation. Figure 8 shows the cross-sectional model of the transmission line and ice layer.
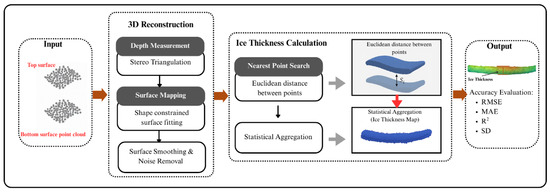
Figure 7.
The workflow of ice thickness measurement.
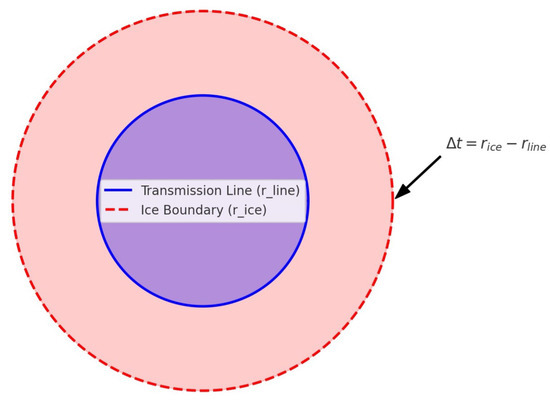
Figure 8.
Cross-sectional model of transmission line and ice layer.
2.6. Evaluation Metrics
The performance of the proposed framework is quantitatively evaluated at three levels: segmentation, feature matching, and three-dimensional reconstruction. Each level adopts standard and widely used evaluation metrics to ensure objective comparison. In contrast to deep learning-based segmentation or feature matching, the proposed method adopts a fully rule-driven design in which all parameters are adaptively determined from image statistics and geometric constraints, without relying on any data-driven training process.
2.6.1. Segmentation Metrics
To evaluate the accuracy of icing region detection, the following metrics are computed: accuracy, sensitivity (recall), specificity, and precision. These are defined as:
where , , , and represent the number of true positives, true negatives, false positives, and false negatives, respectively. High values across these metrics indicate reliable and consistent segmentation of icing regions.
2.6.2. Feature Matching Metrics
For stereo feature correspondence evaluation, precision, recall, and the F1-score are computed as follows:
In addition, the average processing time per image pair is recorded to assess the computational efficiency of the proposed framework.
To ensure objective evaluation of the feature matching performance, the ground truth correspondences were derived from the calibrated stereo image pairs described in Section 2.1.2. Since the intrinsic and extrinsic parameters of the stereo system were precisely known, the rectified epipolar geometry enabled the computation of the true disparity values for all conjugate points. For each detected keypoint in the left image, its theoretical conjugate location in the right image was estimated based on the known baseline B, focal length f, and camera orientation parameters. Matched pairs within a tolerance of pixel from the ground truth disparity were classified as true matches (true positives), while those outside this range were considered false matches. This procedure provided a reliable reference for calculating precision, recall, and F1-score in Section 3.2.
2.6.3. 3D Reconstruction Metrics
The accuracy of ice thickness estimation is evaluated using root mean square error (RMSE), mean absolute error (MAE), the coefficient of determination (), and deviation with respect to manual caliper measurements:
where denotes the estimated ice thickness, is the corresponding ground truth measurement, is the mean of the ground truth values, and N is the total number of samples. Furthermore, the deviation with respect to manual caliper measurements is reported to provide practical validation of measurement accuracy.
3. Results
The experimental results are presented to validate the effectiveness of the proposed binocular vision framework for power transmission line icing (PTLI) monitoring. The evaluation is organized into four main aspects: PTLI identification performance, feature matching performance, 3D reconstruction accuracy, and comparison with existing methods. All experiments were conducted on a workstation equipped with an Intel® Core™ i5 CPU (Intel Corporation, Santa Clara, CA, USA), NVIDIA RTX™ GPU (NVIDIA Corporation, Santa Clara, CA, USA), and 32 GB RAM. The algorithms were implemented in Python 3.1.1 using OpenCV and NumPy libraries. Since the proposed stereo vision framework is fully rule-driven and does not rely on data-driven training, all parameters were analytically determined based on image statistics and geometric constraints. The system processes stereo pairs with a baseline of 200 mm and a resolution of 1920 × 1080 pixels. The RANSAC reprojection threshold was set to 3 pixels, the ratio test threshold to 0.6, and a maximum of 7000 keypoints were detected per image. The average processing time per stereo pair ranged between 0.014–0.037 s, confirming real-time capability under the described setup.
3.1. PTLI Identification Performance
An ablation study was conducted on 30 randomly selected PTLI images using the sensitivity metric to evaluate the contribution of each image processing stage (Equation (7)). In the proposed PTLI identification framework to analyze the contribution of each module, seven experimental configurations (Method 1–7) were evaluated. Each configuration represents a specific combination of preprocessing, segmentation, and edge enhancement components, as summarized below:
- Method 1: Baseline without preprocessing (direct grayscale segmentation).
- Method 2: Histogram equalization and threshold-based segmentation.
- Method 3: Adaptive contrast enhancement and Sobel-based edge detection.
- Method 4: Multiscale Retinex preprocessing combined with global thresholding.
- Method 5: Retinex preprocessing with graph-based segmentation.
- Method 6: Retinex with graph-based segmentation and hybrid edge detection.
- Method 7 (Proposed Method): Full integration of adaptive preprocessing, graph-based segmentation, and hybrid multiscale edge detection.
The quantitative comparison of these methods using sensitivity is shown in Table 2. The checkmark (✓) indicates activation of the corresponding method, whereas the en dash (–) denotes its omission.

Table 2.
Sensitivity evaluation for different configurations of the PTLI identification scheme, where adaptive preprocessing (P), noise suppression (N), and graph-based segmentation (GS) were tested selectively.
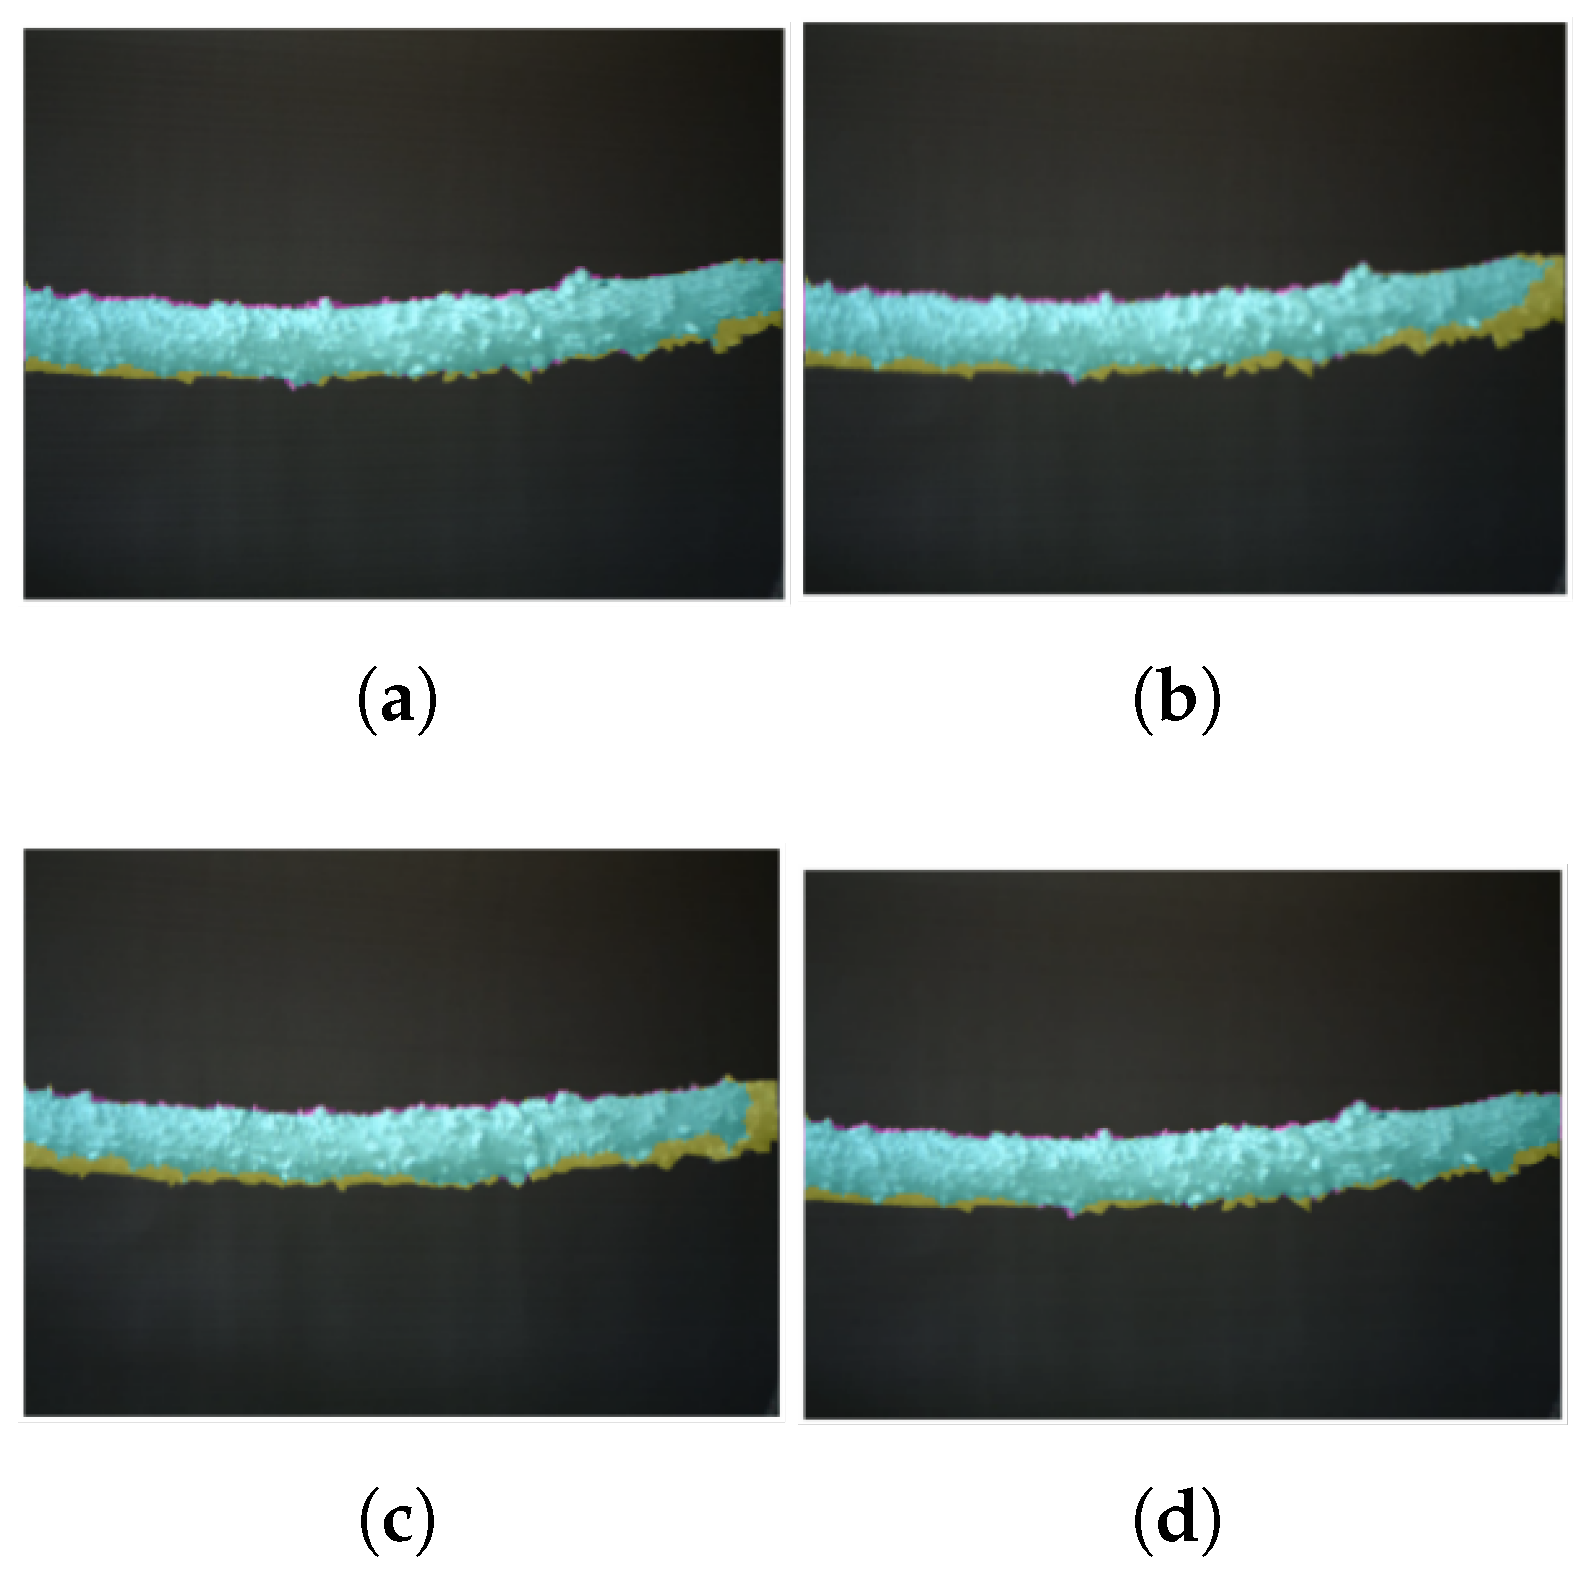
The integration of all three components (P + N + GS) achieved the highest sensitivity (95.18%), confirming that each stage contributes significantly to the system’s robustness. In contrast, configurations that excluded one or more components yielded considerably lower sensitivities, ranging from 33.67% to 82.98%. Figure 9 shows the comparative sensitivity results. The segmentation results under different configurations are shown in Figure 9. Figure 9a presents the result of the P and GS method, Figure 9b corresponds to the GS method, Figure 9c illustrates the N and GS method, and Figure 9d demonstrates the combined P, N, and GS method. These visualizations clearly indicate that the integration of multiple stages yields more consistent and accurate segmentation compared with using a single component.
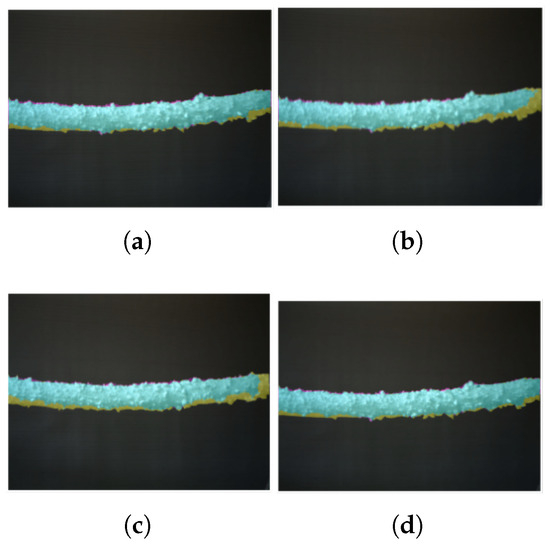
Figure 9.
The visualization results of segmentation on several methods: (a) P and GS method; (b) GS method; (c) N and GS method; (d) P, GS, and N method.
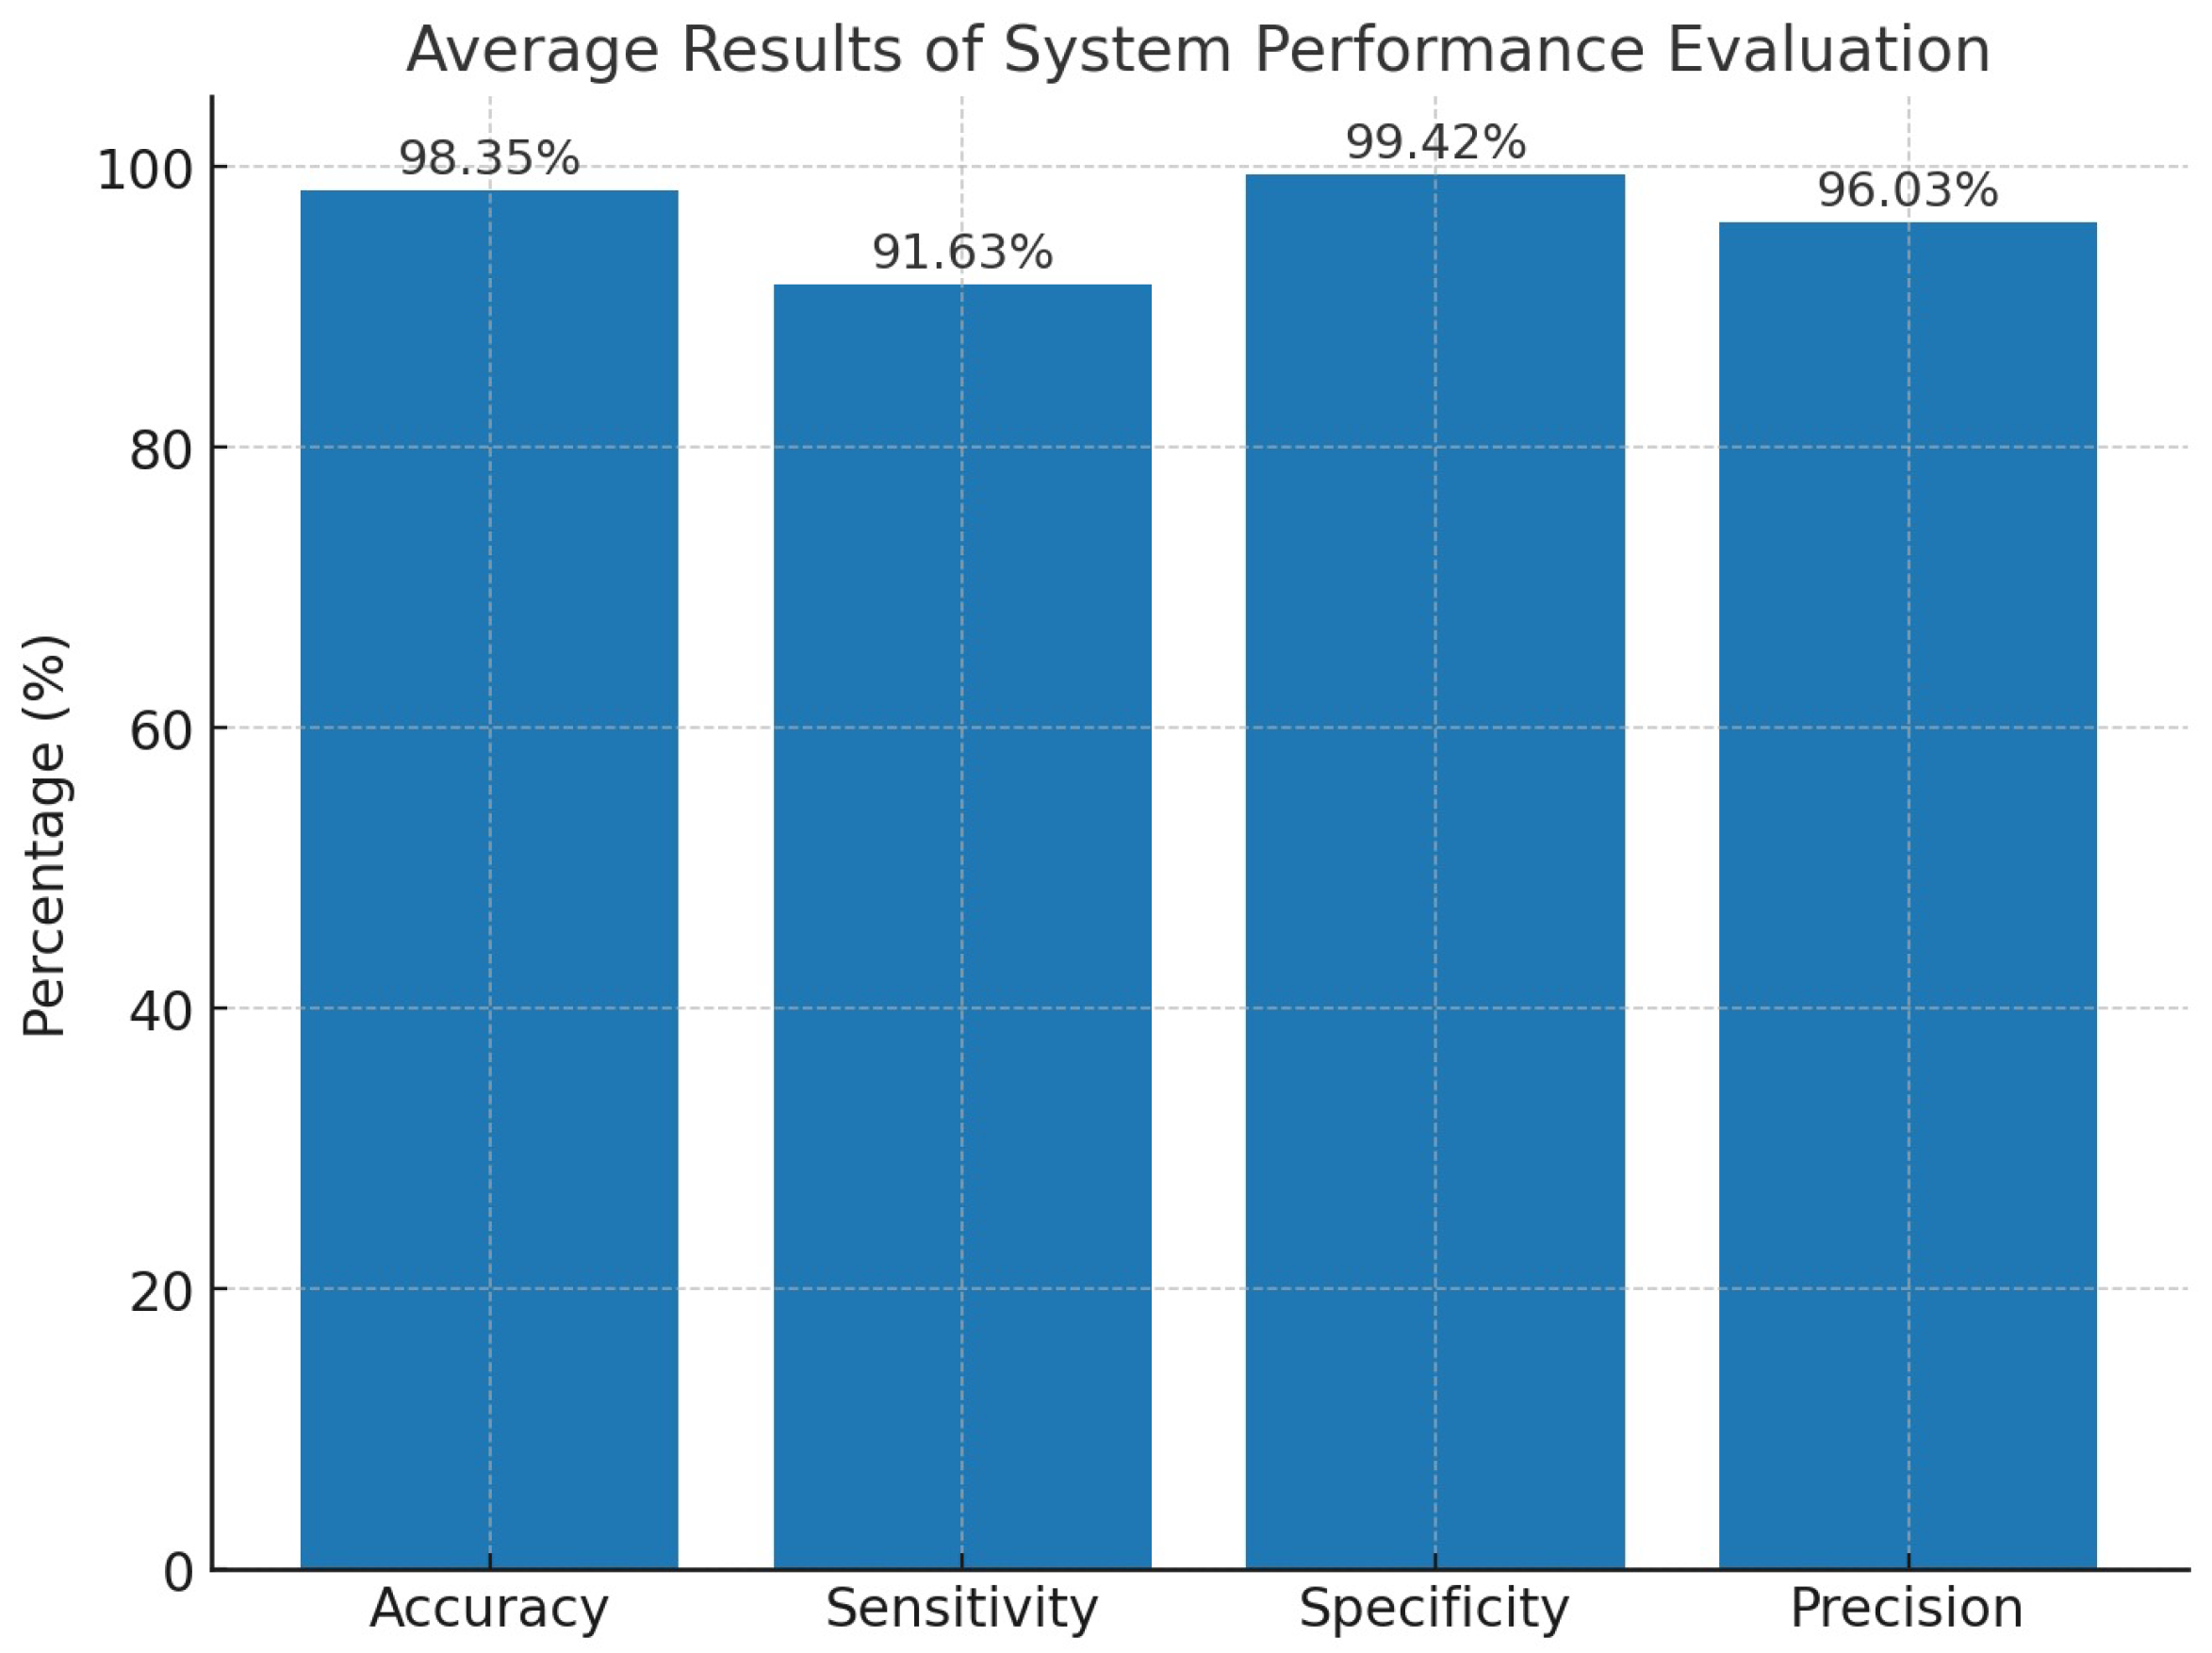
The performance of the proposed PTLI identification scheme was further evaluated using four metrics: accuracy (Equation (6)), sensitivity (Equation (7)), precision (Equation (8)), and specificity (Equation (9)). Figure 10 presents a summary of the average values of the distribution of results on 30 random PTLI images.
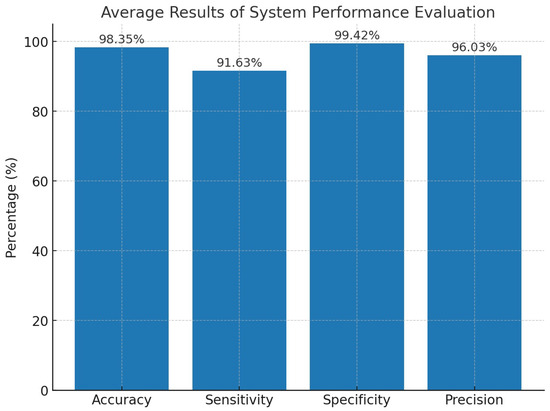
Figure 10.
Average results of system performance evaluation, including accuracy, sensitivity, specificity, and precision.
Quantitative evaluation is summarized in Figure 10, showing that the method achieves 98.35% accuracy, 96.03% precision, 99.42% specificity, and 91.63 sensitivity. These results demonstrate that the adaptive preprocessing and context-aware superpixel fusion significantly improve the robustness of segmentation under varying illumination and complex ice morphology.
For comparative evaluation, one baseline method was selected because it shares the same processing stages (line identification, keypoint matching, and 3D measurement) as the proposed framework. This ensures methodological consistency and allows a fair evaluation of the algorithmic improvements introduced in this paper. A comparison with a conventional approach [5] (the method integrates image restoration, enhancement, and multi-threshold segmentation) is shown in Table 3.

Table 3.
Comparative performance between the proposed and previous methods.
The proposed method significantly outperforms the conventional baseline, particularly in accuracy (+16.4%) and sensitivity (+15.3%). Although precision and specificity slightly decrease, this trade-off is acceptable given the substantial overall performance gains.
3.2. Feature Matching Performance
Stereo feature correspondence was evaluated by visualizing correctly and incorrectly matched points. The correctness of the feature correspondences was verified using the ground truth established from the calibrated stereo geometry. For each image pair, the expected disparity values were obtained from the known camera parameters, and only those correspondences whose pixel deviation did not exceed ±1 pixel from the computed ground truth were regarded as valid matches. This approach ensured accurate and reproducible evaluation of the matching performance. Figure 11 demonstrates the feature matching results, where green lines indicate correct matches, and red lines denote rejected or mismatched correspondences.

Figure 11.
The feature matching results: (a) Method 1; (b) Method 2; (c) Method 3; (d) Proposed Method.
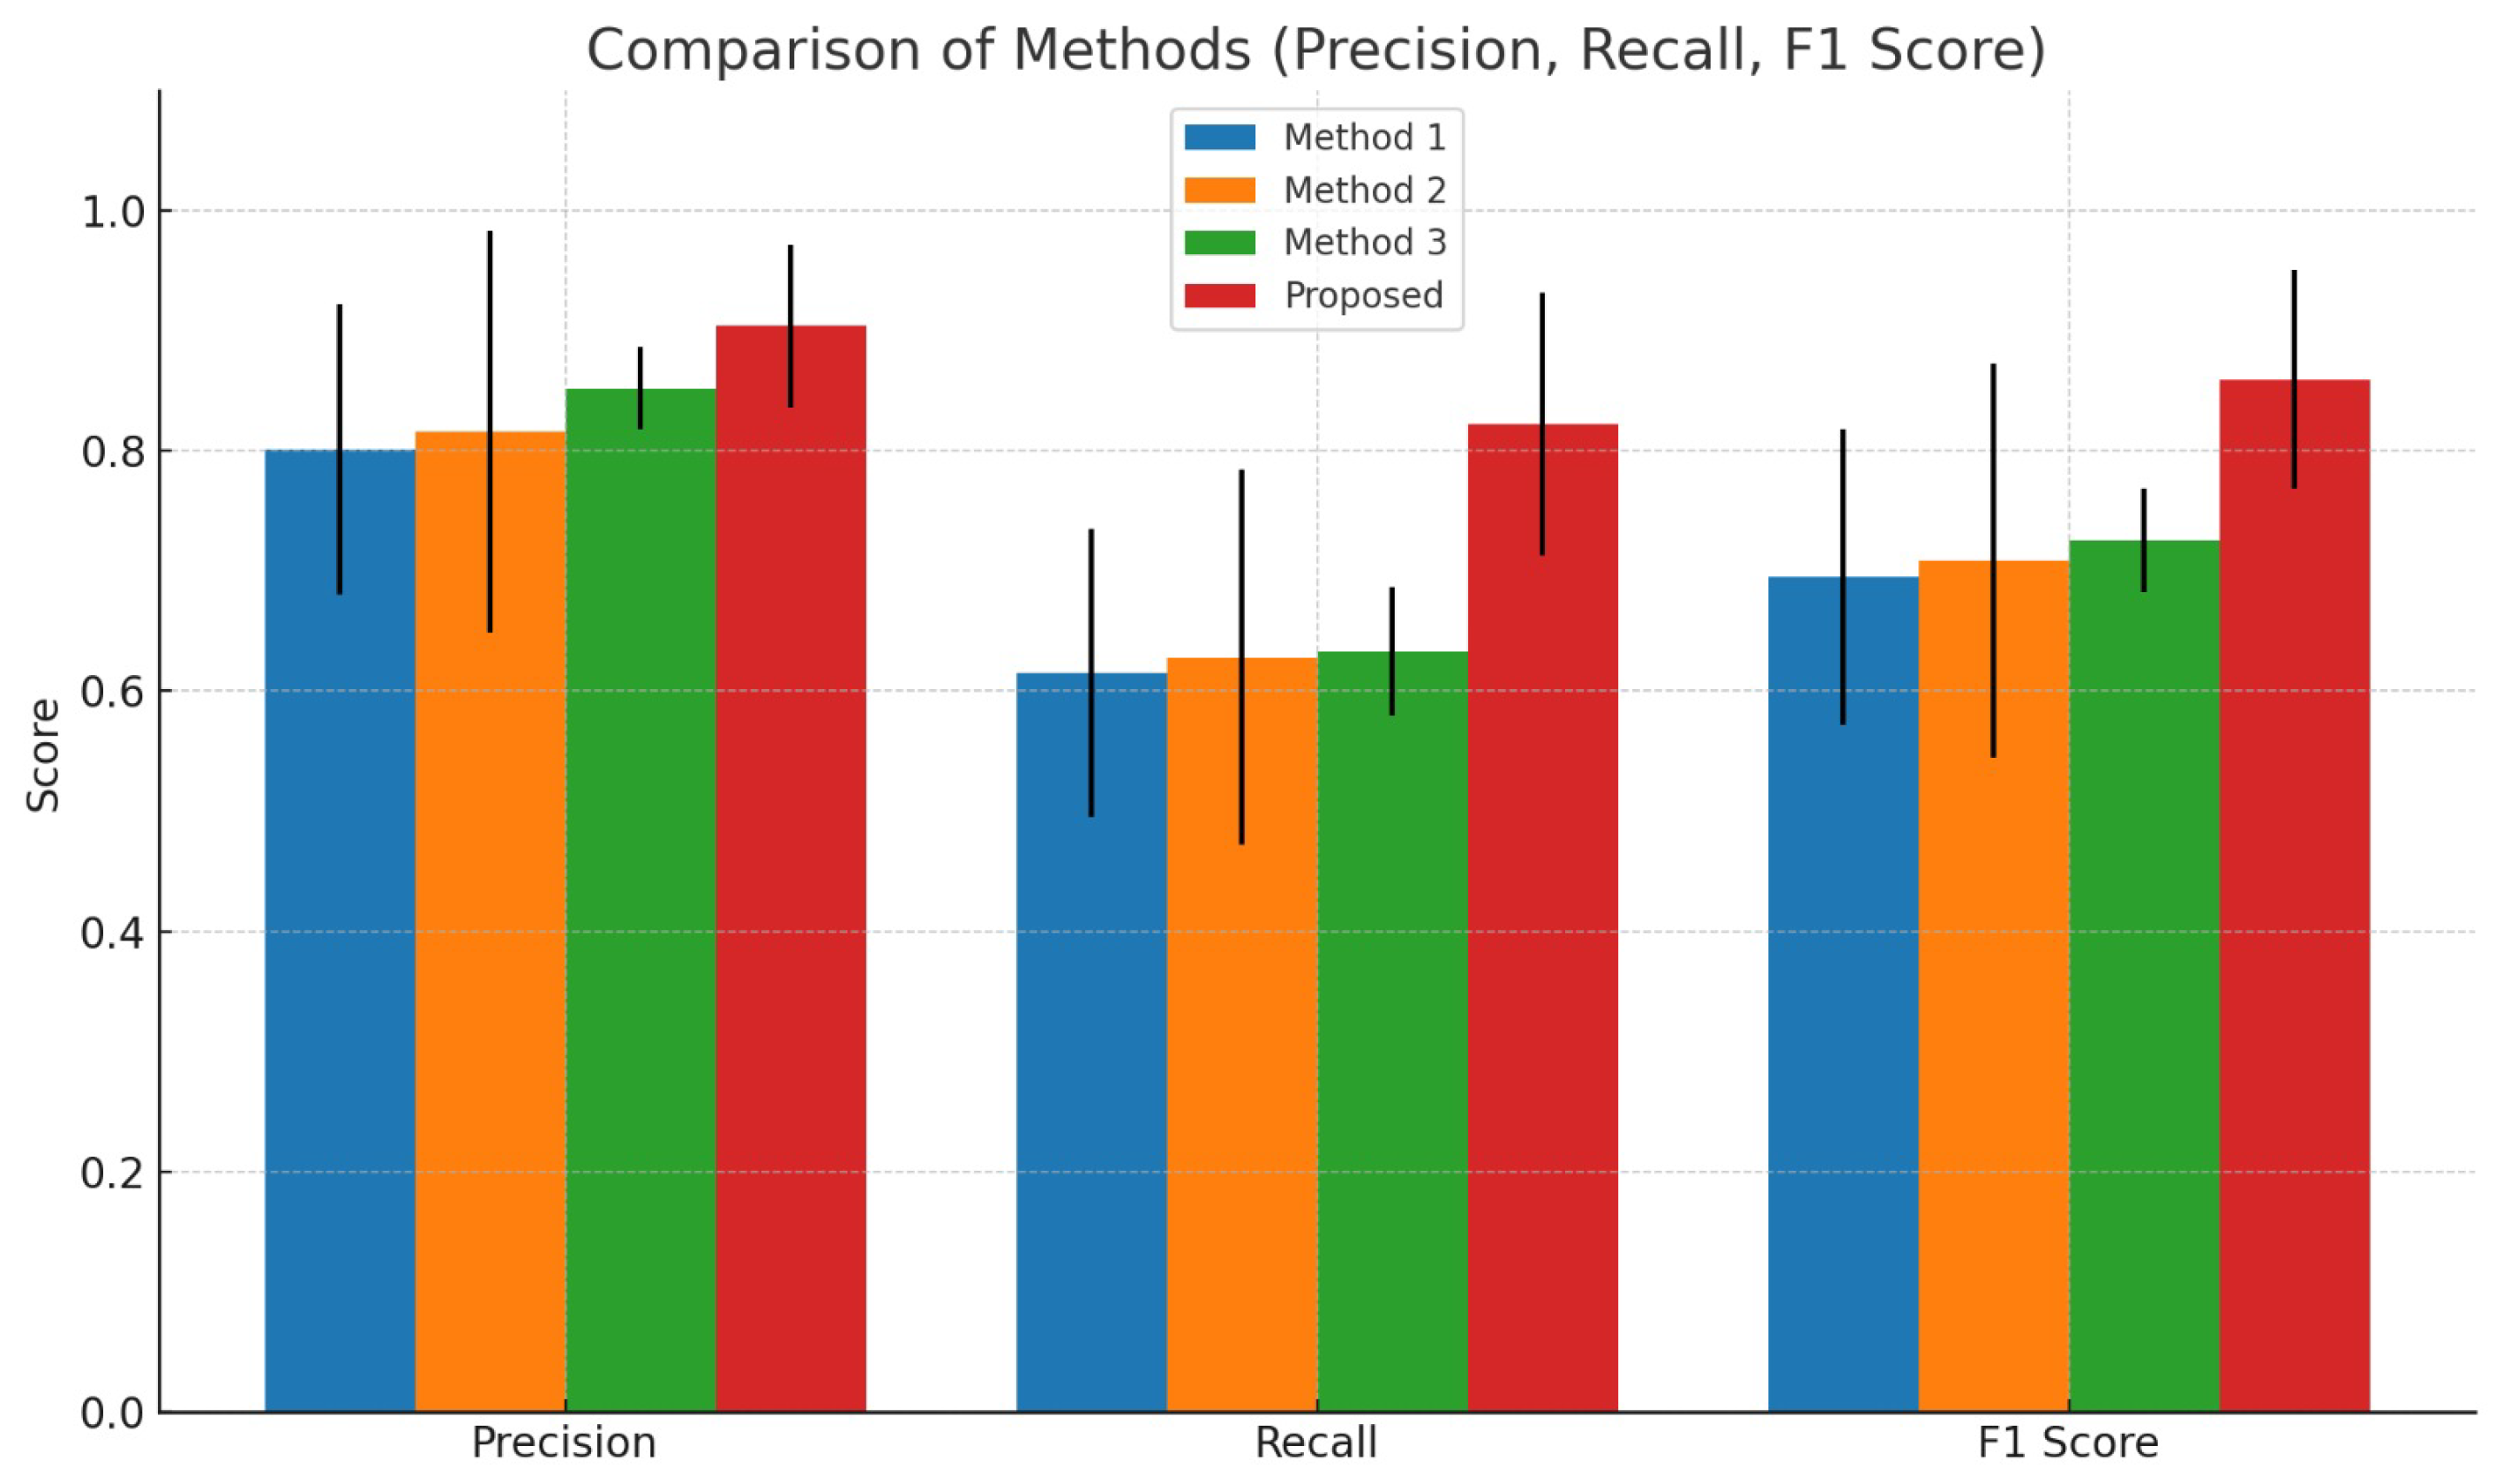
The matching evaluation was performed using precision, recall, and F1-score. The proposed framework achieved a precision of 90%, recall of 82%, and an F1-score of 0.8594, indicating a balance between correct matching and recall of relevant features. Furthermore, the average processing time per image pair ranged between 0.014 s and 0.037 s, highlighting the real-time capability of the method. Table 4 shows the feature matching performance results based on 20 random PTLI images.

Table 4.
Feature matching performance results.
The results presented in Figure 12 indicate that the proposed method consistently outperforms alternative approaches across all evaluation metrics. In terms of precision, the proposed method achieves an average value of 0.9037, which is higher than the values obtained by the other methods, which remain within the range of 0.8012–0.8518. Similarly, the recall results show that the proposed method reaches 0.8219, whereas the remaining approaches demonstrate lower recall values, ranging from 0.6153 to 0.6331. This significant difference suggests that the proposed method is more effective in detecting valid correspondences in complex conditions.
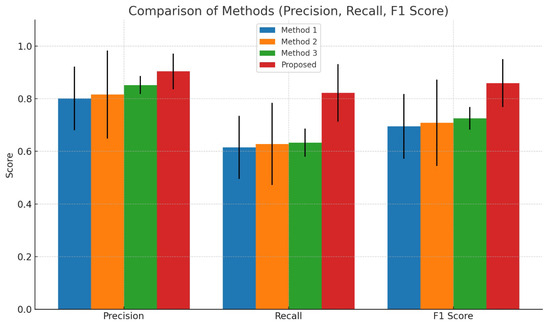
Figure 12.
Evaluation of precision, recall, and F1-score for several methods on PTLI image pairs. The proposed method achieves the highest performance across all metrics with greater consistency.
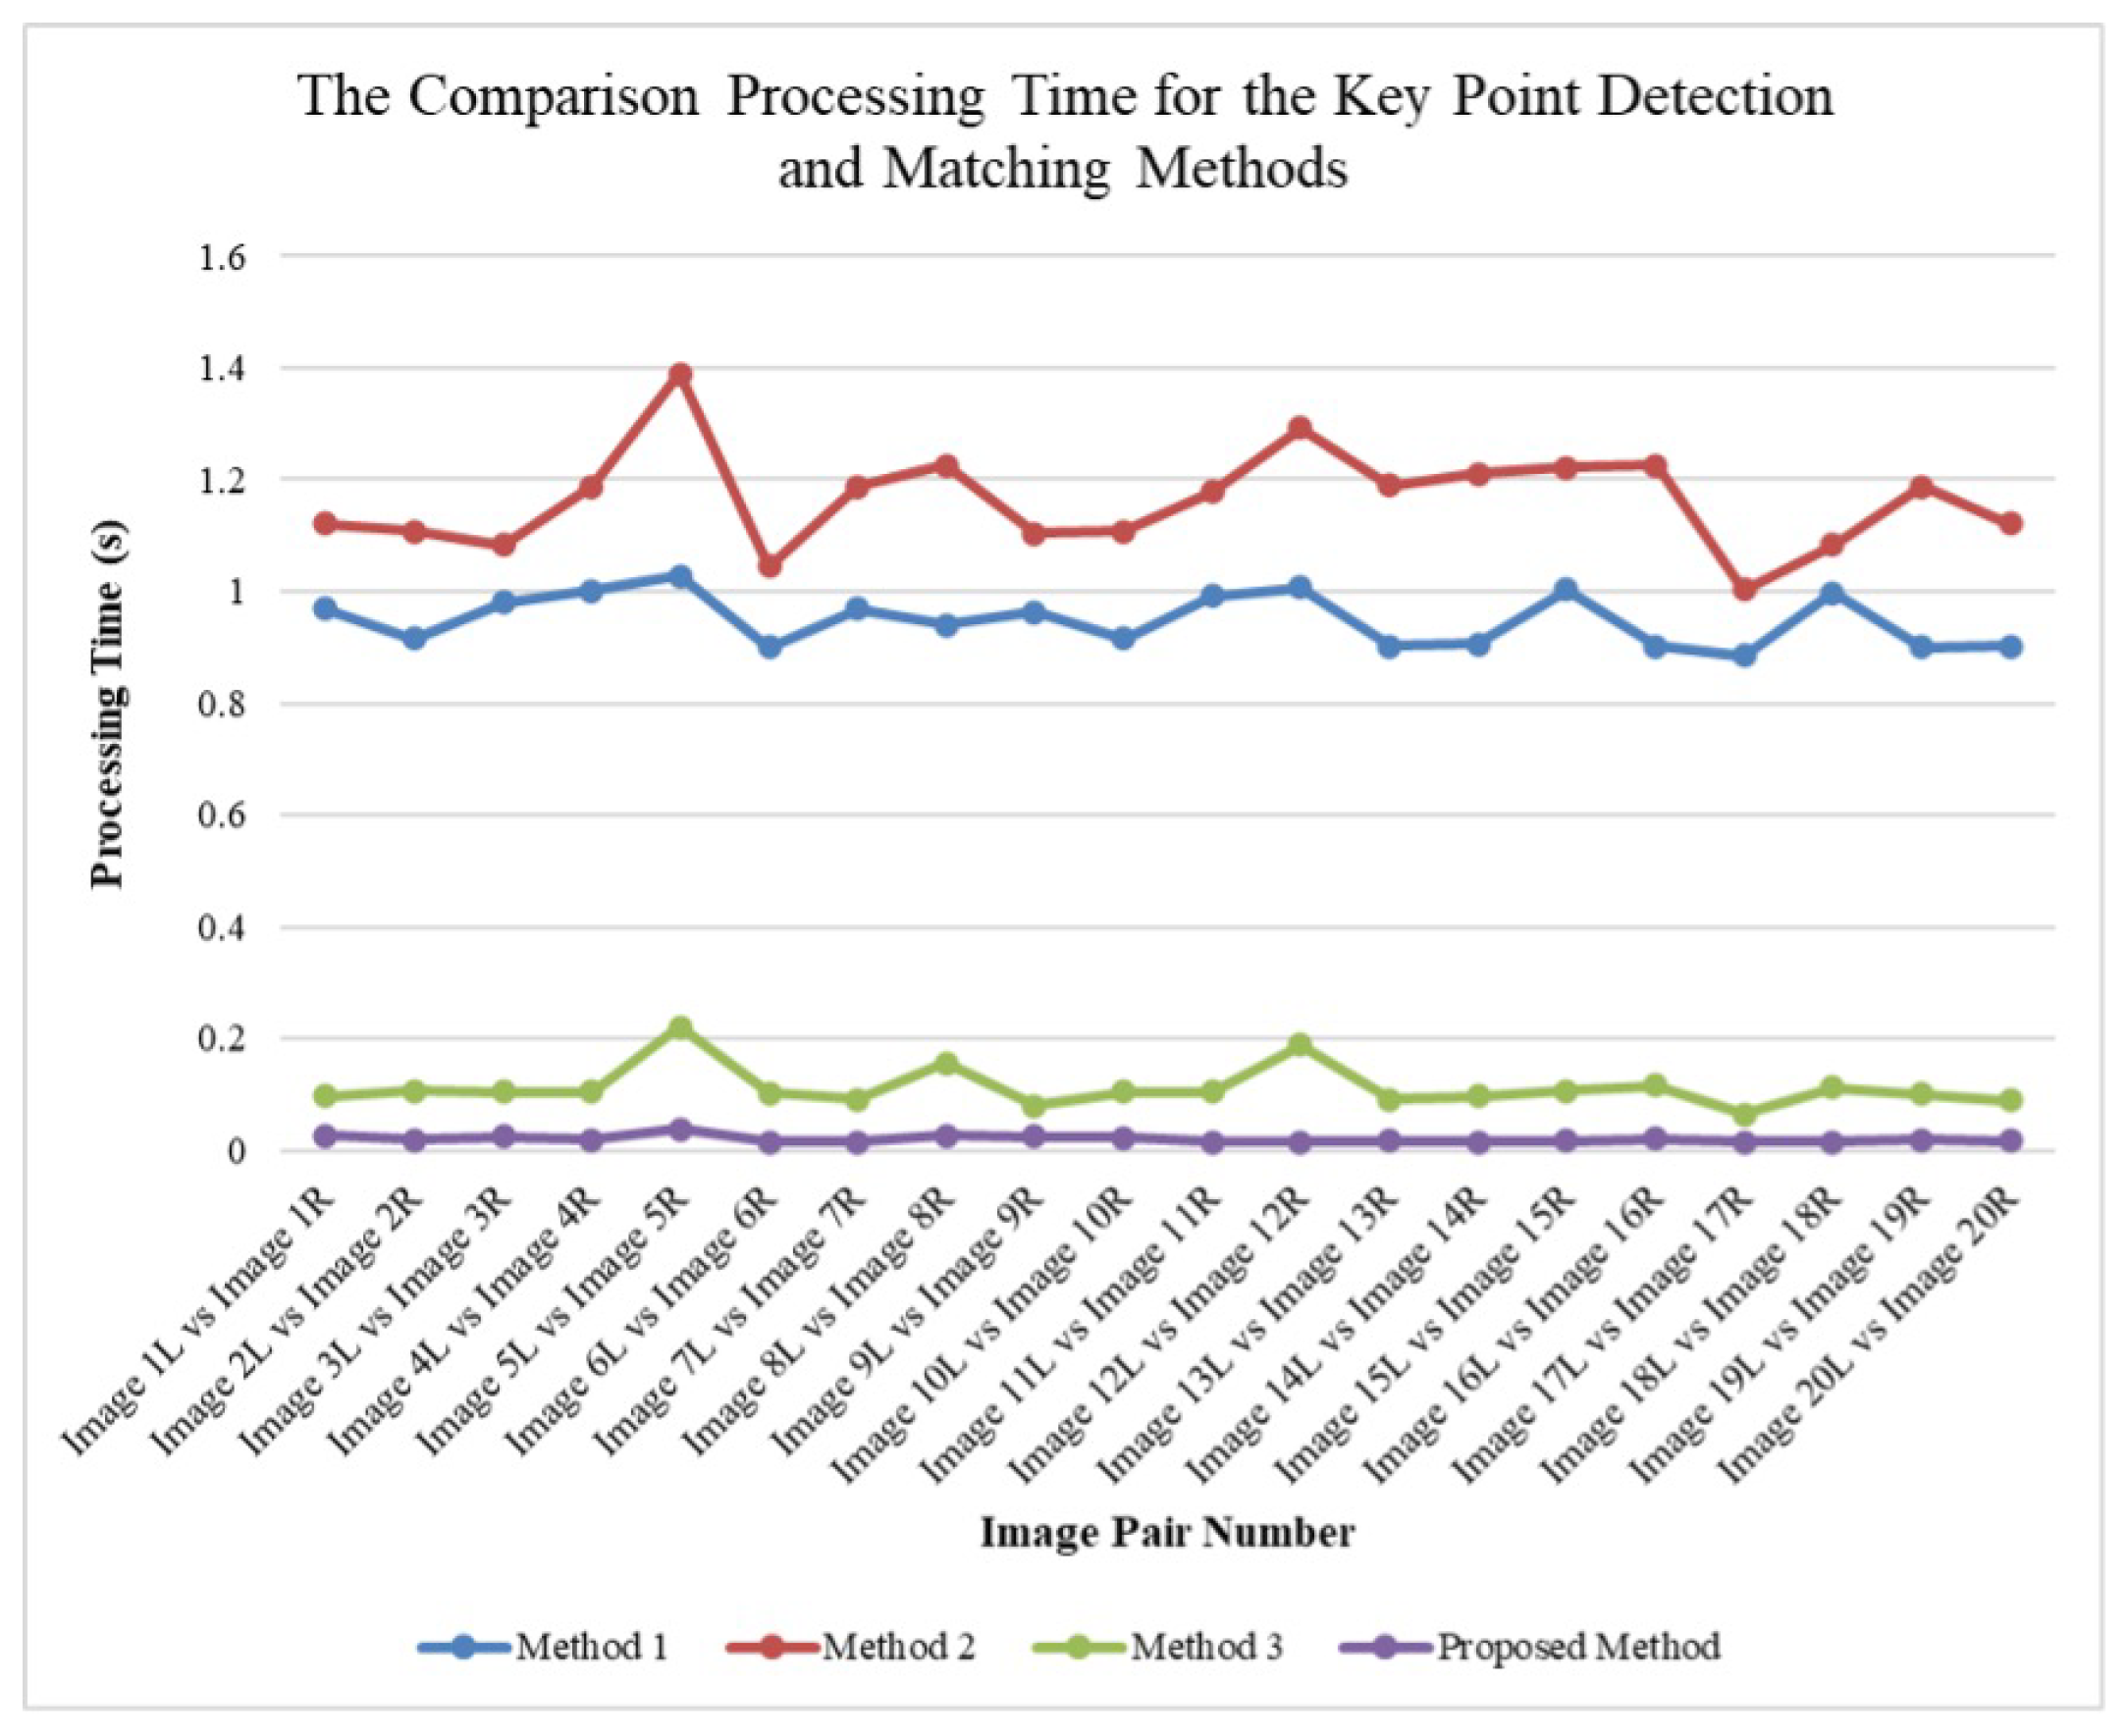
The computational efficiency of feature detection and matching was evaluated to verify the feasibility of the proposed framework for real-time PTLI monitoring. Four methods were compared in terms of processing time and stability. Method 1 integrates ROI tracking, optimized feature detection, binary feature description, and advanced matching [22], achieving stable performance (0.9–1.03 s) but limited adaptability to lighting or viewpoint variations. Method 2 employs mean contrast enhancement, histogram equalization, colorization, and denoising followed by ROI-based processing [5], resulting in high detection accuracy but the longest processing time (1.0–1.4 s). Method 3, based on the SIFT algorithm, provides real-time speed (0.06–0.22 s) with slightly reduced robustness in complex PTLI scenes. In contrast, the Proposed Method integrates optimized preprocessing, ORB-based detection, KNN matching, and RANSAC refinement, achieving the fastest and most consistent performance (0.014–0.037 s) while maintaining high stability and detection quality. Figure 13 illustrates the comparison of processing times for keypoint detection and matching across all methods, clearly showing the superior time efficiency of the proposed approach. These results confirm the proposed method’s advantage in computational efficiency and scalability for large-scale and real-time PTLI monitoring applications.
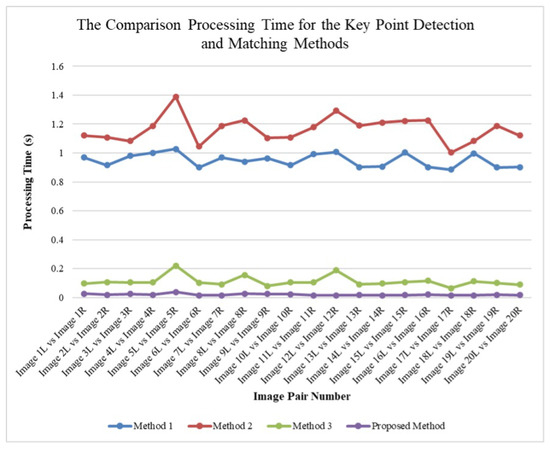
Figure 13.
Comparison of the processing times for the key point detection and matching methods.
3.3. Ice Thickness Measurement
The performance of the proposed ice thickness measurement method was evaluated against manual measurements (ground truth) and two existing approaches (Method A: ROI Tracking and Geometric Validation Method [22] and Method B: Rule-Based Segmentation with Adaptive Thresholding [5]). Manual measurements were conducted using a micrometer caliper with an accuracy of 0.05 mm under controlled environmental conditions. Multiple readings were taken at each location and averaged to minimize measurement errors, with an estimated error margin of ±0.1 mm.
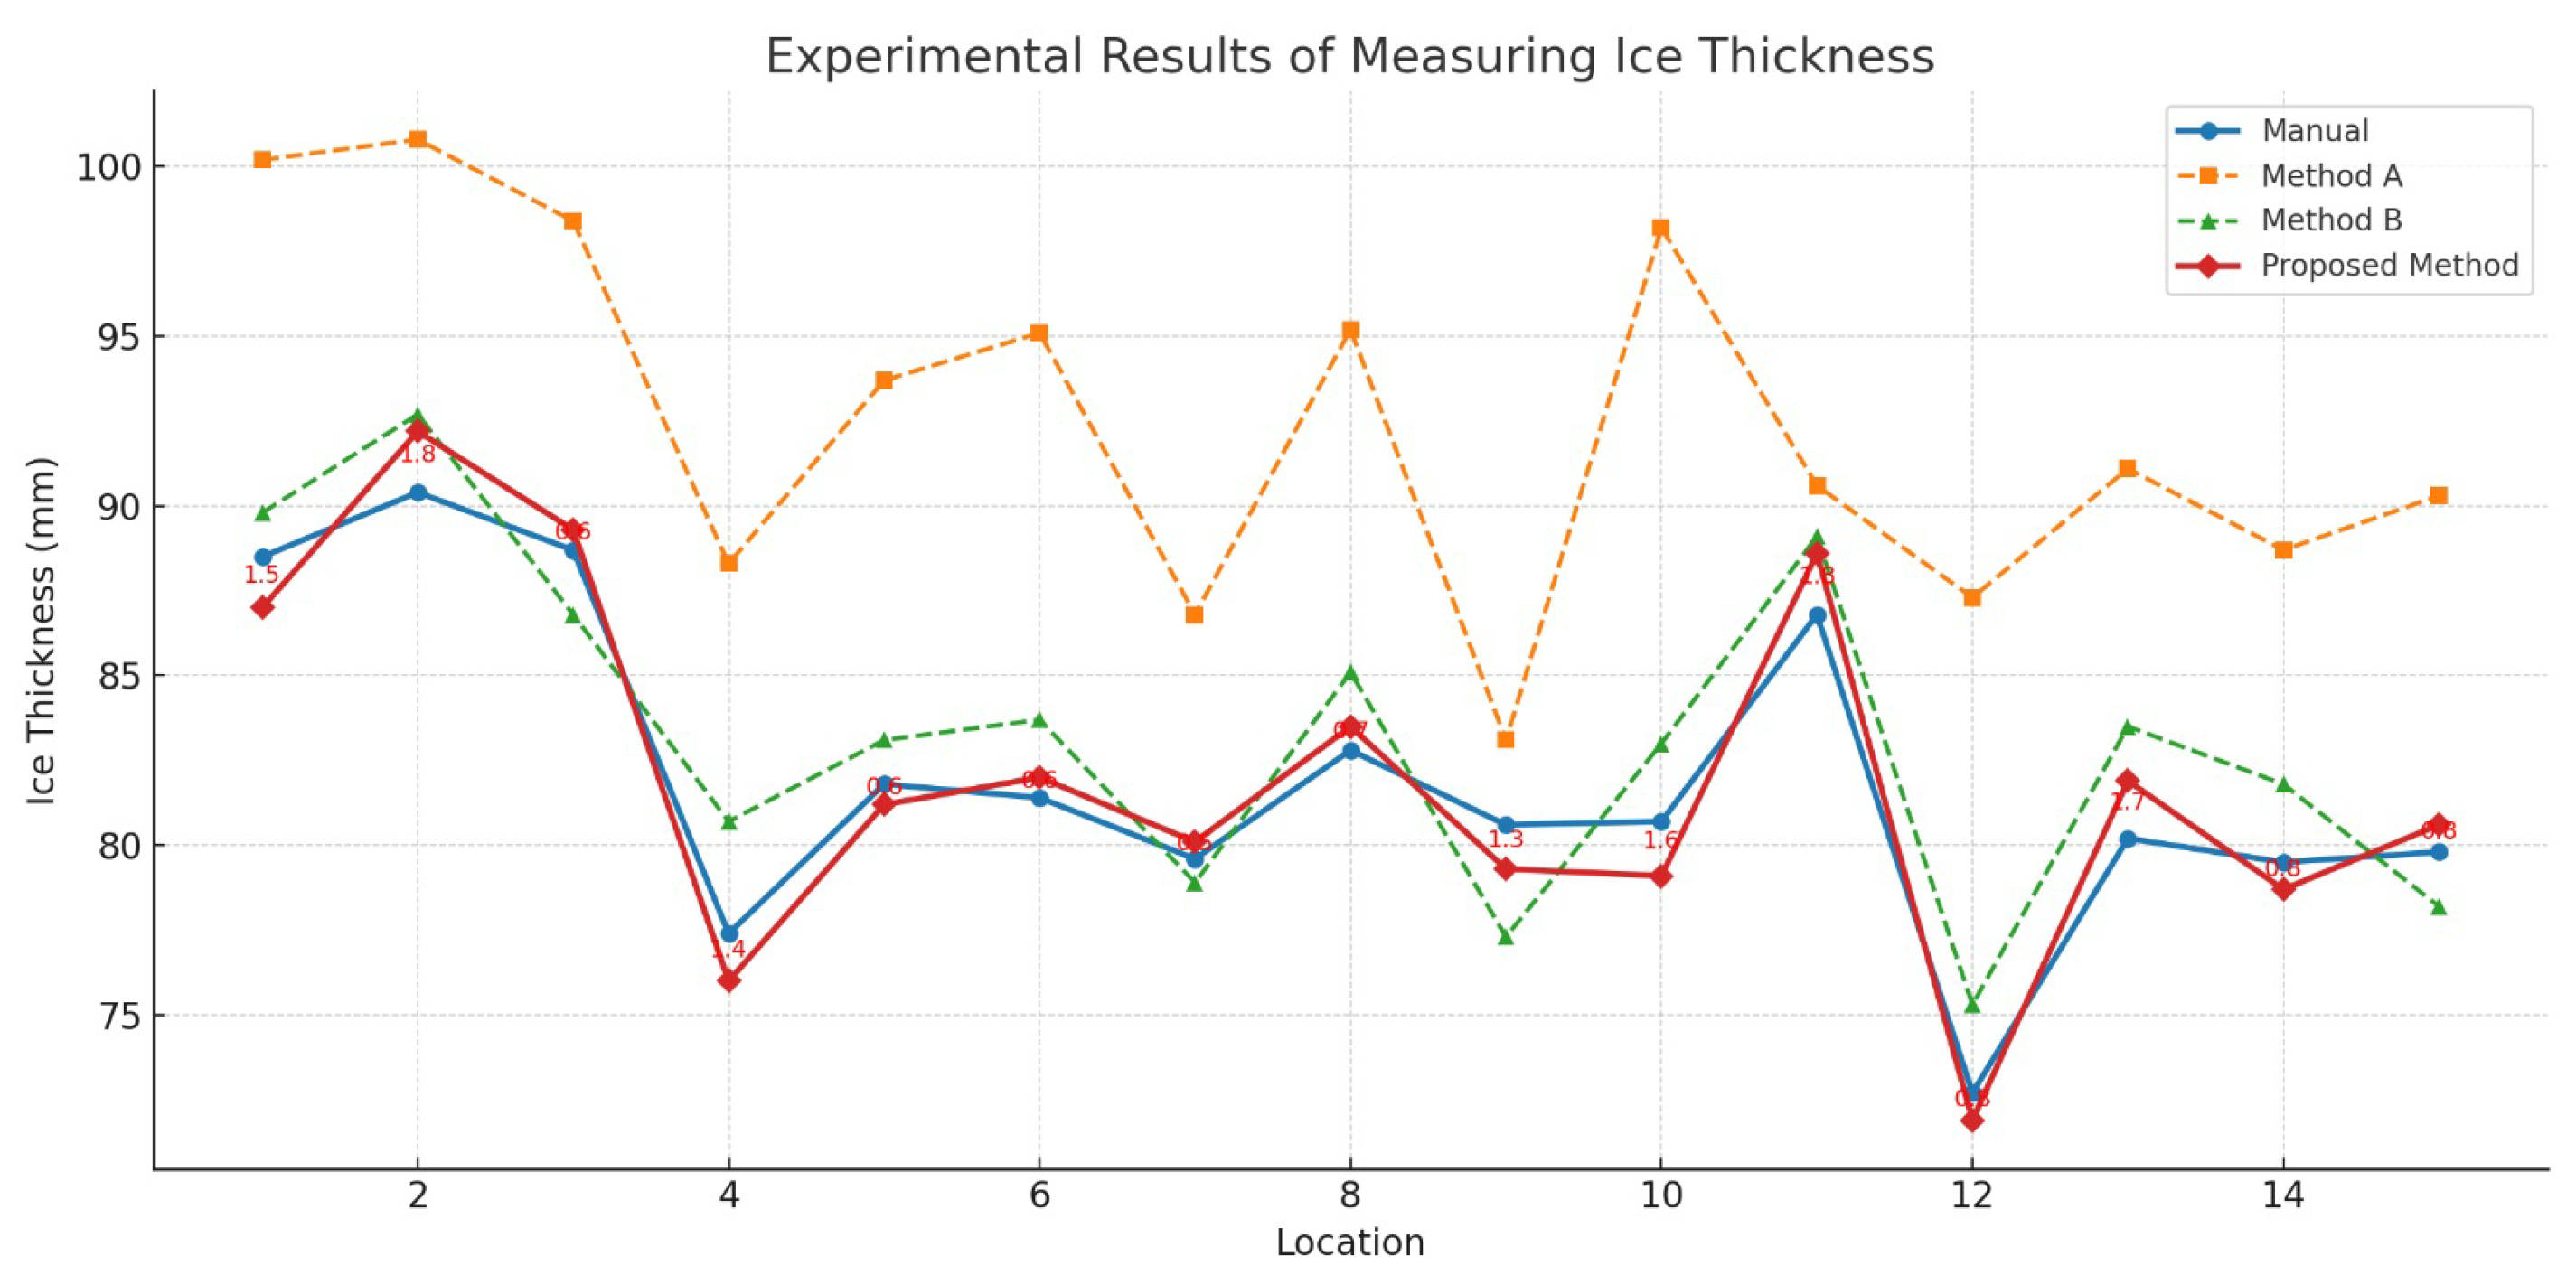
For fairness and methodological consistency, two previous approaches were selected for comparison: Method A [22] and Method B [5]. Both adopt similar sequential processes of line icing identification, feature extraction, stereo correspondence, and geometric estimation of ice thickness. By using these methods as baselines, the comparative analysis directly reflects the improvement achieved by the proposed framework while maintaining equivalent experimental conditions and evaluation metrics. Table 5 presents the experimental results obtained from 15 measurement locations along the power transmission line. The proposed method demonstrates consistently closer results to the manual ground truth compared with Method A and Method B. The absolute error of the proposed method ranges between 0.1 mm and 2.3 mm, whereas Method A frequently exhibits large deviations exceeding 10 mm, and Method B shows moderate discrepancies. For example, at Location 2, Method A reported 101.3 mm compared to the manual measurement of 90.4 mm, yielding an error of 10.9 mm, while the proposed method yielded 92.7 mm with a small error of 2.3 mm. Figure 13 illustrates a comparison graph of ice thickness measurements obtained by various methods (Manual Measurement, Method A, Method B, and Proposed Method) at 15 locations. Manual measurements were used as a reference benchmark.

Table 5.
The experimental results of measuring ice thickness (mm) using several methods.
Based on Figure 14, each method is distinguished using both color and line style. The manual reference measurements are represented by a solid blue line with circular markers, serving as the ground truth. Method A is depicted as an orange dashed line with square markers, showing a consistent overestimation compared to the manual values. Method B is indicated by a green dashed line with triangular markers, which provides closer approximations but still exhibits noticeable fluctuations. The proposed method is shown as a solid red line with diamond-shaped markers, which follows the manual reference most closely. Absolute error values for the proposed method are displayed in red annotations above each data point, highlighting that the deviations remain within the narrow range of 0.5–1.8 mm. The use of solid versus dashed lines is intended to emphasize accuracy; solid lines indicate methods with stronger consistency with the reference, whereas dashed lines indicate higher deviation or instability.
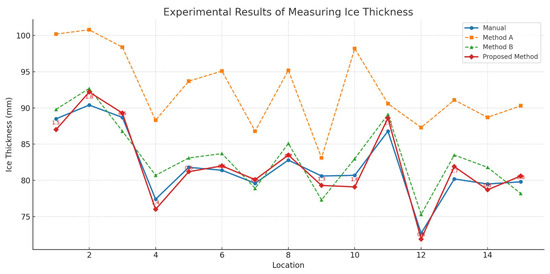
Figure 14.
The comparison of ice thickness measurements obtained by different methods.
To quantify accuracy and reliability, key statistical metrics were computed, as summarized in Table 6. The proposed method achieved an RMSE of 1.53 mm, MAE of 1.26 mm, and value of 0.99, indicating a very strong correlation with manual measurements. In contrast, Method A showed significantly higher errors (RMSE = 11.09 mm, MAE = 10.87 mm, = 0.53), while Method B achieved moderate performance (RMSE = 2.27 mm, MAE = 1.92 mm, = 0.98). The Standard Deviation (SD) of the proposed method was 0.46 mm, lower than Method A (2.74 mm) and Method B (0.89 mm), confirming its higher measurement consistency.

Table 6.
Statistical results of ice thickness measurement accuracy and reliability.
4. Discussion
The results confirm that the integration of adaptive preprocessing, noise suppression, and graph-based segmentation substantially enhances PTLI identification. The ablation study showed that the complete pipeline achieved the highest sensitivity (95.18%), whereas partial or single-stage configurations degraded performance significantly. This finding highlights the complementary role of each module, in which preprocessing improves image clarity, noise suppression enhances edge detection, and segmentation ensures reliable delineation of iced regions. Such a multistage strategy proves essential in handling complex illumination and heterogeneous ice morphology, consistent with findings reported in related image analysis studies for natural environments.
Quantitative performance evaluation further demonstrated the superiority of the proposed method. Compared to the conventional baseline, accuracy increased from 81.96% to 98.40%, and sensitivity from 76.36% to 91.68%. These substantial gains indicate that the incorporation of context-aware superpixel fusion and adaptive enhancement directly contributes to segmentation robustness. Although specificity and precision exhibited only moderate improvements, the overall balance across all metrics suggests that the proposed method achieves reliable identification without compromising false-positive control.
The feature matching experiments also validated the framework’s capability for stereo correspondence. With a precision of 90% and a recall of 82%, the method maintained an F1-score of 0.8594, outperforming existing alternatives that typically ranged between 0.6952 and 0.7255. This improvement is particularly important for binocular vision applications, where mismatched keypoints can propagate errors into subsequent 3D reconstruction. Furthermore, the low average processing time (0.014–0.037 s) indicates that the method is computationally efficient and suitable for near real-time PTLI monitoring.
For ice thickness estimation, the proposed framework demonstrated very high consistency with manual measurements, yielding RMSE and MAE values of 1.53 mm and 1.26 mm, respectively, and a strong correlation (). This performance markedly surpasses Method A, which frequently overestimated thickness by more than 10 mm, and also improved upon Method B, which achieved only moderate accuracy (). The relatively low standard deviation (0.46 mm) further confirms the measurement stability of the proposed method across different transmission line segments. These results suggest that the integration of stereo reconstruction and refined segmentation not only enhances qualitative detection but also delivers quantitative measurements with high fidelity.
Overall, the proposed binocular vision framework provides a robust, efficient, and accurate solution for PTLI monitoring. By addressing both identification and quantitative measurement, the method can support early warning systems and operational decision-making in power grid management. Future work may focus on validating the system under extreme weather conditions, scaling to longer transmission spans, and integrating the algorithm with UAV-based monitoring platforms for practical deployment.
Despite the promising performance of the proposed method in ice thickness estimation, certain extreme conditions may pose challenges and influence the robustness of the system. For example, partial occlusion of transmission lines by tree branches can affect the accuracy of segmentation, edge detection, and keypoint matching modules. In such scenarios, the stereo triangulation and 3D reconstruction processes may be compromised, leading to potential errors in ice boundary delineation and thickness estimation.
Furthermore, highly transparent glaze ice or low-texture rime formations may introduce additional difficulties in distinguishing iced regions from the background, particularly in complex natural environments. These factors highlight potential limitations in the current method under extreme or atypical conditions. It should be noted that addressing all possible extreme cases within the scope of this research was constrained by the available timeframe and resources. Therefore, these analyses are intended to provide a preliminary understanding of potential failure scenarios, while further experimental validation in outdoor and diverse environments is recommended as a priority for future research. By acknowledging these limitations, the research presents a balanced perspective on the method’s capabilities and provides guidance for subsequent studies aiming to enhance the robustness and practical applicability of PTLI icing monitoring systems.
5. Conclusions
This study presents a rule-driven stereo vision framework for the three-dimensional measurement of power transmission line icing. The proposed method enables accurate, efficient, and interpretable icing detection and thickness estimation without requiring large-scale annotated datasets. Its main contributions include (1) a robust segmentation strategy integrating adaptive preprocessing, advanced thresholding, and contextual refinement to isolate transmission lines and icing regions under varying illumination and environmental conditions; (2) a stereo feature detection and matching pipeline based on entropy-guided cropping, adaptive gradient enhancement, and bidirectional consistency matching, ensuring reliable keypoint correspondence across binocular images; and (3) the integration of geometric validation and triangulation for millimeter-level ice thickness reconstruction, guaranteeing geometric consistency and reliable depth computation.
The novelty of this work lies in its interpretable, rule-driven design, emphasizing transparency, data efficiency, and robustness without dependence on data-driven training. Unlike conventional deep learning methods, the proposed deterministic approach is suitable for real-time and safety-critical monitoring applications.The framework also demonstrates strong potential for integration into real-world power transmission line monitoring systems. It can be deployed in fixed stereo stations or unmanned aerial systems (UASs) for field inspection, with imagery transmitted to centralized control centers for automated analysis and early warning of icing hazards. Its modular, rule-based structure supports integration with IoT-enabled smart grid infrastructures, enabling continuous, scalable, and autonomous monitoring across large transmission networks.
Although high accuracy and stability were achieved under controlled indoor conditions, further validation under complex outdoor environments—such as varying illumination, fog, and partial occlusion—is needed. Future work will focus on large-scale field experiments, UAV-assisted stereo imaging, and hybrid rule-learning models to enhance adaptability and generalization. The demonstrated computational efficiency (0.014–0.037 s per frame) further confirms the framework’s suitability for long-duration, real-time monitoring with minimal human intervention.
Despite its promising performance, several limitations should be acknowledged. The accuracy of the proposed framework may decrease under extreme weather conditions, such as dense fog, snowfall, or strong cable oscillations that introduce motion blur and affect stereo correspondence. Highly transparent glaze ice or low-texture rime formations can also pose challenges for edge detection and segmentation. Moreover, the approach relies on precise stereo camera calibration, and any misalignment may influence the accuracy of 3D reconstruction. Finally, since the experiments were primarily conducted under laboratory and near-field conditions, further large-scale outdoor validation remains important for confirming long-term stability and real-world applicability.
Author Contributions
The ideas and concepts were carried out in collaboration with all authors. N.R.N. and J.X. conceived and designed the experiments; N.R.N. and X.H. performed the experiments; N.R.N. and J.X. analyzed the data; N.R.N. and J.X. wrote the paper. All authors have read and agreed to the published version of the manuscript.
Funding
This research received no external funding.
Institutional Review Board Statement
Not applicable.
Informed Consent Statement
Not applicable.
Data Availability Statement
The original contributions presented in this study are included in the article. Further inquiries can be directed to the corresponding author.
Conflicts of Interest
The authors declare no conflicts of interest.
References
- Dai, D.; Hu, Y.; Qian, H.; Qi, G.; Wang, Y. A Novel Detection Algorithm for the Icing Status of Transmission Lines. Symmetry 2024, 16, 1264. [Google Scholar] [CrossRef]
- Han, S.; Li, D.; Li, K.; Wu, H.; Gao, Y.; Zhang, Y.; Yuan, R. Analysis and study of transmission line icing based on grey correlation Pearson combinatorial optimization support vector machine. Measurement 2024, 236, 115086. [Google Scholar] [CrossRef]
- Wang, L.; Chen, Z.; Zhang, W.; Lu, Z.; Cheng, Y.; Qu, X.; Gul, C.; Yang, Y. The causes and forecasting of icing events on power transmission lines in southern China: A review and perspective. Atmosphere 2023, 14, 1815. [Google Scholar] [CrossRef]
- Zhou, Y.; Xu, C.; Dai, Y.; Feng, X.; Ma, Y.; Li, Q. Dual-View Stereovision-Guided Automatic Inspection System for Overhead Transmission Line Corridor. Remote Sens. 2022, 14, 4095. [Google Scholar] [CrossRef]
- Nusantika, N. Newly Designed Identification Scheme for Monitoring Ice-Covered Transmission Lines. Appl. Sci. 2023, 13, 9862. [Google Scholar] [CrossRef]
- Zhang, Z.; Zhang, H.; Yue, S.; Zeng, W. A review of icing and anti-icing technology for transmission lines. Energies 2023, 16, 601. [Google Scholar] [CrossRef]
- Xu, F.; Li, D.; Gao, P.; Zang, W.; Duan, Z.; Ou, J. Numerical simulation of two-dimensional transmission line icing and analysis of factors that influence icing. J. Fluids Struct. 2023, 118, 103858. [Google Scholar] [CrossRef]
- Tong, H.; Qiu, R.C.; Zhang, D.; Yang, H.; Ding, Q.; Shi, X. Detection and classification of transmission line transient faults based on graph convolutional neural network. CSEE J. Power Energy Syst. 2021, 7, 456–471. [Google Scholar] [CrossRef]
- Wang, F.; Ma, Z. Transmission Line Icing Prediction Based on Physically Guided Fast-Slow Transformer. Energies 2025, 18, 695. [Google Scholar] [CrossRef]
- Zhao, Z.; Qi, H.; Qi, Y.; Zhang, K.; Zhai, Y.; Zhao, W. Detection method based on automatic visual shape clustering for pin-missing defect in transmission lines. IEEE Trans. Instrum. Meas. 2020, 69, 6080–6091. [Google Scholar] [CrossRef]
- Zainuddin, N.M.; Rahman, M.A.; Kadir, M.A.; Ali, N.N.; Ali, Z.; Osman, M.; Mansor, M.; Ariffin, A.M.; Rahman, M.S.A.; Nor, S.F.M.; et al. Review of thermal stress and condition monitoring technologies for overhead transmission lines: Issues and challenges. IEEE Access 2020, 8, 120053–120081. [Google Scholar] [CrossRef]
- Hu, J.; Yang, X. Second International Conference on Digital Society and Intelligent Systems (DSInS 2022). Proc. SPIE 2023, 12599, 1259901-1. [Google Scholar]
- Wang, G.; Shen, J.; Jin, M.; Huang, S.; Li, Z.; Guo, X. Prediction model for transmission line icing based on data assimilation and model integration. Front. Environ. Sci. 2024, 12, 1403426. [Google Scholar] [CrossRef]
- Khawaja, A.H.; Huang, Q.; Khan, Z.H. Monitoring of overhead transmission lines: A review from the perspective of contactless technologies. Sens. Imaging 2017, 18, 24. [Google Scholar] [CrossRef]
- Chen, Q.; Liu, T.; Wang, Z.; Miao, R. Research on monitoring method for ice-covered state of transmission lines based on conductor end displacement. Electr. Power Syst. Res. 2024, 236, 110918. [Google Scholar] [CrossRef]
- Huang, J.; Xu, J.; Meng, L.; Qin, Z. The comprehensive benefit evaluation model of manual inspection in transmission line. In Proceedings of the 6th International Conference on Electronic, Mechanical, Information and Management Society, Shenyang, China, 1–3 April 2016; Atlantis Press: Dordrecht, The Netherlands, 2016; pp. 1541–1548. [Google Scholar]
- Graham, L. Mobile mapping systems overview. Photogramm. Eng. Remote Sens. 2010, 76, 222–228. [Google Scholar]
- Wang, W.; Peng, W.; Tong, L.; Tan, X.; Xin, T. Study on sustainable development of power transmission system under ice disaster based on a new security early warning model. J. Clean. Prod. 2019, 228, 175–184. [Google Scholar] [CrossRef]
- Rao, S.P.; Rahman, F.; Ranganathan, P. Sag measurement and quantification in transmission lines: A review. In Proceedings of the 2024 IEEE International Conference on Electro Information Technology (eIT), Eau Claire, WI, USA, 30 May–1 June 2024; pp. 596–602. [Google Scholar]
- Liu, C.; Wu, Y.; Liu, J. The growth of UAV aerial images-related power lines detection: A literature review of 2023. J. Image Graph 2023, 28, 3025–3048. [Google Scholar] [CrossRef]
- Dong, B.; Jiang, X.; Yin, F. Development and prospect of monitoring and prevention methods of icing disaster in China power grid. IET Gener. Transm. Distrib. 2022, 16, 4480–4493. [Google Scholar] [CrossRef]
- Nusantika, N.R.; Xiao, J.; Hu, X. New Scheme of Image Matching for The Power Transmission Line Icing. In Proceedings of the 2022 IEEE 17th Conference on Industrial Electronics and Applications (ICIEA), Chengdu, China, 16–19 December 2022; pp. 1–7. [Google Scholar]
Disclaimer/Publisher’s Note: The statements, opinions and data contained in all publications are solely those of the individual author(s) and contributor(s) and not of MDPI and/or the editor(s). MDPI and/or the editor(s) disclaim responsibility for any injury to people or property resulting from any ideas, methods, instructions or products referred to in the content. |
© 2025 by the authors. Licensee MDPI, Basel, Switzerland. This article is an open access article distributed under the terms and conditions of the Creative Commons Attribution (CC BY) license (https://creativecommons.org/licenses/by/4.0/).


