1. Introduction
Renewable energy generation is expanding rapidly, making energy storage a fundamental pillar of emerging power systems. Stimulated by market incentives, non-hydro-pumped storage technologies—encompassing electrochemical energy storage, compressed-air energy storage integrated with thermal storage, and flywheel-based energy storage—are entering industrial deployment, while business models such as independent energy-storage power plants and shared-storage schemes are evolving rapidly. Among non-pumped solutions, electrochemical storage has become the dominant technology, largely driven by advances and economies of scale in the electric-vehicle industry. Simultaneously, the methods for assessing operational states, investment costs, and revenue streams of storage assets remain an active research area. Therefore, it is essential to develop operational-revenue models that explicitly account for degradation-induced losses as operating costs so that economic assessments and dispatch strategies reflect lifecycle impacts and support rational investment and operational decisions.
To date, a wealth of research has been conducted by scholars globally on optimization issues related to energy storage systems. Reference [
1] puts forward a method for predicting the remaining lifespan of lithium-ion batteries based on short-term data segment characteristics. Reference [
2] proposes a capacity optimization model for multi-energy hybrid energy storage systems that takes battery lifespan into account, yet the K-means algorithm utilized still has scope for enhancement due to its intrinsic limitations. Literature [
3] constructs a two-layer optimization configuration model for energy storage location and capacity by incorporating considerations of energy storage site selection and capacity determination, which improves system economic performance to a certain degree but suffers from poor system robustness. Literature [
4,
5] adopts multi-objective optimization to balance the economic efficiency and reliability of algorithms, applying robust optimization to tackle the uncertainty of natural energy sources and thus strengthening risk resistance; however, the multi-objective optimization algorithm necessitates re-adjustment of coefficients under different operating conditions. Literature [
6] proposes a multi-stage optimization framework that combines molten salt energy storage with traditional electrochemical energy storage to achieve a multi-energy complementary system. Literature [
7] proposes a two-layer coordinated control model, where the outer layer configures energy storage capacity with the objective of total return, and the inner layer optimizes operational strategies with the objective of maximizing daily operational profit. However, it only considers the operational mode of energy storage power plants constructed in wind power aggregation areas. Consequently, this paper introduces a bi-level economic framework that accounts for degradation due to charge–discharge cycles. Literature [
8] proposes the optimal market bidding strategy is determined by the household energy management system (HEMS) optimization, and a double-sided auction method is employed for market clearing that jointly considers energy storage degradation and market participation.
Over the past several years, intelligent optimization algorithms have been extensively applied in the domain of control science and technology. Reference [
9] incorporated chaos theory into the WOA, proposing the CWOA, which enhanced the algorithm’s optimization performance to a certain degree. Reference [
10] introduced Cauchy mutation to improve the gray wolf algorithm, adding individual perturbations to strengthen the algorithm’s capability of escaping local optima, and constructed a wind-solar-storage-wood microgrid optimization configuration model to solve for the optimal energy storage configuration scheme. Literature [
11] modified the sparrow search algorithm by integrating the golden sine formula, boosting the algorithm’s convergence accuracy and global search ability. Literature [
12] embedded an elite reverse learning strategy into the golden ratio optimization algorithm to enhance population quality, thereby balancing the algorithm’s exploration and exploitation capacities. Literature [
13] combined the differential evolution algorithm with the whale optimization algorithm, regulating adaptive parameters to render the algorithm more suitable for addressing complex optimization problems.
To address the aforementioned problems, this study presents a dual-layer optimization model incorporating energy storage cycle life considerations. The upper layer optimizes operational revenue maximization, schedules energy storage charging and discharging processes in response to load-side demands, and then transmits the scheduled values to the lower layer. The lower-layer model aims to minimize energy storage loss, participates in optimization with energy storage configuration capacity as the decision variable, and feeds back the capacity values to the upper layer to adjust energy storage loss costs and participate in revenue calculations. To address the issues of slow convergence and susceptibility to local optima in traditional WOAs, this paper introduces an improved whale optimization algorithm (IWOA). First, Circle chaotic mapping is adopted to optimize the initial position distribution of individuals and prevent premature convergence. Next, the golden sine formula is utilized to expand the search scope of whales, enhancing the algorithm’s search capability. Subsequently, Cauchy mutation is introduced to increase individual perturbations, strengthening the ability to break away from local optima while accelerating the algorithm’s convergence rate. The effectiveness of the improved strategy is then verified through four distinct test functions. Finally, the two-layer model is integrated into a linear model for solution, and the electricity load data from an industrial park in Zhuzhou City is imported for simulation validation.
2. Battery Life Depletion Model
To address the investment costs and power supply reliability requirements considered by industrial parks when configuring photovoltaic-storage systems, this paper aims to identify the optimal capacity configuration scheme that minimizes economic costs while maximizing power supply reliability, ensuring the normal operation of photovoltaic-storage power stations. The decision variables are the storage capacity and configuration power, with the optimization objectives being the annualized comprehensive operating cost and user satisfaction.
The operational lifespan of energy storage batteries is influenced by operational environment, charge–discharge cycles, and depth of discharge. In actual operation, frequent charge–discharge cycles exacerbate energy storage degradation, thereby accelerating lifespan degradation. This paper introduces a method for calculating energy storage cycle lifespan [
13]:
Typically, the energy storage cycle life
is determined by the number of daily cycles
, but in actual operation, the depth of discharge of the energy storage system fluctuates continuously. Therefore, it is necessary to equate
to the number of cycles of
at 100% charge and discharge depth, which is calculated as follows:
Among them,
is the equivalent cycle number of the energy storage battery, and
is a constant within [0.8, 2.1] [
14].
To improve the accuracy of measuring the number of energy storage charge–discharge cycles, a half-cycle life calculation method is introduced [
15]. In this method, the state interval between local extreme points of adjacent energy storage state of charge (SOC) is defined as one half-cycle, and the accumulated energy
between each half-cycle is calculated using Equation (3).
Among them,
and
denote the energy storage system’s charging and discharging status at time
t,
represents the energy storage charging power at time
t,
represents the energy storage discharging power at time
t,
represents the charging efficiency, and
represents the discharging efficiency. The discharge depth
at this time is calculated as follows:
where
is the energy storage installed capacity. The cumulative cycle count under equivalent 100% discharge depth per day is calculated as follows:
Among them, indicates the number of cycles at the equivalent 100% discharge depth at time t.
3. Two-Layer Energy Storage Configuration Model Incorporating Energy Considerations
3.1. Storage Lifetime
The configuration of energy storage capacity is closely linked to the operational revenue of energy storage products. To reasonably meet the load demand on the electricity consumption side and maximize overall profits [
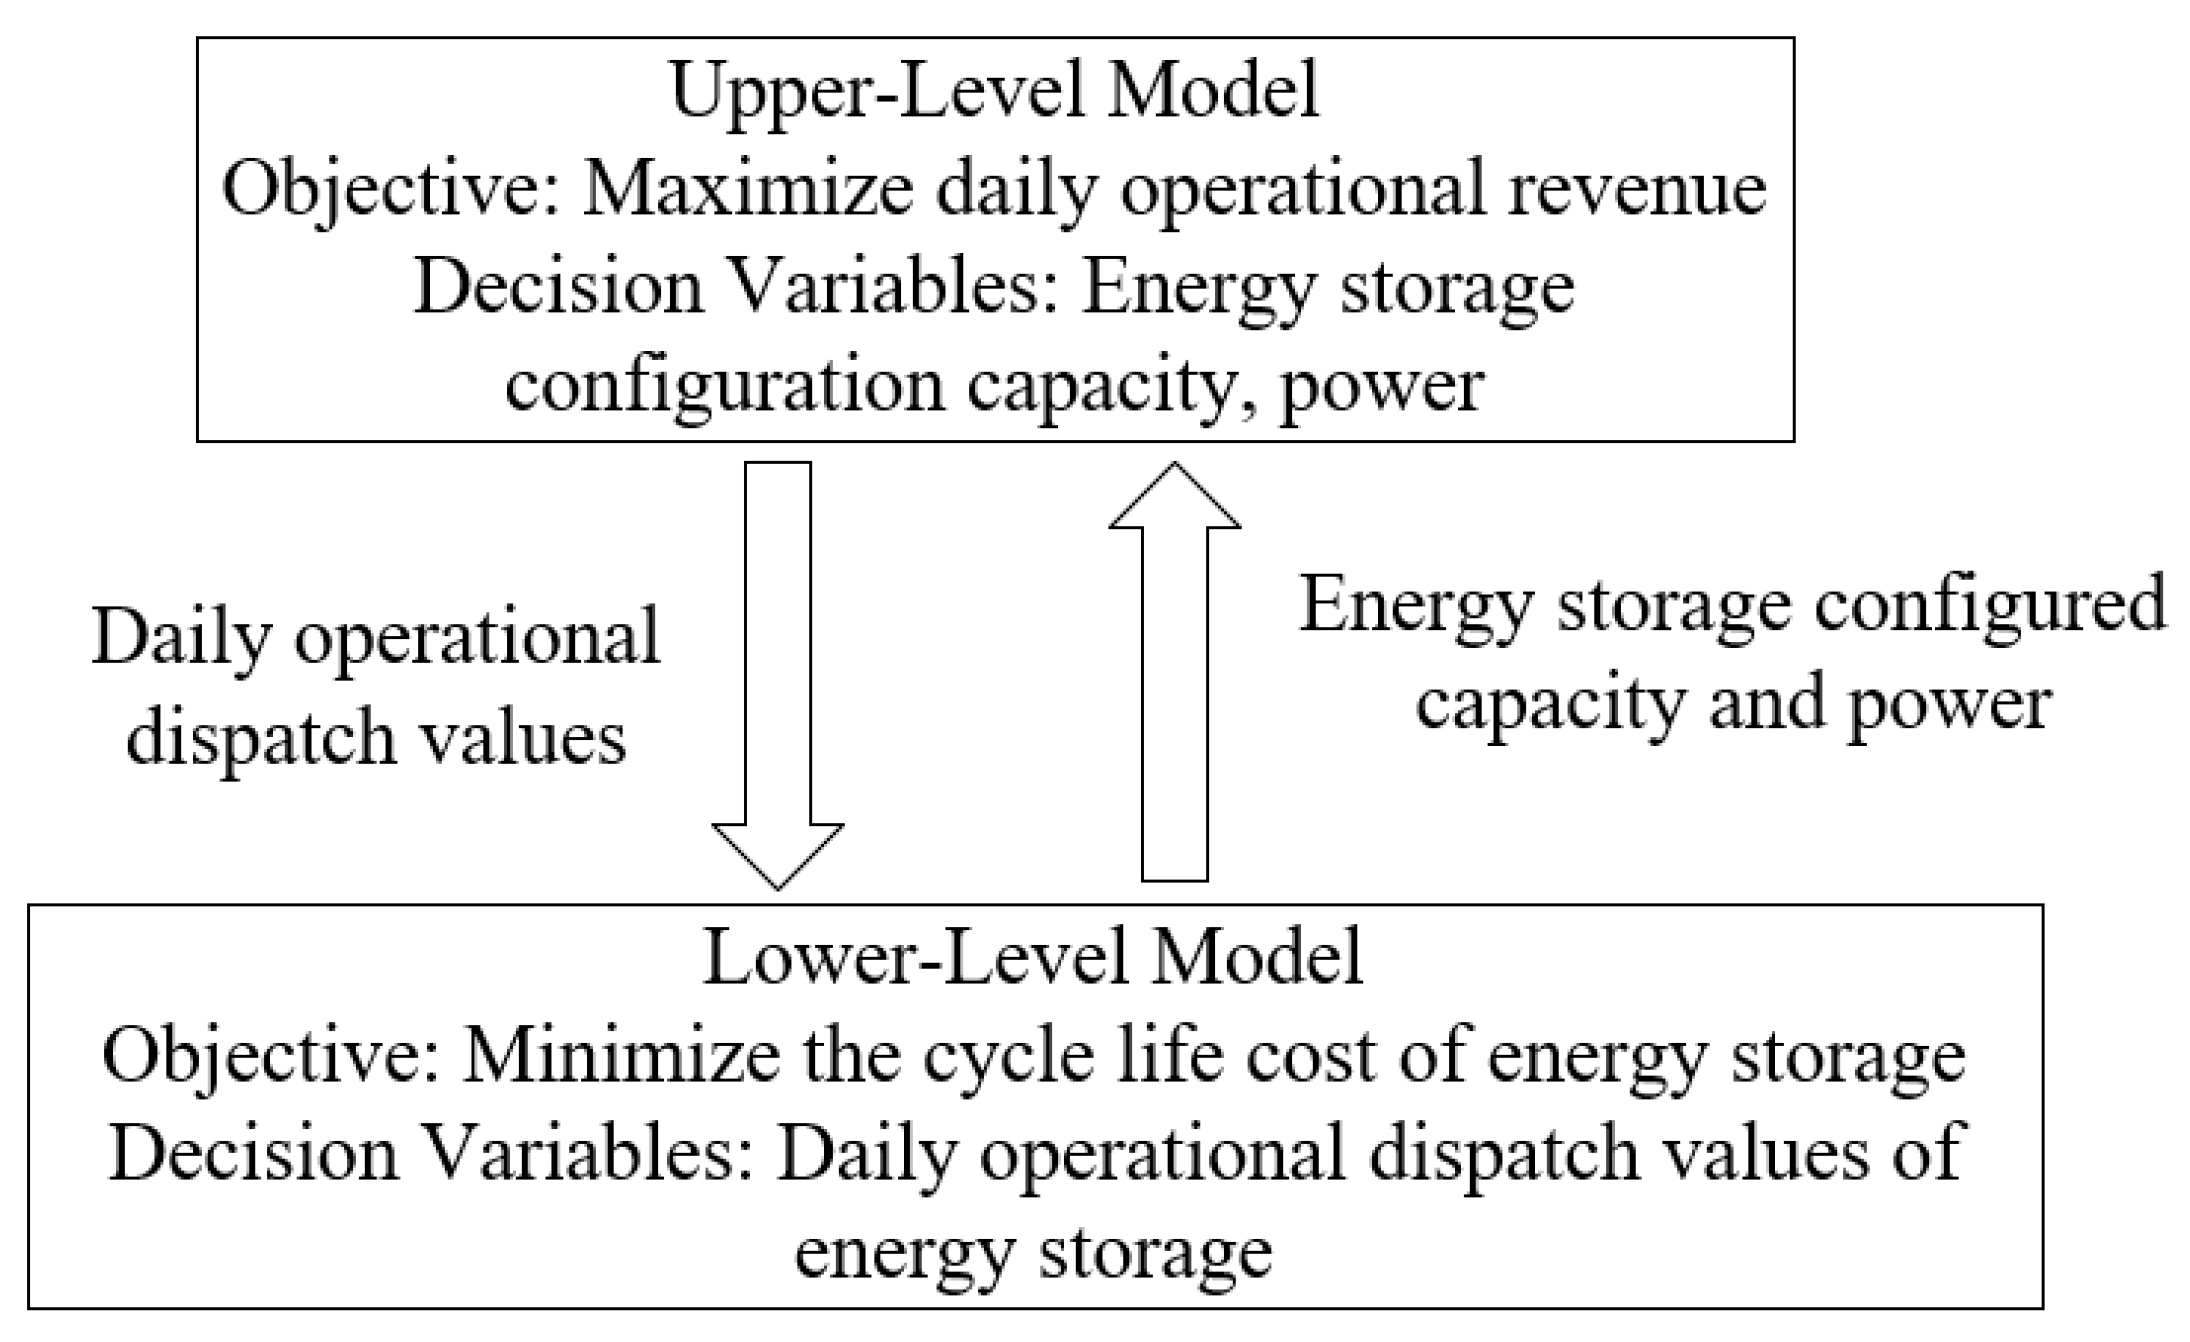
16], this study establishes a two-layer daily operational model for energy storage that accounts for cycle life, as illustrated in
Figure 1. The upper-layer model provides daily operational scheduling data for the lower-layer model to calculate energy storage cycle costs. Conversely, the lower-layer model supplies the optimal energy storage configuration capacity and power required for the upper-layer model to compute daily operational revenue. The upper layer serves as the data source for the lower layer, and the lower-layer results are fed back to the upper layer to participate in scheduling calculations, thereby iteratively seeking the optimal solution.
3.2. Maximize Daily Operating Revenue
The upper-level model takes maximizing the daily operating profit of the energy storage system as its core objective, as shown in Equation (6).
In the equation, serves as the optimal value of the current day’s operating revenue, represents the revenue value obtained by energy storage when engaging in energy market transactions at time t, and is the daily energy storage cycle loss cost.
The revenue
obtained by energy storage through the energy market transactions is calculated as shown in Equation (7).
Among them, denotes the traded electricity price in the energy market at time t, and denotes the power that the energy storage system declares to the energy market at time t.
3.3. Lowest Energy Storage Cycle Loss
The lower-level model takes minimizing energy storage cycle losses as its optimization objective. Given the influence of energy storage lifespan on daily operational revenue, the losses arising from energy storage cycles are converted into cycle costs and integrated into the calculation. The calculation of energy storage cycle cost
is shown in Equation (8).
Among these, stands for the unit investment cost associated with energy storage power capacity, denotes the unit investment cost corresponding to energy storage capacity, signifies the total investment cost linked to the energy storage system, is the fixed investment cost of energy storage, is the capacity factor of energy storage, and is the service life of energy storage.
3.4. Constraints
where
denotes the load power at time
t (
W), and
denotes the AC grid-side interaction power at time
t (
W).
- 2.
Energy storage constraints:
Among them, and indicate the upper and lower bounds corresponding to the energy storage SOC, and signify the upper-limit and lower-limit constraints of energy storage power, and and indicate the upper-limit and lower-limit boundaries of energy storage capacity.
- 3.
Grid-side power constraints:
Among them, and signify the maximum and minimum limits corresponding to grid-side interaction power.
- 4.
Operating constraints:
Among them, is the energy storage charging power at time t, is the energy storage discharging power at time t. When charging, it is and when charging, it is .
4. Improved Whale Optimization Algorithm Solution
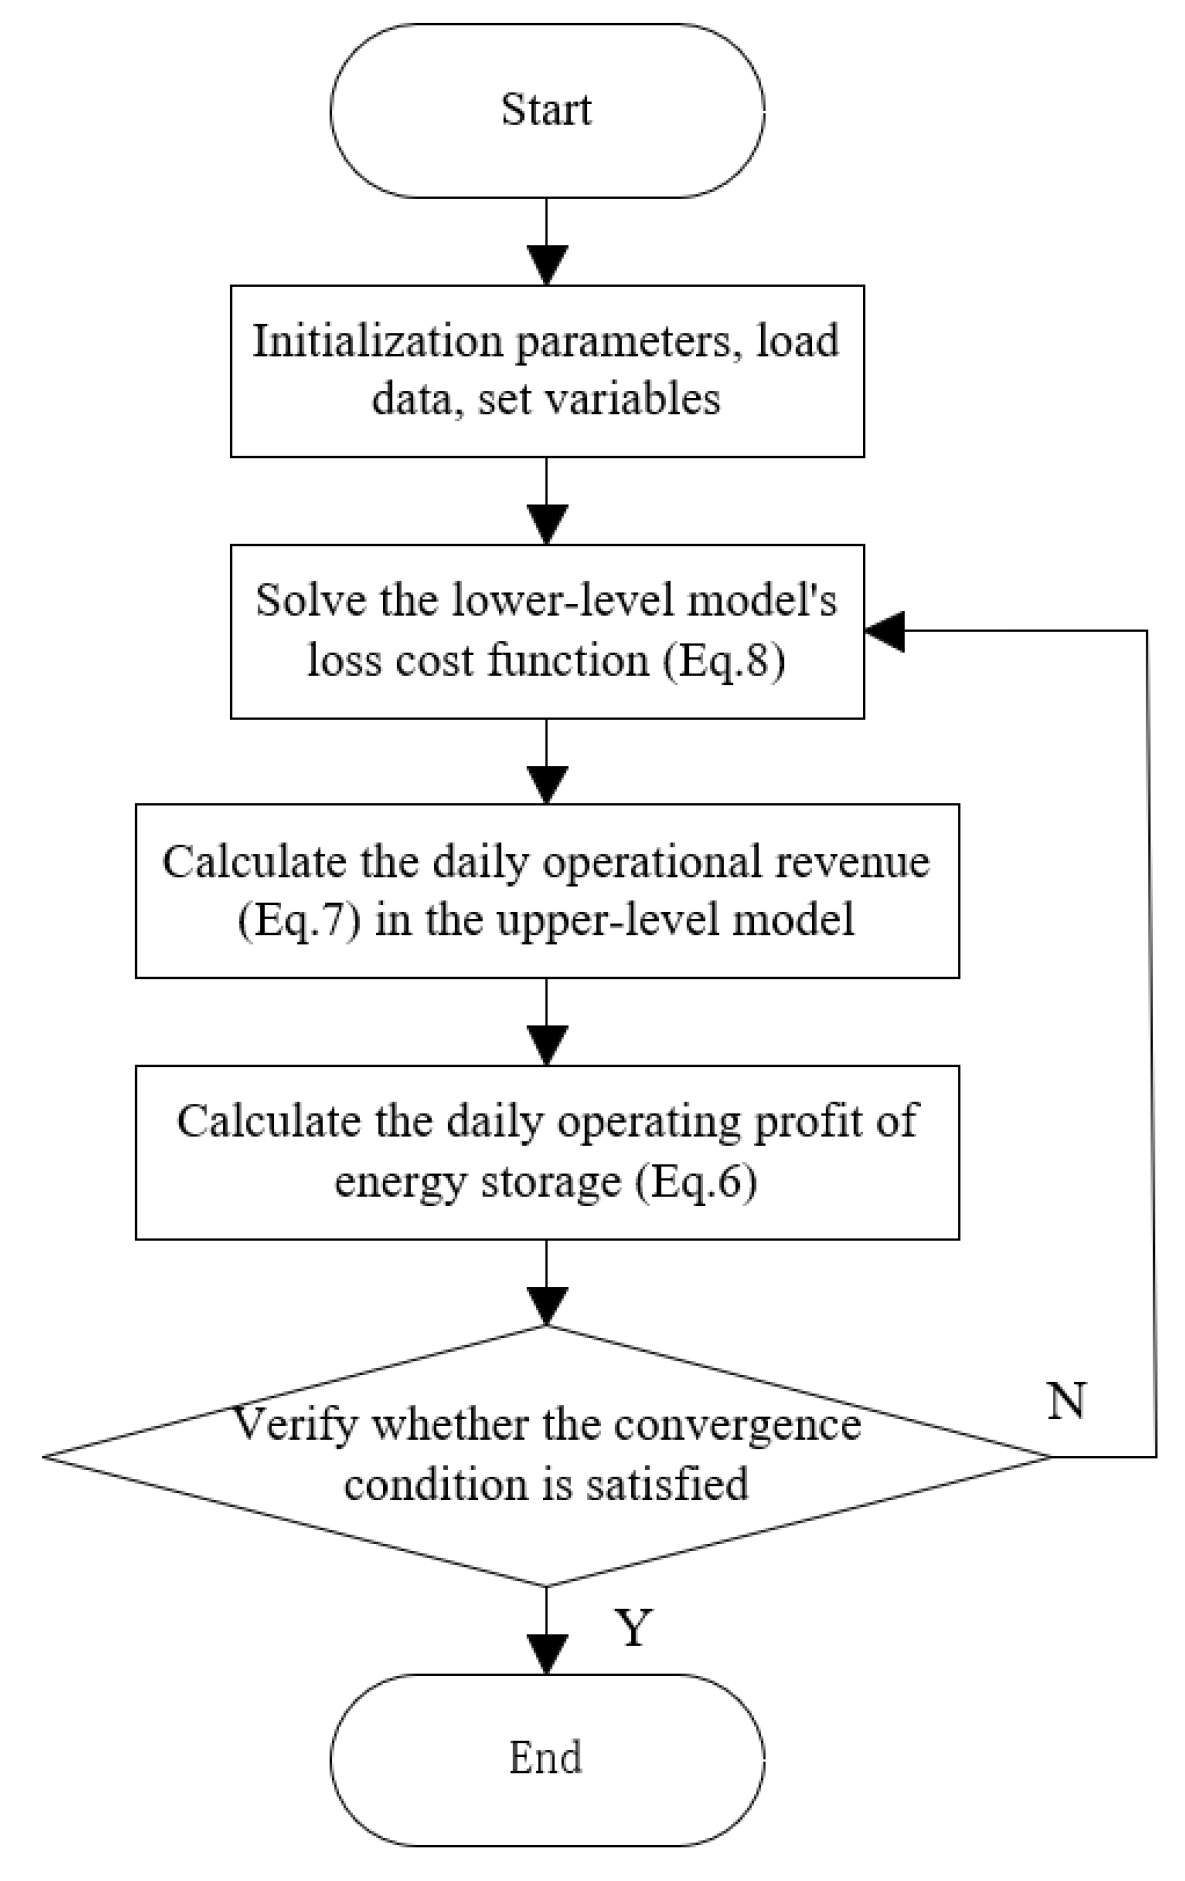
Considering the difficulty of solving nonlinear programming problems for dual-layer models with algorithms, this paper converts the lower-level energy storage cycle life loss into economic losses and integrates them into the upper-level daily operation profit calculation. Under the condition of considering only economic benefits, the two-stage model is integrated into a linear model for solving. The process is shown in
Figure 2.
The whale optimization algorithm (WOA), a swarm intelligence-driven optimization algorithm, was proposed by Mirjalili et al. in 2016 [
17], which includes three development strategies: spiral predation, bubble net attack, and random search. The WOA excels in solving continuous optimization problems due to its simple structure and excellent global optimization performance. However, it tends to converge prematurely when dealing with multidimensional problems and exhibits slow convergence rates toward the end of the algorithm’s iterations.
To address this, this study presents an improved whale optimization algorithm incorporating circle chaotic mapping, the golden sine formula, and the Cauchy mutation strategy. The chaotic mapping improves the initial distribution of individuals’ positions; the golden sine formula extends the individual search range, thereby boosting the algorithm’s local exploration capability; the Cauchy mutation increases individual perturbations, enhancing the algorithm’s information exchange capability among individuals and thereby improving its global search capability.
4.1. Traditional Whale Optimization Algorithm
4.1.1. Spiral Predation
In the early stage of the WOA search process, since the position of the optimal individual in the data sample remains uncertain, the individual with the highest fitness in the current population is treated as the optimal solution, and its position is used as a reference direction to guide the position update of other individuals.
Here,
t denotes the current number of iterations;
is the current individual position vector;
represents the position vector of the current optimal individual;
denotes the position vector between the current individual and the target individual; A and C are coefficient variables.
Here, r is a random number ranging from 0 to 1, and T represents the maximum number of iterations.
4.1.2. Bubble Net Attack
As the most distinctive hunting strategy of whales, WOA adopts the development strategy of spiral bubble net attack in the local development process. It mainly updates the individual position through two mechanisms—spiral position update and surround contraction—in order to achieve a wider search area. Both development methods coexist with equal occurrence probabilities, and their update methods are shown in Equation (17).
Here, denotes the distance between the current individual and the target individual; b is a constant, while l is a random number within the range of [−1, 1].
4.1.3. Random Search
Beyond the aforementioned development strategies, WOA also employs a random search strategy for prey exploration. When A > 1, a random individual is selected from the current sample to serve as the optimal individual for position updating, thereby boosting the algorithm’s global search capability. The update approach is presented in Equation (18).
Here, represents the position of a random individual.
4.2. Improve the Whale Optimization Algorithm
4.2.1. Circle Chaotic Mapping Initializes the Population
Traditional algorithms often adopt a pseudo-random form for the initialization of the population. This distribution approach fails to reliably ensure the uniformity of population distribution and exerts a certain impact on the algorithm’s solution accuracy and convergence rate. Thus, this study adopts Circle chaotic mapping for initial population generation, thereby improving the ergodicity of the initial population. The chaotic distribution of Circle is presented as follows:
Among them, is the current individual position, and are the upper and lower limits of the search space in the current dimension; is the sequence value of the Circle chaotic mapping; c and d are control parameters. The range of chaotic orbital state values is (0, 1).
4.2.2. Position Update Strategy Based on the Golden Sine Formula
When traditional WOA searches for prey, it merely relies on the positions of the current individual and the optimal individual, as well as the adjustment of random coefficients. This strategy has a relatively low development accuracy for the search space. This study introduces a search strategy based on the golden sine formula, which expands the algorithm’s search scope and enhances its global search capability as well as search accuracy. The improved golden sine position update formula is presented in Equation (21).
Among them, is the optimal individual position vector of the TTH iteration; is a random number of ; is a random number of ; is the golden sine division coefficient. is the golden section number.
In the update strategy after introducing the golden sine formula, by ensuring the search space of each individual, the single search path of the traditional WOA is improved, which is conducive to individuals approaching the optimal value, enhances the algorithm’s optimization ability and search accuracy, and guarantees the convergence of the algorithm.
4.2.3. Cauchy Mutation Strategy
Given that WOA tends to get trapped in local optima during the late iteration stage—a notable drawback—this study incorporates the Cauchy distribution to adjust the algorithm’s update strategy. As the convergence factor α decreases alongside the number of iterations, the algorithm’s iteration rate becomes relatively sluggish in the later phase, leaving it unable to break free when encountering local optima. After integrating Cauchy mutation, a larger moving step size can be produced via the Cauchy operator, raising the probability of individual population escaping local optima and thus enhancing the algorithm’s convergence performance. The individual update mode at this juncture is depicted in Equation (22).
Among them, is the position vector of the new individual after the update; is a Cauchy operator, and its distribution is .
After the introduction of Cauchy mutation, strong disturbances can be induced in individual whales, enhancing their capability to evade local optima, guiding the algorithm to rapidly locate the optimal solution, and improving the algorithm’s overall performance.
4.2.4. Algorithm Testing
To verify the superiority and feasibility of IWOA in solution performance, this paper adopts four sets of standard test functions to test the algorithm’s solution ability from aspects such as low dimension, high dimension, unimodal, multimodal, zero solution, and non-zero solution. Meanwhile, other commonly used traditional intelligent optimization algorithms are incorporated to conduct comparative experiments. The standard test function information is shown in
Table 1.
In the test, the population size N = 30 and the maximum number of iterations
= 500. To mitigate errors arising from experimental randomness, 30 independent experiments were performed for each algorithm group, with the average value and standard deviation extracted as evaluation metrics. The obtained results are shown in
Table 2.
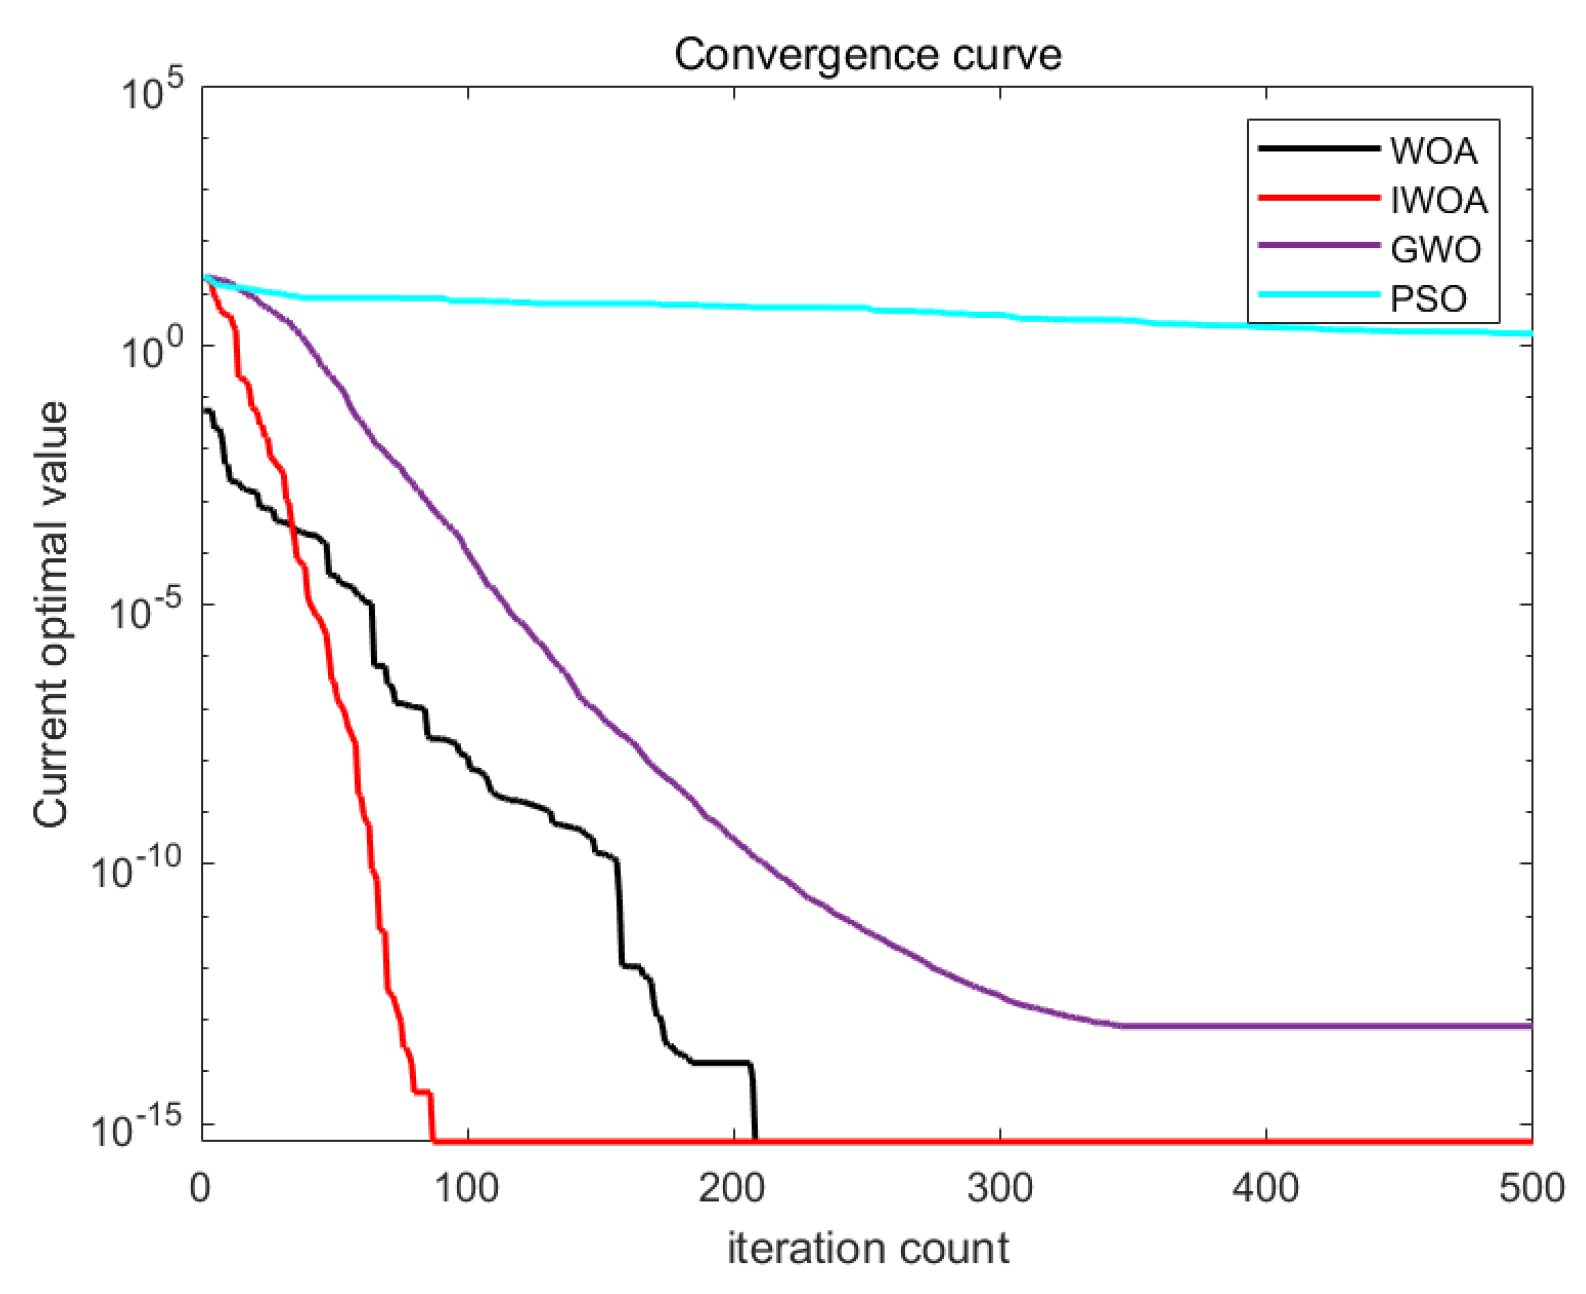
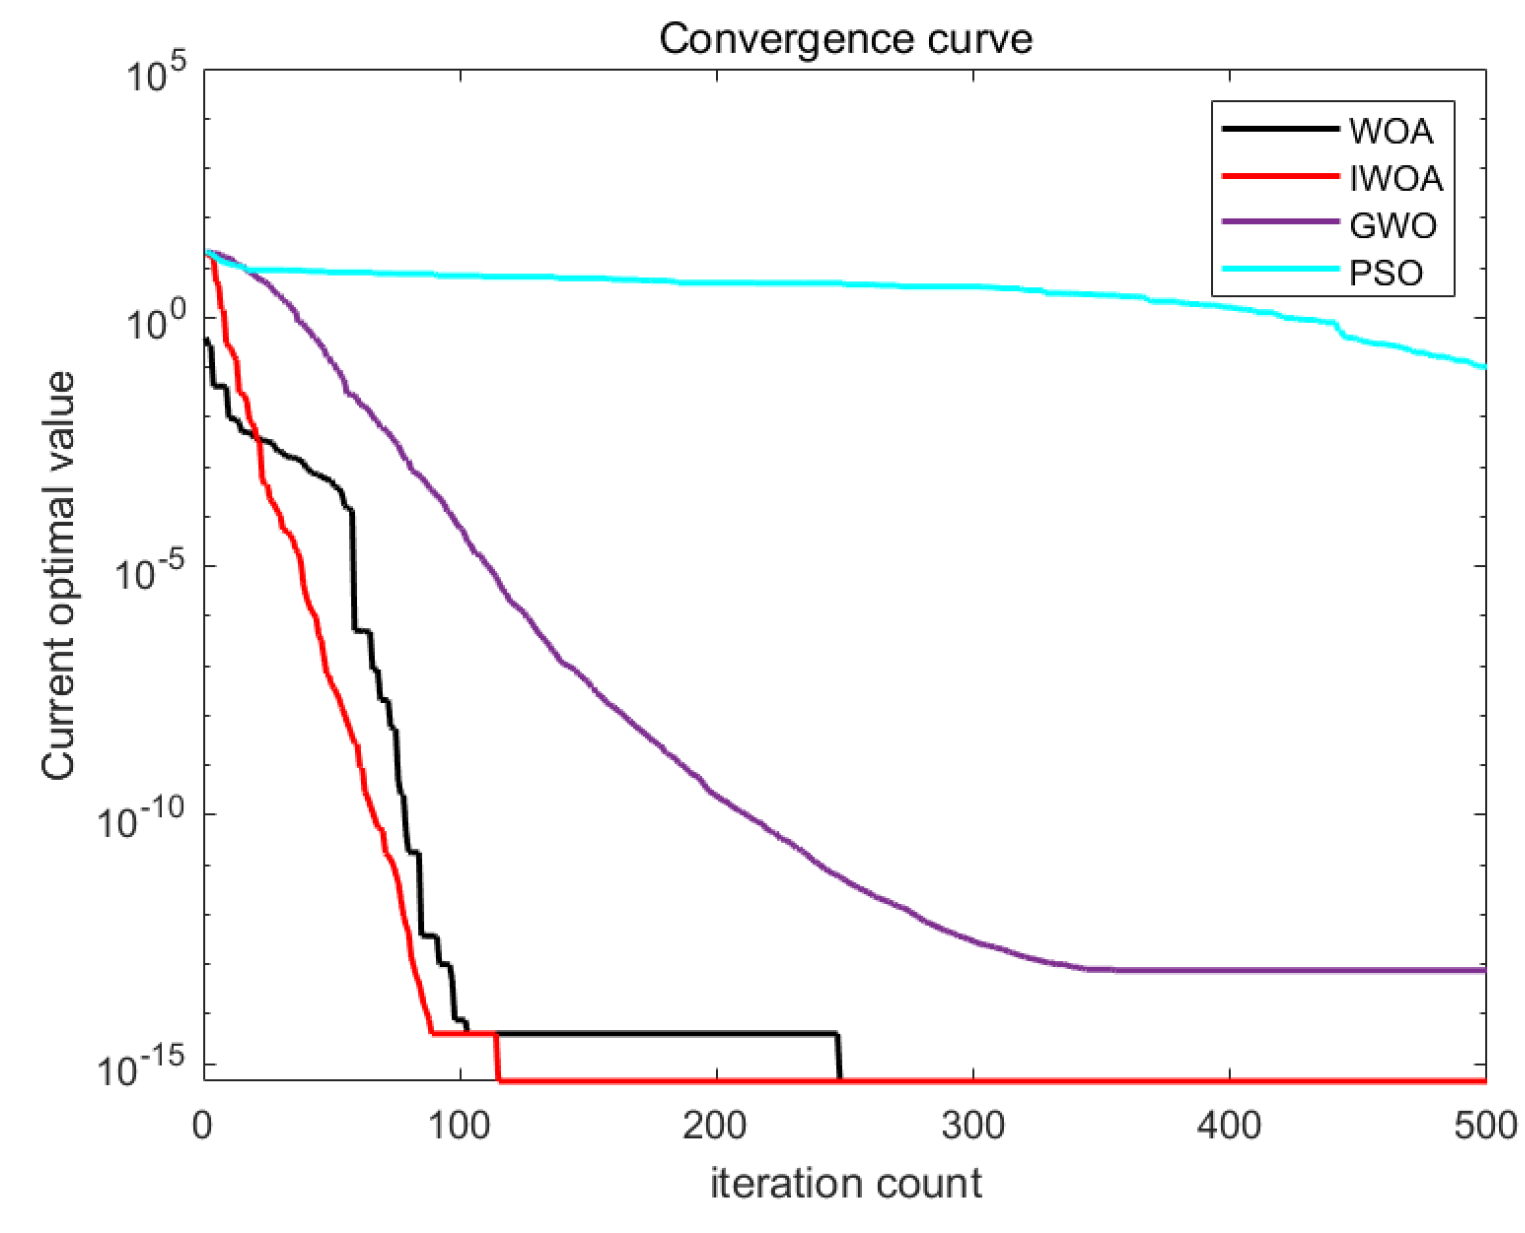
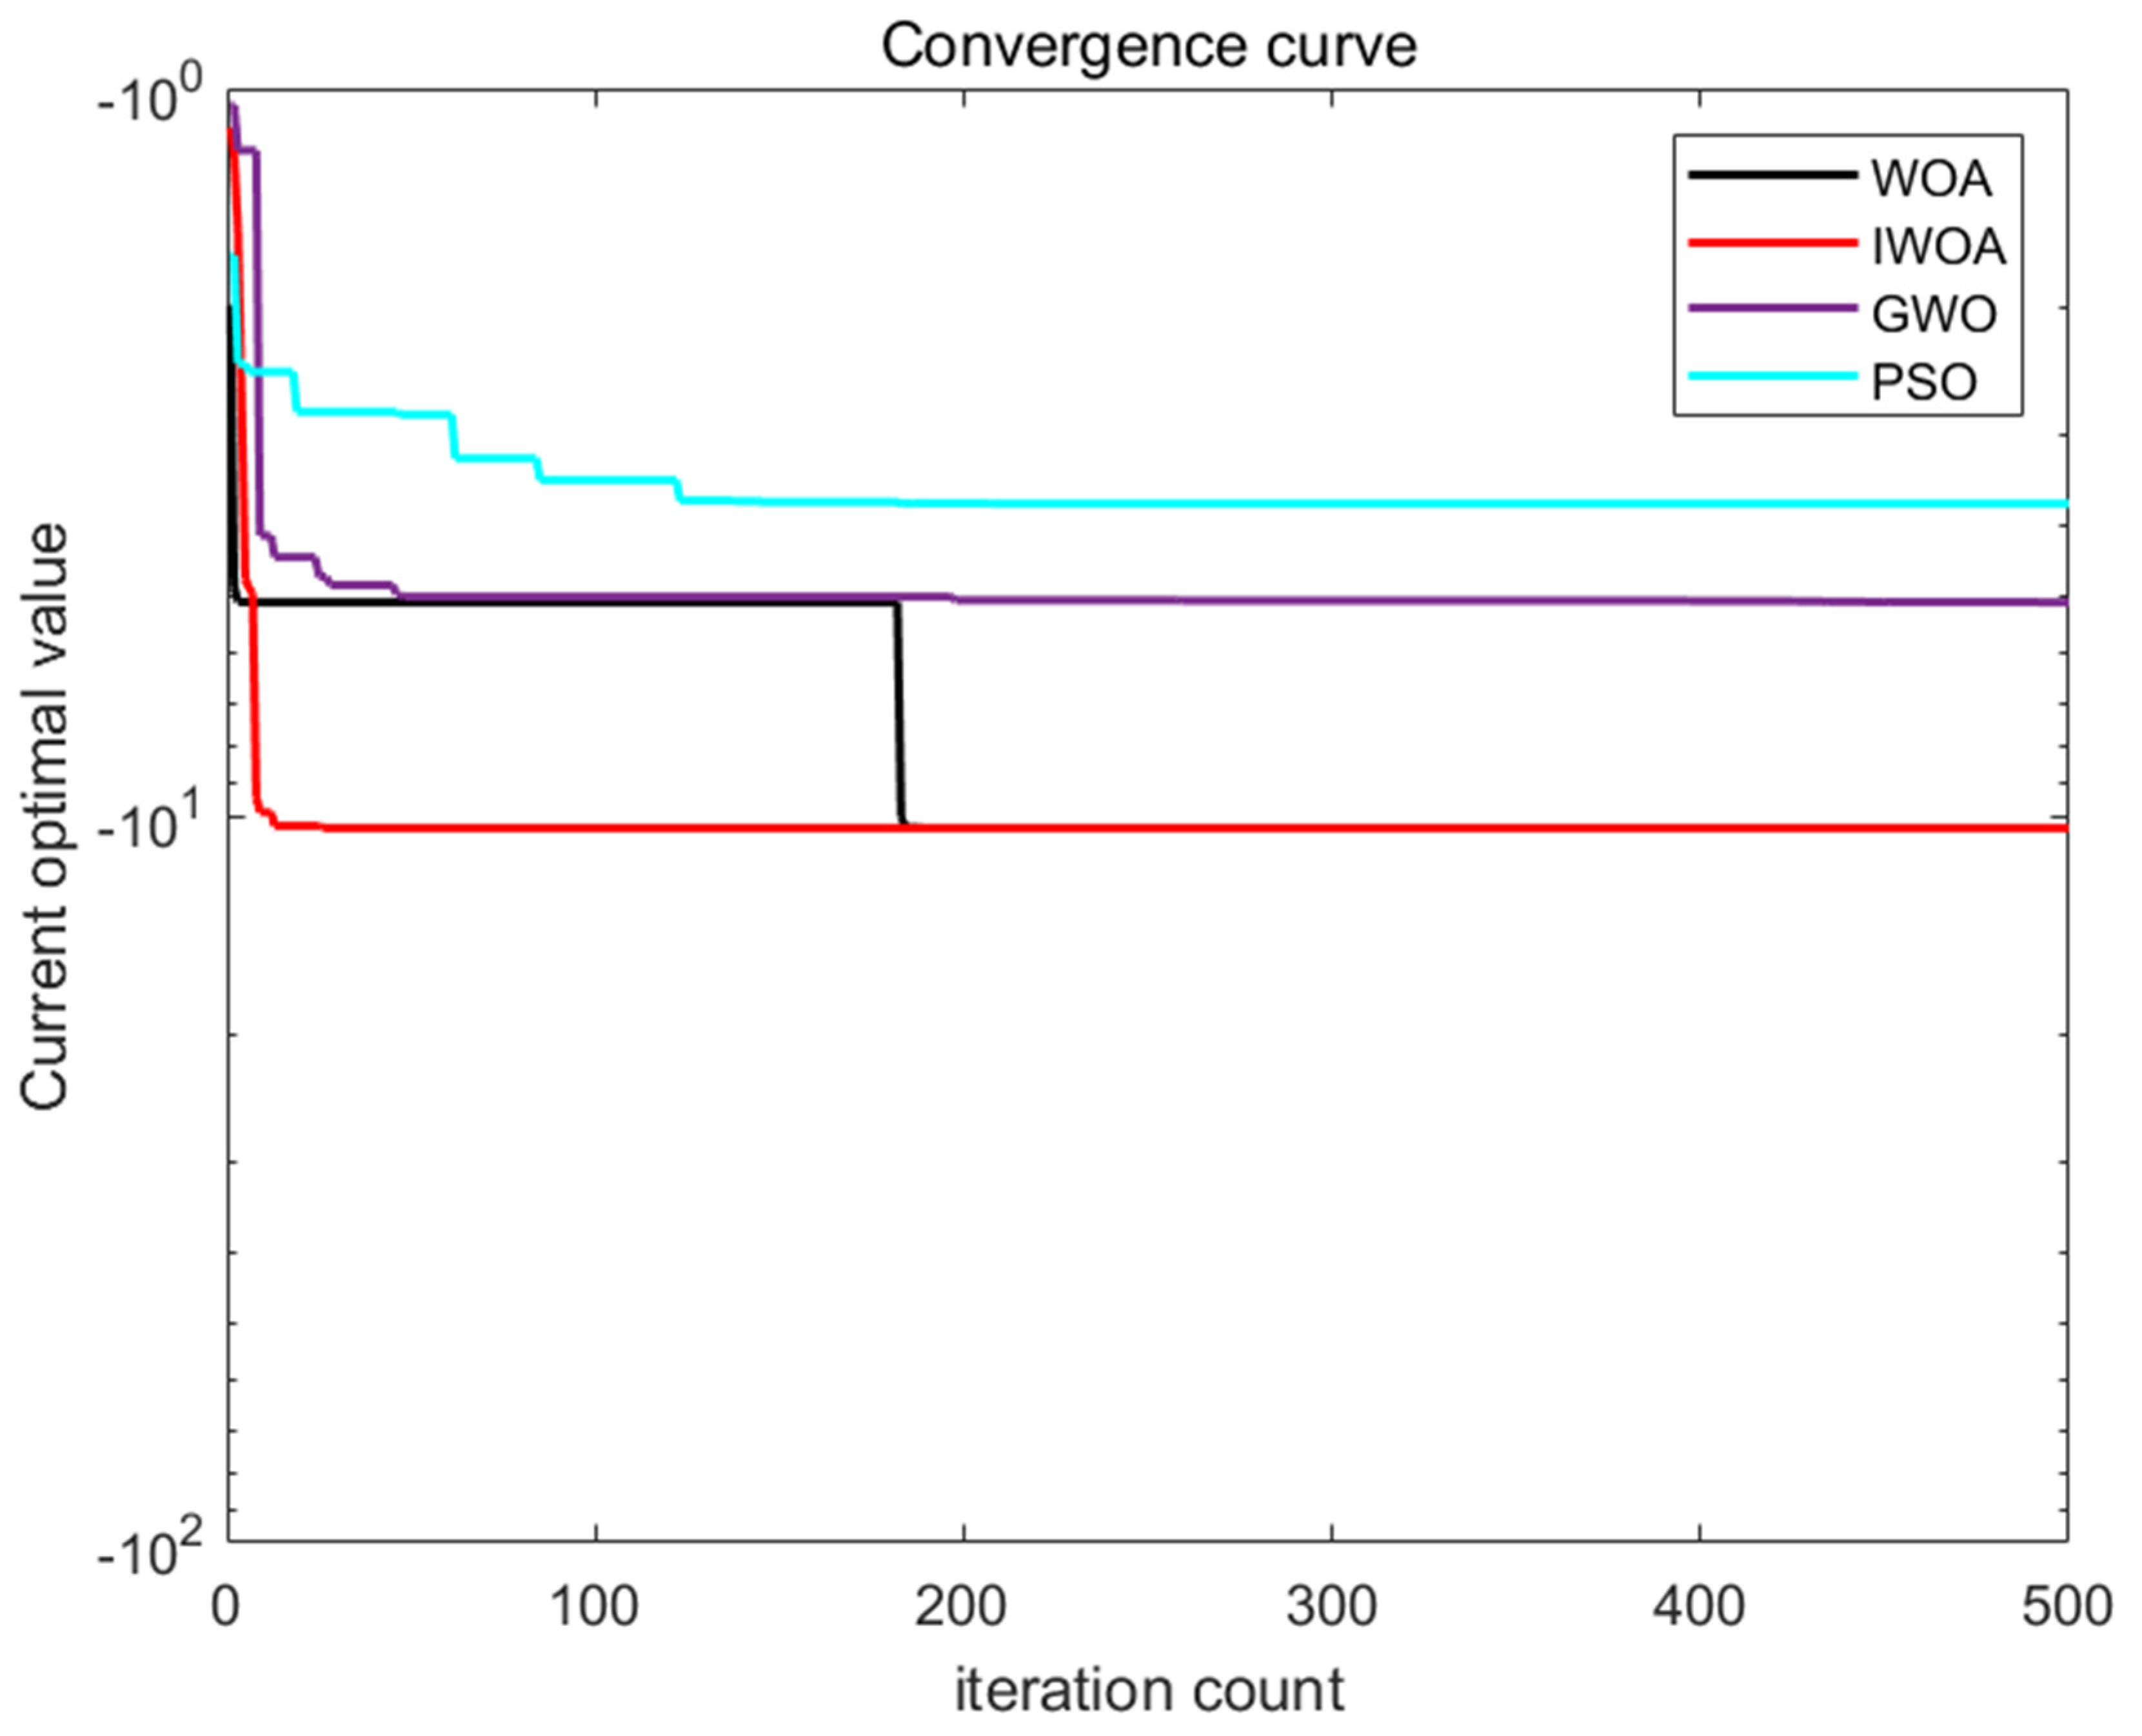
Simulation results are illustrated in
Figure 3,
Figure 4,
Figure 5 and
Figure 6. From the test functions’ convergence curves, it can be seen that the improved IWOA boasts quicker convergence speed and superior search accuracy relative to the traditional WOA. At the same time, when handling multi-dimensional test functions, it exhibits a more powerful capability to escape local optima. As depicted in
Table 2, IWOA is able to attain the optimal solution to a certain degree across repeated tests. Furthermore, according to the mean and standard deviation, the improved IWOA demonstrates enhanced robustness.
6. Conclusions
This study integrates the energy storage cycle life calculation strategy to construct a two-layer optimal configuration model for energy storage and employs an improved WOA for solution. Ultimately, through comparative experiments across diverse scenarios, it is revealed that a proper energy storage configuration can extend the service life of energy storage while enhancing its annual return rate.
Aiming at the issues of inadequate convergence accuracy and low convergence rate in the traditional WOA, this study proposes integrating circle chaotic mapping, the golden sine formula, and the Cauchy mutation strategy to develop an improved whale optimization algorithm (IWOA). Verified through multiple test functions by comparing it with traditional algorithms like WOA, GWO, and PSO, the improved IWOA exhibits faster convergence speed, higher convergence accuracy, and superior stability.
Combining examples, IWOA was applied to solve the integrated capacity optimization configuration model, obtaining more reasonable results, extending the cycle life of energy storage, and achieving higher returns at the same time.
