Abstract
Given the characteristics of underwater electromagnetic detection systems, starting from typical applications, this paper analyzes the impact of random variables on the optimal receiver. The mathematical expression of the optimal receiver is derived using the Generalized Likelihood Ratio Test (GLRT), and the test statistics are determined. Expressions for the receiver threshold, detection probability, and false alarm probability are derived, and the system block diagram of the optimal receiver is obtained. Through simulation, the working characteristics of the generalized likelihood ratio receiver and the matched filter are compared. It is verified that the performance of this receiver is close to that of a matched filter under different conditions. Since the maximum likelihood estimation of random parameters is used, this receiver is considered suboptimal. However, when the signal-to-noise ratio (SNR) is high, this receiver can replace the matched filter as the optimal receiver.
1. Introduction
Due to the conductivity of water, electromagnetic waves experience significant attenuation underwater, with energy attenuation reaching approximately 90% per meter [1]. Therefore, in most applications, underwater electromagnetic detection is not feasible. However, in certain specific scenarios, such as low-frequency and near-field applications [2], underwater electromagnetic detection still has its place.
In Reference [3], to detect the distribution of underwater pipelines, the received electromagnetic field signals from the pipelines were amplified and filtered conventionally to extract the effective value of the signal for underwater target detection. In References [4,5], resonant frequency-selective circuits were used in the receiver to extract communication signals. Since the signals in these systems were known, the resonant circuit acted as a narrowband filter, equivalent to using a matched filter for signal detection. In Reference [6], for the detection of underwater metal pipelines, a processing flow of filtering, amplification, detection, integration, and peak extraction was used, where the filtering was narrowband, thus equivalent to a matched filter. In Reference [7], a real-time integrated underwater electromagnetic detection system was designed and implemented. Due to the use of high-performance magnetic field sensors, the acquisition of magnetic field signals was achieved using simple voltage followers and proportional attenuators. In Reference [8], an active electromagnetic detection method for underwater metal targets was proposed. But the optimal receiver is not considered. For underwater ferromagnetic detection, research has been conducted based on EMD decomposition, phase characteristics, and VMD decomposition, which is focused on the method of signal processing, not on the optimal receiver [9,10,11].
The objects studied in the above literature are all known signals. However, in certain applications, such as detecting passing ships, the detection signal model in underwater electromagnetic detection contains random parameters with unknown statistical characteristics, making it impossible to use a matched filter to achieve the optimal receiver for underwater electromagnetic detection systems. Currently, there is no relevant literature addressing this issue in the academic community.
This paper employs the generalized maximum likelihood criterion to obtain the mathematical expression and system composition of the optimal receiver for an underwater electromagnetic detection system. The receiver operating characteristics are analyzed through simulation experiments, and the receiver’s performance is validated via pool testing.
2. Analysis of Target Echo Signal Characteristics
For the underwater electromagnetic detection system analyzed in this paper, its typical working principle is shown in Figure 1.
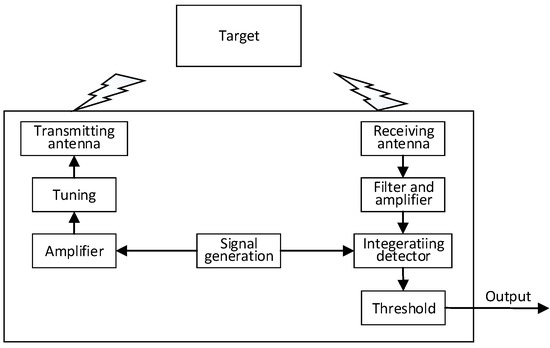
Figure 1.
Working diagram of underwater electromagnetic detection system.
In the figure, the signal generation module produces the transmitted signal, which is then amplified and tuned before being radiated as an electromagnetic wave by the transmitting antenna. When encountering a ferromagnetic target, a reflected echo is generated. The receiving antenna converts the reflected electromagnetic wave signal into an electrical signal, which is then filtered, amplified, detected, and integrated before being compared with a threshold to complete target signal detection. When synchronous detection is used, a copy of the transmitted signal is required.
For certain special applications, such as underwater vehicles equipped with electromagnetic detection systems to detect surface navigation targets, the minimum distance between the detection system and target depends on the combined error of the navigation depth error of the vehicle and the draft error of the surface target, which is a random variable. Therefore, the amplitude of the echo signal is also a random variable.
For the underwater electromagnetic detection system shown in Figure 1, the equivalent model of the transmitting and receiving antenna configuration is shown in Figure 2.
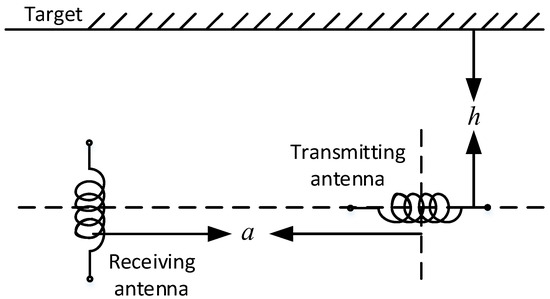
Figure 2.
Configuration of receiving and transmitting antenna of underwater electromagnetic detection system.
Therefore, the electromagnetic echo signal in water can be expressed as follows [12]:
where is the signal amplitude, is the signal envelope, is the signal frequency, and is the signal phase.
For the case of vertical configuration between the transmitting and receiving antenna, the signal amplitude can be derived from the full magnetic field expression of a magnetic dipole:
where is the radiation magnetic moment, is the magnetic permeability of seawater, is the distance between the transmitting and receiving antennas, and is the distance between the transmitting antenna and the target.
For typical applications of underwater electromagnetic detection systems, follows a normal distribution [13], i.e., . When applied to surface target detection, , ; i.e., the mean value is the difference between the working depth of the electromagnetic detection system and the navigation depth of the surface target, and the variance is the combined deviation of the navigation depths of the electromagnetic detection system and the surface target. Therefore, the probability density function of is as follows:
For typical applications, the signal envelope can be expressed as follows:
where is the reciprocal of the target echo signal width, and is the time when the electromagnetic detection device is closest to the target [14].
is the phase of the echo signal, which includes the phase mutation caused by interface scattering, propagation phase shift, and initial phase, and can be expressed as follows:
where is the phase mutation caused by interface scattering, which is approximately 180° when scattering at a ferromagnetic target; is the propagation phase shift; and is the initial phase [15].
For underwater electromagnetic detection systems, due to the low operating frequency, the wavelength can reach several kilometers [12]. At the same time, since the operating distance of underwater electromagnetic detection systems is relatively short, usually only a few meters, it can be ignored compared to the wavelength. Therefore, the propagation phase shift can be considered as , and Equation (5) can be rewritten as follows:
For underwater electromagnetic detection systems, in addition to environmental and circuit noise interference, there is also direct coupling interference [16], which is the interference formed by the transmitted signal being directly received without being scattered by the target. Considering the short propagation distance, it can be considered that the direct coupling interference has the same frequency and phase as the transmitted signal, with only a fixed amplitude change. Therefore, the direct coupling interference can be expressed as follows [17]:
where .
Considering Gaussian white noise, the received signal of the underwater electromagnetic detection system can be expressed as follows:
where is Gaussian white noise with a mean of 0, variance of , and power spectral density of .
3. Derivation of the Optimal Receiver
From Equation (8), the signal detection problem of the underwater electromagnetic detection system is a binary random parameter signal detection problem under Gaussian white noise conditions with narrowband interference. Therefore, two hypotheses can be made [18]:
Since is Gaussian white noise, under the condition of , follows , i.e.,
where is a constant, is the number of sampling points, and is the sampling interval that satisfies the noise uncorrelation [19].
The conditional probability density function of the echo signal under the condition of is as follows [20]:
Since the echo signal contains random parameters , this is a composite hypothesis testing problem.
From Equation (3), is a relatively complex function, making it difficult to directly calculate the average likelihood function . Therefore, we choose to calculate the generalized likelihood function and perform the Generalized Likelihood Ratio Test (GLRT) [21].
The maximum likelihood equation is as follows [22]:
Substituting Equations (1), (7) and (11) into Equation (12) yields the following:
Therefore, the decision rule for the Generalized Likelihood Ratio Test is as follows [23]:
Substituting Equations (1), (7), (10), (11) and (13) into Equation (14) yields the following:
where , and is the test statistic.
4. Analysis of Receiver Operating Characteristics
From the expression of the test statistic, it can be seen that the test statistic is the result of a linear transformation of and is therefore also a Gaussian random variable [24].
Let , and then under the hypothesis , the conditional mean of the test statistic is as follows [25]:
Under the hypothesis , the conditional variance of the test statistic is as follows:
Since is Gaussian white noise, the following can be obtained [26]:
Substituting Equation (18) into Equation (17) yields the following:
where .
Similarly, under the hypothesis , the conditional mean and conditional variance of the test statistic are as follows:
Therefore, the probability density functions of the test statistic under the two hypotheses are as follows [27]:
For underwater electromagnetic detection systems, it is usually impossible to determine the prior probability and cost factors in advance. Therefore, the Neyman–Pearson criterion is used to maximize the detection probability under a given false alarm probability .
From Equation (22), the false alarm probability is as follows:
Similarly, from Equation (23), the detection probability is as follows:
Substituting Equation (19) into Equations (24) and (25) yields the following:
When the false alarm probability is given, the likelihood ratio threshold can be calculated from Equation (24) and then substituted into Equation (25) to obtain the detection probability , thus obtaining the receiver operating characteristic (ROC) curve of the underwater electromagnetic detection system. From Equation (25), it can be seen that when the false alarm probability is given, the detection probability depends only on the signal energy and the noise power spectral density , and it is independent of the signal waveform.
Assuming a horizontal magnetic dipole in seawater, radiating a continuous wave (CW) with a frequency of , with a magnetic moment of , initial phase of zero, distance between the magnetic dipole and the target of , and distance between the transmitting and receiving antennas of , taking , and assuming Gaussian white noise with a mean of 0 and a power spectral density of , the receiver operating characteristic curve is shown in Figure 3.
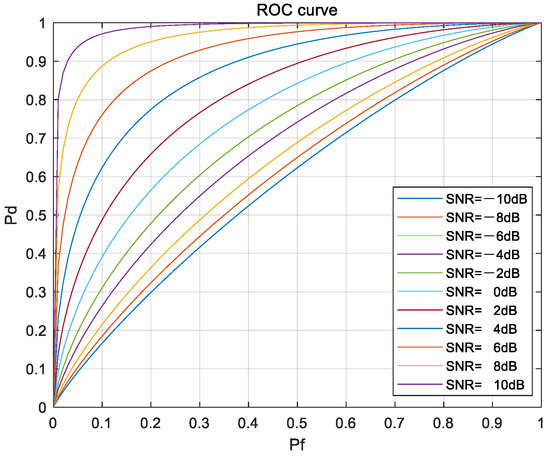
Figure 3.
The ROC curve.
From Figure 3, it can be seen that when the signal energy and noise power spectral density are determined, the detection probability changes with the false alarm probability ; when the false alarm probability is fixed, the detection probability changes with the signal-to-noise ratio (SNR).
From statistical detection theory, when detecting known signals, the optimal receiver is a matched filter. Under the same conditions as Figure 3, Figure 4 shows the ROC curves of the generalized likelihood ratio receiver derived in this paper and the matched filter receiver.
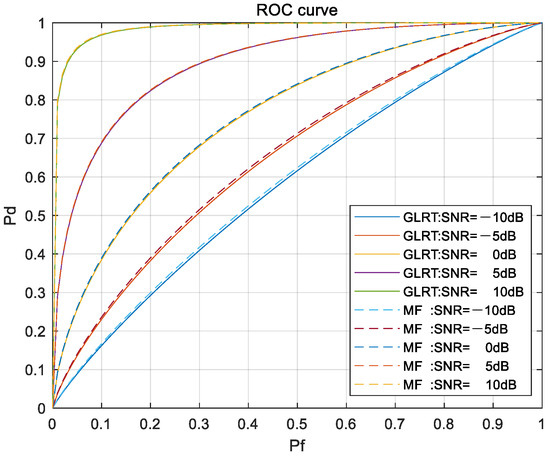
Figure 4.
ROC of generalized likelihood ratio receiver and matched filter.
In Figure 4, the solid line represents the ROC curve of the generalized likelihood ratio receiver, and the dashed line represents the ROC curve of the matched filter. It can be seen from the figure that the generalized likelihood ratio receiver is close to the matched filter, especially under high-SNR conditions, where its performance is almost the same as that of the matched filter. Moreover, under low-SNR conditions, the impact of noise on the performance of the generalized likelihood ratio receiver is acceptable.
From Equations (7) and (8), it can be seen that direct coupling interference, as an interference signal, mainly depends on the distance between the transmitting and receiving antennas when other conditions remain unchanged. Figure 5 shows the mean square error (MSE) curves of the detection probability error between the generalized likelihood ratio receiver and the matched filter receiver as a function of the distance between the transmitting and receiving antennas under different SNR conditions.
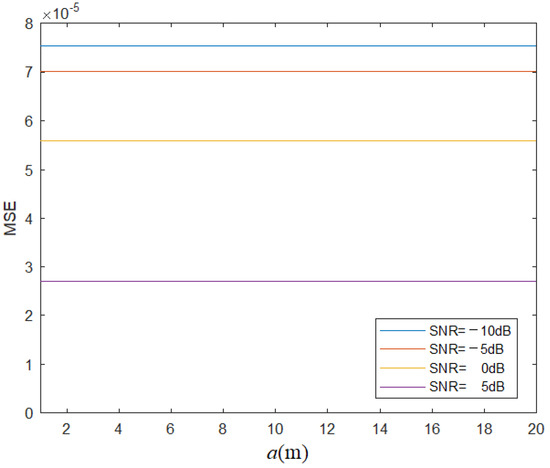
Figure 5.
MSE curve varying with under the condition of various SNR.
In Figure 5, it can be seen that, as the SNR increases, the performance of the generalized likelihood ratio receiver and the matched filter gradually converges, which is consistent with the trend shown in Figure 4. Moreover, under different signal-to-noise ratios, the performance of the generalized likelihood ratio receiver only experiences minor changes with the variation in the spacing between the transmitting and receiving antennas (i.e., direct coupling interference), indicating the robustness of this receiver.
In the simulation analysis of Figure 5, the change in the distance between the transmitting and receiving antennas not only affects the amplitude of the direct coupling interference but also affects the amplitude of the target echo signal, and both have the same trend.
To comprehensively analyze the system’s performance, assuming the distance between the transmitting and receiving antennas is fixed, the amplitude of the direct coupling interference will be fixed. From Equations (1) and (2), it can be seen that the change in the distance between the transmitting antenna and the target will only affect the amplitude of the echo signal. Figure 6 shows the MSE curves of the detection probability of the generalized likelihood ratio receiver and the matched filter receiver as a function of the distance between the transmitting antenna and the target under different SNR conditions.
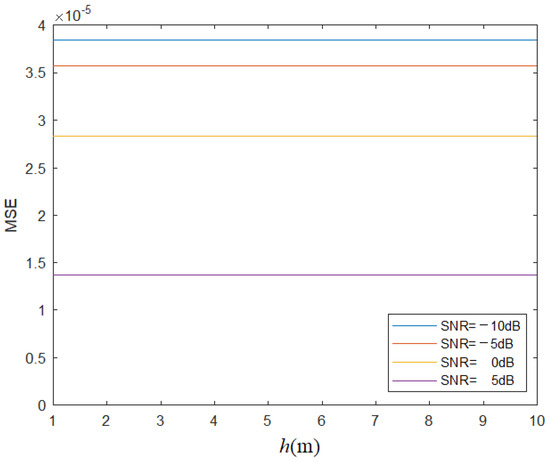
Figure 6.
MSE curve varying with h under the condition of various SNR.
From Figure 6, it can be seen that as the SNR increases, the performance of the generalized likelihood ratio receiver and the matched filter gradually approaches, which is consistent with the trends shown in Figure 4 and Figure 5. Moreover, under different SNR conditions, the performance of the generalized likelihood ratio receiver only experiences minor changes with the distance between the transmitting antenna and the target ; i.e., it only experiences minor changes with the signal-to-interference ratio (SIR), further indicating that this receiver is robust.
5. Generalized Likelihood Ratio Receiver for Underwater Electromagnetic Detection Systems
From Equation (15), the block diagram of the generalized likelihood ratio receiver for underwater electromagnetic detection systems is shown in Figure 7.

Figure 7.
Generalized likelihood ratio receiver.
In Figure 7, the calculated parameter is a fixed value for each time window. Therefore, in the integration of the test statistic, is a fixed parameter for the current time window. It meets the needs of practical applications.
Since the Generalized Likelihood Ratio Test uses the maximum likelihood estimate of the random parameter , the test result may not be optimal but is generally close to optimal [28], as verified in the simulation results shown in Figure 4, Figure 5 and Figure 6.
Combined with the analysis in Section 3, the generalized likelihood ratio receiver performs close to the matched filter and is considered a suboptimal receiver. When the SNR is high, it can completely replace the matched filter as the optimal receiver.
6. Experimental Testing
In order to test the performance of the receiver, an underwater electromagnetic detection system experiment was constructed, as shown in Figure 8.
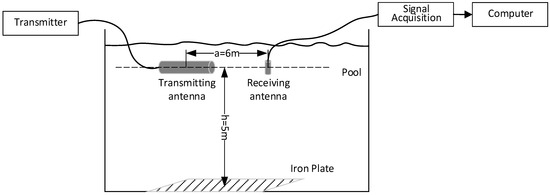
Figure 8.
Experimental implementation diagram.
In the figure, the transmitter is used to generate high-power transmission signals, which are radiated into space as electromagnetic waves through the transmitting antenna. After being reflected by the target (iron plate: 6 m × 6 m × 2 mm), the signals are acquired by the receiving antenna and processed by the signal acquisition system. The computer then completes the signal reception and detection. The experiment uses a pool with dimensions of 10 m × 8 m × 8 m (length × width × depth). The transmitting signal frequency of the transmitting antenna is a CW wave, with a magnetic moment of and a receiving antenna sensitivity of . The axis of the transmitting antenna is perpendicular to the axis of the receiving antenna, and the midpoint of the receiving antenna is located on the axis of the transmitting antenna, forming a vertical configuration of transmitting and receiving antennas. The iron plate is horizontally placed at the bottom of the water and parallel to the axis of the transmitting antenna. The transmitting and receiving antennas are located directly above the iron plate. The conditioning circuit at the receiving end has a gain of 80 dB and a sampling rate of 20 KHz.
The experimental installation is shown in Figure 9.
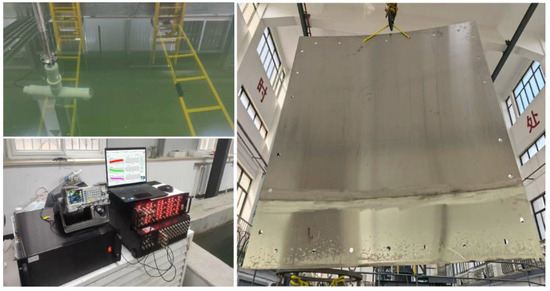
Figure 9.
Experimental installation.
In the experiment, the noise power can be obtained without signal transmission. Then the total power is obtained using signal transmission. The difference between the total power and the noise power is the signal power, from which the SNR can be derived, . Given the false alarm probability , the detection probability can be obtained by Figure 3, . To verify the detection probability , a binomial distribution success–failure-type test scheme is adopted. According to common engineering practices, the confidence level is set to 0.8, and the one-sided confidence lower bound for the detection probability is set to 0.9. Based on the description in Appendix A of Reference [29], when the confidence level is 0.8 and the one-sided confidence lower bound is 0.9, the determination of the number of trials and the number of allowable failures is as shown in Table 1.

Table 1.
The test scheme for detection probability.
When any of the five inspection schemes in Table 1 is met, the corresponding detection probability value can be obtained. In this paper, the scheme numbered 1 in Table 1 is taken as the detection probability inspection scheme. If it is met, the conclusion that the detection probability is 0.9043 can be drawn.
Under the condition of keeping the position of the transmitting and receiving antennas and the target iron plate unchanged, 16 sets of experiments were conducted, each with a duration of 200 ms. The results are shown in Figure 10.

Figure 10.
Detection results.
From the figure, it can be seen that the target was effectively detected in all 16 experiments. According to the scheme labeled as number 1 in Table 1, the detection probability can be considered as 0.9043, which meets the expected value of 0.9, verifying that the performance of the generalized likelihood ratio receiver is consistent with the theoretical calculation results.
7. Conclusions
This paper addresses the current situation where underwater electromagnetic detection systems do not consider optimal reception. Using the generalized maximum likelihood criterion, we derived the mathematical expression for the optimal receiver. Based on its test statistic, we applied the Neyman–Pearson criterion to derive the mathematical expressions for the receiver’s detection probability and false alarm probability. Using this as a foundation, we simulated the receiver’s operating characteristics through numerical simulation. To verify the performance of the receiver obtained in this paper, we compared the generalized likelihood ratio receiver with a matched filter under the same conditions using numerical simulation. We analyzed the receiver’s operating characteristics, how they vary with the spacing between the transmitting and receiving antennas under different signal-to-noise ratios (SNRs), and how they vary with the distance between the radiating antenna and the target under different SNRs. The results indicate that the performance of the generalized likelihood ratio receiver is close to that of the matched filter, especially under high-SNR conditions, where its performance is almost identical to that of the matched filter. Furthermore, under low-SNR conditions, the impact of noise on the performance of the generalized likelihood ratio receiver is also acceptable. Under different SNR conditions, the performance of the generalized likelihood ratio receiver only experiences minor changes with variations in the spacing between the transmitting and receiving antennas and the distance between the radiating antenna and the target, demonstrating the robustness of this receiver. Based on the derived mathematical expression for the generalized likelihood ratio receiver, we provided the system composition structure of the receiver and conducted underwater experimental verification accordingly. We verified the performance of the generalized likelihood ratio receiver under small-sample conditions using a binomial distribution success–failure-type test scheme. The experiments showed that the actual performance of the receiver meets the conclusions of mathematical calculations and simulation analysis.
This achievement can effectively enhance the performance of the receiver, providing strong support for improving the performance of current underwater electromagnetic detection systems. It also lays a theoretical foundation for the design and testing of new underwater electromagnetic detection systems and holds significant engineering importance.
Future work will focus on developing an engineering prototype based on the conclusions drawn from the text, further optimizing and improving the conclusions and models accordingly, and applying the results to other underwater electromagnetic detection systems.
Author Contributions
B.T. and S.T. are responsible for the methodology and simulation. L.Z. is responsible for writing and validation. All authors have read and agreed to the published version of the manuscript.
Funding
This research received no external funding.
Data Availability Statement
Data is contained within the article.
Conflicts of Interest
The three authors are employed by the Naval University of Engineering. The three authors declare that the research was conducted in the absence of any commercial or financial relationships that could be construed as potential conflicts of interest.
References
- Wang, M.; Deng, M.; Yu, P.; Yin, C.; Chen, K.; Luo, X. High-power time-frequency transmission and multi-chain cable multi-component electromagnetic system for deep-water exploration. Chin. J. Geophys. 2022, 65, 3664–3673. [Google Scholar]
- Zhu, J.; Zhu, S.; Liao, G.; Xu, J.; Lan, L.; Zeng, C. Joint target detection based on phased array and frequency diverse array dual-mode radar. Syst. Eng. Electron. 2023, 45, 1342–1350. [Google Scholar]
- Kang, W. Research on Underwater Pipeline Detection Circuit System. Master’s Thesis, University of Electronic Science and Technology of China, Chengdu, China, 2020. [Google Scholar]
- Zhang, J. Research and Testing of Underwater Magnetic Induction Communication Technology. Master’s Thesis, Zhejiang University, Hangzhou, China, 2022. [Google Scholar]
- Liang, X. Research on Contactless Information Transmission Technology for Autonomous Underwater Vehicles. Master’s Thesis, Harbin Engineering University, Harbin, China, 2016. [Google Scholar]
- Tian, B. Underwater Pipeline Electromagnetic Detection Methods and Technology Research. Master’s Thesis, Hunan University of Science and Technology, Xiangtan, China, 2013. [Google Scholar]
- Chen, J.; Xu, H.; Yuan, Y.; Liu, L.; Lian, B. Design of an Underwater Real-Time Integrated Electromagnetic Detection System. J. Unmanned Undersea Syst. 2023, 31, 600–606. [Google Scholar]
- Zhu, K.; Li, Y.; Yue, L.; Ding, M. An Active Electromagnetic Detection Method for Underwater Metal Targets. In Proceedings of the Third International Conference on Computer Technology, Information Engineering, and Electron Materials, CTIEEM 2023, Zhengzhou, China, 17–19 November 2023; Volume 12987, pp. 1298701-1–1298701-6. [Google Scholar]
- Tan, J.; Yang, C.; Zhang, T. Detection of underwater ferromagnetic objects by EMD decomposition based on industrial frequency electromagnetic fields. In Proceedings of the 2023 2nd International Conference on Artificial Intelligence and Computer Information Technology, AICIT 2023, Yichang, China, 15–17 September 2023; pp. 1–5. [Google Scholar]
- Yang, C.; Zhang, Q.; Zhang, T. Research on the detection of ferromagnetic objects based on the phase characteristics of industrial frequency electromagnetic fields. In Proceedings of the 2022 International Conference on Artificial Intelligence and Computer Information Technology, AICIT 2022, Yichang, China, 16–18 September 2022; pp. 1–5. [Google Scholar]
- Barrow, B.; Nelson, H.H. Collection and Analysis of Multi-Sensor Ordnance Signatures with MTADS. J. Environ. Eng. Geophys. 1998, 3, 71–79. [Google Scholar] [CrossRef]
- Thiesson, J.; Tabbagh, A.; Dabas, M.; Chevalier, A. Characterization of buried cables and pipes using electromagnetic induction loop-loop frequency-domain devices. Geophysics 2018, 83, E1–E10. [Google Scholar] [CrossRef]
- Wang, S.; Liu, J. Principle and Design of Torpedo Near Fusing Fuze; Northwestern Polytechnical University Press: Xi’an, China, 1992; pp. 17–41. [Google Scholar]
- Khaledi, S.; Mann, H.; Perkovich, J.; Zayed, S. Design of an underwater mine detection system. In Proceedings of the Systems and Information Engineering Design Symposium (SIEDS), 2014, Charlottesville, VA, USA, 25 April 2014; pp. 78–83. [Google Scholar]
- Chave, A.D. On the electromagnetic fields produced by marine frequency domain controlled sources. Geophys. J. Int. 2009, 179, 1429–1457. [Google Scholar] [CrossRef][Green Version]
- Schultz, G.; Miller, J.; Shubitidze, F.; Evans, R. Underwater Controlled Source Electromagnetic Sensing: Locating and Characterizing Compact Seabed Targetsin Oceans. In Proceedings of the 2012 Oceans, Hampton Road, VA, USA, 14–19 October 2012. [Google Scholar][Green Version]
- Jiang, Y.; Yin, Z.; Song, Y. Low Probability of Intercept Radar Signal Detection Algorithm Based on Convolutional Neural Networks. J. Electron. Inf. Technol. 2022, 44, 718–725. [Google Scholar][Green Version]
- Liu, B.; Fan, X.; Zhang, Z.; Zhang, Y. Detection algorithm of BPSK signal based on adaptive scale change-bistable stochastic resonance model. Syst. Eng. Electron. 2022, 44, 2084–2095. [Google Scholar][Green Version]
- Ma, S.; Wang, H.; Shen, X.; He, K.; Dong, H. Detection Method of VLF Acoustic Signal in Complex Marine Environmental Noise. Acta Armamentarii 2020, 41, 2495–2503. [Google Scholar][Green Version]
- Zhou, Q.; Qu, C.; Zhang, B. Signal Detection and Estimation; Publishing House of Electronics Industry: Beijing, China, 2021; pp. 54–67. [Google Scholar][Green Version]
- Zhang, H. The Research of Underwater Cooperative Target Signal Detection and Parameter Estimation. Master’s Thesis, Harbin Engineering University, Harbin, China, 2022. [Google Scholar][Green Version]
- Yan, L.; Hao, C.; Yin, C.; Sun, W.; Hou, C. Modified generalized likelihood ratio test detection based on a symmetrically spaced linear array in partially homogeneous environments. J. Radars 2021, 10, 443–453. [Google Scholar][Green Version]
- Zhou, S.; Zhou, Y.; Zhang, C.; Xing, W. ResNet enable joint channel estimation and signal detection for OTFS. J. Xidian Univ. 2023, 50, 19–30. [Google Scholar][Green Version]
- Kong, D.; Sun, C.; Li, M.; Zhuo, J.; Liu, X. Dimension-reduced generalized likelihood ratio detection based on sampling of normal modes in deep ocean. Acta Phys. Sin. 2019, 68, 174301. [Google Scholar] [CrossRef]
- Ye, T. Research on Signal Detection Technology Under Low SNR. Master’s Thesis, Xidian University, Xi’an, China, 2019. [Google Scholar]
- Luo, P.; Zhang, W.; Liu, Z.; Zhao, Y. Fundamentals of Statistical Signal Processing-Estimation and Detection Theory; Publishing House of Electronics Industry: Beijing, China, 2022. [Google Scholar]
- Zhang, Y. Research on Multi-Carrier Signal Detection Method. Master’s Thesis, University of Electronic Science and Technology of China, Chengdu, China, 2021. [Google Scholar]
- Zuo, T.; Wang, F.; Zhang, J.; Li, R. Space Shift Keying Signal Detection Approach Based on Compressed Sensing in Indoor VLC System. Acta Electron. Sin. 2022, 50, 36–44. [Google Scholar]
- GB/T 4087-2009; Statistical Processing and Interpretation of Data—One-Sided Confidence Lower Limit of Reliability for Binomial Distribution. China Standards Press: Beijing, China, 2009.
Disclaimer/Publisher’s Note: The statements, opinions and data contained in all publications are solely those of the individual author(s) and contributor(s) and not of MDPI and/or the editor(s). MDPI and/or the editor(s) disclaim responsibility for any injury to people or property resulting from any ideas, methods, instructions or products referred to in the content. |
© 2025 by the authors. Licensee MDPI, Basel, Switzerland. This article is an open access article distributed under the terms and conditions of the Creative Commons Attribution (CC BY) license (https://creativecommons.org/licenses/by/4.0/).