Abstract
The structural integrity of transmission towers, as the backbone of power grids, is critical to overall grid safety, relying heavily on the reliability of bolted connections. Dynamic loads such as wind-induced vibrations can cause bolt loosening, potentially leading to structural deformation, cascading failures, and large-scale blackouts. Traditional manual inspection methods are inefficient, subjective, and hazardous. Existing automated approaches are often limited by environmental noise sensitivity, high computational complexity, sensor placement dependency, or the need for extensive labeled data. To address these challenges, this paper proposes a portable acoustic detection system based on Variational Mode Decomposition (VMD) and an Adversarial Multilayer Perceptual Network (AT-MLP). The VMD method effectively processes non-stationary and nonlinear acoustic signals to suppress noise and extract robust time–frequency features. The AT-MLP model then performs state identification, incorporating adversarial training to mitigate distribution discrepancies between training and testing data, thereby significantly improving generalization and noise robustness. Comparison results and analysis demonstrate that the proposed VMD and AT-MLP framework effectively mitigates structural variability and environmental interference, providing a reliable solution for bolt loosening detection. The proposed method bridges structural mechanics, acoustic signal processing, and lightweight intelligence, offering a scalable solution for condition assessment and risk-aware maintenance of transmission towers.
1. Introduction
Power transmission towers, serving as the “backbone” of the power grid, have structural integrity that is crucial for grid security, economic efficiency, and social stability. The structural integrity of these towers fundamentally depends on the reliability of their bolted connections, which are critical in lattice steel structures [1]. The loosening of bolts in critical areas due to dynamic loads like wind-induced vibrations and ice accretion [2] can alter stress distribution in the transmission tower structure. This can lead to structural deformation and potentially trigger cascading failures, resulting in large-scale power outages. Prolonged exposure to strong winds from typhoons in coastal regions, leading to the fatigue loosening of transmission towers, is a typical case of bolt loosening caused by lateral loads [3]. Post-incident investigations often reveal that broken or missing bolts were present at the initial point of collapse. To achieve intelligent inspection, reduce the intensity and frequency of manual patrols, and improve overall inspection efficiency, there is an urgent need to develop a portable device for the localized detection of bolt loosening on transmission towers [4].
Conventional methods for inspecting transmission towers still primarily rely on manual patrols. These methods require inspectors to observe bolts and connection points directly using binoculars or climbing the towers, or using an inspection hammer to tap into components [5]. While these methods are straightforward, they have significant limitations, including low efficiency, high subjectivity, and substantial risk. Multiple interacting factors ultimately lead to a reduction in bolt preload and subsequent loosening. The consequence of this is a decrease in both the normal contact force and tangential friction force at the fastener’s interface, which, in turn, reduces the normal contact stiffness and rotational stiffness of the joint. This reduction in contact stiffness inevitably affects the overall dynamic characteristics of the transmission tower. This subject has been extensively investigated by numerous scholars both domestically and internationally.
In recent years, the scientific community has proposed two distinct diagnostic paradigms for the problem of bolt loosening detection: physics-based mechanistic methods and data-driven intelligent systems [6]. In a comprehensive review, Chelimilla et al. [7] summarized structural health monitoring methods for detecting bolt loosening. This paper covers traditional techniques such as modal analysis, wave propagation, and tapping methods, as well as machine learning algorithms like neural networks and decision trees, and the application of the Internet of Things (IoT) in structural monitoring. For each method, the authors analyze its underlying principles, advantages, disadvantages, and application examples, and also discuss future research directions. Research has shown that physical-based solutions have significant limitations in practical applications, including insufficient environmental adaptability to temperature fluctuations and noise [8], difficulty in applying them to multi-bolt systems, and sensitivity to the uncertainties in axial force control [9]. To address this, it is necessary to develop a detection device for the loosening of transmission tower bolts. This device must possess a profound understanding of mechanical principles while also ensuring practical applicability in complex operational environments.
In contrast, data-driven methods have emerged as a promising alternative, leveraging advances in machine learning and sensor technology to address complex scenarios. In their study, Wang et al. [10] proposed a time–frequency feature extraction method based on Short-Time Fourier Transform (STFT). By combining STFT with image processing techniques, they were able to identify loosening states. This method exhibits a strong anti-noise capability and is suitable for early loosening monitoring, but its high computational complexity compromises real-time performance. Hou et al. [11] proposed a bolt loosening identification method based on acoustic signal analysis, genetic algorithm-optimized support vector machine (GA-SVM), and recursive feature elimination (RFE). This method utilizes wavelet packet energy spectrum analysis to detect complete loosening through abrupt changes in frequency band energy. It offers high sensitivity and a simple, clear energy ratio threshold setting, but it is sensitive to the placement of sensors. Sui et al. [12] proposed a method based on SH-type-guided waves, utilizing a small number of magnetostrictive transducers to detect and locate bolt loosening in multi-bolted connections. They incorporated noise-injection learning during the training process to improve the localization accuracy of bolt loosening. Zhao et al. [13] investigated the influence of bolt pre-loading on tower modal parameters and found that the shift in natural frequency could serve as a loosening indicator. While suitable for overall structural monitoring, this method has low sensitivity and requires high-frequency excitation. From a nonlinear dynamic perspective, Yang et al. [14] analyzed the subharmonic and chaotic characteristics of bolt loosening. This method provides a deeper understanding of the loosening dynamics mechanism, but it requires further adaptation to the actual working conditions of transmission towers. Zhao et al. [15] decomposed the transmission tower vibration response into low-frequency signals (2–25 Hz) and high-frequency signals (25–75 Hz). They processed these signals using adaptive Chirp mode decomposition and singular value decomposition to remove signal outliers caused by pulse excitation and employed the wavelet packet transform to eliminate forced vibrations. They then proposed a fault diagnosis model based on Timesnet and Transformer. Dong-Yoon Kim et al. [16] proposed a detection method based on Variational Mode Decomposition (VMD). This method uses VMD to decompose the transverse vibration mode into Intrinsic Mode Functions (IMFs), thereby selectively extracting signals with the desired mode. The NT method is then applied to the extracted signals for scaling and shifting, converting them into a form that is easy for approximate classification. Chen et al. [17] proposed a smart detection method based on a multi-scale one-dimensional convolutional neural network. This method automatically learns deep features from vibration signals by constructing a multi-scale feature extraction network, achieving end-to-end bolt loosening diagnosis. However, it requires a large amount of labeled data for training, which presents a data acquisition challenge in practical engineering applications. The effectiveness of tapping-based acoustic methods is diminished by noise interference. Existing solutions are difficult to scale to a full-range tower system, and the variability in striking force and structural dynamics in practical applications has not been addressed. It is noteworthy that experimental analyses of staggered double-bolted connections [18] and adjustable foundation bolts [19] have revealed the current framework’s inadequacy in simulating complex multi-bolt interactions, further highlighting the necessity for a system-level solution. Furthermore, the fusion of multi-modal data, such as acoustic signals, vibration data, and visual information, presents a promising avenue for future research.
There is a current research gap regarding on-site noise and wind speed on detection signals, which compromises real-time analysis, judgment, and decision-making in the field. Furthermore, existing stationary online monitoring systems are prohibitively expensive and lack flexibility. To address these challenges, this paper presents an acoustic detection method for bolt loosening based on VMD and adversarial multilayer perceptual networks (AT-MLP) after conducting analysis on a finite element model. An adversarial module is integrated into the portable bolt loosening detection device, enabling rapid on-site inspection with exceptional flexibility and broad coverage, thereby offering new possibilities for intelligent inspection.
The main contributions of the paper can be summarized as follows:
- Finite Element Modeling and Excitation Modal Analysis: Through finite element modeling, a parametric digital model of the bolted connection structure was developed. An in-depth analysis was conducted on the mechanism behind anomalous sounds generated by bolt loosening. Excitation was applied at the base of the transmission tower to optimize detection strategies, resulting in enhanced system performance.
- VMD and AT-MLP-Based Loosening Detection Framework: The proposed model integrates advanced signal processing techniques with robust nonlinear pattern recognition capabilities, demonstrating superior performance in both detection accuracy and practical applicability compared to existing machine learning and physics-based methods, with an achieved accuracy of 93.4%.
- Portable Device Design and Testing Protocol: Developing a comprehensive portable device for bolt loosening detection, which enables rapid and accurate on-site identification and analysis of bolt loosening while providing visual representation and analytical processing of the detection results.
The remainder of this paper is organized as follows: Section 2 elucidates the theoretical foundations of bolt loosening modeling and acoustic feature analysis. Section 3 provides a detailed explanation of the machine learning-based framework designed for bolt loosening detection. Section 4 describes the experimental setup and data acquisition process. Section 5 discusses experimental results and performance evaluation. Finally, Section 6 summarizes the paper and outlines directions for future research.
2. Finite-Element Modeling of Bolt Loosening and Acoustic Feature Analysis
Bolt loosening in transmission towers adversely affects structural stability under dynamic loads (e.g., lightning strikes, ice accretion, wind, vibrations). This section establishes a model to quantify the loosening mechanism, thereby creating a physical and analytical foundation for bolt loosening detection through acoustic feature analysis.
To clarify the bolt connection states underlying finite element (FE) modeling and experimental validation, this study defines them based on torque-based engineering criteria—consistent with GB/T 3098.1-2010 (Mechanical Properties of Fasteners [20]) and the 10.9-grade high-strength bolts used in field tests: A bolt is considered “fully tightened” when the applied assembly torque reaches a preset upper limit (typically 70% of the torque corresponding to the bolt material’s yield strength) and no further displacement (e.g., nut rotation) occurs. Conversely, a “loose” state is identified if displacement is observed before the torque attains this specified upper limit.
2.1. FE-Based Modal Sensitivity to Bolt Loosening
For a structural vibration system, dynamic feature sensitivity can be defined as the rate of change in structural characteristic parameters (eigenvalues and eigenvectors ) with respect to structural parameters (mass, stiffness, and damping) or other design variables, represented by pm as shown in Table 1 and Table 2. This concept is specifically referred to as eigenvalue sensitivity () and eigenvector sensitivity (), collectively known as feature sensitivity.

Table 1.
Eigenvalue sensitivity.
Table 2.
Eigenvector sensitivity.
Table 3.
Eigenvalue sensitivity of an undamped real-mode system.
Table 4.
Eigenvector sensitivity of an undamped real-mode system.
This paper focuses on undamped real modal systems. Under such conditions, the sensitivity of eigenvalues (which are related to modal frequencies) to variations in stiffness can be expressed as
where ωr is the r-th mode frequency and kij is the stiffness coefficient of the spring connecting masses mi and mj. This coefficient physically represents the force required to overcome a unit relative displacement between the two masses. When i = j, the physical interpretation is the force required to displace mass mii by a unit distance. Where φir and φjr are the mode shape coefficients for masses mi and mj, respectively, in the r-th mode.
Equation (1) shows that the sensitivity of the r-th modal frequency to stiffness kij is directly proportional to the mode shape coefficients φir and φjr, and inversely proportional to the modal frequency ωr.
The loosening of bolts at the antinode positions of a transmission tower’s lower-order modes (e.g., first and second bending modes and torsional mode), which leads to a decrease in contact stiffness kij, will result in a significant reduction in the corresponding modal frequency ωr. Given that the antinodes of the lower-order bending modes of a transmission tower are typically located at the tower head, bolt loosening in this region will cause a noticeable decrease in the bending modal frequencies. For higher-order modes, if the frequency ωr decreases significantly due to bolt loosening, it is highly probable that the loosened bolts are located at the position where the mode shape coefficient φir is maximized, i.e., at the antinode.
A relationship can be established between the change in stiffness at a fixed location and the squared change in the modal frequency . This relationship can be approximated as
This implies that there is an approximately linear relationship between the squared change in modal frequency and the change in stiffness , where the proportionality constant is related to the product of the mode shape coefficients. The relative magnitude of the change in each modal frequency, resulting from a reduction in local stiffness, is determined by the product of the mode shape coefficients at the loosened location for each mode.
Bolt loosening at a modal node has no impact on the modal frequency. In fact, since bolts at nodal locations remain stationary during modal vibration, their probability of loosening is also low. Conversely, bolts at antinodes are more susceptible to loosening. Once loosening begins at an antinode, it can progressively worsen until the bolt is completely disengaged. Therefore, by analyzing which modal frequencies are most sensitive to bolt loosening, the potential location of loosening can be inferentially determined.
To investigate the influence of bolt loosening on the dynamic characteristics of transmission towers, a geometric model of a 220 kV horn-shaped dry-type transmission tower was established, as shown in Figure 1.
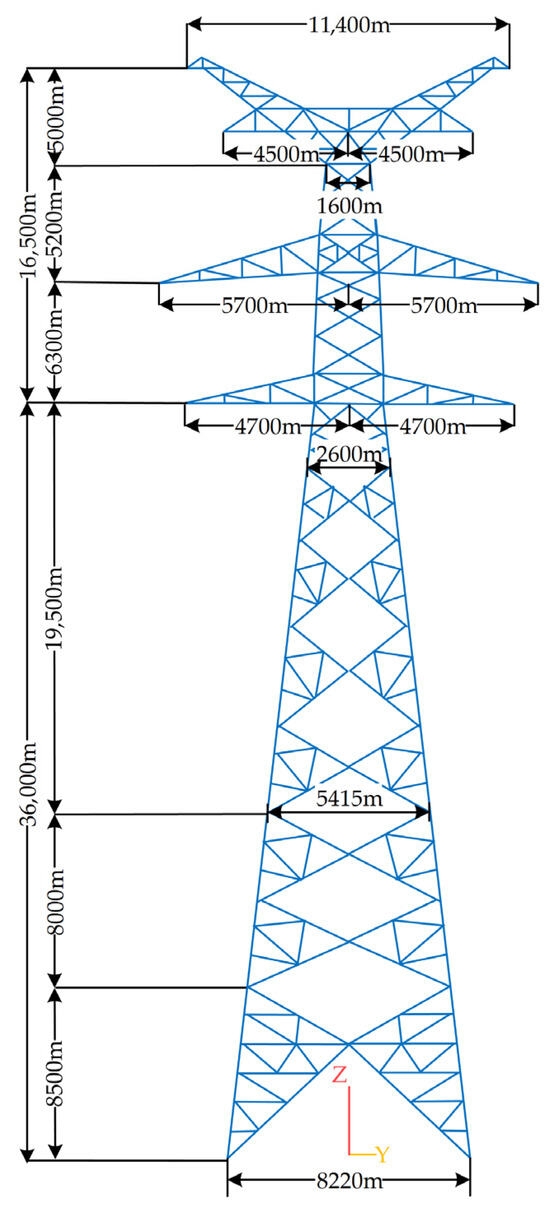
Figure 1.
Finite Element Model of a 220 kV Horn-Shaped Dry-Type Transmission Tower.
Using Beam188 elements, the geometric model of the transmission tower was discretized. Four different states of anchor bolt loosening were analyzed, and the corresponding models for these states are illustrated in Figure 2.
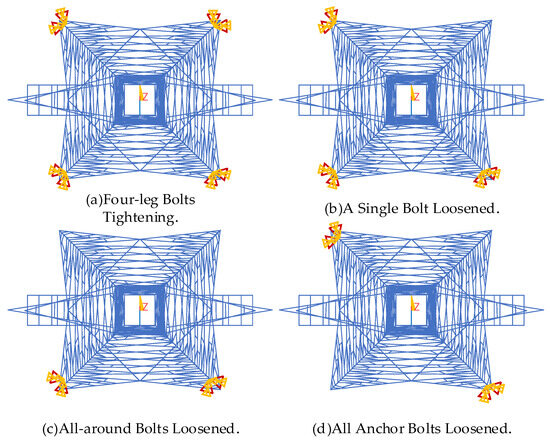
Figure 2.
Status of Tower Foundation Constraints.
The boundary conditions for the four different states are defined as follows:
- (a)
- Four-leg Bolts Tightening: This state fixes all six degrees of freedom (three translational and three rotational) for each of the four tower legs.
- (b)
- A Single Bolt Loosened: This state releases all degrees of freedom for one of the legs.
- (c)
- All-Around Bolts Loosened: This state releases all degrees of freedom for two adjacent legs, which are oriented perpendicular to the direction of the power lines.
- (d)
- All Anchor Bolts Loosened: This state releases all degrees of freedom for the two diagonally opposite legs.
The frequencies for the first 500 modes were calculated for each of these states and subsequently compared.
2.2. Acoustic Mechanism and VMD Feature Construction
During bolt loosening, the high-frequency components of the acoustic signal exhibit a sustained decay from approximately 0.1 s to 0.8 s. In contrast, for normally tightened bolts, these components decay more rapidly, from 0.1 s to approximately 0.4 s. The acoustic signature-based method for detecting bolt loosening should be aimed at identifying anomalous sounds generated by the resulting collisions between the fastened components, as well as between these components and the bolt head or nut.
In the study of acoustic time–frequency domain features, methods such as the STFT, Continuous Wavelet Transform (CWT), Hilbert-Huang Transform (HHT), and Mel spectrogram are employed for time–frequency analysis. Acoustic signals generated by bolt loosening are typically nonlinear and non-stationary and are often contaminated by strong background noise. Conventional Fourier transform methods are inadequate for effective processing of such signals. Therefore, this study employs Variational Mode Decomposition (VMD) for signal processing and feature extraction.
VMD is an adaptive, quasi-orthogonal signal decomposition method designed to decompose a complex, non-stationary signal into a set of IMFs, each with a specific center frequency and finite bandwidth. Unlike traditional Empirical Mode Decomposition (EMD), VMD does not rely on an iterative sifting process to find modes. Instead, it achieves signal decomposition by solving a variational optimization problem, with its core principle being the transformation of the signal decomposition task into a constrained optimization problem.
To intuitively demonstrate the processing effect of VMD on bolt loosening acoustic signals, Figure 3 presents the signal waveforms before and after VMD processing: (a) is the original signal before VMD time-domain processing, and (b) is the decomposed result after VMD frequency-domain processing.
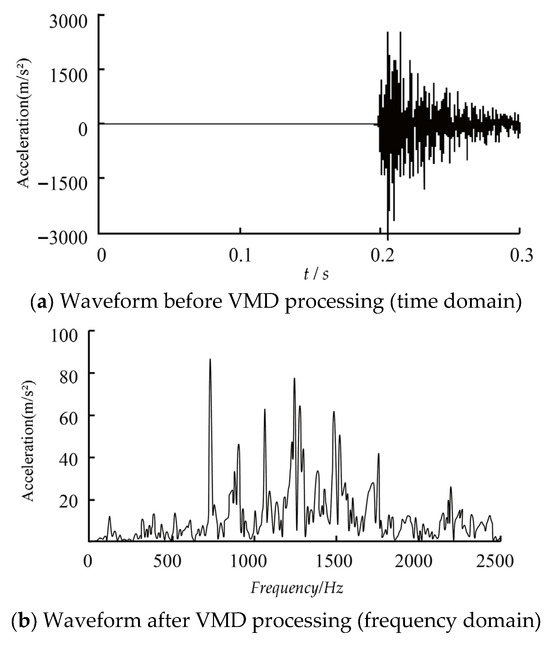
Figure 3.
Waveforms of Bolt Loosening Acoustic Signals Before and After VMD Processing.
VMD is robust against both Gaussian white noise and measurement noise, resulting in more stable decomposition outcomes. Furthermore, it effectively avoids the mode mixing problem common in EMD, where modes with different frequencies are entangled. Because acoustic signals are inherently non-stationary and nonlinear, VMD offers a powerful framework for decomposing them by formulating the task as a mathematical optimization problem that can be solved via an iterative algorithm.
For the VMD [21] of the acoustic signatures, a penalty factor of 2000 was selected, with a time-step parameter of 0 to ensure a strict constraint. A convergence tolerance of 10−6 was used. IMFs for the loosened bolts were all found to have frequencies below 5 kHz, with their center frequencies concentrated below 1 kHz, and the most effective frequency components being below 500 Hz.
2.3. FE-to-Experiment Guidelines for Excitation and Sensing
Based on comparative observations, the mode shapes of a transmission tower can be broadly classified into two types: global modes and local modes.
Global modes involve the entire tower vibrating, with very few nodal points. In this case, the tower’s vibration resembles a cantilever beam undergoing lateral bending deformation. Local modes are characterized by only a specific region of the tower vibrating, while the rest remains essentially stationary.
Generally, the vibration energy of global modes is significantly higher than that of local modes. Statistical analysis shows that the number of global modes is far fewer than that of local modes. Therefore, when bolt loosening causes a change in the system’s modal parameters, it is highly probable that the change corresponds to a local modal parameter.
Based on the location of the vibration, local mode shapes can be further classified into four types: lower section vibration (as shown in Figure 4), middle section vibration (as shown in Figure 5), upper section vibration (as shown in Figure 6), and mixed vibration (as shown in Figure 7). The tower modeling and data analysis were conducted in ANSYS 2024 R1.
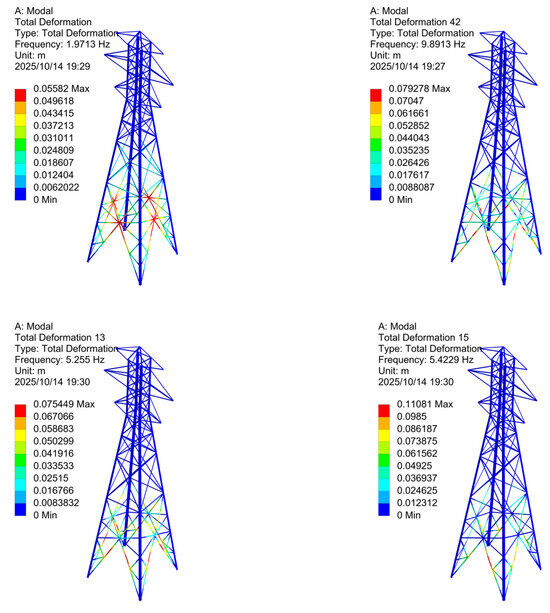
Figure 4.
Lower Section Vibration Mode Analysis.
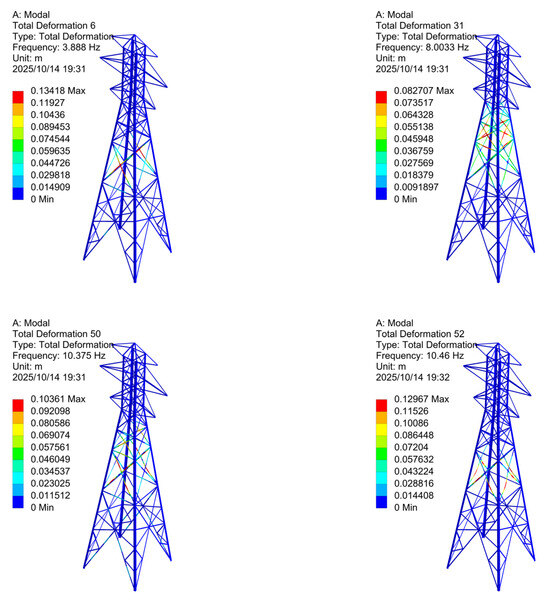
Figure 5.
Middle Section Vibration Mode Analysis.
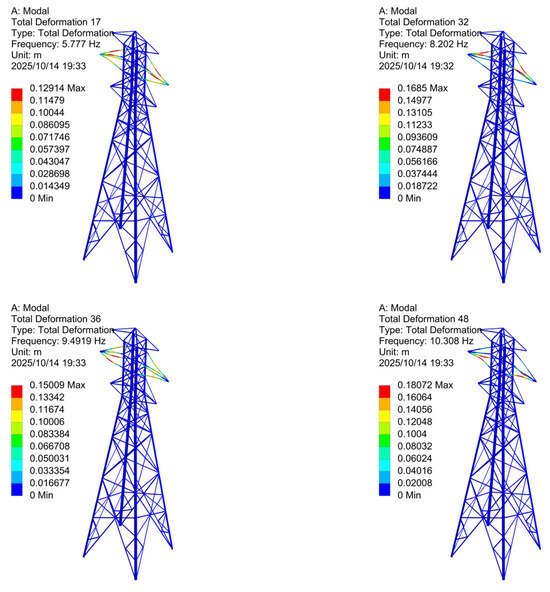
Figure 6.
Upper Section Vibration Mode Analysis.
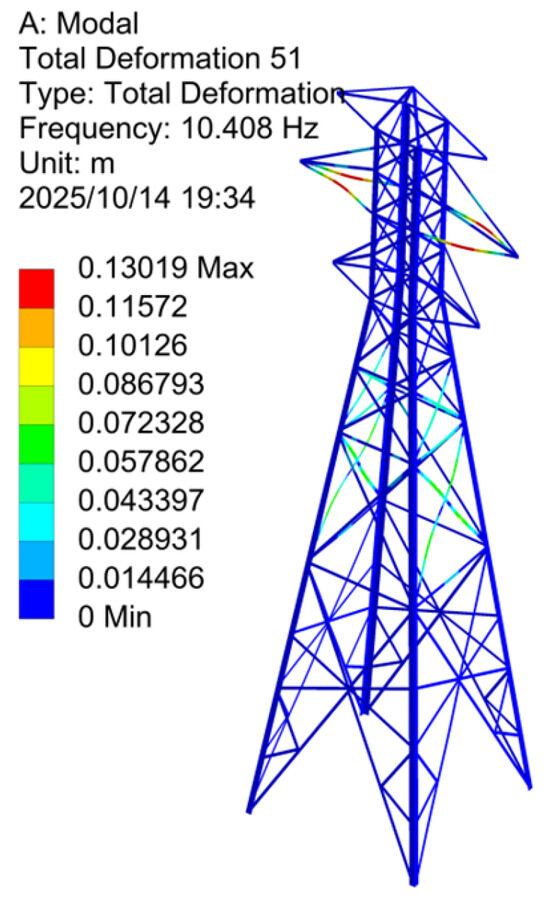
Figure 7.
Hybrid Vibration Mode Analysis.
Based on the principles of structural vibration, an excitation point must be located away from the nodal points of a mode shape to effectively excite that mode. Consequently, when striking the main and bracing members of the tower, it is theoretically possible to only excite the local modes associated with the lower section of the transmission tower. Given that the base of the tower often acts as a nodal point for the local modes of the middle and upper sections, these modes are theoretically unexcitable through an excitation at the base.
Based on simulation analysis, it can be inferred that when the main and bracing members at the tower base are excited, the resulting vibration response is primarily dominated by the local and global modes of the lower tower section. Consequently, if excitation is applied to the lower section of the transmission tower, bolt loosening in this region can be identified with a high probability. Conversely, detecting bolt loosening in the middle or upper sections poses significant challenges. Therefore, it is sufficient to excite the base of the tower during the experiment.
A variety of methods have been developed for detecting bolt loosening, notably those based on impedance [22], electrical conductivity [23], laser [24], and vibration measurement [25]. However, these methods have distinct limitations. The impedance-based method has a limited detection range and is sensitive to temperature, necessitating the deployment of numerous sensors for large-scale structures. The electrical conductivity-based method is susceptible to interference from surface conditions such as oxidation, oil contamination, and scratches on the bolts and connecting components. Furthermore, laser-based techniques are costly, and it is challenging to cover bolts located in concealed or heavily obstructed areas. To address these issues, this paper adopts an integrated acoustic-vibration approach. This method utilizes vibration signals as a baseline and integrates data from microphones and acoustic emission sensors. It is designed to overcome the shortcomings of traditional vibration analysis, namely its insensitivity to noise and incipient loosening. This approach has demonstrated a detection rate of up to 94% for early-stage loosening [26].
Furthermore, acoustic signature data is collected for both normal and abnormal bolt fastening states on 220 kV and 110 kV towers. Based on this data, two distinct databases were established: one for classifying the state of bolt loosening (i.e., normal vs. loosened) and another for differentiating the specific height of the loosened bolts.
Bolt loosening at different locations on the tower has a distinct effect on the natural frequencies. Anchor bolt loosening primarily affects the lower-order modal frequencies, whereas loosening of other bolts, such as those on the crossbeams, mainly influences the mid-order modal frequencies. The relative frequency shift caused by a completely loosened bolt is generally very small; however, the cumulative frequency shift may produce a perceptible audible difference.
3. VMD and ATMLP-Based Composite Framework for Loosening Detection
This section presents a method integrating VMD and AT-MLP for identifying the looseness of transmission tower bolts. The method collects acoustic signals of an iron tower bolt via an acoustic sensor, applies VMD to decompose the signals and extract features (e.g., the central frequency of the acoustic signal of a loose bolt), and inputs the time–frequency information as characteristic parameters into the AT-MLP model for bolt state identification.
3.1. VMD-Informed Time–Frequency Feature Extraction
When vibration excites loose bolts of the transmission tower, they generate sounds with characteristic vibration frequencies. However, sound reflections and refractions within the tower structure, coupled with complex environmental noise, make extracting these characteristic frequencies of loose bolts critical for bolt looseness detection. To address this challenge, we employ VMD. Based on adaptive signal decomposition, VMD processes nonlinear, non-stationary acoustic signals to generate a series of IMFs with sparse bandwidths—functions that capture the local features and dynamic variations in the signal. VMD minimizes the distance between the signal and IMFs to achieve signal decomposition, ultimately producing multiple modal components that represent localized characteristics across different frequencies and time scales.
In each iteration, VMD alternately minimizes the signal-IMF distance while satisfying specific constraints (Equation (3)), progressively refining the decomposition
where denotes the -th mode function at time ; is the central frequency of the -th mode; represents the Dirac function at time .
For each mode , by multiplying the modal signal by an exponential term , the frequency band of each mode can be shifted to baseband. This method concentrates modal energy in the frequency domain, enabling more effective bandwidth extraction. Meanwhile, to satisfy the reconstruction constraint (Equation (4)), a Lagrange multiplier is introduced and optimized via the Alternating Direction Method of Multipliers (ADMM). ADMM iteratively updates each mode function and center frequency until convergence.
where is the original signal.
In this study, we systematically investigate the impact of key VMD parameters—specifically the penalty factor (α) and the maximum number of iterations—on the quality of signal decomposition and the subsequent detection accuracy. This ensures that the VMD-extracted acoustic features, which serve as input for our AI model, are robust and accurately represent the underlying bolt conditions. Our methodology involves a parameter optimization experiment to identify the most effective combination of these settings, thereby guaranteeing the reliable extraction of informative acoustic features.
3.2. AT-MLP Architecture and Loss Functions
Multilayer perceptual (MLP), a foundational deep learning model, is a feedforward neural network widely applied to classification, regression, and feature extraction tasks. As illustrated in Figure 8, its architecture comprises an input layer, one or more hidden layers, and an output layer, with neurons in adjacent layers fully interconnected.
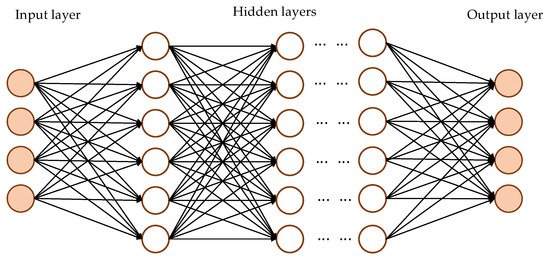
Figure 8.
MLP structure.
For any hidden layer , its output is calculated by applying an affine transformation and a nonlinear activation function to the output of the previous layer , given by
where and denote the weight matrix and bias vector of layer , respectively, and represents a nonlinear activation function.
The calculation of the output layer of MLP depends on the specific task: For classification tasks, the Softmax function is usually used to normalize the output probability distribution, which is
where denotes the total number of hidden layers, and represents the predicted class probability vector.
The goal of training the MLP is to minimize the loss function, which is defined as follows
where is the number of samples, is the number of classes, and denote the truth label and predicted probability of the -th sample in class , respectively.
The gradient of the loss function with respect to each parameter is calculated using the chain rule, and the parameters are updated through an optimization algorithm, which is as follows
where denotes the learning rate.
To enhance the robustness of the neural network model, the method AT is introduced. By introducing adversarial training during the training process, the data distribution differences between the training set and the test set can be eliminated, thereby enhancing the generalization ability of the detection model.
Let be the data input into the feature network and the model parameters. The objective of adversarial training is to minimize the total loss over both training and test samples, which is as follows
where is the input data of the model; is the corresponding true label of ; is the adversarial perturbation; is the upper limit of the perturbation; is the loss function; is the neural network model; is the joint probability distribution of the input data and the true label .
When the training and test distributions in the feature extraction network satisfy Equation (10), the model reaches its optimal state, meaning the divergence between the feature distributions of training and test sets is minimized. Through adversarial training, the model learns more robust feature representations, substantially reducing the impact of environmental disturbances on bolt state identification.
Following this process, we arrive at the AT-MLP model, depicted in Figure 9. It primarily consists of three components: A feature extraction network, a classifier, and a discriminator. As shown in the figure, the red dashed arrow represents the data flow during the testing phase, while the solid black arrows denote the data flow and the backpropagation of gradients during training.
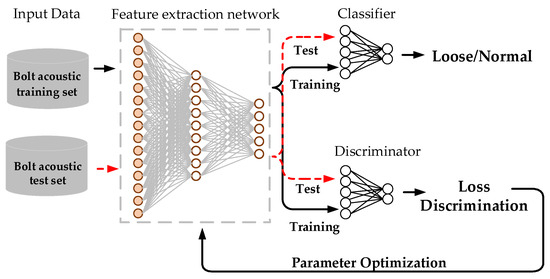
Figure 9.
AT-MLP structure.
To achieve the collaborative minimization of classification and adversarial losses while enhancing training stability and convergence efficiency, this study designed a systematic hyperparameter strategy for AT-MLP. The model employs the RMSprop optimizer, which adapts well to the gradient updates required for non-stationary acoustic features. A consistent batch size of 64 is used to balance training efficiency and memory usage, aligning with the dataset partitioning described in Section 5.2. Given the differing objectives of the classifier (aiming for accurate bolt state identification) and the discriminator (focused on assessing feature distribution differences), separate learning rates were assigned: 0.001 for the classifier and 0.0001 for the discriminator. The lower learning rate for the discriminator prevents it from advancing too rapidly during adversarial training, which could cause gradient oscillation in the classifier and lead to recognition rate degradation or model instability. The training stopping criterion is defined as “the fluctuation in training loss (weighted sum of cross-entropy classification loss and adversarial loss) remaining below 10−4 and the fluctuation in test accuracy below 0.5% over five consecutive epochs.” This ensures the model halts in a converged state, thereby avoiding overfitting.
The network architecture parameters of the AT-MLP model are shown in Table 5. The feature extraction component consists of a three-layer MLP structure with 1500, 800, and 500 neurons, respectively, each employing ReLu as the activation function. The discriminator uses a Sigmoid activation function to capture the probability distribution of the features from the feature extraction network. The classifier adopts a two-layer MLP with a SoftMax activation function to predict the state categories of the bolts.
Table 5.
Common frequency–domain statistical features of acoustic signals.
3.3. Composite Framework for Loosening Detection
Thus, a VMD and ATMLP-based composite framework for loosening detection is obtained. The specific experimental procedure of this composite framework for detecting bolt looseness is as follows.
During the experiment, the collected acoustic signals contained various components, including signatures of loose bolts and environmental noise. To separate the noise from the loose-bolt signals, the VMD method was first applied. This was followed by further solving for the central frequency and IMFs of the acoustic signals, thereby constructing a dataset of acoustic signatures for loose bolts.
Next, data preprocessing was performed: the acoustic signals were segmented into individual tap events using a 2 s window, and time–frequency energy features were computed. The dataset was then divided into a training set and a test set of bolt acoustic features.
The training set features were input into an MLP for feature extraction and classification training. The test set features were also processed by the MLP for feature extraction; both the training and test features were then fed into a discriminator for adversarial training. The model with the lowest combined classification loss and adversarial loss on the training set was selected and saved. Finally, this optimized AT-MLP model was applied to the test set to predict the condition of the bolts.
4. Portable Device Design and Field Test Protocol
This section provides a design for a portable acoustic signature-based device for bolt loosening detection. The proposed device is intended to enable real-time monitoring and early warning of bolt loosening on transmission towers through acoustic signature analysis. Additionally, the chapter outlines the sensor layout, data labeling methods, and provides a framework for the on-site testing protocol.
4.1. Portable Device Design
The system consists of two main components: a portable acoustic signature acquisition device and embedded visualization and analysis software. Its primary goal is to provide maintenance teams with accurate diagnostic information and decision support by quickly and efficiently identifying loosened bolts on transmission towers through acoustic signature analysis. This not only improves the efficiency of tower maintenance but also enhances the safety and reliability of the power transmission system, ensuring the continuity and stability of the electricity supply.
Based on the dynamic nature of bolt states on transmission towers and validated by functionality assessments during both theoretical and data acquisition phases, this study proposes a terminal device for acoustic signal processing. Composed of multiple acoustic sensors and a smart monitoring terminal, the device is designed for easy installation and deployment on towers, enabling data acquisition, processing, and analysis of target bolts.
Traditional data acquisition systems are often bulky and complex, failing to meet the demands of field and outdoor monitoring. To address this limitation, a portable, multi-channel data acquisition and analysis system has been developed, aiming to provide a high-precision, portable, and user-friendly solution.
Figure 10 shows a photograph of the developed portable acoustic detection device. The device integrates four key functionalities: high-precision data acquisition, secure data storage and management, data analysis and processing, and diagnostic reporting with decision support. These features ensure high-quality and highly accurate data collection in complex field environments while meeting the demands of various monitoring scenarios. The system thus provides a crucial basis for maintenance teams to formulate effective maintenance strategies for power towers.
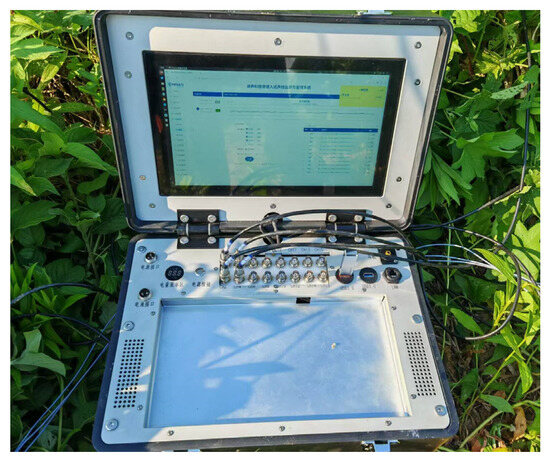
Figure 10.
Photograph of the developed portable acoustic detection device.
This portable device supports 16-channel synchronous acquisition with a maximum sampling rate of 96 kHz. It is equipped with a 24-bit high-resolution, low-noise analog-to-digital converter (ADC). Each channel provides a 4 mA constant current output, ensuring compatibility with a variety of sensors. The device weighs only 13.6 kg, making it highly portable. Constructed from high-strength materials with an IP31 ingress protection rating, it is adapted for various industrial environments. It also features a handle and latches for easy transport and secure fixation. The system includes an embedded web interface with a simple and intuitive user interface that supports touch-screen operation. It integrates data acquisition, processing, analysis, and storage functionalities and supports data export via USB, which simplifies data management and backup. Figure 11 shows the sensor setup on a transmission tower during field testing. A comprehensive listing of the portable acoustic detection device can be found in Table A1.
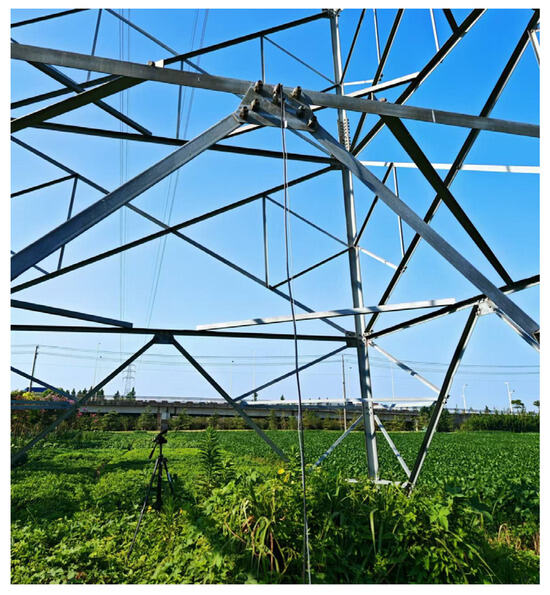
Figure 11.
Sensor setup on a transmission tower during field testing.
4.2. Excitation/Sensor Layout and Data Labeling
In the design of the device for this detection project, the system supports multiple data acquisition sessions and is capable of simultaneously collecting data from various measurement points and different types of sensors. This functionality enables comprehensive monitoring and analysis. This design not only improves the efficiency of data acquisition but also enhances the system’s flexibility and adaptability, allowing it to cope with a variety of complex monitoring scenarios.
In light of the unique structural form and height characteristics of transmission towers, the measurement process must balance operational safety with convenience. Based on the analysis results from the preceding finite element model, the tower base was identified as the optimal location for both excitation and data acquisition. For practical on-site testing, an impulse hammer was utilized to apply excitation, thereby ensuring the stability and reliability of the excitation system.
The impulse hammer was equipped with a force sensor featuring a range of 30 kN and a sensitivity of 0.167 mV/N, which is sufficient for inducing localized structural vibrations. To accurately capture the acoustic response, the measurement system utilized high-precision acoustic sensors with a frequency response ranging from 20 to 20,000 Hz and a sensitivity of 50 mV/Pa. As shown in Figure 12, four acoustic sensors were symmetrically mounted on the four corner angle steels of the tower. Their installation height was uniformly set according to standardized spacing. To ensure system stability and repeatability, the sensors were affixed to the steel surface using magnetic mounts, which provide sufficient adhesion force while also facilitating rapid field adjustments. A laser level was used during installation to ensure all sensors were horizontally aligned, with the installation position error controlled to within 1 mm. This specific sensor arrangement effectively suppressed sensor displacement caused by wind-induced vibrations or mechanical disturbances, thereby preventing corresponding data inaccuracies.
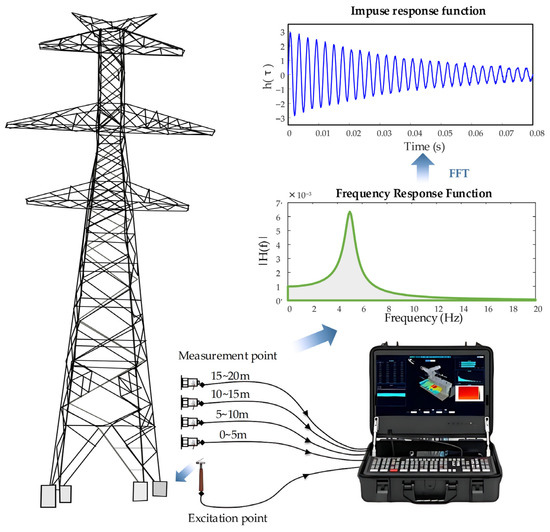
Figure 12.
Schematic of experimental setup for bolt loosening detection.
In order to acquire a dataset reflecting the state of bolt loosening at different heights on a transmission tower, a controlled experimental procedure was adopted. This involved manually adjusting bolt tightness at various heights while applying systematic excitation with an impulse hammer at the tower’s base. The loosening and tightening of the bolts were repeatedly performed, and the corresponding data was meticulously labeled.
The data acquisition process was constrained by practical limitations, including a height restriction of 0–20 m imposed by safety regulations, and a limited number of loosened samples within certain height intervals (e.g., 5–10 m and 10–15 m). The experimental subject was a 36 m high transmission tower, with the testing covering a height range of 20 m. This interval was uniformly partitioned into four distinct segments: 0–5 m (base section), 5–10 m (body Section 1), 10–15 m (body Section 2), and 15–20 m (body Section 3). This systematic data acquisition and labeling strategy provides a reliable foundation for subsequent machine learning-based research on bolt loosening identification.
For the loose bolt voiceprint data, the total volume reaches 3639 pieces, including 2606 pieces of training set data with various loose height labels, 533 pieces of test set data with various loose height labels, and 500 pieces of loose sample voiceprint data specifically used for model validation.
4.3. Field Test Protocol
To evaluate the performance of our proposed method, an experimental analysis was conducted using a dataset that includes bolt loosening conditions at different heights. This dataset was constructed based on on-site acoustic tests of 110 kV and 220 kV transmission towers. For each impact event, a 25 s acoustic signal was acquired at a sampling rate of 60 kHz. These signals were then segmented into multiple 2 s clips for subsequent analysis. The data spans four distinct height ranges and comprises a total of 16 bolt state combinations, including a normally tightened state and 15 different loosening conditions. The overall workflow of the on-site testing is illustrated in Figure 13.
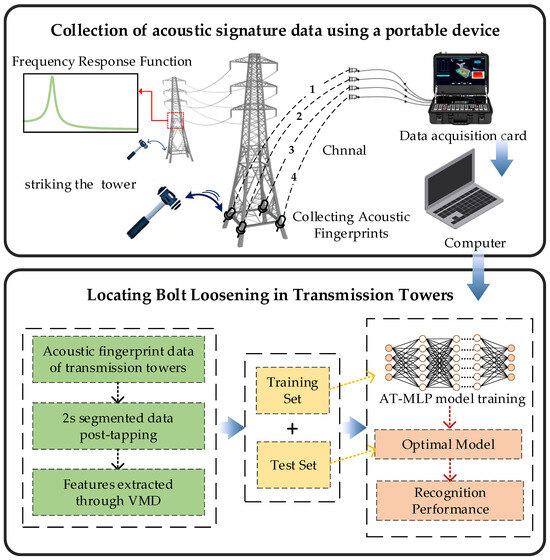
Figure 13.
Identification of loose transmission tower bolts.
During the on-site testing process, the tower base was subjected to excitation. The corresponding acoustic signature signals were then captured by sensors and transmitted from the portable field device to a computer terminal for processing. The signals’ input features were extracted using VMD and subsequently fed into the AT-MLP model to obtain the final prediction results. This process determines both the presence of a loosened bolt and its corresponding location.
5. Results and Discussion
5.1. Evaluation Metrics
To comprehensively evaluate the performance of the proposed VMD-AT-MLP composite framework in identifying bolt loosening states, a set of widely adopted metrics for classification tasks was employed. These metrics include Accuracy, Precision, Recall, and F1Score, all derived from Classification model prediction results: True Positives (TP), True Negatives (TN), False Positives (FP), and False Negatives (FN).
- Accuracy
The proportion of correctly classified samples out of the total number of samples. Although it is simple to compute and intuitive, it can be misleading under class imbalance, as it does not reflect the performance of minority classes. The calculation formula is as follows:
- 2.
- Precision
The proportion of samples predicted as positive is actually positive. This helps reduce false positives and is useful in high-stakes false alarm scenarios, but may overlook the model’s ability to recall all positive samples when used alone. The calculation formula is as follows:
- 3.
- Recall
The proportion of actual positive samples that are correctly identified as positive. It improves the detection of positive samples and suits high-cost missed detection cases, though it may increase false positives and lower precision. The calculation formula is as follows:
- 4.
- F1-Score
The F1-Score, calculated as the harmonic mean of precision and recall, provides a balanced evaluation by integrating both metrics. The calculation formula is as follows:
In addition to the objective evaluation metrics mentioned above, this study also employs a confusion matrix to enable intuitive graphical analysis of the recognition results. A confusion matrix is used to visualize the performance of a classification model on the test set. It is generally presented in tabular form. For binary classification problems, the confusion matrix is typically a 2 × 2 matrix.
For multiclass classification problems, it is extended to an n × n matrix, where n is the number of classes. Each cell in the matrix represents the number of instances with true label i predicted as label j. As shown in Table 6, the number of misclassified instances in the confusion matrix helps identify weaknesses in the model, facilitating further optimization. Moreover, metrics such as accuracy, precision, recall, and F1-score can be derived from the confusion matrix to comprehensively evaluate model performance.
Table 6.
Binary Confusion Matrix.
Additionally, to ensure a robust evaluation of model performance, we adopted k-fold cross-validation. A five-fold configuration (k = 5) was selected as it offers an optimal balance between computational efficiency and evaluation reliability for datasets of this nature. The data was partitioned using a rolling time-window approach, which preserves temporal sequence and mitigates the risk of data leakage. This design closely simulates real-world forecasting conditions.
5.2. Results and Analysis
This experiment selected 110 kV and 220 kV transmission towers and introduced loosening in bolts across different areas. Acoustic data from the loosened bolts were then collected. The data were segmented into 2 s intervals, each representing a single tap event, and split into training and test sets. The sizes of the training datasets and test datasets are shown in Table 7.
Table 7.
Sizes of the training sets and test sets.
In these datasets, each acoustic sample is labeled with both the bolt’s loosening status and its specific location. Successful identification required accurately determining whether the bolt was loose and its location; failure in either aspect was considered an incorrect result. The AT-MLP model was trained with a batch size of 64 and a learning rate of 0.001.
To investigate the influence of VMD parameters on decomposition quality and subsequent recognition performance, a parameter optimization experiment was conducted. The experiment used five values for the penalty factor (α): 500, 1000, 2000, and 5000, with VMD running under three different maximum iteration counts: 200, 100, and 200. For each parameter combination, decomposition was repeated 10 times on the same input samples to estimate stability. The mean values of multiple metrics—including central frequency stability (CF-STD), modal mixing degree (Modal-Mix), and the number of meaningful modes (Modes, with a central frequency < 1 kHz and an effective frequency < 500 Hz)—were used as evaluation indicators. This parameter experiment was performed to obtain optimal settings for achieving more accurate acoustic signature modes.
The parameter sensitivity analysis presented in Table 8 shows that when α increases from 1000 to 2000 and the number of iterations reaches 500 to 1000, the central frequency stability improves significantly (CF-STD decreases from 1.4 Hz to 0.61 Hz), and the modal aliasing index decreases markedly (the average cross-correlation drops from 0.38 to 0.21). Within this parameter range, the modes of the loose bolt are primarily concentrated below 1 kHz, which aligns with the physical characteristics of bolt vibration. Therefore, α = 2000 and an iteration count of 1000 were selected as the experimental parameters.
Table 8.
Comparative Analysis of VMD Parameters.
To evaluate the effectiveness of the proposed method, cross-validation was employed. A subset of data was randomly selected from the training dataset for model training, while the remaining data were used to validate the trained model. Figure 12 shows the resulting confusion matrix.
As illustrated in Figure 14, the correct recognition rates for loosened bolts in the 110 kV and 220 kV towers reached 88% and 80%, respectively, while the recognition rates for normal bolts were 100% and 98%. These results indicate that the method largely meets practical requirements for bolt loosening detection in transmission towers.
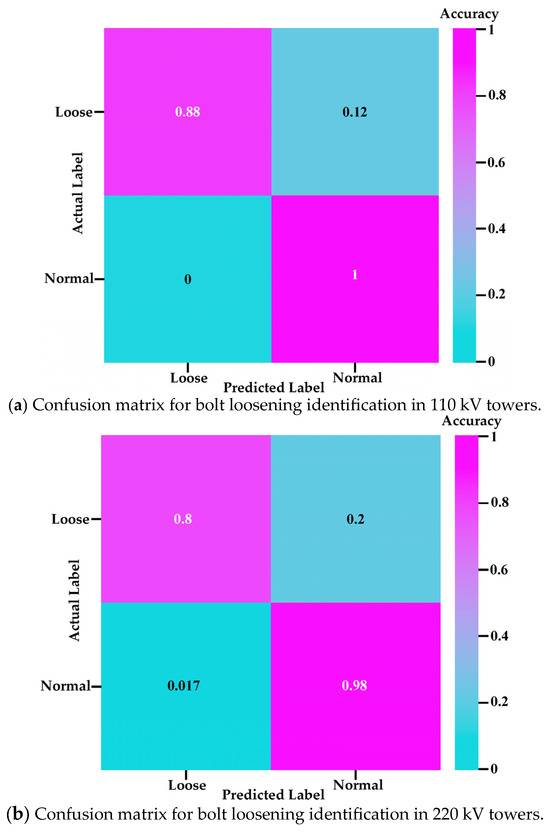
Figure 14.
Identification result of tower bolt looseness.
The performance difference between the 110 kV and 220 kV towers primarily stems from three factors related to their structural and environmental distinctions: First, excitation efficiency differs due to structural characteristics. The 220 kV towers, being taller and equipped with longer, heavier insulator chains [27], exhibit more complex dynamic behavior and greater susceptibility to wind-induced vibrations [28]. This results in less efficient energy transfer to bolted joints under identical excitation compared to the more compact and rigid 110 kV structures. Second, acoustic attenuation is more significant in the 220 kV towers. The larger dimensions entail longer and more complex sound transmission paths from the source to the sensor. As vibrational energy decays over distance due to reflections and refractions [29], signals from 220 kV bolts arrive considerably weakened, complicating feature extraction. Third, environmental interference is stronger for 220 kV towers. Their increased height exposes them to higher wind loads, which induce structural vibrations that generate broadband noise. This elevates the noise floor and degrades the signal-to-noise ratio [30], masking subtle acoustic signatures of loosening. The shorter 110 kV towers experience comparatively less such interference. In summary, the combined effects of reduced excitation efficiency, greater acoustic attenuation, and stronger environmental noise contribute to the higher recognition accuracy observed for 110 kV towers.
Despite the performance variance caused by structural differences, acoustic propagation paths, and environmental interference between the 110 kV and 220 kV towers, the proposed model maintains a recognition accuracy of over 80% across both tower types. This robust performance can be attributed to two key design elements of our framework: first, the VMD algorithm’s capability for robust decomposition of non-stationary acoustic signals, which effectively separates the bolt-loosening signatures from the structural reflection/refraction noise prevalent across different tower types; second, the adversarial training module in AT-MLP, which helps reduce the distribution shift in data features caused by structural disparities, thereby enhancing feature generalization.
Based on this demonstrated cross-type robustness, we can reasonably infer that the model could be adapted to towers of higher voltage levels (e.g., 330 kV or 500 kV), which share similar structural logic but differ mainly in dimensional scale and stiffness. With minor fine-tuning and under consistent data acquisition protocols and torque standards, the model is expected to maintain a bolt-loosening identification accuracy above 75%.
5.3. Comparison of Overall Model Performance
To further evaluate the detection performance of the composite framework for loosening detection, a comparison was conducted among AT-MLP, the standard MLP (without the adversarial training), Support Vector Machines (SVM), and the widely adopted Convolutional Neural Network (CNN) in terms of accuracy. As shown in Table 9, which presents the average recognition accuracy under 10-fold cross-validation, the AT-MLP model achieved the highest diagnostic accuracy, outperforming the standard MLP by 4.7 percentage points.
Table 9.
Accuracy Comparison (Unit: %).
To ensure a fair and reproducible evaluation of all comparative models, we detail the architectural and training parameters for the CNN, baseline MLP, and AT-MLP. All models use the dataset split defined in Table 7 and take VMD-extracted time–frequency features as input. While they differ in network architecture and training strategies, core hyperparameters remain consistent to isolate the impact of structural variations on performance. The MLP and AT-MLP structures follow those described in Section 3.2. Beyond accuracy, computational efficiency is critical for on-site deployment. We evaluated the VMD-AT-MLP framework on the embedded system of our portable device. The end-to-end processing time per sample—covering VMD feature extraction and AT-MLP inference—ranged from 3 to 5 s. Further analysis revealed that AT-MLP introduces only a ~5% increase in parameters and a 20% rise in training time compared to the standard MLP, while inference latency remains low at 0.8–1.2 s per sample. These results confirm that the adversarial training overhead is confined mainly to the training phase, and the system maintains high efficiency during deployment, proving its suitability for real-time field diagnosis.
The CNN employs a 6-layer structure: the first layer is the input layer, with dimensions matching the VMD-extracted features; the 2nd to 5th layers are convolutional layers, with 128, 64, 32, and 16 filters, respectively. Each convolutional layer uses a kernel size of 3, a stride of 1, and ReLU activation. The 6th and 7th layers are fully connected layers: the first contains 512 neurons with ReLU activation, and the second contains 2 neurons with SoftMax activation for classification output. The model is trained using the RMSprop optimizer with a learning rate of 0.001, over 50 epochs, with a batch size of 64, and without adversarial training.
The training parameters for all models, including the MLP and AT-MLP, are consistent: a learning rate of 0.001, 50 epochs, and a batch size of 64. No adversarial training is applied to the CNN or MLP, while it is introduced in the AT-MLP to mitigate distribution shifts between training and test data.
This study employed a t-test to statistically compare the classification accuracy between the proposed model and the baseline methods. The detailed results are presented in Table 10.
Table 10.
t-Test Results of Comparative Models.
As shown in Table 10, the proposed AT-MLP model achieves the best performance in the acoustic recognition task of loose bolts on transmission towers, with a mean accuracy of 93.40%, which is significantly higher than those of traditional machine learning models: MLP and SVM (all p-values < 0.001). This indicates that the adversarial training module can, to some extent, mitigate the interference caused by different tower structures and environmental noise on the acoustic data distribution, thereby significantly improving both recognition accuracy and model robustness. Although a significant difference in accuracy is also observed between CNN and AT-MLP (p < 0.001), AT-MLP achieves higher performance. This can be attributed to the fact that CNN excels at capturing local time–frequency abrupt features in the acoustic data, whereas AT-MLP enhances the global representation of bolt-related characteristics.
Figure 15 demonstrates the consistently superior cross-validation accuracy of AT-MLP compared to the other models. Under this unified training configuration, the performance comparison in Table 8 is highly reliable: the CNN extracts spatial features via convolutional layers, but due to the absence of adversarial training, it exhibits limited robustness against environmental noise and structural variations. In contrast, the AT-MLP achieves the highest accuracy of 93.4%, benefiting from adversarial training—a conclusion further supported by subsequent PCA-based feature distribution analysis in Figure 16.
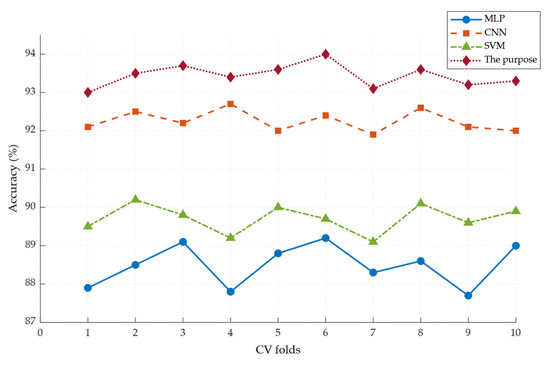
Figure 15.
Cross-Validation Accuracy of the Four Models.
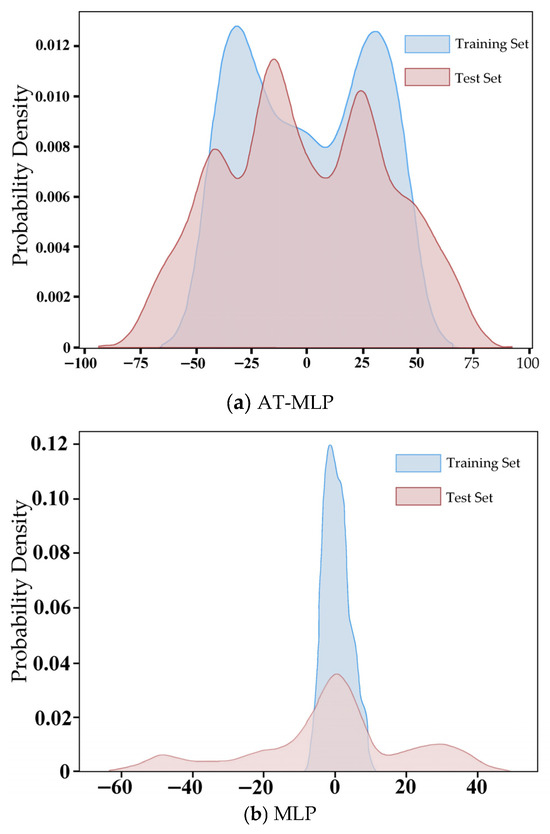
Figure 16.
AT-MLP and MLP results of the 220 kV tower.
This study employed Principal Component Analysis (PCA) to reduce the dimensionality of the feature data output by the feature extraction network. The probability density distributions of both the training and test sets were then estimated to illustrate the capability of adversarial training in mitigating interference factors. As visualized in Figure 16 for the 220 kV tower bolt dataset, the feature distributions of the test set and training set exhibit greater similarity after adversarial training. In contrast, the feature distribution generated by the standard MLP without adversarial training showed significant discrepancies.
This explains why the average bolt recognition accuracy of the MLP is lower than that of the AT-MLP. Specifically, AT-MLP exhibits superior robustness to data acquisition noise compared to CNN and SVM models.
6. Conclusions
This paper presents a novel acoustic detection methodology for bolt loosening in transmission towers, combining VMD-based feature extraction with an adversarial MLP framework to improve robustness against structural and environmental variability. Experimental results demonstrate the effectiveness of this approach. The proposed portable device further supports practical deployment, enhancing maintenance efficiency and grid safety. This study has two main limitations. First, the acoustic dataset is limited in scale due to challenges in field data collection, including safety restrictions, environmental variability, and the high cost of manual annotation. Second, the current method focuses on single-bolt loosening, whereas real-world structures often involve complex bolt groups where signal interference and multi-bolt coupling pose significant challenges. The experimental scope is also confined to heights of 0–20 m. Future work will focus on expanding the dataset through acoustic-specific augmentation and synthetic data generation from finite element models, alongside transfer learning from broader mechanical fault corpora. Research will also extend to group-bolt scenarios and taller tower configurations, aiming to improve model generalization and practical applicability across diverse structural and environmental conditions.
Author Contributions
Conceptualization, Y.Q. and L.Y.; methodology, Y.Z. and C.C.; validation, Y.Q. and Y.Z.; writing—original draft preparation, Y.Q. and Y.Z.; visualization, C.C. and J.H.; supervision L.Y. All authors have read and agreed to the published version of the manuscript.
Funding
This research was funded by Technology Project of State Grid Jiangsu Electric Power Co., Ltd. (Grant number: J2023156).
Data Availability Statement
The data presented in this study are available on request from the corresponding author due to confidentiality agreements.
Conflicts of Interest
Authors Yong Qin, Yu Zhou, Cen Cao and Jun Hu were employed by the company Nantong Power Supply Branch of State Grid Jiangsu Electric Power Co., Ltd. The remaining authors declare that the research was conducted in the absence of any commercial or financial relationships that could be construed as a potential conflict of interest.
Appendix A
Table A1.
Portable Multi-Channel Analyzer Specifications.
Table A1.
Portable Multi-Channel Analyzer Specifications.
| Sampling Parameters | |
|---|---|
| Input Type | 16-channel simultaneous input |
| Input Interface | BNC (customizable interface type) |
| IEPE Excitation | Each channel supports 4 mA constant current output |
| ADC Resolution | 24 bits |
| Input Range | ±10 V |
| Sampling Method | Software-triggered synchronous sampling |
| Sampling Rate | Maximum 192 kS/s per channel for synchronous sampling |
| Coupling Mode | Programmable AC, DC coupling |
| Bias Detection | Software detection |
| Signal-to-Noise Ratio | 95 dB |
| Dynamic Range | 104 dB |
| Physical Parameters | |
| Product Dimensions | 420 mm × 300 mm × 220 mm (Length × Width × Height) |
| Product Weight | 13.6 kg |
| Ingress Protection (IP) Rating | IP31 |
| Working Temperature | −20 °C to 70 °C |
| Hardware Parameters | |
| System | Ubuntu |
| CPU | i7-12700 |
| RAM | 32 GB |
| Hard Drive | 1 TB |
| RJ45 | Gigabit RJ45 Port × 1 |
| USB | USB 2.0 Port × 1; USB 3.0 Port × 1 |
| Power Supply Parameters | |
| Power Supply Method | Lithium battery power supply |
| Battery Life | Built-in battery: 2 h; External battery: ≥8 h |
| Communication Method | Gigabit Ethernet |
References
- Zheng, H.-D.; Fan, J. Progressive collapse analysis of a truss transmission tower-line system subjected to downburst loading. J. Constr. Steel Res. 2022, 188, 107044. [Google Scholar] [CrossRef]
- Miao, R.; Shen, R.; Zhang, S.; Xue, S. A Review of Bolt Tightening Force Measurement and Loosening Detection. Sensors 2020, 20, 3165. [Google Scholar] [CrossRef] [PubMed]
- Li, Z.; Chen, Y.; Sun, W.; Jiang, P.; Pan, J.; Guan, Z. Study on Self-Loosening Mechanism of Bolted Joint under Rotational Vibration. Tribol. Int. 2021, 161, 107074. [Google Scholar] [CrossRef]
- Qin, Y.; Yuan, L. Intelligent Bolt Loosening Detection in Transmission Towers Using Acoustic Signature Analysis and Machine Learning. Processes 2025, 13, 1111. [Google Scholar] [CrossRef]
- Tan, B.; Wang, T.; Fang, Q.; Yang, D.; Wang, H.; Lu, G. Bolt looseness monitoring using dynamic mode decomposition with piezoelectric active sensing. Measurement 2024, 238, 115204. [Google Scholar] [CrossRef]
- Simoncelli, M.; Zucca, M.; Ghilardi, M. Structural health monitoring of an onshore steel wind turbine. J. Civ. Struct. Health Monit. 2024, 14, 1423–1437. [Google Scholar] [CrossRef]
- Chelimilla, N.; Chinthapenta, V.; Kali, N.; Korla, S. Review on recent advances in structural health monitoring paradigm for looseness detection in bolted assemblies. Struct. Health Monit. 2023, 22, 4264–4304. [Google Scholar] [CrossRef]
- Liu, P.; Wang, X.; Wang, Y.; Zhu, J.; Ji, X. Research on percussion-based bolt looseness monitoring under noise interference and insufficient samples. Mech. Syst. Signal Process. 2024, 208, 111013. [Google Scholar] [CrossRef]
- Liu, Z.; Huang, X.; Zhao, L.; Wen, G.; Feng, G.; Zhang, Y. Research on online monitoring technology for transmission tower bolt looseness. Measurement 2023, 223, 113703. [Google Scholar] [CrossRef]
- Wang, J.; Sheng, J.; Jiang, J.; Wen, J.; Xiao, S.; Zhang, Z. Bolt Loosening Identification Method Based on STFT-IP Time-Frequency Feature Extraction Technology. Noise Vib. Control 2021, 41, 108–112. [Google Scholar] [CrossRef]
- Hou, L.Y.; Zhuo, D.B. Research on bolt loosening recognition based on sound signal and GA-SVM–RFE. Sci. Rep. 2025, 15, 24165. [Google Scholar] [CrossRef] [PubMed]
- Sui, X.; Duan, Y.; Yun, C.; Tang, Z.; Chen, J.; Shi, D.; Hu, G. Bolt Looseness Detection and Localization Using Wave Energy Transmission Ratios and Neural Network Technique. J. Infrastruct. Intell. Resil. 2023, 2, 100025. [Google Scholar] [CrossRef]
- Zhao, Y.; Xiao, Y.; Wang, H.; Wang, T.; Wu, C.; Zhang, B. Effect of Bolt Tightening Force on the Transmission Tower Modal Parameters and a Method for Looseness Identification. Energy Rep. 2021, 7, 842–849. [Google Scholar] [CrossRef]
- Yang, S.; Zhou, C.; He, J.; Cheng, Q.; Yu, P. Dynamic Characteristics of a Rod-Fastening Rotor System with Tie Rod Bolt Loosening. Nonlinear Dyn. 2023, 111, 18697–18723. [Google Scholar] [CrossRef]
- Zhao, L.; Wen, G.; Wang, J.; Liu, Z.; Huang, X. Transmission Tower Bolt-Loosening Time–Frequency Analysis and Localization Method Considering Time-Varying Characteristics. Struct. Health Monit. 2024, 24, 566–589. [Google Scholar] [CrossRef]
- Kim, D.-Y.; Kim, M.-J.; Kim, C.-I.; Yoon, G.H. Looseness Detection System of Bolted Joints Using a VMD-Based Nonlinear Transformation Approach with Deep Residual Network. Meas. Sci. Technol. 2025, 36, 026141. [Google Scholar] [CrossRef]
- Chen, R.; Xu, P.; Hang, K.; Zeng, L.; Wang, S.; Zhu, Y. Intelligent Looseness Detection for Bolts of a Fan Foundation Based on a Multi-Scale One-Dimensional Convolutional Neural Network. J. Vib. Shock 2022, 41, 301–307. [Google Scholar]
- Qu, S.; Zhou, Y.; Yin, P.; Li, X.; Wu, H.; Wang, W.; Huo, S.; An, W.; Tian, Q.; Wu, Y. Staggered Two-Bolt Connections in Transmission Towers: A Comprehensive Study on Failure Mechanisms and Design Codes. Buildings 2025, 15, 629. [Google Scholar] [CrossRef]
- Yin, H.; Xiao, X.; Huang, Z.; Zhao, T.; Huang, M. Experimental and Finite Element Analyses of Adjustable Foundation Bolts in Transmission Towers. Buildings 2024, 14, 1357. [Google Scholar] [CrossRef]
- GB/T 3098.1-2010; Mechanical Properties of Fasteners—Bolts, Screws and Studs. SAC: Beijing, China, 2011.
- Tian, J.; Zhang, J.; Li, W.; Xu, D. VDM-DA: Virtual domain modeling for source data-free domain adaptation. IEEE Trans. 2021, 32, 3749–3760. [Google Scholar] [CrossRef]
- Nguyen, T.-T.; Ta, Q.-B.; Ho, D.-D.; Kim, J.-T.; Huynh, T.-C. A method for automated bolt-loosening monitoring and assessment using impedance technique and deep learning. Dev. Built Environ. 2023, 14, 100122. [Google Scholar] [CrossRef]
- Argatov, I.; Sevostianov, I. Health monitoring of bolted joints via electrical conductivity measurements. IEEE Trans. 2010, 48, 874–887. [Google Scholar] [CrossRef]
- Huda, F.; Kajiwara, I.; Hosoya, N.; Kawamura, S. Bolt loosening analysis and diagnosis by non-contact laser excitation vibration tests. Mech. Syst. Signal Process. 2013, 40, 589–604. [Google Scholar] [CrossRef]
- Pirdayr, A.; Mohammadi, M.; Kazemzadeh-Parsi, M.J.; Rajabi, M. Self-loosening effects on vibration characteristics of plates with bolted joints: An experimental and finite element analysis. Measurement 2021, 185, 109922. [Google Scholar] [CrossRef]
- Wang, Y.; He, H.; Zhuge, F.; Wang, C.; Guo, H. Comprehensive diagnosis method for bolt loosening based on the fusion of vibration characteristics and sound signal variability. Measurement 2025, 256, 118451. [Google Scholar] [CrossRef]
- Li, C.; Yang, Y.; Xu, G.; Zhou, Y.; Jia, M.; Zhong, S.; Gao, Y.; Park, C.; Liu, Q.; Wang, Y.; et al. Insulating materials for realising carbon neutrality: Opportunities, remaining issues and challenges. High Volt. 2022, 7, 610–632. [Google Scholar] [CrossRef]
- Roy, S.; Kundu, C.K. State of the art review of wind induced vibration and its control on transmission towers. Structures 2021, 29, 254–264. [Google Scholar] [CrossRef]
- Fahy, F.J. Foundations of Engineering Acoustics; Elsevier: Amsterdam, The Netherlands, 2000. [Google Scholar]
- Yi, J.; Zhang, J.W.; Li, Q.S. Dynamic characteristics and wind-induced responses of a super-tall building during typhoons. J. Wind Eng. Ind. Aerodyn. 2013, 121, 116–130. [Google Scholar] [CrossRef]
Disclaimer/Publisher’s Note: The statements, opinions and data contained in all publications are solely those of the individual author(s) and contributor(s) and not of MDPI and/or the editor(s). MDPI and/or the editor(s) disclaim responsibility for any injury to people or property resulting from any ideas, methods, instructions or products referred to in the content. |
© 2025 by the authors. Licensee MDPI, Basel, Switzerland. This article is an open access article distributed under the terms and conditions of the Creative Commons Attribution (CC BY) license (https://creativecommons.org/licenses/by/4.0/).