1. Introduction
Transmission lines, as critical components of power systems, are responsible for large-scale electricity delivery, and their safe and stable operation directly affects national economic development and social stability [
1]. Due to their extensive geographical coverage and exposure to harsh natural environments, transmission lines are vulnerable to external damage caused by weather events (e.g., heavy rain, strong winds, earthquakes) as well as mechanical stresses introduced during construction [
2,
3]. These issues pose serious threats to grid security and may result in severe consequences such as large-scale blackouts, production halts, financial losses, and even fire hazards or casualties [
4]. Furthermore, long-term accumulation of latent faults can shorten equipment lifespan and increase maintenance costs [
5]. Therefore, rapid and accurate detection of transmission line defects has become imperative for ensuring grid reliability and operational safety [
6,
7].
Traditional inspection methods rely heavily on manual patrols, which are inefficient, labor-intensive, and prone to safety risks. Moreover, they lack the capacity for digital management of inspection data [
8]. In recent years, the integration of drone technology with deep learning has brought new possibilities to transmission line inspection. Unmanned aerial vehicles (UAVs), equipped with sensors, can efficiently acquire visual data of transmission infrastructure and support remote fault diagnosis [
9]. However, the enormous volume of image data generated requires extensive manual review, leading to high time consumption and inefficiency [
10]. This has prompted growing interest in automated defect detection using UAV-acquired imagery.
The various methods of transmission line detection are shown in
Table 1. Earlier studies proposed traditional image processing techniques to detect defects in insulators. For instance, Song [
11] applied computer vision algorithms to detect broken strands, while Rahman [
12] used Sobel filters and Canny edge detection for conductor inspection. Chen [
13] adopted the Hough transform for vibration damper detection by applying shape constraints. However, these methods often fail to generalize under varying environmental conditions and are typically limited to single defect categories. With the rise of artificial intelligence, machine learning models have been introduced to improve detection reliability. Gencoglu and Uyar [
14] combined least squares support vector machines with particle swarm optimization for contamination fault estimation, and Fu [
15] employed Haar-like features and AdaBoost cascades for detecting structural component failures. Despite some improvements, traditional machine learning approaches still rely on hand-crafted features and struggle with complex backgrounds in UAV imagery.
Deep learning has recently emerged as a dominant approach in aerial image-based fault detection. These methods are generally divided into single-stage models (e.g., SSD [
16], YOLO [
17]) and two-stage models (e.g., Faster R-CNN [
18]). Given the computational limitations of UAV onboard systems, single-stage models like the YOLO series are widely favored due to their efficiency, accuracy, and deployability [
19,
20]. Building on YOLOv5, Lu [
21] replaced the C3 module with GhostNetV2 and introduced dynamic adaptive weighting to enhance feature fusion efficiency. Hao [
22] incorporated attention mechanisms and cross-scale fusion to improve detection performance under complex backgrounds. Qiu [
23] integrated MobileNet with YOLOv4 to enhance lightweight performance but suffered from accuracy degradation. Wei [
24] proposed a heterogeneous fusion framework based on YOLOv8 to jointly detect infrared and visible defects, improving multi-source detection. Nonetheless, existing methods continue to face three core challenges: (1) Poor performance in small-target detection, as subtle defects are often overwhelmed by complex backgrounds. (2) Limited adaptability to environmental variability, including changes in lighting, weather, and occlusion. (3) Inefficient accuracy–efficiency trade-offs, where most improvements increase model complexity at the cost of real-time performance.
In parallel, recent advances in related domains such as cross-view person search and remote sensing object detection have demonstrated the potential of enhanced context modeling, adaptive attention, and feature aggregation to tackle similar challenges. Zhang [
25] proposed a multi-feature constrained cross-view person search method integrating global–local and semantic aggregation modules, which significantly improved matching accuracy under occlusion and crowd scenarios. Liu [
26] developed a multifaceted collaborative network (LBA-MCNet) for salient object detection in remote sensing images, combining edge-aware attention, global affinity modeling, and deep supervision for superior accuracy. Xie [
27] introduced a landslide extraction framework leveraging multiscale context-aware encoding and dynamic feature fusion, effectively addressing scale variation and background interference. These studies highlight the advantages of incorporating context semantics, attention mechanisms, and multi-scale fusion strategies for robust object detection under complex conditions.
Table 1.
Different detection methods of transmission lines.
Table 1.
Different detection methods of transmission lines.
| Detection Technique | Method of Representation | Advantages | Limitations |
|---|
| Traditional image processing | Sobel/Canny edge detection [12], Hough transform [13] | The calculation is simple, and the real-time performance is good | Relying on artificial design features, poor anti-interference, and weak environmental adaptability |
| Machine learning methods | SVM + PSO [14], hair + AdaBoost [15] | The robustness is better than the traditional method, and the feature interpretability is stronger | Feature engineering is complex, generalization ability is limited, and accuracy improvement is a bottleneck |
| Deep learning | YOLO [17], Faster R-CNN [18] | End-to-end detection, automatic feature extraction, adaptation to complex scenes | A large amount of labeled data is required, and the model tuning is complex |
Inspired by these insights, this paper proposes an improved YOLOv12-based [
28] defect detection framework tailored for UAV-based transmission line inspection. Compared with other’s YOLO model, YOLOv12 introduces more efficient feature fusion strategies and lightweight components that are better suited for detecting small-scale transmission line defects on edge devices. In our preliminary experiments, it also showed improved accuracy–speed trade-offs under complex UAV inspection scenarios. Therefore, this paper proposes an improved YOLOv12-based transmission line defect detection method, leveraging the synergistic advantages of deep learning and UAV smart inspection to overcome traditional limitations and achieve efficient, accurate, real-time detection. Our main contributions are as follows:
- (1)
Enhanced Multi-Scale Feature Fusion: We replaced the traditional FPN + PAN neck with a Bidirectional Feature Pyramid Network (BiFPN), enabling bidirectional cross-scale feature interaction with learnable weights for better small-target representation.
- (2)
Cross-Stage Channel-Position Collaborative Attention (CPCA): A novel attention module is embedded to jointly model channel dependencies and spatial relationships, effectively suppressing background noise such as vegetation and reflective metallic surfaces.
- (3)
Lightweight Architecture Design: The terminal backbone modules are redesigned using ShuffleNetV2’s group convolution and channel shuffle strategies to reduce model complexity and improve inference speed, achieving real-time detection performance on edge devices.
2. Related Work
2.1. YOLOv12 Algorithm
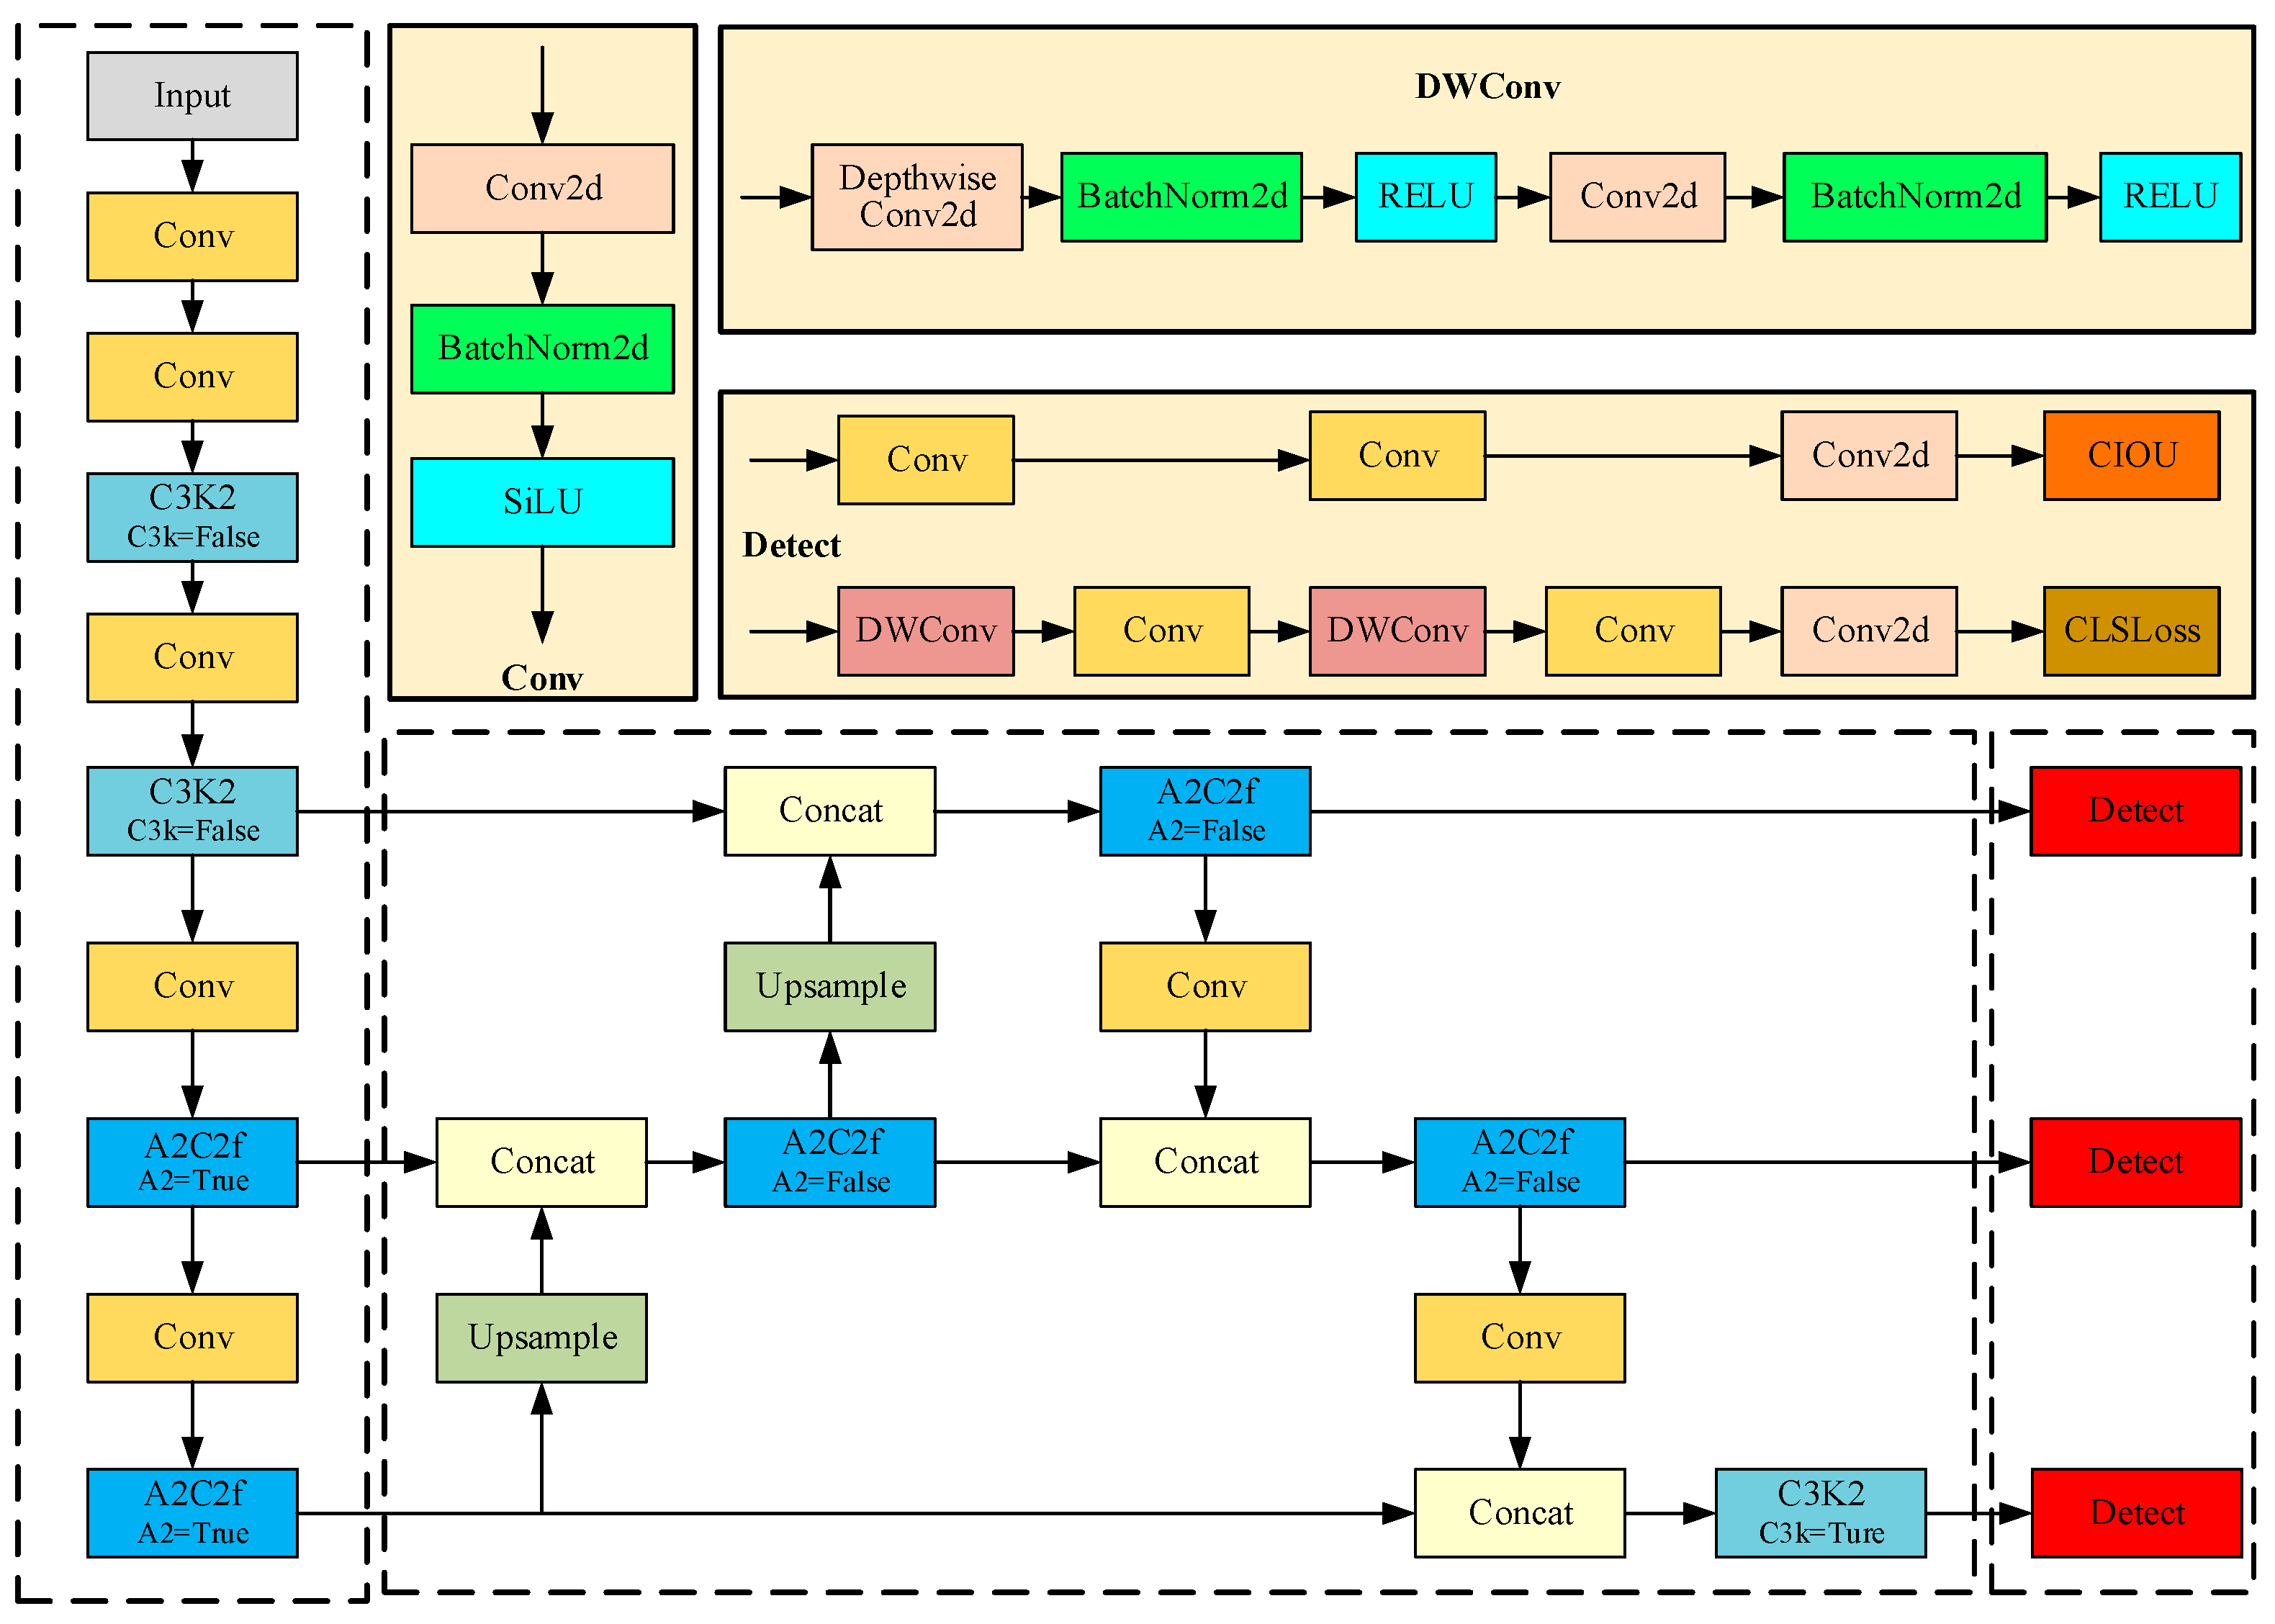
As the latest iteration in the YOLO series, YOLOv12 fundamentally reconstructs traditional CNN-dominated architectures with attention mechanisms as the core, achieving dual breakthroughs in speed and accuracy for real-time object detection. Compared to YOLOv8, YOLOv12 optimizes the backbone network, feature aggregation mechanisms, and computational efficiency through multiple technical innovations while providing a unified framework for model training encompassing image classification, object detection, and instance segmentation. This study employed YOLOv12n as the baseline for improvement, with its architecture illustrated in
Figure 1.
YOLOv12 maintains the classic three-stage backbone–neck–head architecture of the YOLO series but deeply integrates attention mechanisms with lightweight strategies across all modules, achieving performance breakthroughs in real-time detection tasks. The backbone primarily extracts critical features from input images, consisting of multiple Conv blocks, Cross-Stage Partial Network with Kernel-Split 2 (C3K2), and Area Attention-enhanced Cross-Stage Fusion (A2C2f) modules. The Conv module comprises Conv2d, batch normalization, and SiLU activation functions. The C3K2 module inherits YOLOv11’s C3K2 structure while introducing a Residual Efficient Layer Aggregation Network (R-ELAN) that incorporates a residual shortcut from input to output with a scaling factor (default: 0.01), as shown in
Figure 2. This architecture employs transition layers to adjust channel dimensions and generate a single feature map, which subsequently undergoes processing through successive blocks before concatenation to form a bottleneck structure. This approach preserves original feature integration capabilities while reducing computational costs and parameter/memory usage.
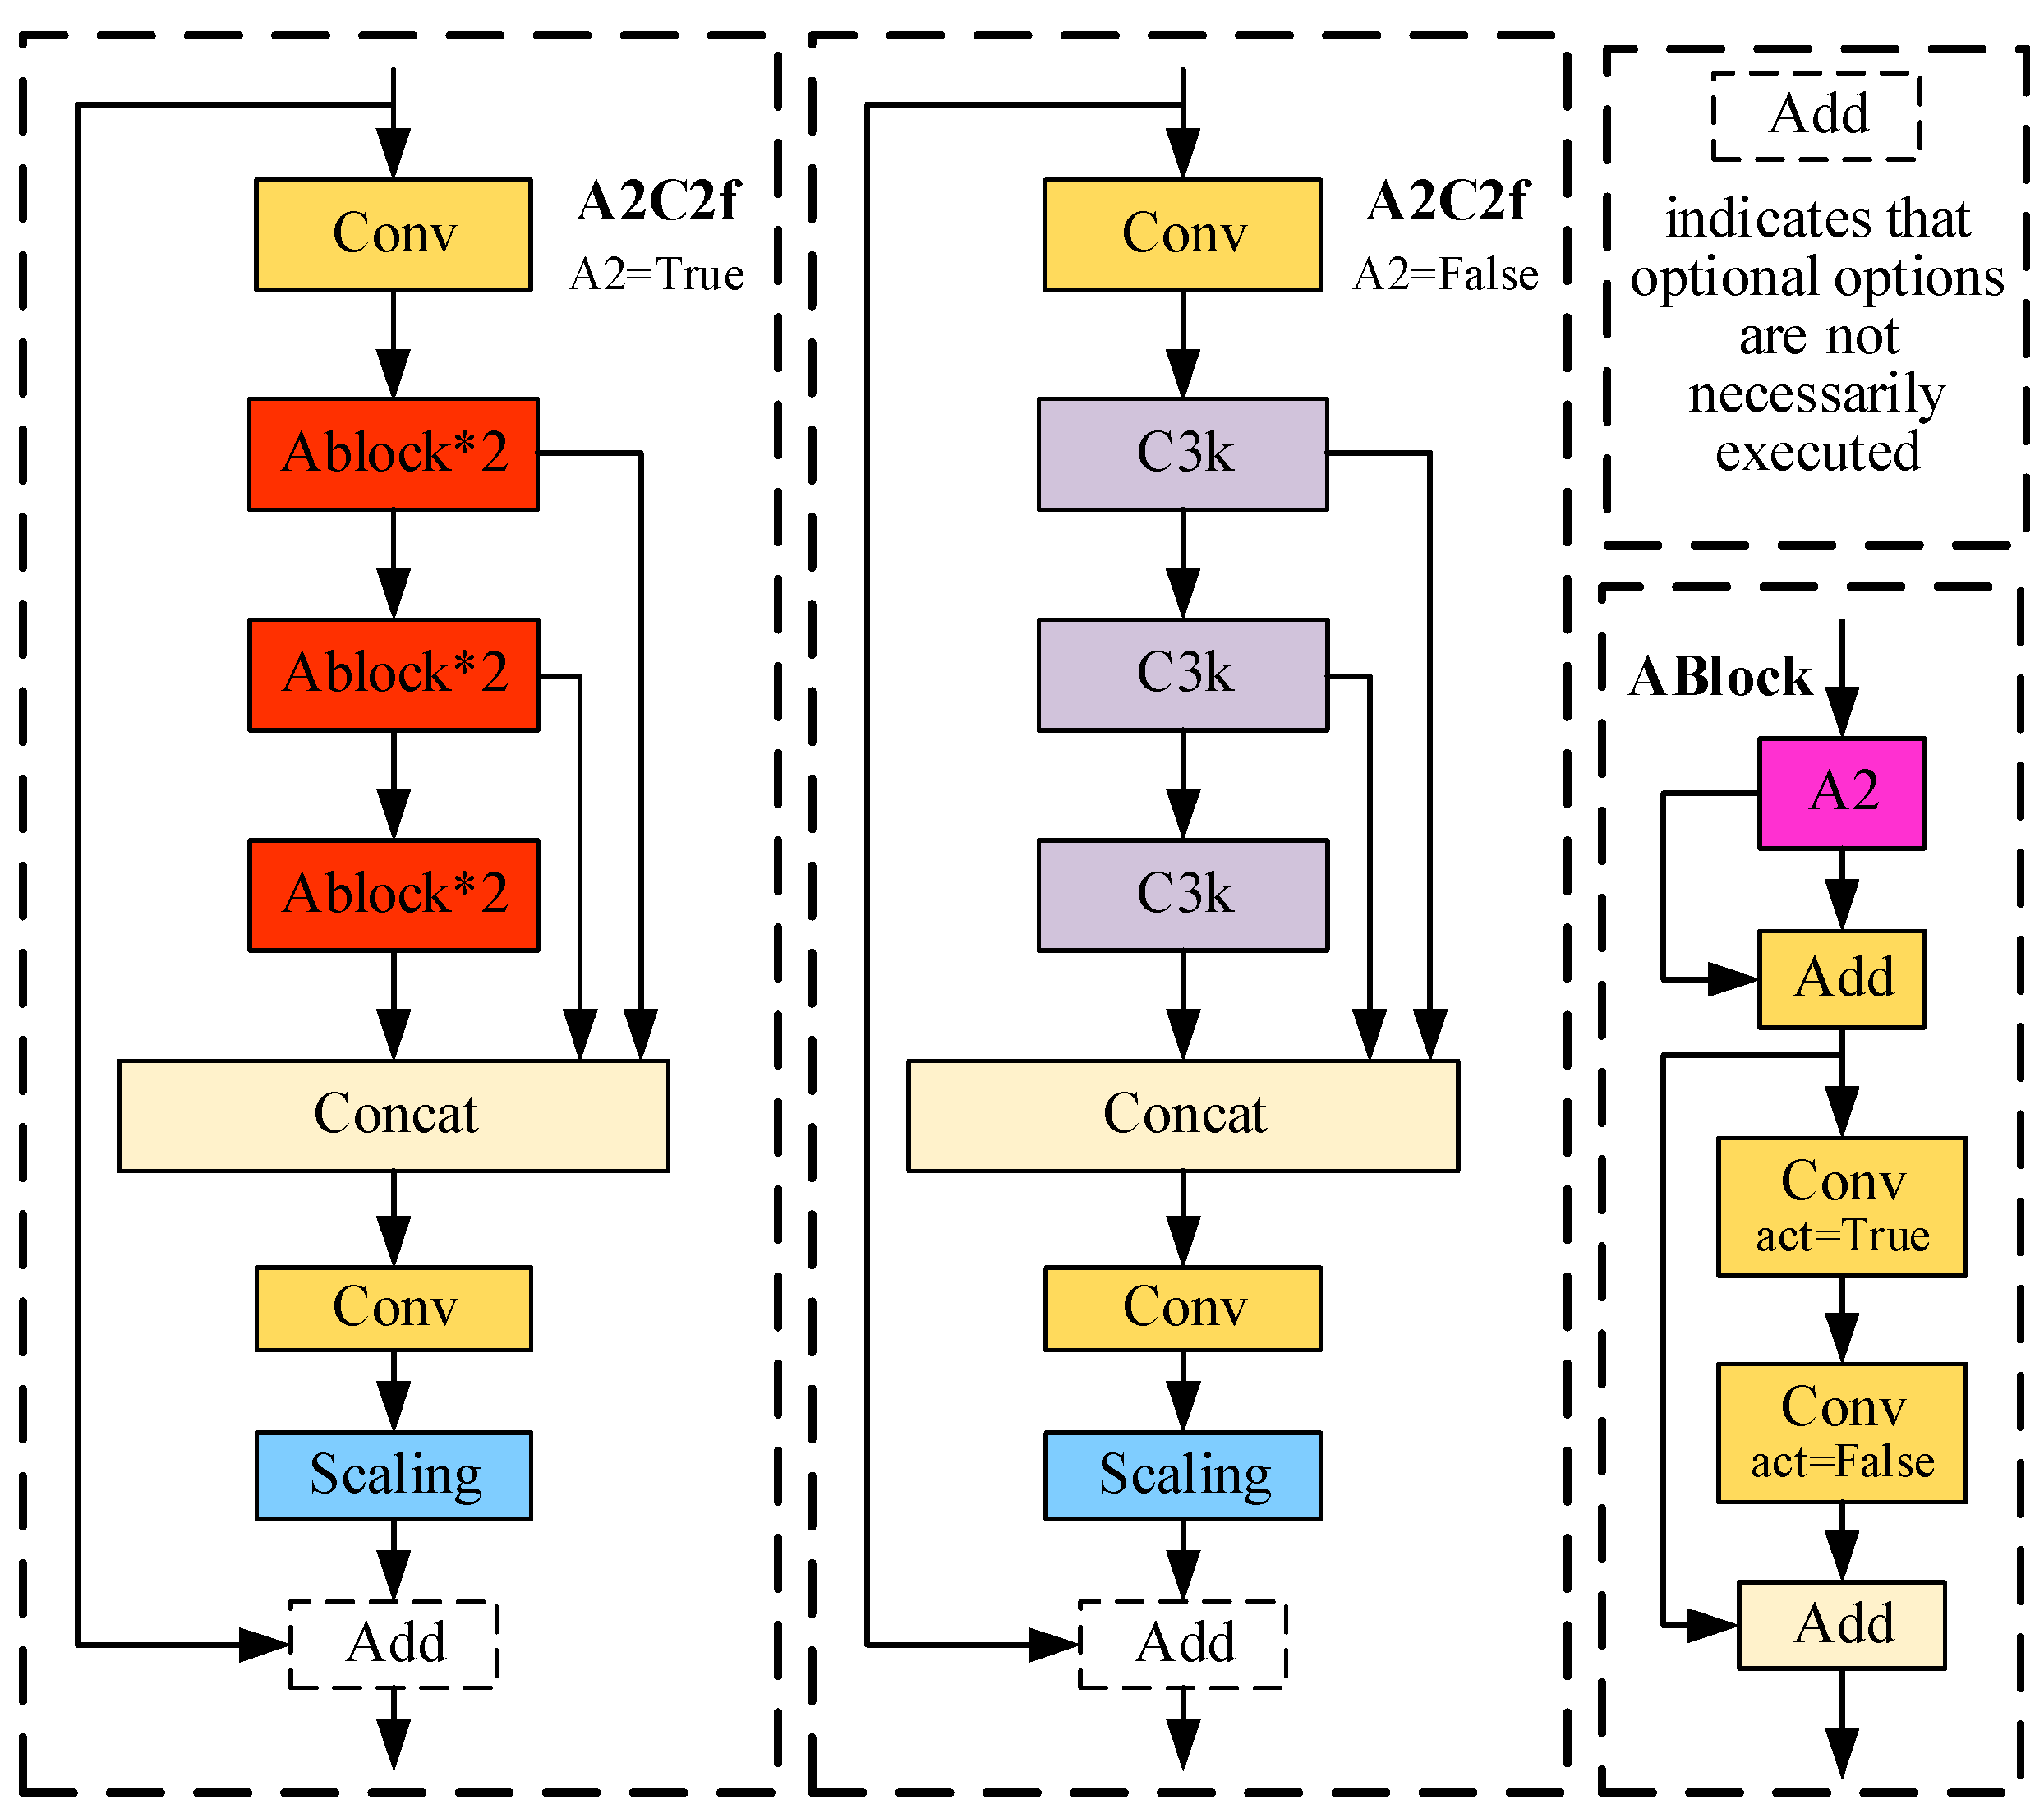
The A2C2f module embeds an Area Attention mechanism into the C3K2 and R-ELAN framework, as depicted in
Figure 3. This attention mechanism partitions input feature maps into non-overlapping sub-regions, independently computes channel-spatial attention for each sub-region, and restores original dimensions through reshaping. This structure imposes minimal performance impact while significantly enhancing processing speed.
2.2. Bidirectional Feature Pyramid Network
In UAV-based transmission line detection, the FPN + PAN structure of YOLOv12 suffers from excessive downsampling, which reduces deep feature resolution and causes small defects to occupy very few pixels, leading to missing texture details. Moreover, unidirectional feature fusion fails to adequately balance low-level spatial detail and high-level semantic abstraction, resulting in high false detection rates under dense occlusion.
To overcome these limitations, we adopted the Bidirectional Feature Pyramid Network (BiFPN) [
29], which enhances multi-scale fusion through bidirectional cross-scale interaction and dynamic feature weighting. Specifically, (1) high-resolution shallow features (e.g., 160 × 160 level) are emphasized via learnable weights to improve the recall of small-scale targets; (2) redundant fusion nodes are removed to achieve lightweight computation while maintaining detection accuracy. BiFPN’s fusion mechanism is expressed as
where
wi denotes learnable weight parameters for each input feature, and
ε ensures numerical stability. This weighted fusion enables the model to adaptively prioritize informative features depending on object scale and complexity.
In contrast to FPN’s additive fusion or PANet’s concatenation, BiFPN learns to emphasize higher-resolution features when detecting small defects. Further efficiency is achieved through parameter sharing across BiFPN layers and the use of depthwise separable convolutions, significantly reducing computation without degrading performance. In practice, BiFPN alternates between top-down and bottom-up pathways across input levels (e.g., P3–P7), as shown in
Figure 4a. High-level semantic features propagate downward, while spatially rich low-level features flow upward. After two passes, each layer fuses multi-scale contextual information, improving robustness under occlusion and scale variation.
To suppress irrelevant background and further refine feature attention, we inserted a CPCA attention module at the BiFPN output. This enhances semantic consistency and defect focus in complex scenes. The modified architecture is shown in
Figure 4b, and the CPCA mechanism is detailed in
Section 2.3.
2.3. CPCA Attention Mechanism
Traditional attention modules like SE and CBAM either lack spatial modeling or apply channel-shared spatial weights, limiting adaptability to spatially diverse or small-scale features. To address this, we adopted the Channel-Prior Convolutional Attention (CPCA) [
30], which introduces decoupled channel priors and multi-scale spatial modeling for fine-grained feature calibration.
The CPCA mechanism first applies Channel Attention (CAM) using average and max pooling across spatial dimensions, followed by a shared MLP and sigmoid activation to produce channel-wise weights:
The CPCA mechanism excels at focusing on informative channels and critical regions. Its structure resembles CBAM but employs cascaded Channel Attention (CAM) and Spatial Attention (SAM) operations to generate calibration weights:
where
F∈ℝ
C×H×W denotes the input feature map, and ⊗ represents element-wise multiplication. The implementation workflow is illustrated in
Figure 5. Subsequently, Spatial Attention (SAM) utilizes multi-branch depthwise separable convolutions and a 1 × 1 fusion to preserve inter-channel dependencies while enhancing spatial selectivity:
where
DwConv denotes depthwise convolution, and
Branchi (
i∈{0, 1, 2, 3}) represents multi-scale branches with
Branch0 as the identity connection.
Unlike CBAM, CPCA does not compress channels before spatial attention, allowing each channel to learn its own spatial response map. This enhances the model’s robustness to scale variation and cluttered backgrounds.
In our architecture, CPCA is embedded within BiFPN’s cross-stage skip connections, where it dynamically adjusts feature weights during multi-scale fusion. This location allows CPCA to strengthen shallow–deep interactions and optimize semantic consistency across levels. We experimentally evaluated alternative placements—such as attaching CPCA at the end of the backbone or before the detection head—but found that the current position achieved superior performance, particularly in small target localization and occluded environments.
By selectively enhancing critical feature responses while suppressing noise, the CPCA-enhanced BiFPN achieves improved convergence, accuracy, and robustness with minimal computational overhead.
2.4. ShuffleNetV2 Lightweight Design
To meet the real-time demands of UAV-based transmission line inspection, we replaced the C3K2 modules in YOLOv12’s backbone with ShuffleNetV2 [
31] units to reduce inference latency while maintaining accuracy. Unlike conventional lightweight models that optimize FLOPs alone, ShuffleNetV2 adopts a hardware-aware design guided by practical metrics such as memory access cost and parallelism. It introduces four key principles—channel balance, minimal group convolutions, simplified branches, and reduced element-wise operations—to ensure efficient execution on resource-constrained platforms. ShuffleNetV2 comprises two module types:
- (1)
Basic unit (
Figure 6a): Splits input features into two branches. Branch 1 preserves identity mapping, while Branch 2 applies pointwise convolution → 3 × 3 depthwise separable convolution → pointwise convolution. Channel shuffle operation after concatenation maintains feature expressiveness while reducing redundancy through cross-channel interaction.
- (2)
Downsampling unit (
Figure 6b): Implements dual-path downsampling. The upper branch compresses spatial dimensions via stride-2 3 × 3 depthwise convolution followed by pointwise convolution, while the lower branch mirrors Branch 2 of the basic unit with adjusted stride. Concatenated features undergo channel doubling and shuffling, achieving efficient downsampling while preserving feature integrity.
By integrating these modules, our model achieves better inference speed and reduced computational complexity with minimal impact on detection accuracy, supporting efficient deployment in aerial inspection scenarios.
4. Experiments
4.1. Dataset
The experimental dataset was constructed by capturing UAV images of damaged transmission lines across varied geographic and environmental conditions, including urban, rural, and mountainous regions, under different lighting, weather, and background scenarios. Images were taken from multiple angles and altitudes to reflect realistic inspection perspectives. All images were resized to 640 × 640 pixels and annotated using LabelImg1.8.6 software with a single class label (“damage”).
To improve dataset diversity and reduce overfitting, we applied a range of data augmentation techniques such as horizontal/vertical flips, random rotation, color adjustment, Gaussian blur/noise, and random block occlusion (see
Figure 8; parameters listed in
Table 2). These operations preserved key object features while increasing the robustness of the model to environmental variation, ultimately expanding the dataset to 2000 samples. The data were randomly split into training, validation, and test sets using a 7:2:1 ratio.
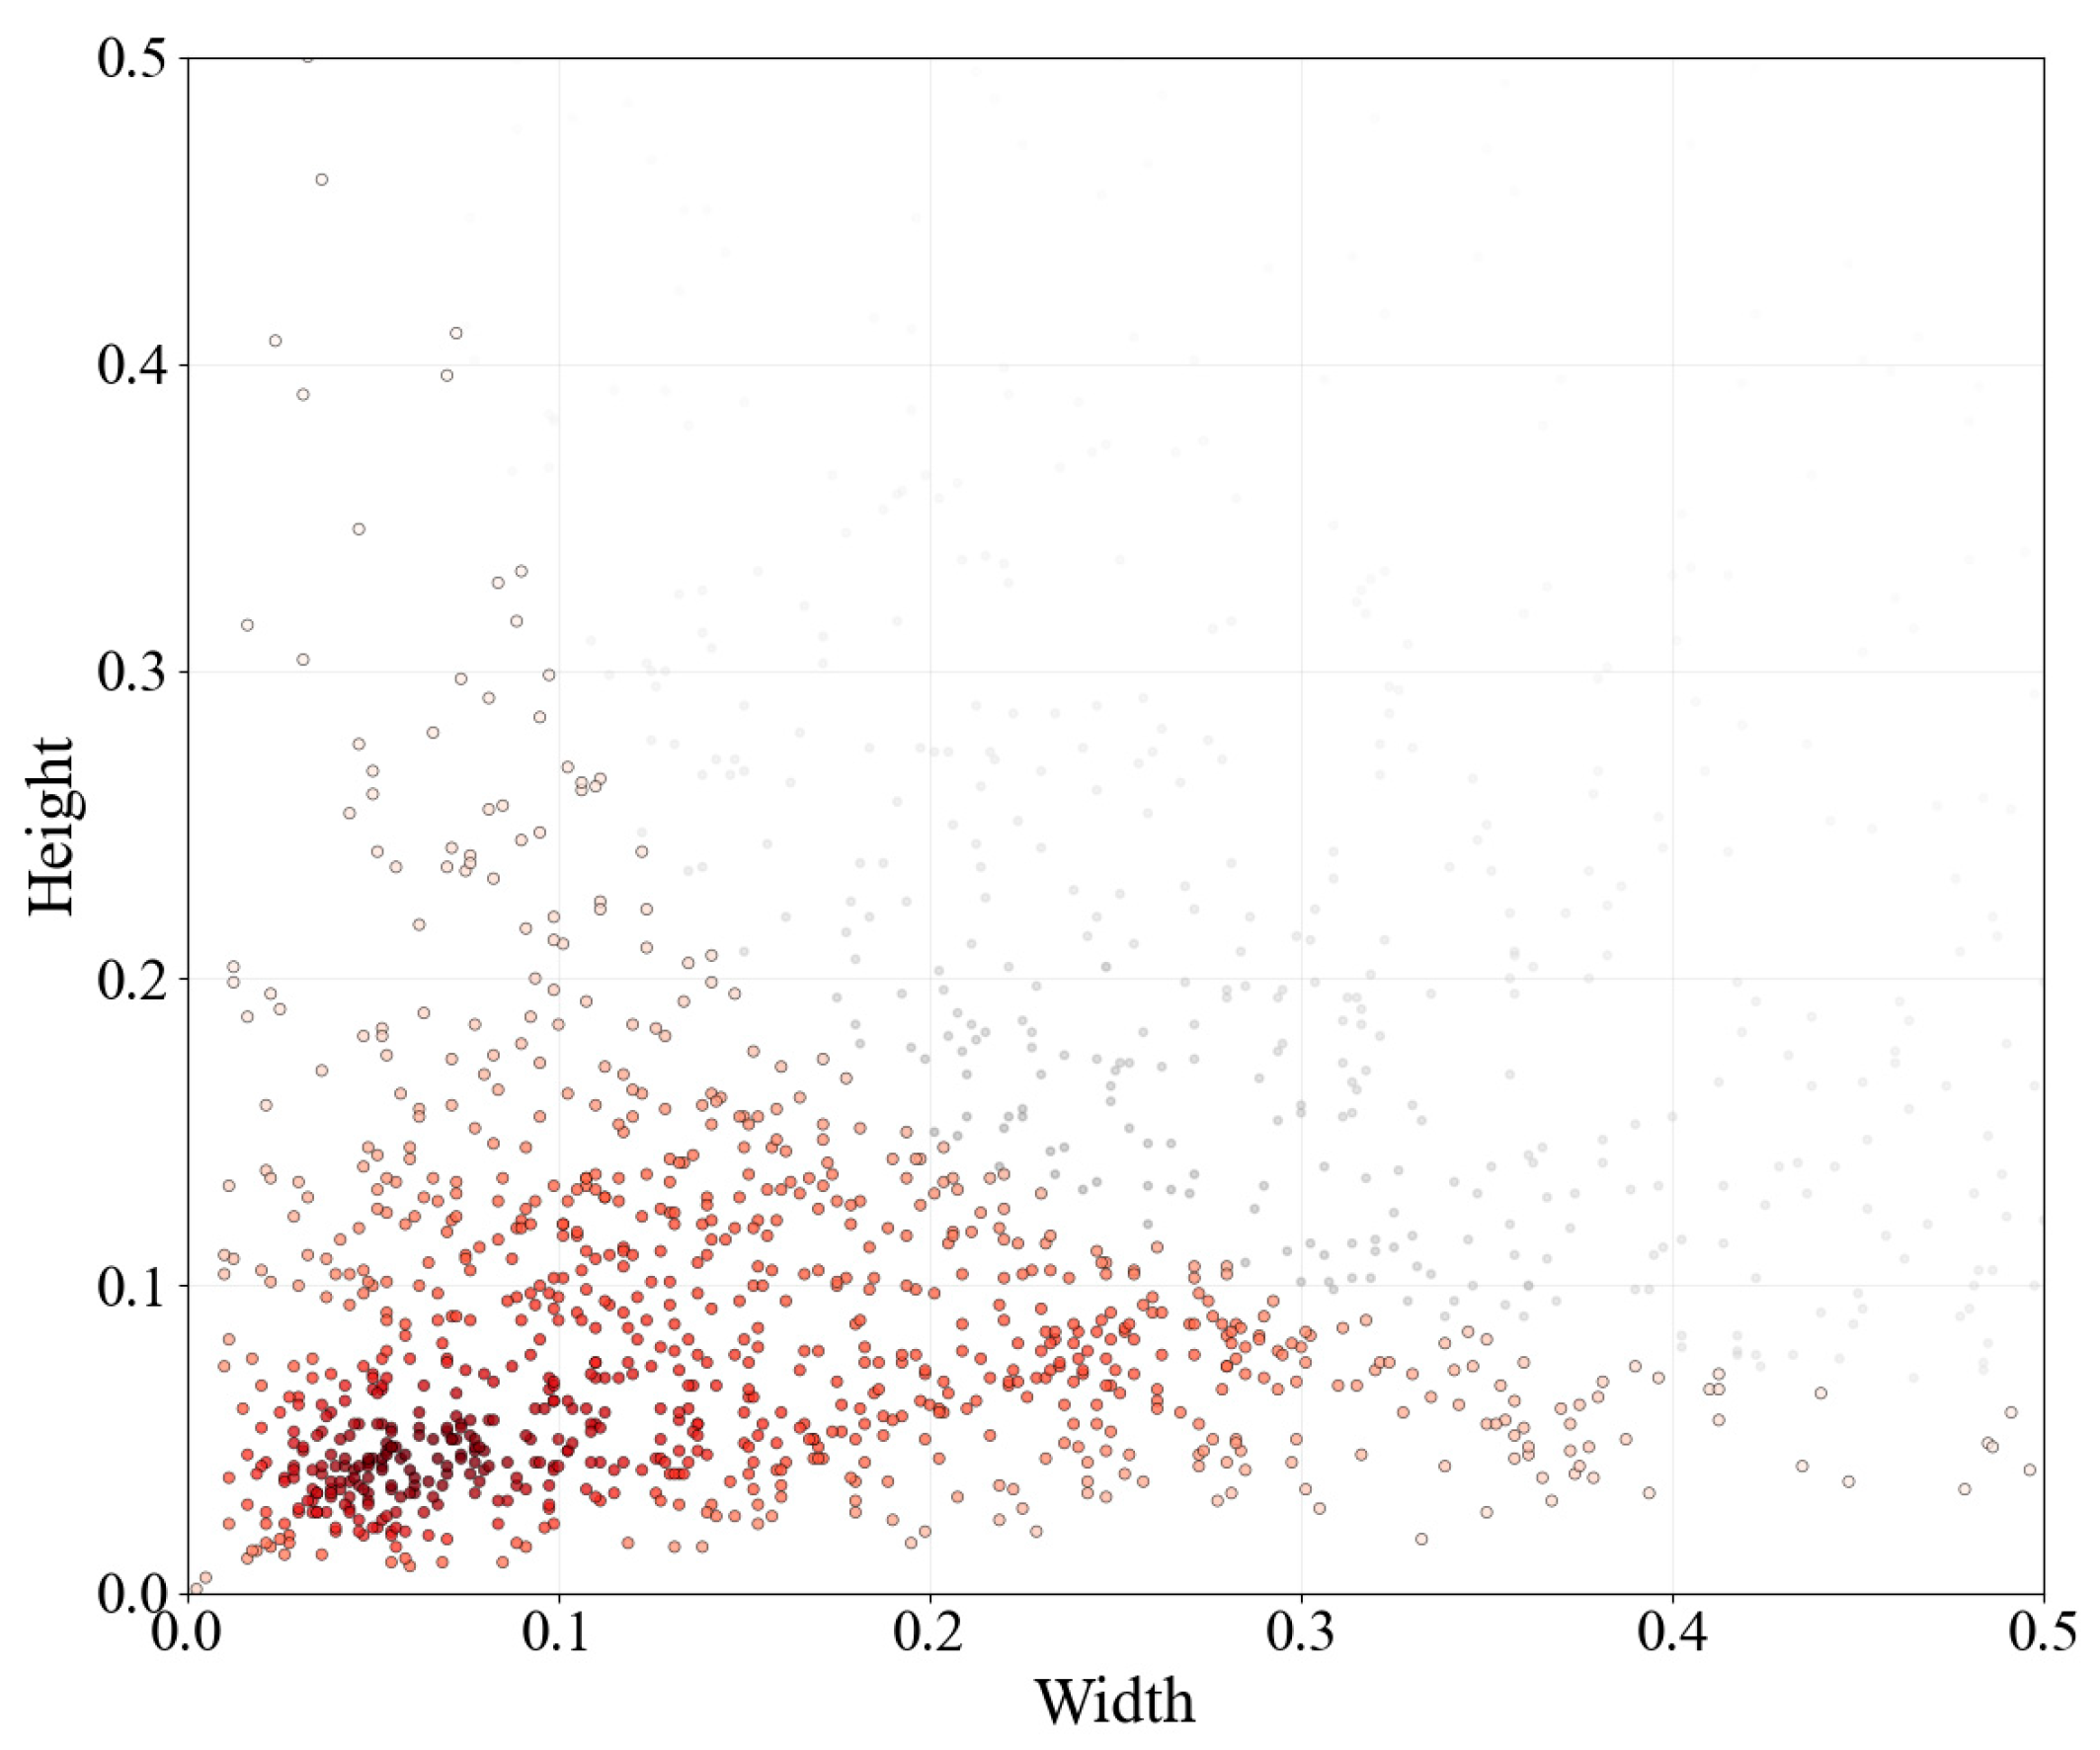
Small targets were defined as objects with a bounding box-to-image area ratio < 0.03 [
32]. The dataset contains 923 small targets (46.15% of total instances), predominantly clustered in lower-left regions (
Figure 9), indicating significant small-target representation.
4.2. Experimental Platform and Hyperparameter Settings
All experiments were conducted under standardized laboratory conditions using the hardware specifications detailed in
Table 3. Uniform hyperparameter configurations were implemented throughout the training process: input images were resized to 640 × 640 resolution, with 300 training epochs and a batch size of 16 to balance GPU memory utilization and training stability. The model employed stochastic gradient descent (SGD) optimization with momentum (μ = 0.937), weight decay coefficient (λ = 5 × 10
−4), and an initial learning rate of 0.01 governed by a cosine annealing schedule.
To optimize computational efficiency, a RAM caching mechanism was activated to preload preprocessed training data into memory, significantly reducing disk I/O latency. For data augmentation, we integrated the Mosaic technique [
33] from YOLOv4, which enhances small-object recognition through four-image mosaic stitching. Notably, Mosaic augmentation was disabled during the final 10 epochs, replaced by conventional augmentation methods to stabilize feature space convergence and mitigate over-reliance on synthetic features generated by data augmentation.
4.3. Evaluation Metrics
In object detection tasks, comprehensive evaluation of model performance requires multiple key metrics: precision, recall, mean average precision (mAP, including mAP@0.5 and mAP@0.5:0.95), and model parameter count. These metrics assess different aspects of model performance, including detection accuracy, missed detection rate, overall detection capability, and model complexity.
Precision quantifies the proportion of correctly predicted positive instances among all predicted positives, reflecting prediction accuracy. It is defined as
Recall measures the proportion of actual positive instances correctly identified by the model, indicating detection completeness. It is calculated as
In the aforementioned equations, True Positives (TP) represent instances where the model correctly detects actual target objects; False Positives (FP) denote erroneous detections where the model identifies non-existent objects as targets; True Negatives (TN) indicate cases where negative predictions align with actual negative samples (though TN is generally non-applicable in object detection tasks); and False Negatives (FN) correspond to genuine targets that the model fails to detect. The interrelationships among these metrics are explicitly illustrated in
Figure 10.
The calculation of AP (Average Precision) and mAP relies on the Intersection over Union (IoU), which evaluates the overlap between predicted and ground-truth bounding boxes:
AP corresponds to the area under the precision–recall curve:
mAP (mean average precision) is the most widely used holistic performance metric in object detection. It represents the average precision across all classes under varying IoU thresholds. mAP is computed as the mean of AP values across all classes:
where N denotes the total number of classes (single-class in this study). Two mAP variants are commonly used: (1) mAP@0.5: calculated at an IoU threshold of 0.5, suitable for scenarios with larger objects or lenient localization requirements; (2) mAP@0.5:0.95: mean mAP computed across IoU thresholds from 0.5 to 0.95 (in increments of 0.05), providing a stricter evaluation of model generalization, particularly for small object detection.
Additional metrics include FPS (frames processed per second) to measure inference speed and GFLOPs (giga floating-point operations) to quantify computational complexity, jointly evaluating detection efficiency and hardware resource utilization.
4.4. Training Process
The training protocol followed a systematic workflow: after deploying the heterogeneous computing platform and preprocessing the transmission line defect dataset (including cleansing and augmentation), model training commenced. Based on GPU memory optimization analysis, the training duration was set to 300 epochs. A phased validation strategy was implemented, with validation set performance evaluated after each epoch. The loss function trajectory (
Figure 11) revealed that training convergence was automatically determined when validation loss fluctuations remained below 0.3% for 10 consecutive epochs, triggering early stopping to preserve optimal weights.
The training dynamics illustrated in
Figure 11 reveal three sequential operational phases: During the initial Rapid Learning Phase (Epochs 1–50), a 78.4% loss reduction was achieved through synergistic optimization of the initial learning rate (0.01) and momentum coefficient (0.937). This was followed by the Fine-Tuning Phase (Epochs 50–200), where loss fluctuations stabilized within ±0.15, aligning with the theoretical decay trajectory of the cosine annealing learning rate scheduler. Finally, the Convergence Phase marks the culmination of the process, where smooth optimization trajectories demonstrate robust parameter space exploration capabilities. Neither gradient vanishing phenomena nor local minima entrapment were observed, confirming the architecture’s stable learning characteristics.
Test set predictions (
Figure 12) visualize the model’s capabilities, with annotations indicating defect category, localization coordinates, and prediction confidence (exceeding 0.92 in critical cases), confirming superior detection performance.
4.5. Comparative Experiments
To evaluate the effectiveness of the proposed model, we conducted a comprehensive comparison with several mainstream YOLO variants under identical experimental settings. As shown in
Table 4, our improved YOLOv12 achieved superior overall performance in both detection accuracy and model efficiency.
In terms of accuracy, the model attained an mAP50 of 98.7%, exceeding YOLOv5 (96.1%) and YOLOv8 (96.2%) by 2.6 and 2.5 percentage points, respectively. It also reached an mAP50:95 of 88.9%, reflecting a significant 10.8% improvement over both YOLOv12 (78.1%) and YOLOv10 (78.1%). Meanwhile, the model maintained excellent detection quality with precision of 94.8% and recall of 94.3%, surpassing all other variants. From a lightweight perspective, the proposed model has only 2.31M parameters, which is 23.3% fewer than YOLOv8 (3.01M) and 14.8% fewer than YOLOv10 (2.71M). Its computational complexity, measured by FLOPs, is 6.5G, slightly higher than YOLOv12 (5.9G) but still lower than most alternatives such as YOLOv5 (7.2G) and YOLOv6 (11.8G). Notably, the inference speed reached 142.7 FPS, representing a 20.8% improvement over the original YOLOv12 (118.1 FPS), though it remains lower than YOLOv8 (241.1 FPS) and YOLOv5 (218.7 FPS). These results confirm that the proposed model achieves a favorable trade-off between accuracy, model size, and computational cost, making it highly suitable for real-time transmission line inspection in edge-computing environments.
Heatmap analysis in
Figure 13 further highlights the model’s advantages. While YOLOv5 exhibits concentrated activations aligned with defect locations, its coverage is incomplete, missing portions of faults. YOLOv8 suffers from overly localized features and insufficient coverage, whereas YOLOv10 shows lower confidence scores, and YOLOv11 produces redundant detections. In contrast, the improved YOLOv12 not only achieves the highest confidence scores but also generates heatmaps with precise activation at defect locations and broader coverage. The enhanced model further concentrates heatmap regions around defects while maintaining wide coverage, demonstrating superior performance on the dataset.
4.6. Ablation Studies
To systematically evaluate the effectiveness of the proposed modules, a series of ablation experiments were conducted under consistent testing environments and parameters. As summarized in
Table 5, the synergistic module strategy achieved multi-dimensional optimization. Replacing the backbone’s terminal C3K2 modules with ShuffleNetV2 reduced parameters by 10.7% (2.52M→2.25M) and increased inference speed by 29.3% (118.1→152.7 FPS), albeit at a 3.4% cost in mAP50:95 (0.781→0.747), indicating a trade-off between lightweighting and feature extraction. Integrating the CPCA attention mechanism alone significantly enhanced the detection capability for subtle defects like broken strands, improving precision by 1.6% (0.907→0.923) and recall by 2.7% (0.900→0.927), which validates its effectiveness in suppressing complex background noise. The standalone application of the BiFPN multi-scale fusion module elevated mAP50:95 by 1.7% (0.781→0.794) with a marginal FLOPs increase (+0.1G). The final optimized model, integrating CPCA, BiFPN, and ShuffleNetV2, achieved a generational breakthrough in mAP50:95 (0.781→0.889, +13.8%) while reducing parameters by 0.21M (2.52→2.31M). It simultaneously improved precision by 4.1% (0.907→0.948) and recall by 4.3% (0.900→0.943), with FLOPs controlled at 6.5G (+9.8%), delivering a lightweight solution with 94.8% precision and 142.7 FPS real-time performance for UAV-based edge inspection.
The heatmaps in
Figure 14 provide additional insights. BiFPN enhanced detection accuracy by concentrating activation regions on defects, demonstrating improved small-target detection through multi-scale fusion. The CPCA mechanism refines feature selection via channel-spatial attention, expanding coverage while suppressing false positives. Although ShuffleNetV2 reduces computational costs, its standalone use introduces background noise and redundant detections due to compromised feature extraction. The full model, combining CPCA, BiFPN, and ShuffleNetV2, exhibited the highest confidence scores, with heatmaps sharply focused on defect locations and smooth activation decay from center to edges, confirming its superior detection capabilities.
4.7. Experimental Results in Specific Scenarios
To comprehensively validate the robustness of the proposed algorithm under complex environmental conditions, various image processing techniques were employed to simulate different lighting and adverse weather scenarios. The specific methods are summarized as follows: (1) HSV adjustment: random shifts of ±15° in hue, ±20% in saturation, and ±25% in brightness were applied to simulate dawn/dusk lighting and glare effects; (2) gamma correction: gamma values within the range [0.5, 2.0] were applied to simulate underexposure and overexposure; (3) adverse weather simulation: fog effects were simulated by adding Gaussian blur (σ × 3–5) combined with layered alpha blending of white fog to represent varying fog densities, and synthetic rain streaks and snowflake patterns with 30–50% opacity were overlaid to mimic rainy and snowy conditions; (4) occlusion: random gray blocks covering 10–30% of the image area were used to simulate occlusions caused by vegetation or birds.
The performance of the models under these complex scenarios is presented in
Table 6. The results demonstrate that the improved YOLOv12 model outperformed the original in terms of precision, recall, and mAP metrics, thereby confirming the effectiveness and robustness of the proposed method in challenging lighting and adverse weather conditions.


