Abstract
To alleviate the communication burden of wide-area protection and enhance the fault tolerance of multi-source criteria, this paper introduces an improved wide-area backup protection method based on multi-source information fusion. Initially, the variation characteristics of bus sequence voltages after a fault are utilized to screen suspected fault lines, thereby reducing communication traffic. Subsequently, four basic probability assignment functions are constructed using the polarity of zero-sequence current charge, the polarity of phase-difference current charge, and the starting signals of Zone II/III distance protection from the local and adjacent lines. The confidence of each probability function is evaluated using normalized information entropy, while consistency is analyzed via Gaussian similarity, enabling dynamic allocation of fusion weights. Additionally, a conflict adaptation factor is designed to adjust the fusion strategy dynamically, improving fault tolerance in high-conflict scenarios and mitigating the impact of abnormal single criteria on decision results. Finally, the fused fault probability is used to identify the fault line. Simulation results based on the IEEE 39-bus model demonstrate that the proposed algorithm can accurately identify fault lines under different fault types and locations and remains robust under conditions such as information loss and protection maloperation or failure.
1. Introduction
In the context of modern complex power grids, traditional backup protection strategies that rely on local measurement signals face significant challenges in terms of protection setting calibration and multi-level coordination, making it difficult to fully ensure the safe and stable operation of power grids [1]. With the continuous deepening of the digitalization and intelligentization process of smart substations, the development of wide-area measurement technology and communication technology has provided complete conditions for intrastation and interstation communication across bays. It enables accurate and rapid determination of fault locations by utilizing multi-point measurement information without the need for step-by-step coordination. Therefore, wide-area protection has gradually become a research hotspot, attracting extensive attention from foreign scholars [2,3,4]. In particular, how to utilize multi-source information to develop new algorithms for wide-area protection is particularly crucial.
At present, the methods for identifying faulty components in wide-area protection can be mainly classified into three categories. The first category consists of algorithms based on switch state quantities (such as circuit breaker status, protection action signals, and directional element information). For example, agent technology is applied to wide-area backup protection algorithms in [5]. Through the exchange of switching quantity information among multiple agents, the rapid detection and accurate location of faulty components are thereby achieved. Information on directional elements and distance protection from the local line and adjacent lines is collected, and faulty components are identified and faults are determined by constructing a protection fitness function in [6]. An adjacency matrix reflecting the dynamic changes in network topology is constructed based on graph theory, and the Floyd algorithm is combined to search for tripping paths so as to determine the fault isolation set in [7]. Multi-agent technology is introduced to build a wide-area protection system, and the autonomous and collaborative capabilities of agents are leveraged to achieve adaptive protection for large-scale power grids in [8]. The Weighted Extreme Learning Machine (WELM) is adopted to process unbalanced fault data, which improves the detection accuracy and reliability of wide-area backup protection for transmission lines in [9]. Such methods have low communication volume but weak anti-interference capability; information loss or errors can easily lead to misjudgment. The second category includes algorithms based on electrical quantity information (such as voltage, current amplitude, and phase). For instance, A method using wide-area current differential is applied in wide-area protection in [10]. A wide-area current differential protection suitable for multiterminal lines was constructed by analyzing the influence of the synchronization of multiterminal lines on differential current, and the double K braking coefficient was introduced to improve the capability of withstanding phase shift errors in [11]. Dynamic adaptive thresholds and synchronization error compensation are combined in [12] to propose a new multi-terminal current differential protection criterion, while sensitivity is enhanced and the impact of synchronization deviation is suppressed. A method based on differential voltage was proposed to identify faulty lines in transmission systems in [13]. A method that is based on the distribution law of the amplitude of positive-sequence fault component voltage and combines it with the inverse-time characteristic equation to realize the online adaptive setting of protection parameters has been proposed in [14]. This method is not easily affected by capacitive current, but a discrimination dead zone exists. Such methods have better anti-interference capability than switch quantity algorithms but have high requirements for data synchronization and a heavy communication burden. The third category is multi-source information fusion algorithms that integrate information from electrical quantities and switch state quantities. A wide-area backup protection starting criterion based on the operation state of distance protection Zone III and the sum of current phasors injected into the bus is proposed in [10], and the actual faulty line is determined by calculating the voltage and current values at both ends of the line. Electrical quantities are combined with gray relational analysis in [15] to calculate the fault degree of lines for distinguishing faulty lines. Through this approach, the fault tolerance rate is improved, but high requirements are placed on the synchronization of waveform recording data. Sequence voltage sorting is used to screen suspected faulty lines, and protection action information is then fused for decision-making in [16]. A wide-area protection algorithm based on the comparison of fault charge quantities and improved evidence theory fusion is proposed in [17]. In this algorithm, fault charge quantities (electrical quantities) and distance protection activation information (switch quantities) are integrated. It is featured with low communication volume and can accurately identify faults under various error scenarios. However, in this method, when electrical quantities on one side are lost, the first evidence source will remain one, and in the subsequent fusion process, the result will tend to lean more towards line faults.
In summary, this paper presents a wide-area protection method for power systems grounded in multi-source information fusion criteria. The main contributions are outlined as follows: building upon existing applications of entropy and Gaussian similarity, this work introduces a two-dimensional “confidence weighting--consistency analysis” evaluation mechanism to achieve dynamic allocation of fusion weights. This is further coupled with a conflict adaptive factor, forming a coordinated optimization strategy that integrates “weight adjustment and fusion-strategy adaptation.” While inheriting the benefits of existing multi-source fusion approaches, the proposed method enhances algorithmic fault tolerance. In addition, a preprocessing step based on sequence voltage sorting is employed to narrow down suspected fault lines, thereby alleviating the communication burden in wide-area protection systems. PMU can use GPS clock signals to provide synchronous timing for the measured node voltages and line currents. Currently, the maximum timing accuracy of GPS reaches 1 microsecond, which provides strong hardware support for the wide-area backup protection algorithm proposed in this paper.
2. Selection Method of Suspected Fault Line in Wide-Area Backup Protection
2.1. Wide-Area Protection Structure
The wide-area backup protection system and existing traditional protection systems operate independently while achieving collaborative operation. Both jointly undertake the task of identifying and removing faults, providing dual guarantees for the safe and stable operation of power systems [18]. Wide-area protection structures can be divided into three categories based on the location of the central station: substation-centralized, regional-centralized, and distributed. Among them, the regional-centralized type has broad application prospects, and this paper will adopt the regional-centralized protection structure; the specific structure is shown in Figure 1.
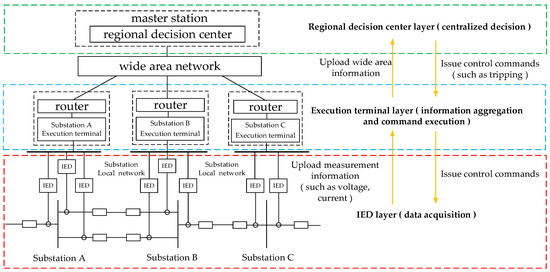
Figure 1.
Structure diagram of regional centralized wide-area backup protection.
In the specific deployment of the regional centralized architecture, the power grid is divided into several sub-regions. Each region is equipped with a single decision-making central station (master station), and the remaining substations operate collaboratively as slave stations. The master station has a built-in core decision-making module, while the slave stations are configured with substation execution terminals, forming a hierarchical “hub-node” relationship. From the perspective of structural hierarchy, data flow and control execution present a three-level architecture: the bottom level consists of IEDs (Intelligent Electronic Devices), which are responsible for collecting analog quantities, switching quantities, and various state parameters at their installation points. They complete information aggregation through the intra-substation local area network and upload it to the regional decision-making center. The middle level is composed of substation execution terminals, whose core function is to aggregate wide-area data from the underlying IEDs and transmit it to the regional decision-making center, while receiving control commands from the center, and executing them on-site. The top-level regional decision-making center serves as the core hub. On one hand, it collects global information uploaded by all slave station execution terminals in the region; on the other hand, it conducts comprehensive analysis and judgment in combination with the power grid topology model, generates control strategies, and then issues them to the execution terminals of the corresponding slave stations.
2.2. Suspected Fault Line Screening Method
To mitigate wide-area communication traffic, rather than comparing data acquired from all lines, suspected faulty lines can be identified by leveraging the variation characteristics of the zero-sequence voltage on each line’s bus subsequent to a fault [19]. This is because, upon the occurrence of a fault, the positive-sequence voltage at the bus of the faulty line diminishes, while its zero-sequence and negative-sequence voltages rise correspondingly. Based on this principle, the startup criterion for the slave station can be derived, as exemplified by Equation (1).
where , , , represent the magnitudes of the positive-sequence, negative-sequence, and zero-sequence voltages of the bus before and after the fault, respectively.
This paper sorts the positive-sequence voltages of all buses satisfying the startup criterion in ascending order and the negative (zero)-sequence voltages in descending order. It takes the union of the top three in these rankings as the final suspected faulty buses, and the lines connecting these suspected faulty buses are the screened suspected faulty lines.
3. Protection Algorithm Based on Confidence Weighting and Collision Adaptation
3.1. Construct a Basic Probability Function
Upon the occurrence of a fault, the main protection and Zone I of distance protection operate instantaneously. If they function correctly, the fault will be cleared promptly, rendering wide-area protection unnecessary. However, if the transmitted information is lost or erroneous, such data could introduce negative interference and increase communication load. Therefore, this paper only utilizes the information from Zone II and Zone III of distance protection as the switching state variables.
Therefore, the information collected in this paper is as follows: ① electrical quantity information, that is, the amount of zero sequence fault charge and the amount of phase difference current charge on both sides of the suspected fault line and ② the protection element status information, that is, the starting information of the distance protection section II and section III. Specifically, as shown in Figure 2.
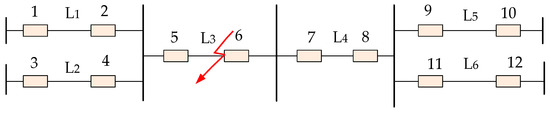
Figure 2.
Simple fault wiring diagram.
In Figure 2, the protection information domain of the fault line L3 is as follows: (1) the electrical quantities on both sides of the line; (2) 5, 6 distance protection section II and section III of the line L3; and (3) the distance protection section II and section III of the adjacent lines 1, 3, and 8 in the positive direction.
3.1.1. Fundamental Probability Function of the Polarity of the Zero-Sequence Current Charge
Considering the maximum probability of grounding fault in the line, the basic probability function of zero sequence current charge polarity is constructed based on the same direction of zero sequence current on both sides of the fault line and the opposite direction on both sides of the normal line.
According to the definition of fault charge in [20], this paper defines the integral value of zero-sequence fault current in a period of time as zero-sequence fault charge as follows:
where is the zero-sequence fault component current. is the cumulative value of samples of the fault current within time. is the sampling interval.
If an internal fault occurs, the polarities of the zero-sequence fault charge quantities on both sides of the line within half a cycle should be the same; for an external fault, they should be opposite.
where and are the polarities of the zero-sequence fault charge quantities on both sides of the line, respectively. Therefore, if = 1, it indicates an internal fault; if = 0, it indicates an external fault. Considering a certain degree of information fault tolerance, = 0.5 when the zero-sequence charge quantity on one side is lost.
Therefore, define the basic probability assignment function for the polarity of zero-sequence fault charge quantity as follows:
3.1.2. The Basic Probability Function of Charge Polarity of Phase Difference Current
When the system does not detect the zero-sequence current fault charge quantity, it indicates that a phase-to-phase fault has occurred. Therefore, the polarity of the phase-difference current is constructed: in the case of an internal fault, the differential currents at both ends have the same polarity; in the case of an external fault, the differential currents at both ends have opposite polarities.
Define the phase-difference current charge quantity as shown in Equation (5) as follows:
where and denote the phase-difference charge quantities at both ends of the line, respectively, where xy represents ab, bc, and ca, respectively.
Similarly, according to Equation (3) defined as follows:
Accordingly, if , it indicates an internal fault; if , it signifies an external fault. Accounting for a certain degree of information fault tolerance, when the phase—difference charge quantity on one side is missing. Since calculations are carried out for the three phase pairs (ab, bc, ca) and the maximum value among these three computations is adopted, the basic probability assignment function for the polarity of the phase—difference current charge quantity, denoted as , is defined as follows:
In this paper, the basic probability assignment function for the polarity of the phase-difference current charge quantity and that for the polarity of the zero-sequence fault charge quantity do not participate in the subsequent fusion process simultaneously.
3.1.3. The Basic Probability Function of the Starting Information of the Distance II and III of This Line
In this paper, the start-up signals of the distance II and III protection at both ends of the suspected fault line are collected, and the fault correlation coefficient of the line is set.
where and represent the activation information of Zone II and Zone III of distance protection on one end of the line; and represent the activation information of Zone II and Zone III of distance protection on the other end; a and b are the weight coefficients for Zone II and Zone III, respectively.
It is considered that the probability of a fault occurring at each point is the same in [21,22]. The reach of distance protection Zone II can be extended to 25% of the next-level line after the branch coefficient is taken into account, and the reach of distance protection Zone III can be extended to 100% of the next-level line. Thus, the weights a and b can be set as 0.8 and 0.5, respectively. At this point, the correlation coefficient is expressed as follows:
The threshold value of the fault correlation coefficient for the line in this paper is determined with reference to [17], which is calculated as the average value of the fault correlation coefficient when faults occur at the line head, mid-point, and line end. When faults occur at the line head, mid-point, or line end, both Zone II and Zone III of the line’s distance protection will be activated, with all activation signals being 1. Therefore, the fault correlation coefficient in all three cases is ((0.8 + 0.8) + (0.5 + 0.5) = 2.6) and, thus, the threshold value is set to 2.6.
Thus, the basic probability assignment function for Distance Protection Zone II and Zone III of this line, denoted as as follows:
where is the fault correlation coefficient of the distance II and III protection of the line. 2.6 is the threshold value of the fault correlation coefficient of the line. When it is greater than the threshold value, the fault of the line can be judged. Equations (9) and (10) in this paper are only used for calculating the fault correlation coefficient of the distance protection for the current line, and they have an independent relationship with Equations (11) and (12) presented later in the paper.
3.1.4. The Basic Probability Function of the Positive Adjacent Line Distance II and III Initiation Information
A failure of the master station will cause the wide-area protection system to lose central In this paper, the starting signal of the protection of the II and III sections of the distance between the adjacent positive direction adjacent lines at both ends of the suspected fault line is collected, and the positive direction adjacent line fault correlation coefficient is set to represent the positive direction adjacent line distance protection. The discriminant result of the line fault or not, the calculation expression is expressed as Equation (11).
where and are the activation information of Zone II and Zone III distance protection of adjacent lines in the positive direction.
The fault correlation coefficient of adjacent lines in the positive direction reflects the judgment result of the distance protection activation signal of adjacent lines on the suspected faulty line. Assuming the number of adjacent lines in the positive direction is , its setting value is determined with reference to [15] and set to (0.63×).
Thus, the basic probability assignment function for Zone II and Zone III distance protection of adjacent lines in the positive direction, denoted as as follows:
where is the positive direction adjacent line fault correlation coefficient. 0.63 is the threshold value of the fault correlation coefficient of the adjacent line in the positive direction. When it is greater than the threshold value, the fault of the line can be judged. x represents the number of positive adjacent lines.
3.2. Confidence Weighting and Consistency Analysis
3.2.1. Standardized Information Entropy
The information entropy proposed by Deng Yong measures the uncertainty of evidence in [23]. When the value of the basic probability function is close to 0.5, the entropy is maximum (with the highest uncertainty); when it is close to 0 or 1, the entropy is minimum (with the highest certainty).
Using Equation (13), calculate the entropy value of the basic probability function itself as follows:
where is the information entropy. is the basic probability function.
3.2.2. Confidence Mapping
The confidence level is obtained by subtracting the entropy value from 1. In this way, the confidence level is inversely proportional to the entropy value; that is, the larger the entropy, the lower the confidence level.
where is the confidence level of the basic probability function .
3.2.3. Similarity Calculation
In the multi-source information fusion of wide-area protection, the consistency analysis of basic probability function is the core link to detect the degree of conflict between multi-source criteria. The process is based on the Gaussian similarity theory and is realized by Equation (15).
where is the similarity between basic probability functions; in this paper. is the scale parameter. This paper takes 0.316. When and are closer, is higher (close to 1); the greater the difference between them, the lower the similarity (close to 0).
3.2.4. Conformance Assessment
In the wide-area protection multi-source information fusion system, consistency evaluation is a key link in quantifying the degree of similarity between a single basic probability function and the whole. This calculation process is based on the similarity matrix and is realized through the following Equation (16).
where is the coefficient of consistency between the i th basic probability function and all other probability functions, that is, the average value of its similarity to the other probability functions. n is the total number of basic probability functions. Equation (16) is to evaluate the compatibility of a single probability function with the whole. The probability function with high consistency is more reliable and should be given higher weight in fusion.
3.2.5. Comprehensive Evaluation and Weight Allocation
By integrating the aforementioned confidence evaluation and consistency analysis, the comprehensive evaluation coefficient of the basic probability function is obtained as follows:
where is the comprehensive evaluation coefficient of the i th evidence, which combines its confidence and consistency. Evidence with high confidence and good consistency has a higher basic probability function and a higher comprehensive evaluation coefficient. Its purpose is to comprehensively evaluate the reliability of evidence and avoid relying solely on a single indicator.
By dividing the comprehensive evaluation coefficient of a single basic probability function by the sum of the comprehensive evaluation coefficients of all basic probability functions, the total weight is ensured to be 1, and Equation (19) is obtained. Its purpose is to dynamically allocate weights so that reliable evidence dominates decision-making.
where is the fusion weight value of the i th probability function. is the composite score of the i th probability function.
3.3. Conflict Adaptive Factors
Define the conflict factor, and dynamically adjust the fusion strategy according to the degree of conflict between basic probability functions in the system.
where is the conflict factor; is the number of basic probability functions.
Depending on the differences in conflict factors, different combinations of coefficients are formed, which are used in the final fusion process. When the conflict degree between multi-source criteria is low (such as the polarity criterion of zero-sequence current charge and the starting criterion of distance protection are clearly directed to the fault line, and the conflict factor K < 0.1), it indicates that the information consistency is high. At this time, the coefficient combination of (0.9,0.1) is adopted, and the fusion result obtained by confidence weighting is preferentially trusted. When the degree of conflict is moderate (0.1 ≤ K < 0.3), it means that some criteria are uncertain (such as the loss of single electrical quantity information leading to the ambiguity of criterion output). It is necessary to reduce the proportion of weighted results and improve the influence of high-confidence correction results by a (0.7,0.3) coefficient combination to balance the information conflict. When the degree of conflict is high (K ≥ 0.3) (such as when protection misoperation and information loss occur at the same time, the conclusion of multi-source criterion is significantly different), the coefficient combination of (0.5,0.5) is adopted so that the weighted results and the corrected results are equally involved in the fusion so as to avoid misjudgment caused by a single information source leading decision-making.
where and are the weight values for the subsequent final fusion.
3.4. Converged Decision-Making
(1) Weighted average: Weightedly fuse each basic probability function using the weights obtained from Equation (18). The purpose is to initially fuse all the evidence to obtain the overall failure probability.
where is the fusion weight value of the i th probability function. is the weighted average fault probability value of fusion decision.
(2) High-confidence correction: Based on the confidence obtained from Equation (14), correct the probability functions for which the high confidence is greater than 0.8 and the basic probability function is greater than 0.05 (to avoid interference from zero probabilities). The purpose is to give priority to relying on high-confidence evidence when there is a large conflict and avoid the influence of unreliable evidence.
where is the fault probability value of high confidence correction of fusion decision. is a weighted probability value with confidence greater than 0.8 and its own probability value greater than 0.05.
If there is no high confidence in the basic probability functions, weighted fusion is also adopted.
Combining the coefficients obtained from Equation (20) with Equation (21) and Equation (22), the fault probability function is obtained.
where is the fault probability value of the final output after weighted average and high confidence correction.
After many simulation experiments, it can be concluded that when the suspected fault line is calculated by Equation (23) > 0.78, it can be judged as a fault line.
4. Wide-Area Protection Algorithm Flow
The process of the wide-area protection algorithm aims to achieve accurate identification of faulty lines through the coordinated operation between substations and the master station. It is based on screening suspected faulty lines and combines multi-source information fusion with intelligent decision-making. Figure 3 presents the flowchart of the algorithm in this paper. The specific process is as follows:
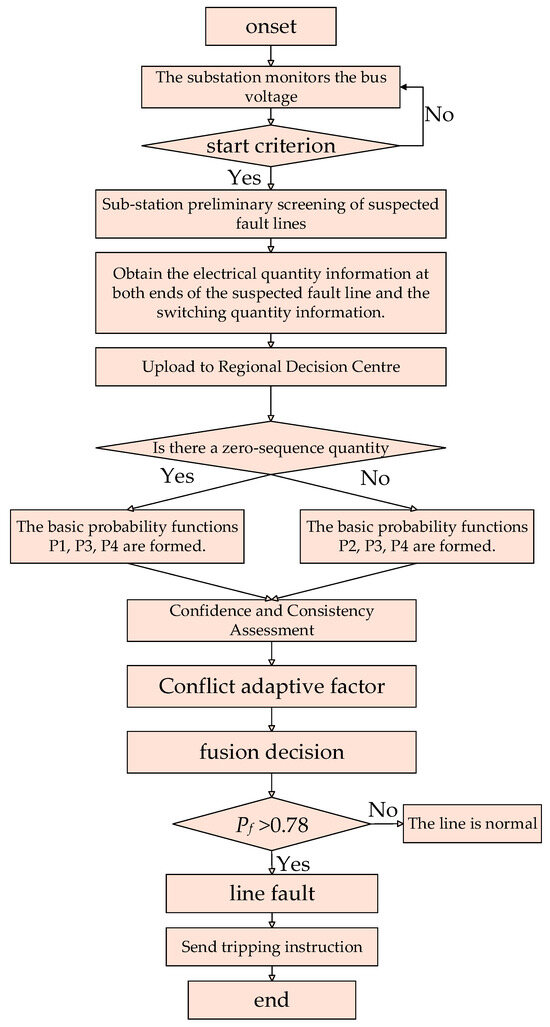
Figure 3.
Protection algorithm flow chart.
(1) Sub-station process
After the initial screening of the suspected fault line fault, the substation selects the suspected fault bus by sorting the sequence voltage of the bus satisfying the start criterion of Equation (1) and uploads the electrical quantity and protection start quantity information of the suspected fault line between the suspected buses.
(2) Main station process
(a) Data preprocessing, forming the basic probability function, obtaining the electrical quantity information and protection start-up information on both sides of the suspected fault line, preprocessing the relevant data, forming the basic probability function of zero sequence charge polarity, the basic probability function of phase difference current charge polarity, the basic probability function of distance protection information of this line, and the basic probability function of distance protection information of a square first adjacent line.
(b) The fault line is identified, and the basic probability function obtained above is fused to output the comprehensive value of the line fault probability. When > 0.78, it is judged to be a fault line.
5. Simulation Analysis
In order to verify the effectiveness of the algorithm, this paper uses the IEEE Standard 10-machine 39-bus system. The line voltage level is 330 kV. The simulation is carried out in PSCAD4.6.2, and the algorithm is programmed by MATLAB2024a. As shown in Figure 4, the red area is the research region of this paper. A fault is set to occur at 0.3 s at the 12.5% (), 50% (), and 87.5% () positions of transmission line near bus .
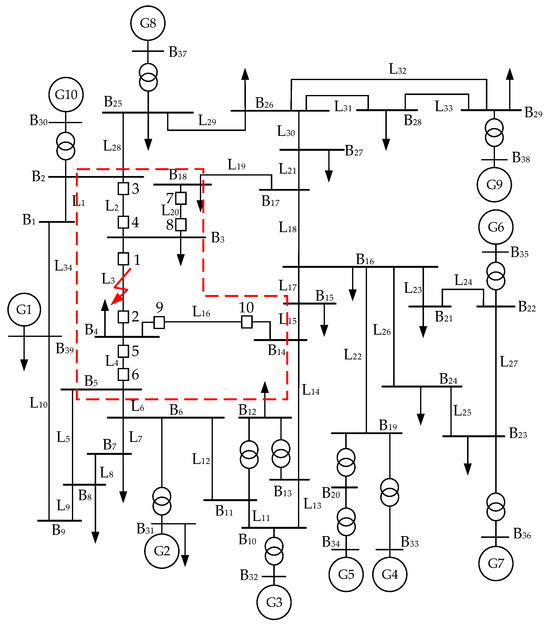
Figure 4.
IEEE 39-node topology diagram.
5.1. Protection Performance Analysis Under Different Fault Locations and Fault Types
To verify the effectiveness of the proposed algorithm, single-phase metallic grounding faults and interphase faults occur, respectively, at different positions of -. The reference voltage of the bus is 345 kV, and the sequence voltage results of the buses within the region are shown in Table 1 and Table 2.

Table 1.
Bus sequence voltage results from different fault positions of metallic grounding faults.
Table 2.
Bus sequence voltage results from different fault positions between phase faults.
The bus sequence voltage data in Table 1 and Table 2 clearly show the differential variation law of bus sequence voltage after fault, which provides direct data support for the subsequent screening of suspected fault lines. In the metal grounding fault scenario, the positive sequence voltage of the fault line-associated bus (such as the target bus corresponding to the fault location , , ) is significantly reduced (as low as 120.41 kV), while the negative sequence voltage and zero sequence voltage are significantly increased (up to 67.06 kV), which is completely consistent with the theoretical variation characteristics of the lower sequence component of the grounding fault-grounding fault will destroy the symmetry of the system, resulting in negative sequence and zero sequence components. The closer the fault point is to the bus, the more significant the sequence voltage changes. In the phase-to-phase fault scenario, since there is no zero-sequence component in the phase-to-phase fault, the zero-sequence voltage of all buses is 0, and the negative-sequence voltage (up to 66.12 kV) fluctuates regularly with the change in fault location. The downward trend of positive-sequence voltage (as low as 101.81 kV) is consistent with that of ground fault. However, the change range is slightly different due to the difference in fault type. The sequence voltage data of the two types of faults verify the core premise that the sequence voltage characteristics of the bus after the fault can be used as the basis for the screening of suspected faults, which lays a reliable data foundation for the subsequent locking of suspected fault buses and lines by sequence voltage sorting.
The screening results of suspected fault lines in Table 3 and Table 4 directly prove the effectiveness and practicability of the screening method based on ‘sequence voltage sorting’. From the results, it can be seen that whether the fault type is ground fault or phase-to-phase fault, whether the fault location is at the head end , middle end or end of the line, the selected suspected fault line set contains the actual fault line , and the number of suspected lines is controlled within 2–3. The value of this result lies in the following: on the one hand, through the sequence voltage sorting (positive sequence voltage ascending sequence, negative/zero sequence voltage descending sequence, taking the top three buses and related lines), the lines that may be involved in the fault are accurately locked, and the blind analysis of all lines in the whole network is avoided; on the other hand, the number of suspected lines is controlled in a small range (not the whole network line), which reduces the amount of information for subsequent data processing and communication transmission of the master station. The master station only needs to receive the electrical quantity and protection start-up information of the suspected line and does not need to process the whole network line data, which directly reduces the communication load of the wide-area protection system, which is in line with the core goal of the paper, ‘reducing communication traffic’. At the same time, the consistency of the screening results under the two types of fault scenarios also proves that the screening method is not affected by the fault type and fault location and has good versatility.
Table 3.
Selection results of suspected fault lines for metallic grounding faults.
Table 4.
Selection results of suspected fault lines for interphase faults.
Perform algorithmic judgment on each suspected faulty line screened out under different fault types and different fault locations. The judgment results are shown in Table 5 and Table 6 below.
Table 5.
Judgment results of single-phase metallic grounding fault.
Table 6.
Judgment results of fault lines between phase faults.
The judgment results of single-phase metal grounding fault in Table 5 fully verify the accuracy and fault discrimination ability of the proposed algorithm in typical grounding fault scenarios. It can be seen from the data that for the actual fault line , at the fault location , , , the final calculated fault probability is 0.9874, 0.9734, and 0.9874, respectively, which is much higher than the set fault determination threshold (0.78), and the value is stable above 0.97, indicating that the algorithm can give clear and reliable fault determination results for grounding faults at different locations. For non-fault lines, the fault probability is lower than 0.22, far lower than the threshold, and the value is stable at a low level, without the risk of misjudgment. The overall results show that the proposed algorithm can accurately distinguish the fault line from the non-fault line in the grounding fault scenario and is not affected by the change in the fault location, and the core discrimination performance is stable and reliable.
Table 6 verifies the applicability and discrimination accuracy of the algorithm in the non-grounded fault scenario for the judgment results of phase-to-phase faults. Different from the ground fault, the phase-to-phase fault has no zero-sequence component. Therefore, the table annotation clarifies that the zero-sequence current charge polarity basic probability function does not participate in the fusion. This logic adjustment fully conforms to the electrical characteristics of the phase-to-phase fault, reflecting the flexibility of the algorithm criterion selection. From the results, the fault probability of the actual fault line at the fault location , and is above 0.97 (0.9874, 0.9734, 0.9874), which is more than the judgment threshold of 0.78, and the numerical fluctuation is very small, indicating that the algorithm has high stability for the identification of phase-to-phase faults. The fault probability of the non-fault line is lower than 0.22, and there is no misjudgment. This result proves that the algorithm can adaptively select the matching criterion combination according to the fault type and still maintain accurate fault line identification ability in the phase-to-phase fault scenario, which further verifies the versatility and reliability of the algorithm.
5.2. Fault Tolerance Analysis of Protection Algorithms
(1) Taking the phase A metallic ground fault of at position as an example, the fault-tolerant performance of protection under information loss is verified. The suspected faulty lines are and .
Case 1: The zero-sequence current charge quantity on the side of close to is lost, and the distance section II of the IED2 device close to is lost;
Case 2: The zero-sequence current charge quantity on the side of close to is lost, and both distance sections II and III of IED7 on the side close to are lost.
In Table 7, the fault tolerance ability of the algorithm is verified in two extreme scenarios of ‘partial loss of electrical quantity and switching quantity’ under the background of phase A metallic ground fault. In the normal scenario, the fault probability of the fault line is 0.9874, the non-fault line is 0.2121, and the discrimination result is clear. In the scenarios of Case1 near side zero-sequence current charge loss, near side IED2 distance II segment loss) and Case2 near side zero-sequence current charge loss, near side IED7 distance II/III segment loss), the fault probability of the fault line is 0.8029 and 0.9838, respectively, which are higher than the threshold of 0.78, and can still be accurately determined as the fault line; the fault probability of the non-fault line is reduced to 0.0883 and 0.2121, respectively, and there is no risk of misjudgment. The reason for this result is that the algorithm dynamically allocates weights through the “confidence-consistency” two-dimensional evaluation. When some information is lost, the confidence of the basic probability function corresponding to the lost information is reduced, and the fusion weight is automatically reduced. The weight of other complete information (such as the distance protection information of adjacent lines) is increased accordingly, and the influence of lost information is offset by the complementarity of multi-source information. The results fully prove that the algorithm can still maintain high fault discrimination accuracy and has good fault tolerance performance in some information loss scenarios.
Table 7.
A fault discrimination results under different conditions of phase grounding.
(2) Take the AB phase-to-phase short circuit of at position as an example. Since the basic probability takes the maximum value of the polarity of the differential charge quantity for three times (ab, bc, ca), losing any 1 or 2 differential current charge quantities will not affect the accurate judgment of . For the faulty line, consider the loss of more than 3 differential charge quantities under extreme environments; for the normal line, it is sufficient to consider the loss of any one differential current charge quantity.
Case 1: For , the differential charge quantities of ab, bc, and ca on the side close to B3 are lost, and the distance section III signal of IED1 on the side close to is lost;
Case 2: For , one differential current charge quantity on the side close to is lost, and the distance section II and III signals of IED6 on the side close to are lost.
Taking the AB phase-to-phase short-circuit fault as the background, Table 8 further verifies the fault tolerance of the algorithm in the scenario of ‘partial loss of electrical quantity (phase difference current charge) and distance protection’, and designs a more realistic loss scenario for the criterion characteristics of phase-to-phase fault. In the normal scenario, the fault probability of the fault line is 0.9874, which is accurate. In the extreme scenario of Case1 near side ab/bc/ca phase difference charge loss, near side IED1 distance III loss), because the algorithm adopts the calculation logic of ‘taking the three-phase maximum’ for the phase difference current charge (Equation (7)), even if the three-phase difference charge is all lost, the criterion failure is avoided by setting the fault-tolerant mechanism with the basic probability of 0.5 when lost. At the same time, the weight of other complete information (such as the distance of this line to section III and the distance protection of adjacent lines) is increased, and finally the fault probability of the fault line is reduced to 0.8585 (still higher than the threshold), and the non-fault line is reduced to 0.1633. In Case2 near side 1 phase charge loss, near side IED6 distance II/III segment loss) scenario, the probability of a fault line is 0.9838, which is close to the normal scene level. The results show that the algorithm designs a special fault-tolerant mechanism for the criterion characteristics of phase-to-phase faults (taking the maximum value of phase difference charge and setting the fault-tolerant value when it is lost). Even in the extreme scenario where multiple types of information are lost at the same time, the algorithm can still ensure the accurate identification of fault lines through multi-source information complementation and dynamic weight distribution, which further verifies the fault-tolerant ability of the algorithm in the scenario where phase-to-phase fault information is lost.
Table 8.
Fault discrimination results under different conditions of AB interphase short circuit.
(3) Taking the phase A metallic grounding fault of at position as an example, verify the fault tolerance performance of the protection when the distance protection zones II and III at both ends of the line refuse to operate successively. Numbers 1 to 4, respectively, represent: the refusal of distance protection zone II to operate on the side of close to ; the refusal of distance protection zones II and III to operate on the side of close to ; the refusal of distance protection zones II and III to operate on the side of close to and the refusal of distance protection zone II to operate on the side close to ; and the refusal of distance protection zones II and III to operate at both ends of . The judgment results are shown in Table 9.
Table 9.
Judgment results of protection misactivation faults.
Table 9 takes the A-phase grounding fault as the background, and aims at the four extreme scenarios of “the fault line is successively rejected from the II/III section at both ends of the fault line ” (from single-ended single-segment rejection to double-segment rejection at both ends). The fault-tolerant ability of the algorithm for serious abnormal conditions such as “protection rejection” is verified. From the results, it can be seen that with the increase in the degree of rejection (Scenario 1 to Scenario 4), the fault probability of the fault line gradually decreases from 0.9381 to 0.7954, but it is always higher than the threshold of 0.78, which can still be accurately determined as the fault line; the fault probability of the non-fault line is gradually reduced from 0.2121 to 0.0099, and the discrimination result is clearer.
The key to this result is that when the distance protection refuses to operate, the consistency evaluation coefficient of the corresponding basic probability functions (, ) decreases (the matching degree with other criteria decreases), and the fusion weight automatically decreases, while the weight of electrical quantity information (such as zero-sequence current charge polarity, which is not lost at this time) is significantly improved—zero-sequence current charge polarity is the core criterion of grounding fault. Even without the support of distance protection information, it can still dominate the fusion decision through its own high confidence. Especially in the most extreme case of scenario 4 (the distance between the two ends of the II/III section is completely rejected), the fault probability is only reduced to 0.7954, which is only 0.0154 higher than the threshold. It is just proved that the algorithm can still rely on the complementarity of electrical quantity information to realize fault discrimination when the protection is completely failed, which fully verifies the fault tolerance of the algorithm for the protection rejection scenario.
(4) According to the fault scenario of the above (3), the fault tolerance of the protection is verified when the distances II and III in the non-positive direction of the L20 line are mistakenly operated in turn. 1~2 represent the maloperation of distance II and III, respectively. The judgment results are shown in Table 10.
Table 10.
Judgment results of protection malfunction fault.
Table 10 takes the A-phase ground fault as the background and verifies the anti-interference ability of the algorithm for the two types of scenarios of ‘non-fault line non-positive direction distance II/III section mis-operation in turn’. The core risk of protection misoperation is that the misoperation signal will simulate the fault characteristics, which may cause the non-fault line to be misjudged as the fault line. From the results, in scenario 1 non-positive direction distance II section misoperation) and scenario 2 non-positive direction distance II/III section misoperation) the fault probability of the fault line is always stable at 0.9734, without any fluctuation, indicating that the misoperation signal does not interfere with the identification of the fault line. The fault probability of the non-fault line increases from 0.2942 to 0.7550. Although there is a significant increase, it is still lower than the threshold of 0.78 and is not misjudged as a fault line. The results show that the algorithm can effectively identify and suppress the interference of the protection misoperation signal and avoid the misjudgment of non-fault lines.
5.3. Robustness Analysis of Protection Algorithm
5.3.1. Noise Interference Analysis
In the actual operation scenario of the power system, the electrical quantity acquisition link is susceptible to factors such as equipment accuracy deviation and electromagnetic environment disturbance, resulting in noise interference, which may lead to distortion of the input information of the protection criterion, thereby affecting the accuracy of fault identification. Taking the metal fault of at position as an example, the noise interference of 15 dB and 25 dB is set, respectively, to verify the reliability of the protection algorithm when the electrical quantity information is disturbed by noise. The specific results are shown in Table 11 and Table 12.
Table 11.
Judgment results of fault line under different noise interference.
Table 12.
Judgment results of non-fault line under different noise interference.
The results of Table 11 and Table 12 show that although the value of zero-sequence charge (such as , , , ) of fault line and non-fault line fluctuates to a certain extent under different intensity noise interference, the corresponding polarity criterion (such as the basic probability function m1m1 of zero-sequence charge polarity) does not flip, and can still correctly reflect the fault characteristics. This shows that the charge polarity criterion constructed in this paper has a certain noise tolerance ability, and it is not easy to misjudge due to small fluctuations in electrical quantities. More importantly, under the multi-source information fusion framework, even if individual electrical quantities are biased due to noise interference, the system can still dynamically evaluate the confidence and consistency of each criterion through standardized information entropy and Gaussian similarity and automatically reduce the fusion weight of unreliable information, thereby maintaining the stability of the overall decision. Therefore, although the charge value changes, the final fault probability output of the algorithm remains stable, which further verifies its strong robustness and practicability in noisy environments.
5.3.2. Data Packet Loss Analysis
In order to verify the reliability of the algorithm in the scenario of data packet loss caused by communication network congestion or network attack, taking the metal grounding fault of at position as an example, the data packet loss rates of 10% and 20% are set, respectively, for testing. As shown in Figure 5 and Figure 6, the signal diagram after the loss of electrical data packets at both ends of and .
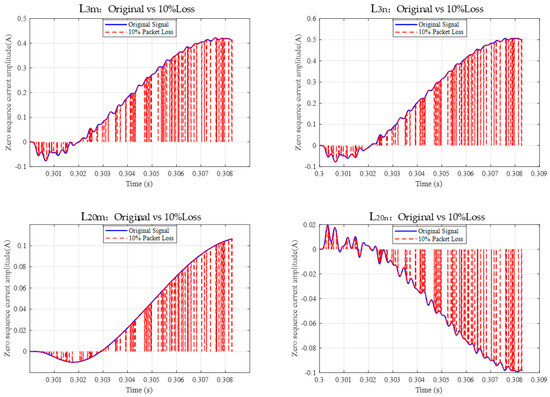
Figure 5.
Comparison of 10% random loss of electrical data at both ends of and .
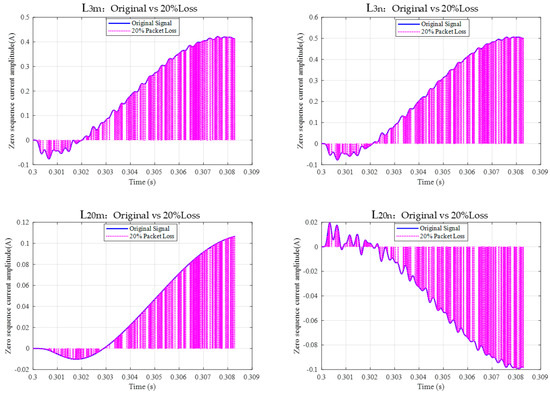
Figure 6.
Comparison of 20% random loss of electrical data at both ends of and .
Figure 5 (10% loss rate) and Figure 6 (20% loss rate) show the waveform changes in electrical quantities at both ends of and lines after packet loss. It can be seen in the diagram—the normal waveform is continuous and complete, and the waveform appears to have breakpoints or missing segments after loss. Even if the data packet is lost, the polarity characteristics of the charge (such as the positive and negative directions) do not flip, indicating that the charge polarity criterion has a certain tolerance for data loss. The waveform diagram intuitively reflects the actual situation of data loss and provides a real input scene for subsequent algorithm processing.
The algorithm is verified based on the above packet loss situation, and the results are shown in Table 13 and Table 14 below.
Table 13.
Judgment results of fault line L3 under different data packet loss rates.
Table 14.
Judgment results of non-fault line L20 under different data packet loss rates.
Table 13 (fault line ) and Table 14 (non-fault line ) compare the fault probability under normal, 10% loss, and 20% loss conditions. For line: under normal, 10% loss and 20% loss, is always 0.9734, which is much higher than the threshold of 0.78, which can accurately determine the fault line. For line: is kept at 0.2121, far below the threshold, and there is no risk of misjudgment. The packet loss does not affect the final fault identification result, indicating that the algorithm is robust. Even if the charge value fluctuates (such as the zero-sequence charge of decreases from 1.8726 C to 1.4704 C), its polarity does not change, and the basic probability function can still correctly reflect the fault characteristics.
5.4. Comparative Analysis with Other Methods
Taking the A-phase metal grounding at the position of as an example.
Case 1: The distance protection amount in the IED device on both sides of is lost.
Case 2: The distance protection in IED1 near side of is lost and the distance II section of IED8 near of is malfunctioned.
In these two cases, the performance comparison between the proposed algorithm and the improved evidence theory in Reference [17] is verified. The verification results are shown in the following Figure 7 and Figure 8.
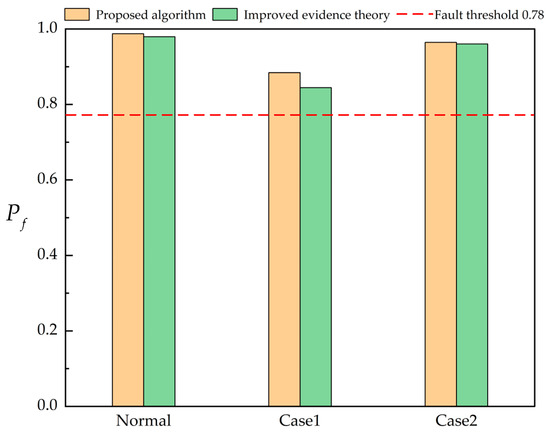
Figure 7.
Comparison of discriminant results of fault line under different methods.
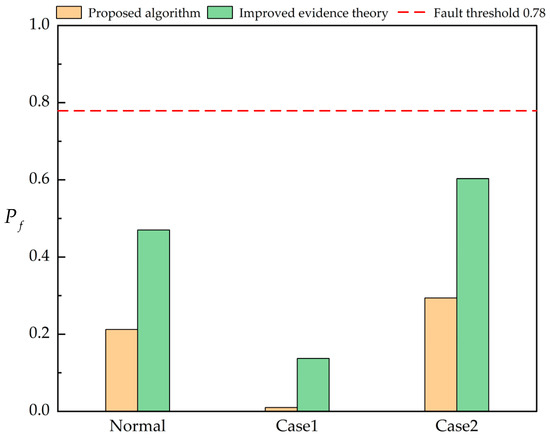
Figure 8.
Comparison of discriminant results of non-fault line under different methods.
From the comparison results, in the three cases of normal, Case 1 and Case 2, the fault probability pf calculated by the algorithm proposed in this paper is better than the result of the improved evidence theory in [17]. Under normal conditions, the of the algorithm in this paper is close to 1, and the of the algorithm in the literature [17] is also higher, but the algorithm in this paper is closer to the ideal fault probability value; in the case of Case 1 and Case 2, which have the disadvantage of loss or misoperation of distance protection, the algorithm in this paper has a smaller decrease in the fault probability of fault line L3 than that in [17]. Compared with the non-fault line , the fault probability of the algorithm in this paper still maintains a low level in the case of information loss, and the fault tolerance rate is higher than that of the [17,18,19,20,21,22,23] algorithm.
6. Conclusions
Aiming at the low fault tolerance and large communication traffic of the existing wide-area protection algorithm, this paper proposes a new wide-area backup protection algorithm based on confidence weighting and conflict adaptation. Through theoretical analysis and simulation verification, the following conclusions can be drawn:
(1) The mechanism of screening suspected fault lines through sequence voltage ranking allows the substation to upload only the electrical quantities and protection activation information of the suspected lines, rather than all line data within the protection zone, thereby reducing communication traffic. However, this screening approach relies on the significant variation characteristics of bus sequence voltage after a fault. In the presence of severe harmonic interference or sudden bus load changes in the grid, the sequence voltage characteristics may become indistinct, affecting the accuracy of suspected line screening. Further optimization incorporating filtering algorithms or load correction models is therefore necessary.
(2) Four basic probability assignment functions are constructed based on the polarity of zero-sequence current variation, phase-current variation, and the activation of Section II/III distance protection for both the local line and its adjacent lines. This forms a multi-dimensional criterion system covering ground faults and phase-to-phase faults. In typical fault scenarios such as single-phase metallic grounding and AB phase-to-phase short circuits, the system provides an effective basis for fault identification. However, performance under practical conditions—such as communication delays and high renewable energy penetration—has not yet been validated. Subsequent research will expand the study to enhance the applicability of the findings in real engineering scenarios.
(3) This paper enhances the contribution of high-reliability information in fusion decision-making by introducing standardized information entropy to quantify the confidence level of criteria and combining Gaussian similarity to analyze the dynamic weight allocation mechanism for information consistency. The designed conflict adaptive factor can adjust the fusion strategy adaptively based on the degree of information conflict, ensuring accurate fault line identification even in simulation scenarios such as “partial electrical quantity loss” and “distance protection rejection/misoperation.” However, it should be noted that the robustness verification of the current algorithm is limited to the radial grid topology of the IEEE 39-node system and does not involve complex grid structures incorporating multi-terminal flexible DC and high penetration of renewable energy. Additionally, the simulation does not account for extreme cases where communication link delays exceed 100 ms. In such scenarios, reduced synchronization of multi-source information may affect the fusion decision-making performance. Future work should further expand the algorithm’s adaptability to complex grid topologies and incorporate a communication delay compensation mechanism to improve its scalability.
Author Contributions
Conceptualization, Z.L.; methodology, W.H.; validation, B.T.; formal analysis, G.H.; investigation, F.C.; data curation, X.L.; writing—original draft preparation, S.W.; writing—review and editing, Y.W. All authors have read and agreed to the published version of the manuscript.
Funding
This research was funded by Science and Technology Project of State Grid Henan Electric Power Company, grant number 521702250006. And The APC was funded by Science and Technology Project of State Grid Henan Electric Power Company.
Data Availability Statement
The original contributions presented in this study are included in the article. Further inquiries can be directed to the corresponding author.
Acknowledgments
We would like to thank the editor and the anonymous reviewers for their valuable feedback. We also appreciate the contributions of everyone who supported this research.
Conflicts of Interest
The authors Zhen Liu, Wei Han, Gaofeng Hao, Fengqing Cui and Xiaoyu Li were employed by State Grid Henan Electric Power Research Institute. The author Baojiang Tian was employed by the State Grid Henan Electric Power Company. The remaining authors declare that the research was conducted in the absence of any commercial or financial relationships that could be construed as a potential conflict of interest.
References
- Neyestanaki, M.K.; Ranjbar, A.M. An adaptive PMU-based wide area backup protection scheme for power transmission lines. IEEE Trans. Smart Grid 2015, 6, 1550–1559. [Google Scholar] [CrossRef]
- Mohsenian-Rad, H.; Kezunovic, M.; Rahmatian, F. Synchro-Waveforms in Wide-Area Monitoring, Control, and Protection: Real-World Examples and Future Opportunities. IEEE Power Energy Mag. 2025, 23, 69–80. [Google Scholar] [CrossRef]
- Sarmin, M.K.N.M.; Saadun, N.; Azmi, M.T.; Abdullah, S.K.S.; Yusuf, N.S.N.; Zamani, A.Z.M.; Vaiman, M.; Vaiman, M.; Povolotskiy, M.; Karpoukhin, M. Revolutionizing the Grid of the Future with a Wide-Area Monitoring and Control System: Phasor Measurement Unit Applications in Grid Control, Protection, and Event Analysis at Tenaga Nasional Berhad. IEEE Power Energy Mag. 2025, 23, 47–58. [Google Scholar] [CrossRef]
- Vahidi, S.; Ghafouri, M.; Au, M.; Kassouf, M.; Mohammadi, A.; Debbabi, M. Security of wide-area monitoring, protection, and control(WAMPAC)systems of the smart grid: A survey on challenges and opportunities. IEEE Commun. Surv. Tutor. 2023, 25, 1294–1335. [Google Scholar] [CrossRef]
- Tong, X.; Wang, X.; Wang, R.; Huang, F.; Dong, X.; Hopkinson, K.M.; Song, G. The Study of a Regional Decentralized Peer-to-Peer Negotiation-Based Wide-Area Backup Protection Multi-Agent System. IEEE Trans. Smart Grid 2013, 4, 1197–1206. [Google Scholar] [CrossRef]
- Ma, J.; Liu, C.; Thorp, J.S. A wide-area backup protection algorithm based on distance protection fitting factor. IEEE Trans. Power Deliv. 2015, 31, 2196–2205. [Google Scholar] [CrossRef]
- Zhang, G.; Tong, X.; Hong, Q.; Lu, X.; Booth, C.D. A novel fault isolation scheme in power system with dynamic topology using wide-area information. IEEE Trans. Ind. Inform. 2021, 18, 2399–2410. [Google Scholar] [CrossRef]
- Li, Z.; Yin, X.; Zhang, Z. Research on Wide-area Protection System Based on Multi-Agent. Power Syst. Prot. Control 2012, 40, 71–75. [Google Scholar]
- Harish, A.; Prince, A.; Jayan, M.V. Fault detection and classification for wide area backup protection of power transmission lines using weighted extreme learning machine. IEEE Access 2022, 10, 82407–82417. [Google Scholar] [CrossRef]
- Sharafi, A.; Sanaye-Pasand, M.; Aminifar, F. Transmission system wide-area back-up protection using current phasor measurements. Int. J. Electr. Power Energy Syst. 2017, 92, 93–103. [Google Scholar] [CrossRef]
- Jin, N.; Lin, X.; Xing, J.; Li, Z.; Liu, S.; Chen, L.; Ma, X.; Rong, Z.; Tong, N. Research on multiterminal current differential protection criterion with high sensitivity and synchronization error tolerance capability. IEEE Trans. Power Deliv. 2018, 33, 3085–3094. [Google Scholar] [CrossRef]
- Li, Z.; Wang, Z.; Liu, Y.; Tan, C.; Weng, H. The principle and implementation of current differential protection based on shaping transform capacity reduction. Power Syst. Prot. Control 2022, 50, 77–85. (In Chinese) [Google Scholar]
- Samantaray, S.R. A differential voltage-based wide-area backup protection scheme for transmission network. IEEE Syst. J. 2021, 16, 520–530. [Google Scholar]
- Chang, J.N.; Song, G. An Adaptive Coordinated Wide-Area Backup Protection Algorithm for Network Topology Variability. IEEE Trans. Power Deliv. 2024, 39, 958–969. [Google Scholar] [CrossRef]
- Liu, J.; Zhang, K.; Tian, Q.; Huang, S.L. Wide area backup protection algorithm based on grey correlation analysis of sequence current and multi-information fusion. Power Syst. Prot. Control 2018, 46, 19–25. [Google Scholar]
- He, R.; Yang, S.; Deng, J.; Feng, T.; Lai, L.L.; Shahidehpour, M. Reliability analyses of wide-area protection system considering cyber-physical system constraints. IEEE Trans. Smart Grid 2021, 12, 3458–3467. [Google Scholar] [CrossRef]
- Hu, T.; Jia, K.; Bi, T.; Dong, X. Wide-area protection algorithm for transmission network based on fault charge comparison and evidence theory. Power Syst. Technol. 2024, 48, 4739–4747. [Google Scholar]
- Hu, T. Research on Wide-Area Backup Protection of Power Grid Considering New Energy Access. Master’s Thesis, North China Electric Power University, Beijing, China, 2024. [Google Scholar] [CrossRef]
- Han, X.; Wang, Y.; Lü, F.; Chen, Z.; He, S.; Ma, Y. A new algorithm of wide area backup protection based on fault correlation coefficient. Power Syst. Prot. Control 2017, 45, 48–54. [Google Scholar]
- Kong, L.; Jiao, Y.; Liu, X.; Dai, Z.; Chong, Z. Ratio-restraining differential protection of lines based on charge. Autom. Electr. Power Syst. 2014, 38, 91–95. [Google Scholar]
- Cao, T.; Ma, S.; Xu, J.; Dai, C. Change-of-charge differential protection of transmission lines. Autom. Electr. Power Syst. 2013, 37, 102–107. [Google Scholar]
- Chen, M.; Wang, H.; Liu, Y.; Shen, S.; He, B. An adaptive backup distance relaying scheme based on communication between neighboring substations. Power Syst. Technol. 2017, 41, 630–636. [Google Scholar]
- Deng, Y. Uncertainty measure in evidence theory. Sci. China-Inf. Sci. 2020, 63, 210201. [Google Scholar] [CrossRef]
Disclaimer/Publisher’s Note: The statements, opinions and data contained in all publications are solely those of the individual author(s) and contributor(s) and not of MDPI and/or the editor(s). MDPI and/or the editor(s) disclaim responsibility for any injury to people or property resulting from any ideas, methods, instructions or products referred to in the content. |
© 2025 by the authors. Licensee MDPI, Basel, Switzerland. This article is an open access article distributed under the terms and conditions of the Creative Commons Attribution (CC BY) license (https://creativecommons.org/licenses/by/4.0/).