Abstract
In this paper, we demonstrated a high-sensitivity polarization image sensor for millimeter-wave electric field imaging using electro-optic crystals. We developed a three-layer on-pixel polarizer structure fabricated with a 0.35-µm standard CMOS process, achieving an extinction ratio of 5.7, which corresponds to a 73% improvement over previous two-layer structure. Crosstalk reduction was implemented by applying a bias voltage to the n-well pixel separation, and extinction ratio was further improved. By using an improved sensor, it demonstrated a 7.6 dB SNR improvement in 30 GHz electric field imaging compared to previous sensors, despite 30% transmittance reduction. Angular dependence analysis confirmed adequate performance within the optical system’s constraints. These results enable high-speed and high-sensitivity millimeter-wave imaging applications.
1. Introduction
An electro-optic (EO) probe that detects birefringence changes in an EO crystal generated by an electric field has been reported to visualize the high-frequency electric field distribution by mechanical scanning [1,2,3,4] and optical scanning [5]. Furthermore, by combining an EO crystal and a CMOS image sensor with on-pixel polarizers, information on the electric field distribution can be obtained in a single operation. This method enables extremely high-speed imaging compared to mechanical and optical scanning [6]. In addition, this method has the advantage of high spatial resolution [7] and the information on intensity distribution and phase distribution can be obtained simultaneously. The dielectric constant of ZnTe used as an EO crystal is approximately 10 [8,9]. This causes less disturbance to the electric field to be observed than that of metals, and can be applied to the measurement of the near field. Furthermore, these EO crystals enable broadband measurements up to the THz band [10,11,12]. However, this technique has a low sensitivity due to the low upper limit of light intensity, which is caused by the low light intensity limit that can be handled by image sensors.
To solve this problem, we have proposed a dual polarizer structure in which a uniform polarizer is mounted on a polarization image sensor [13,14]. This dual polarizer structure enables measurement with an image sensor while significantly increasing the upper limit of light intensity that can be used to illuminate the EO crystal. Details are given in [14]. To evaluate actual communication equipment in real time, visualization at speeds exceeding the video frame rate (60 FPS) is required to visually determine its operational status. However, previous studies have only achieved visualization at a maximum at 1 FPS [15], requiring further speed improvements. To achieve this speed, high-speed operation of the image sensor and high sensitivity to polarization changes are required. Furthermore, in the previous studies, the measurement target was only the near-field electric field. However, to visualize weak electric field distributions including the far-field in the future, the sensitivity of the sensors used in the previous studies was insufficient.
In this study, we have considered the structure of the on-pixel polarizer that can achieve the maximum extinction ratio in the 780 nm wavelength band when using a 0.35-µm 2-poly 4-metal standard CMOS process. The extinction ratio was improved by modifying the structure of the on-pixel polarizers from two layers (M2M3) to three layers (M1M2M3) and an n-well layer was placed between photodiodes to prevent crosstalk. Furthermore, we have evaluated in detail the behavior of a multilayer wire grid polarizer with respect to the angle of incidence and considered the maximum NA that can be allowed in the optical system. Moreover, in electric field imaging systems, there is an upper limit for optical amplification at the fiber output, which is easy to handle. By adjusting the pixel capacity to match the maximum output of the SOA used. The multilayer structure of the on-pixel polarizer reduces transmittance, however, adjusting the pixel capacitance increases the signal level, we improved the system’s total sensitivity.
These improvements demonstrate that this sensor can visualize electric fields in the 30 GHz millimeter-wave band with high sensitivity. Improved sensitivity to polarization changes resulted in a 7.6 dB increase in the signal-to-noise ratio (SNR) for electric field detection, compared with polarization image sensors reported in previous studies.
2. High-Sensitivity Polarization Imaging System
2.1. Fabricated Polarization Image Sensor
Electric field imaging requires using a wavelength of 780 nm, which is available for high-speed optical modulators and semiconductor amplifiers, and detectable by CMOS image sensors fabricated using Si. We have optimized the line/space ratio of the on-pixel polarizer to obtain the best performance for 780 nm wavelengths using a 0.35 µm standard CMOS process [13], and have also optimized the on-pixel polarizer using a CMOS process metal wiring layer from Metal 1 (M1) to Metal 2,3 (M2M3) to improve the extinction ratio [15]. By stacking polarizers on each pixel, the polarization was spatially more limited and the extinction ratio was improved.
Table 1 shows the specifications of the fabricated polarization image sensor. Figure 1, (a) shows a chip photograph, (b) a block diagram, (c) a pixel layout, and (d) a cross-sectional view of pixel layout. The polarization image sensor was fabricated using a 0.35 µm standard CMOS process, with a pixel size of 30 µm square and a pixel number of 80 × 60 pixels. To reduce pixel-to-pixel crosstalk, an n-well layer was placed between the photodiodes (PDs) and biased with a constant voltage to prevent charges generated in neighboring pixels from flowing into the PDs. The on-pixel polarizers were fabricated using a CMOS process metal wiring layer Metal 1–Metal 3 (M1–M3) with a Line/Space of 0.70/0.70 µm, following the previous layout. Polarizers with transmission axes of 0° and 90° are placed next to each other.

Table 1.
Image sensor specifications.
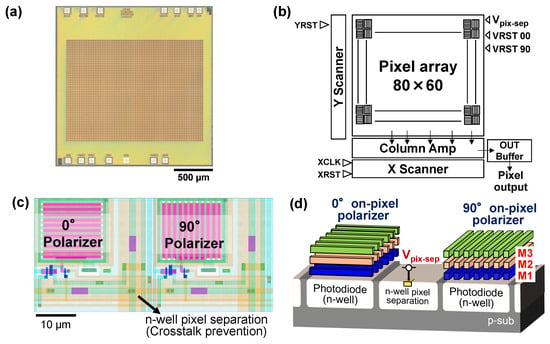
Figure 1.
(a) Chip photograph. (b) Block diagram. (c) Pixel layout. (d) Cross-sectional view of pixel layout.
2.2. Extinction Ratio Improvement and Theoretical Measurement Sensitivity by Using Multilayer On-Pixel Polarizers
Figure 2 shows the results of measuring the spectral extinction ratio using a spectrometer with four different polarization image sensors with on-pixel polarizers using CMOS metal wiring layers M1, M1M2, M2M3, and M1M2M3. The spectral extinction ratio was measured using a halogen light source (AT-100HG, Shimadzu, Kyoto, Japan) and a monochromator (MicroHR, Horiba, Kyoto, Japan) to generate monochromatic light, and a polarizer (LPVIS100-MP2, Thorlabs, Newton, NJ, USA) to convert it to linearly polarized light. The sensor was rotated to the 0° and 90° directions relative to the polarization, and the extinction ratio was calculated. The measured values were calculated from the results of averaging 96 frames over a pixels at the center of the image sensor. It was confirmed that the extinction ratio was improved over a wide range of wavelengths from 600 to 900 nm by stacking polarizers. In particular, the extinction ratio of the polarization image sensor with a multilayer polarizer structure using three layers of M1M2M3 was 5.7 in the 780 nm wavelength band, which is approximately 1.8 times higher than that of the dual-layer polarizer using M2M3. However, the transmittance was approximately 30% lower than that of the two-layer polarizer. The extinction ratios for the four fabricated chips with an n-well pixel separation voltage set to 5 V were 5.89 and 4.67 at maximum and minimum, respectively. Furthermore, the standard deviation in the extinction ratio for the four-chip sensor was 0.44. Furthermore, it has been determined that variation in the extinction ratio was also observable between 0° and 90° polarizers. The mean of this variation was 0.39, and the standard deviation was 0.20. This is probably due to etch rate variation during the CMOS process fabrication. Furthermore, there are slight variations depending on the manufacturing lot. However, even for polarization image sensors using a three-layer on-pixel polarizer from different lots, the average value was 5.47. This is higher than the extinction ratio achieved with a two-layer on-pixel polarizer, demonstrating that increasing the on-pixel polarizer layers from two to three improves the extinction ratio even when manufacturing in different lots. The variation in extinction ratio due to manufacturing errors is approximately 20%. The sensitivity variation caused by this 20% extinction ratio variation results in a theoretical measurement sensitivity ranging from approximately 65% to 70%. In terms of sensitivity change for electric field imaging, this is approximately 0.2 dB, making the change in electric field distribution due to extinction ratio variation negligible. This 0.2 dB variation can be corrected by software, and it is negligible for real-time evaluation of actual communication equipment. Furthermore, the two-layer on-pixel polarizer achieves approximately 60% of the theoretical measurement sensitivity. Therefore, even under conditions with extinction ratio variation, the measurement sensitivity is improved compared to the two-layer on-pixel polarizer. Moreover, it is possible to pre-measure the variation in extinction ratio and correct this sensitivity variation by software.
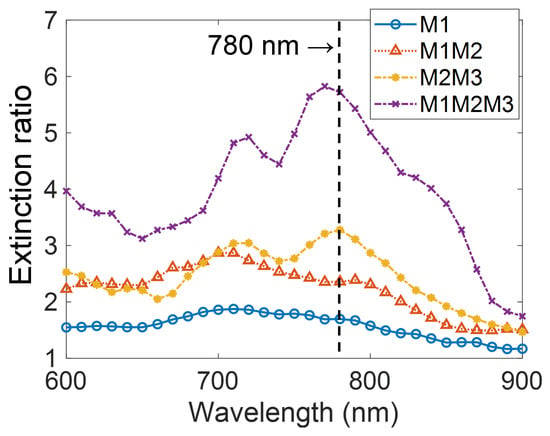
Figure 2.
Measurement results of spectral extinction ratio when changing the stacking structure of the on-pixel polarizers.
Figure 3 shows a plot of the extinction ratio of each polarizer structure on the curve of theoretical measurement sensitivity with respect to an ideal polarizer with infinite extinction ratio. The theoretical sensitivity of the proposed method is expressed as follows when the extinction ratio of the on-pixel polarizer is , assuming constant transmitted light intensity.
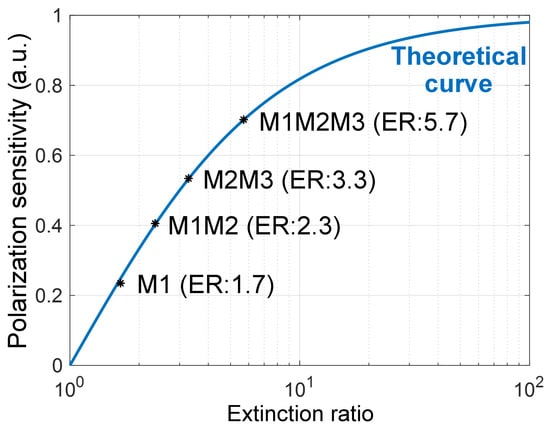
Figure 3.
Theoretical measurement sensitivity calculated from the extinction ratio of each polarizer structure.
The sensitivity was improved by using the multilayer on-pixel polarizer structure, and was improved to approximately three times by using the M1M2M3 structure compared to the M1 structure. With the M1M2M3 structure, a polarization change detection sensitivity of approximately 70% of the theoretical maximum can be achieved. By increasing the number of polarizers on the pixel by using the M1M2M3 structure compared to the M2M3 structure, the transmittance drops by approximately 30%. However, the sensitivity was improved by approximately 2 dB due to the improvement in the on-pixel polarizers.
The CMOS process we used allows the use of metal wiring layers up to the fourth layer, and when we used this to fabricate a three-layer pixel polarizer with M2M3M4, the extinction ratio was 4.2, which was worse than that of M1M2M3. This is considered to be because top metal M4 was not flattened and has very poor thickness uniformity, making it unsuitable for use as an optical element. In particular, the on-pixel polarizer using only the M4 layer failed to work as a polarizer. Therefore, there is no expectation that the extinction ratio will improve using a four-layer on-pixel polarizer with M1M2M3M4. Therefore, in this study, we selected three-layer on-pixel polarizers with M1M2M3, fabricated in a 0.35-µm standard CMOS process with a Line/Space of 0.70/0.70 µm.
2.3. Crosstalk Prevention by Changing Pixel Separation Voltage
In addition to optimizing the polarizer structure, pixel-to-pixel crosstalk represents another critical factor affecting the extinction ratio. Crosstalk between pixels occurs due to the effect of diffuse carriers from neighboring pixels In polarization image sensors, this pixel-to-pixel crosstalk leads to a lower extinction ratio [16]. In this image sensor, an n-well layer is placed between the PDs and biased with a constant voltage to reduce this pixel-to-pixel crosstalk. Figure 4a shows the spectral extinction ratio results when the bias voltage was changed to 1, 3, 5, and 7 V. By setting the bias voltage to 7 V, the extinction ratio was improved to 6.1.
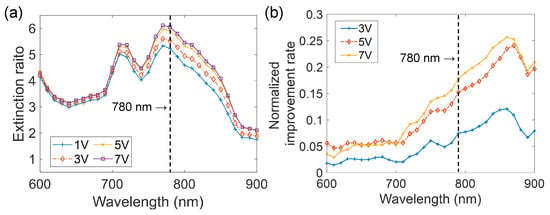
Figure 4.
(a) Spectral extinction ratio results when the bias voltage was changed to 1, 3, 5, and 7 V. (b) Extinction ratio improvement ratio normalized by the extinction ratio when the bias voltage was set to 1 V.
Figure 4b shows the results of calculating the extinction ratio improvement rate for each bias condition, normalized by the extinction ratio when the bias voltage is set to 1 V. This result shows that the improvement effect is small at short wavelengths, but is large at long wavelengths. The results show that the improvement is greater at the long wavelength side. The absorption coefficient of Si decreases with increasing wavelength, and light incident on a pixel reaches a deeper region at longer wavelengths. This phenomenon explains that the improvement in extinction ratio by changing the bias voltage was large at the long wavelength side. However, the improvement in extinction ratio achieved by this crosstalk prevention is smaller than that by changing the structure of the on-pixel polarizers.
2.4. Evaluation of Angle-of-Incidence Dependence of Multilayer On-Pixel Polarizer Structure
It is known that when wire grids are arranged in multiple layers, changes in transmittance due to geometrical restriction of the angle-of-incidence (AOI) and AOI dependent transmittance changes due to diffraction of light are generated [17,18,19]. Angle-dependent image sensors that use this light diffraction effect [20,21] and the geometrical limitation of light due to the multilayer structure of metal wiring [22] have been reported.
To evaluate the effect of AOI on electric field imaging, the angular characteristics of the fabricated multilayer on-pixel polarizer sensors were analyzed. Figure 5a shows the experimental system. A superluminescent diode (SLD) with a center wavelength of 770 nm was used as the light source, and a collimator was used to produce collimated light. This collimated light was transmitted through a polarizer to produce linear polarization. After this polarizer, the polarized light was transmitted through an ND filter (ThorLabs NE20A-B) with an anti-reflection coating (AR coating) to adjust the light intensity, and the polarization angle incident on the sensor was adjusted by rotating the polarization with a half-wave plate. Evaluation was conducted with the image sensor fixed to a rotating stage with the center of the image sensor as the axis of rotation. Figure 5b shows the definition of AOI in this experiment, where the rotation axis is defined such that AOI = 0° corresponds to perpendicular incidence on the 90° pixel wire grids. In this experiment, polarization image sensors with M2M3 and M1M2M3 on-pixel polarizer structure were used to evaluate AOI dependence.

Figure 5.
(a) Schematic diagram of experimental system for AOI evaluation. (b) Definition of AOI.
Figure 6 shows the results of the incident linearly polarized light irradiated at a angle of ±45° to the on-pixel polarizers, and AOI dependence was measured in steps of 0.1° over a range of ±15°. The 90° pixels showed a strong dependence on incident angle. On the other hand, the 0° pixels also showed it, but the change was smaller than that of the 90° pixels. The angle of minimum value is approximately ±10°, which is almost unchanged between M2M3 and M1M2M3. The reason for this is that the angle at which the minimum value is taken is determined by the wire grids pitch. The distance between metal wiring layers is approximately 0.5 to 1 µm. On the other hand, the change in pixel output with respect to AOI was approximately twice as large with M1M2M3 compared to M2M3. This is thought to be caused by the spatial limitation of light due to the use of multilayer structures. The measurement results with the M1M2M3 polarizer were line symmetrical around the 0°. In contrast, the results with the M2M3 polarizer were less symmetrical. This asymmetry is attributed to several factors: subtle misalignment of the optical system, manufacturing errors in the line/space of the on-pixel polarizers, and alignment errors in the stacking of the metal wiring.
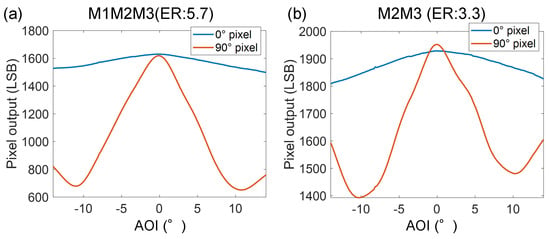
Figure 6.
AOI dependence with incident polarization angle of ±45° with respect to the (a) M1M2M3 and (b) M2M3 on-pixel polarizers.
The extinction ratio was measured as a function of AOI by rotating the waveplate at various incident angles. The AOI dependence was measured in 1° steps over a range of ±15°. The results are shown in Figure 7a,b. Similar to the previous result, AOI dependence of the M1M2M3 is higher than that of the M2M3. The extinction ratio for the 90° pixel decreases as incident angle increases, while for the 0° pixel, it reaches a maximum value at approximately 12° and then decreases. As in the previous measurement, there is little symmetry around the 0°. This asymmetry is also attributed to multiple factors. These include subtle misalignment of the optical system, manufacturing errors in the line/space of the on-pixel polarizers, and alignment errors in the stacking of the metal wiring.
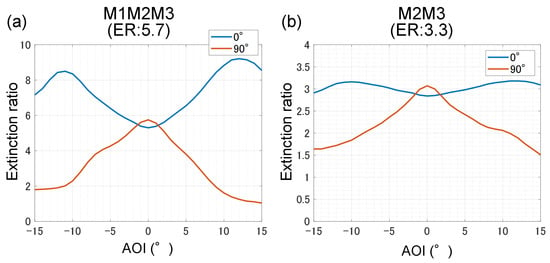
Figure 7.
Extinction ratio as a function of AOI for (a) M1M2M3 and (b) M2M3 on-pixel polarizers.
The optical system fabricated using this image sensor must be designed to take consideration of this AOI dependence. In the electric field imaging system developed in this study, a lens with a focal length of 50 mm (ThorLabs AC254-050-B-ML) was used to image an area of approximately 2.6 × 1.9 mm square. Under these conditions, the maximum AOI on the image sensor is approximately 1.9°, which is calculated to be numerical aperture (NA) = 0.05. For this variation, the extinction ratio for the M1M2M3 image sensor varies from 5.7 to 5.1, and the theoretical measurement sensitivity varies in the range of 0.70 to 0.61. For the M2M3 image sensor, the extinction ratio varies from 3.3 to 3.0, and the theoretical sensitivity is 0.54 to 0.46. In both cases, the maximum in-plane sensitivity reduction is dB in the electric field imaging system. This value is sufficiently small compared to the electric field imaging SNR described below that it is expected to have little effect on the electric field imaging results. However, in order to image a wider range using this image sensor, it is necessary to select a lower NA lens than the range used in this experiment, considering AOI dependence. If the allowable in-plane sensitivity reduction rate is less than dB, it is calculated that the allowable AOI for the M1M2M3 on-pixel polarizer is approximately 7°, which requires the use of a lens with NA = 0.18 or less.
3. Millimeter-Wave Electric Field Imaging Demonstration
3.1. Imaging Setup
Figure 8 shows a schematic diagram of the fabricated electric field imaging system. In this electric field imaging system, we set the frequency of the observation target to 30 GHz. The 30 GHz electric field frequency is higher than the frame rate of the image sensor. Therefore, in this study, frequency conversion using an optical heterodyne technique was used. In this optical heterodyne, the light illuminating the EO crystal is intensity- or phase-modulated in advance, and the EO crystal and polarizer function as an optical mixer. The image sensor detects the difference frequency component as a change in light intensity in response to an electric field through the on-pixel polarizers, which acts as the detector. Therefore, the electric field intensity and phase distribution can be obtained by extracting the difference frequency component from the image data and performing calculations.
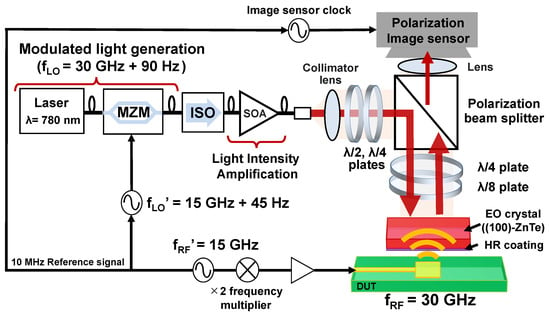
Figure 8.
Schematic of millimeter-wave electric field imaging system based on dual polarizer structure. MZM: Mach–Zehnder modulator, ISO: optical isolator, SOA: Semiconductor optical amplifiers, and DUT: Device under test.
The modulated light was intensity-modulated using a LiNbO3-based Mach–Zehnder modulator (MZM) (iXblue NIR-MX800-LN-20, Saint-Germain-en-Laye, France) with a single wavelength laser (ThorLabs DBR780PN, Newton, NJ, USA) at 780 nm. This MZM is designed for the 780–850 nm wavelength band and has a bandwidth of 25 GHz. A 15 GHz + 45 Hz signal was applied to the modulator, the bias point was set to the null bias condition, and double-sideband suppressed-carrier (DSB-SC) modulation was performed to generate a modulated light with a ±1st-order sideband of 30 GHz + 90 Hz. This DSB-SC modulation allows the modulation frequency to be doubled to generate the target millimeter-wave band intensity modulated light. An optical isolator was installed at the output of the modulator, and the light was amplified using a semiconductor optical amplifier (SOA) (Innolume SOA-780-20-YYY-30dB, Dortmund, Germany) and fed into an electric field imaging system.To avoid photorefractive effects, the incident light limit of the optical modulator is a few mW. To increase sensitivity by increasing light intensity, the modulated light generated by the optical modulator was optically amplified using an SOA. The SOA amplification was driven at the maximum power of the SOA to generate 25.7 mW of modulated light. This modulated light was collimated by a collimator lens to produce collimated light covering the entire EO crystal, and the polarization was adjusted by using 1/2 and 1/4 waveplates, and then the light was directed into the polarization beam splitter. This polarized light was then turned 90° by a polarization beam splitter with an extinction ratio of approximately 800 and illuminated from the top of the EO crystal. Transmitted through the 1/4 and 1/8 waveplates to adjust the polarization state, and then illuminated onto the EO crystal. The EO crystal had an HR coating on the bottom surface, therefore the reflected light was returned to the polarizing beam splitter. Therefore, the 1/4 and 1/8 waveplates transmited the light twice, and each waveplate worked as 1/2 and 1/4 waveplates, respectively. In this optical system, the polarization beam splitter functions as a uniform polarizer. The polarization direction was adjusted using 1/4 and 1/8 waveplates to minimize the transmission to the image sensor side using a polarization beam splitter. The EO crystal used as the EO probe was a 3 × 3 × 0.1 mm plate of (100)-ZnTe. (100)-ZnTe responds to an electric field perpendicular to the plane. The EO crystal was placed on the device under test (DUT), therefore the near-polar electric field was imaged.
3.2. Millimeter-Wave Patch Antenna Electric Field Imaging Results
The DUT was a patch antenna fabricated on a substrate with high dielectric constant with a dielectric constant of approximately 10.4, as shown in Figure 9a. The patch antenna was designed for 30 GHz. A 30 GHz, 28 dBm CW signal was input to the patch antenna. The patch antenna used has a design value antenna gain of approximately 4.6 dBi. The measurement was performed at 360 fps, and 1000 frames were obtained. The intermediate frequency component was extracted by performing a Fast Fourier Transform on each pixel and extracting the 90 Hz component. A single image was acquired in approximately 3 s, demonstrating dramatically faster imaging compared to antenna scanning This measurement was compared between the proposed image sensor and the previous image sensor fabricated in a previous study. Table 2 shows the differences between the proposed image sensor and the previous image sensor. In the proposed image sensor, the pixel separation voltage was set to 7 V. The previous image sensor had an M2M3 on-pixel polarizers and a MOS-CAP in parallel with the photodiode, increasing the pixel capacity by approximately 4.7 times. These two polarization image sensors were used to image the electric field distribution on the patch antenna under the same conditions.
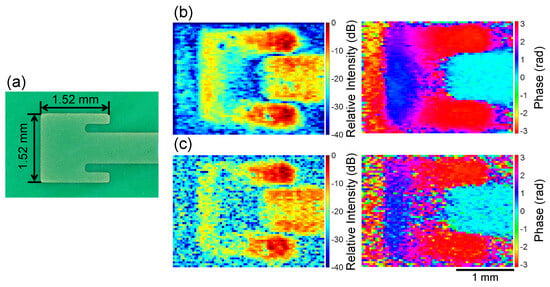
Figure 9.
(a) Optical image of 30 GHz patch antenna. Millimeter-wave electric field images from 1000 frames using (b) proposed image sensor, and (c) previous image sensor.

Table 2.
Comparison between the proposed image sensor and the previous image sensor.
Figure 9b shows the measurement results from the proposed image sensor, and Figure 9c shows the measurement results from the previous image sensor. The electric field imaging results were normalized to show the maximum value as 0 dB. The (100)-ZnTe crystal used had sensitivity to perpendicular electric fields. Therefore, the electric field intensity was higher at the edge of the antenna. Additionally, the electric field intensity on the microstrip line feeding to the antenna was stronger. The phase distribution shows that the phase was shifted by rad on the left and right sides of the antenna, and that the phase was shifted by rad on the antenna and outside the antenna. The results from the proposed image sensor show that the noise was reduced and a clearer image was observed. The SNR was calculated using pixel averaging of 2 × 2 polarizer pairs at the position of maximum electric field intensity and FFT of the result. The SNR was calculated from the maximum signal and noise levels measured in this study. The measured noise level was determined by measuring without inputting a signal to the antenna and taking the average of the signal spectrum within the 90 ± 5 Hz range. The signal level including FPN, dark current, and readout noise was calculated from by averaging 1000 frames in dark conditions and subtracting it from the obtained image data. The SNR for the proposed image sensor was 35.8 dB, while the SNR for the previous image sensor was 28.2 dB. By changing the polarizers from M2M3 to M1M2M3 reduced the transmittance by approximately 30%. However, the improvement in sensitivity due to the enhanced on-pixel polarizers was significant, and an improvement in performance of approximately 2 dB was anticipated. The reason for this performance improvement was considered to be the SNR enhancement due to increased signal levels. This increase resulted from pixel capacitance adjustment. In the proposed image sensor, the signal level reached 36% of the pixel saturation level. In contrast, the previous image sensor achieved only about 11% of the pixel saturation level. This signal level increase rate and the signal increase rate due to the improvement in the on-pixel polarizers are almost identical to the SNR improvement rate in the electric field imaging system. The SNR of the system was improved by improving the polarization detection performance and increasing the signal level by adjusting the pixel capacitance. In optical amplification using fiber-coupled output, there is an upper limit to the amount of light that can be output, and under such conditions, a polarization image sensor with a small pixel capacity can achieve a higher SNR. However, the light level of the fabricated electric field imaging system in this paper was approximately 36% of the pixel saturation level. Therefore, there is room for an upper limit on the amount of light that the image sensor can detect. Therefore, an improvement of approximately 4 dB can be achieved by adjusting the pixel capacitance. On the other hand, by using an optical amplifier that emits light into free space, such as a tapered SOA, it is possible to generate modulated light with even higher light intensity [23,24]. When using this high-intensity modulated light, a higher SNR can be obtained by using an image sensor with a large pixel capacity.
In electric field imaging, both high speed and sensitivity are important factors. Regarding high speed, it can be achieved by operating the image sensor at high speed to increase the number of frames per unit time, and by reducing the noise level. However, since there are technical limits to the high-speed operation of image sensors, sensors are required that can perform high-sensitivity electric field detection even when the number of frames per unit time is low. Figure 10 shows the results of calculating the electric field distribution by varying the number of frames used. Reducing the frames per unit time enables faster visualization but results in decreased sensitivity. Reducing the frames per unit time enables faster visualization but results in decreased sensitivity. Even with calculations based on 36 frames equivalent to 10 FPS, the three-layer polarization image sensor successfully visualizes the electric field image. On the other hand, the two-layer polarization image sensor detects a slight electric field but fails to visualize the whole patch antenna. In addition, Figure 11 shows the profile along the black dotted line in the 360 frame results of Figure 10. The microstrip line was set to vertically to the black dotted line. The electric field distribution is strongly detected along the microstrip line and becomes weaker outside the line [25]. Comparing the proposed image sensor and the previous image sensor shows that the edges of the microstrip line are observed more clearly in the proposed image sensor using the three-layer structure. As a result, the proposed image sensor achieved improved SNR and lower noise levels. The average signal level of outside of the line decreased by 8.5 dB for the proposed image sensor compared to the previous image sensor. These results demonstrated that the proposed image sensor enables high-sensitivity and high-speed visualization of electric field distributions.
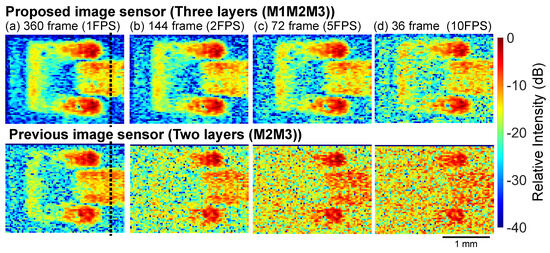
Figure 10.
Results of calculating the electric field distribution by varying the number of frames used: (a) 360 frames, (b) 144 frames, (c) 72 frames, and (d) 36 frames.
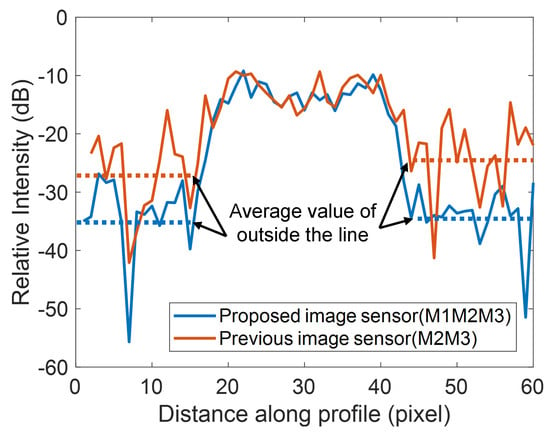
Figure 11.
Profiles along the black dotted lines in the electric field imaging results using 360 frames in Figure 10.
In the THz band, the electric field detection sensitivity was not as high as that of bolometer-type detectors [26,27,28,29] or pyro cameras [30]. However, these detectors cannot visualize the distribution of specific frequencies. In contrast, our electric field imaging system operates in the frequency domain, allowing visualization of the electric field distribution for specific frequency components. Furthermore, our method can achieve fast-imaging not only the electric field intensity but also the electric field phase distribution. Furthermore, compared to thermal type sensors using metasurfaces [31] and sensors using patch antenna arrays [32,33], our sensor has high spatial resolution.
4. Conclusions
In this paper, we significantly enhanced the performance of a polarization image sensor for high-speed, high-sensitivity millimeter-wave electric field imaging through two key improvements. First, we optimized the on-pixel polarizer structure by stacking a three-layer M1M2M3 configuration, achieving an extinction ratio of 5.7, which corresponds to 73% improvement over the previous M2M3 design. Second, we reduced pixel-to-pixel crosstalk by introducing an n-well separation layer with optimized bias voltage (7 V), further improving the extinction ratio to 6.1. The extinction ratio may improve when fabricating a polarization image sensor with a four-layer on-pixel polarizer using CMOS processes capable of 5-metal. However, it is anticipated that the transmission rate will further deteriorate due to the on-pixel polarizer, and the angle dependence will become even stronger. For polarization image sensors for electric field imaging, a three-layer on-pixel polarizer is considered the optimal choice. Further extinction ratio improvement can be expected by fabricating trenches between the pixels [34] to further reduce the crosstalk.
These improvements resulted in a substantial 7.6 dB enhancement in SNR for millimeter-wave electric field imaging compared to previous sensors. The enhanced performance was achieved despite a 30% reduction in transmittance, demonstrating the effectiveness of the multilayer polarizer approach. The AOI dependence analysis confirmed that the sensor maintains adequate performance within the optical system’s NA constraints.
Author Contributions
Conceptualization, K.S.; methodology, R.O.; validation, R.O.; resources, R.O.; writing—original draft preparation, R.O., K.S. and M.M.; writing—review and editing, M.M., H.T. (Hironari Takehara), M.H. and H.T. (Hiroyuki Tashiro); supervision, K.S. and J.O.; project administration, K.S., M.M. and J.O.; funding acquisition, K.S. All authors have read and agreed to the published version of the manuscript.
Funding
This work was funded by the Tateisi Science and Technology Foundation (Grant Number 2251008); the SCOPE project of the Ministry of Internal Affairs and Communications of Japan (Grant Number JP225007001).
Data Availability Statement
Data are contained within the article.
Acknowledgments
This work was supported by the d-lab-VDEC, The University of Tokyo, in collaboration with Cadence Design Systems and Siemens Electronic Design Automation Japan K.K.
Conflicts of Interest
The authors declare no conflicts of interest.
References
- Lin, F.; Wang, X.; Tang, M.; Zhang, J.; Wang, L.; Liu, X.; Yang, Q. High-frequency electric field intensity measurement based on frequency shift with high gain and wide frequency range. Opt. Commun. 2023, 545, 129682. [Google Scholar] [CrossRef]
- Lee, D.J.; Kang, N.W.; Choi, J.H.; Kim, J.; Whitaker, J.F. Recent advances in the design of electro-optic sensors for minimally destructive microwave field probing. Sensors 2011, 11, 806–824. [Google Scholar] [CrossRef] [PubMed]
- Baudry, D.; Louis, A.; Mazari, B. Characterization of the open-ended coaxial probe used for near-field measurements in EMC applications. Prog. Electromagn. Res. 2006, 60, 311–333. [Google Scholar] [CrossRef]
- Hisatake, S.; Pham, H.H.N.; Nagatsuma, T. Visualization of the spatial–temporal evolution of continuous electromagnetic waves in the terahertz range based on photonics technology. Optica 2014, 1, 365–371. [Google Scholar] [CrossRef]
- Sasaki, A.; Nagatsuma, T. Electric-field scanning system using electro-optic sensor. IEICE Trans. Electron. 2003, 86, 1345–1351. [Google Scholar]
- Sasagawa, K.; Kanno, A.; Kawanishi, T.; Tsuchiya, M. Live electrooptic imaging system based on ultraparallel photonic heterodyne for microwave near-fields. IEEE Trans. Microw. Theory Tech. 2007, 55, 2782–2791. [Google Scholar] [CrossRef]
- Tsuchiya, M.; Takata, S.; Ohsone, K.; Fukui, S.; Yorinaga, M. Nanoscopic live electrooptic imaging. Sci. Rep. 2021, 11, 5541. [Google Scholar] [CrossRef]
- Constable, E.; Lewis, R.A. Optical parameters of ZnTe determined using continuous-wave terahertz radiation. J. Appl. Phys. 2012, 112, 063104. [Google Scholar] [CrossRef]
- Tripathi, S.R.; Aoki, M.; Takeda, M.; Asahi, T.; Hosako, I.; Hiromoto, N. Accurate complex refractive index with standard deviation of ZnTe measured by terahertz time domain spectroscopy. Jpn. J. Appl. Phys. 2013, 52, 042401. [Google Scholar] [CrossRef]
- Valdmanis, J.; Mourou, G.; Gabel, C. Subpicosecond electrical sampling. IEEE J. Quantum Electron. 1983, 19, 664–667. [Google Scholar] [CrossRef]
- Wang, X.; Cui, Y.; Sun, W.; Ye, J.; Zhang, Y. Terahertz polarization real-time imaging based on balanced electro-optic detection. J. Opt. Soc. Am. A 2010, 27, 2387–2393. [Google Scholar] [CrossRef]
- Winnewisser, C.; Jepsen, P.U.; Schall, M.; Schyja, V.; Helm, H. Electro-optic detection of THz radiation in LiTaO3, LiNbO3 and ZnTe. Appl. Phys. Lett. 1997, 70, 3069–3071. [Google Scholar] [CrossRef]
- Okada, R.; Sasagawa, K.; Mizuno, M.; Takehara, H.; Haruta, M.; Tashiro, H.; Ohta, J. Improvement of on-pixel polarizer with 0.35 µm CMOS process for electro-optic imaging systems. Jpn. J. Appl. Phys. 2023, 62, SC1052. [Google Scholar] [CrossRef]
- Sasagawa, K.; Okada, R.; Haruta, M.; Takehara, H.; Tashiro, H.; Ohta, J. Reflective high-sensitivity polarization change imaging using a dual polarizer structure. Opt. Contin. 2023, 2, 758–768. [Google Scholar] [CrossRef]
- Okada, R.; Mizuno, M.; Nagaoka, T.; Takehara, H.; Haruta, M.; Tashiro, H.; Ohta, J.; Sasagawa, K. Millimeter-Wave Band Electro-Optical Imaging System Using Polarization CMOS Image Sensor and Amplified Optical Local Oscillator Source. Sensors 2024, 24, 4138. [Google Scholar] [CrossRef] [PubMed]
- Maruyama, Y.; Terada, T.; Yamazaki, T.; Uesaka, Y.; Nakamura, M.; Matoba, Y.; Komori, K.; Ohba, Y.; Arakawa, S.; Hirasawa, Y.; et al. 3.2-MP back-illuminated polarization image sensor with four-directional air-gap wire grid and 2.5-μm pixels. IEEE Trans. Electron Devices 2018, 65, 2544–2551. [Google Scholar] [CrossRef]
- Testorf, M.; Jahns, J.; Khilo, N.A.; Goncharenko, A.M. Talbot effect for oblique angle of light propagation. Opt. Commun. 1996, 129, 167–172. [Google Scholar] [CrossRef]
- Azaña, J.; Guillet de Chatellus, H. Angular talbot effect. Phys. Rev. Lett. 2014, 112, 213902. [Google Scholar] [CrossRef]
- Varghese, V.; Chen, S. Polarization-based angle sensitive pixels for light field image sensors with high spatio-angular resolution. IEEE Sensors J. 2016, 16, 5183–5194. [Google Scholar] [CrossRef]
- Wang, A.; Gill, P.; Molnar, A. Light field image sensors based on the Talbot effect. Appl. Opt. 2009, 48, 5897–5905. [Google Scholar] [CrossRef]
- Gill, P.R.; Lee, C.; Lee, D.G.; Wang, A.; Molnar, A. A microscale camera using direct Fourier-domain scene capture. Opt. Lett. 2011, 36, 2949–2951. [Google Scholar] [CrossRef]
- Sugie, K.; Sasagawa, K.; Guinto, M.; Haruta, M.; Tokuda, T.; Ohta, J. Implantable CMOS image sensor with incident-angle-selective pixels. Electron. Lett. 2019, 55, 729–731. [Google Scholar] [CrossRef]
- Walpole, J. Semiconductor amplifiers and lasers with tapered gain regions. Opt. Quantum Electron. 1996, 28, 623–645. [Google Scholar] [CrossRef]
- Voigt, D.; Schilder, E.; Spreeuw, R.; Van Linden van den Heuvell, H. Characterization of a high-power tapered semiconductor amplifier system. Appl. Phys. B 2001, 72, 279–284. [Google Scholar] [CrossRef]
- Wakana, S.; Ohara, T.; Abe, M.; Yamazaki, E.; Kishi, M.; Tsuchiya, M. Fiber-edge electrooptic/magnetooptic probe for spectral-domain analysis of electromagnetic field. IEEE Trans. Microw. Theory Tech. 2000, 48, 2611–2616. [Google Scholar] [CrossRef]
- Zhou, R.; Xie, Z.; Wang, J.; Lu, G.; Yuan, Y.; Chen, S.; Yeow, J.T. Graphene-integrated microbolometer array imaging system: A novel approach for fast and sensitive terahertz detection in biomedical applications. ACS Appl. Mater. Interfaces 2025, 17, 9103–9114. [Google Scholar] [CrossRef] [PubMed]
- Beig, M.T.A.; Kumar, M.; Sharma, Y.; Sharma, B.K. A Terahertz/Millimeter-Wave Based Detection and Imaging System Using Antenna-Coupled Microbolometer. J. Phys. Conf. Ser. 2022, 2335, 012005. [Google Scholar] [CrossRef]
- Oda, N.; Kurashina, S.; Miyoshi, M.; Doi, K.; Ishi, T.; Sudou, T.; Morimoto, T.; Goto, H.; Sasaki, T. Microbolometer terahertz focal plane array and camera with improved sensitivity at 0.5–0.6 THz. In Proceedings of the 2014 39th International Conference on Infrared, Millimeter, and Terahertz Waves (IRMMW-THz), Tucson, AZ, USA, 14–19 September 2014; Volume 1. [Google Scholar]
- Nemoto, N.; Kanda, N.; Imai, R.; Konishi, K.; Miyoshi, M.; Kurashina, S.; Sasaki, T.; Oda, N.; Kuwata-Gonokami, M. High-sensitivity and broadband, real-time terahertz camera incorporating a micro-bolometer array with resonant cavity structure. IEEE Trans. Terahertz Sci. Technol. 2015, 6, 175–182. [Google Scholar] [CrossRef]
- Sharma, A.; Gupta, V.; Son, J.-G.; Gupta, A.; Bohus, J.; Fülöp, J.A.; Gebert, T. Linearity of Fast and Highly Sensitive LiTaO3 Pyroelectric Detectors in the Terahertz Range. IEEE Trans. Terahertz Sci. Technol. 2024, 14, 823–829. [Google Scholar] [CrossRef]
- Baghdasaryan, Z.; Babajanyan, A.; Parsamyan, H.; Friedman, B.; Kim, S.; Lee, J.H.; Lee, K. 3D visualization of microwave electric and magnetic fields by using a metasurface-based indicator. Sci. Rep. 2022, 12, 6150. [Google Scholar] [CrossRef]
- Kanazawa, Y.; Ambalathankandy, P.; Ikebe, M. Pixel Variation Characteristics of a Global Shutter THz Imager and its Calibration Technique. IEICE Trans. Fundam. Electron. Commun. Comput. Sci. 2023, 106, 832–839. [Google Scholar] [CrossRef]
- Kenneth, K.O.; Choi, W.; Han, R. Perspective on active submillimeter electromagnetic wave imaging using CMOS integrated circuits technologies. J. Appl. Phys. 2023, 133, 150903. [Google Scholar] [CrossRef]
- Park, B.J.; Jung, J.; Moon, C.R.; Hwang, S.H.; Lee, Y.W.; Kim, D.W.; Paik, K.H.; Yoo, J.R.; Lee, D.H.; Kim, K. Deep trench isolation for crosstalk suppression in active pixel sensors with 1.7 μm pixel pitch. Jpn. J. Appl. Phys. 2007, 46, 2454. [Google Scholar] [CrossRef]
Disclaimer/Publisher’s Note: The statements, opinions and data contained in all publications are solely those of the individual author(s) and contributor(s) and not of MDPI and/or the editor(s). MDPI and/or the editor(s) disclaim responsibility for any injury to people or property resulting from any ideas, methods, instructions or products referred to in the content. |
© 2025 by the authors. Licensee MDPI, Basel, Switzerland. This article is an open access article distributed under the terms and conditions of the Creative Commons Attribution (CC BY) license (https://creativecommons.org/licenses/by/4.0/).