Article

KG-PLPPM: A Knowledge Graph-Based Personal Learning Path Planning Method Used in Online Learning

1
School of Computer Science and Technology, Xidian University, Xi’an 710000, China
2
Xi’an Institute of High-Tech, Xi’an 710025, China
3
School of Automation, Northwestern Polytechnical University, Xi’an 710072, China
4
Guangzhou Research Institute, Xidian University, Guangzhou 510530, China
*
Author to whom correspondence should be addressed.
Electronics 2025, 14(2), 255; https://doi.org/10.3390/electronics14020255
Submission received: 18 November 2024 / Revised: 1 January 2025 / Accepted: 7 January 2025 / Published: 9 January 2025
(This article belongs to the Special Issue Future Trends of Artificial Intelligence (AI) and Big Data)

Abstract

:
In the realm of online learning, where resources are abundant, it is essential to customize recommendations and plans to meet individual learning needs. This involves not only identifying and addressing areas of weakness but also aligning the learning journey with each learner’s cognitive preferences. However, existing methods for suggesting and structuring learning paths have notable limitations. To address these challenges, this paper introduces a knowledge graph-based personalized learning path planning method (KG-PLPPM). By leveraging a knowledge graph and refining cognitive diagnosis models, the proposed method tailors learning paths to individual needs. It evaluates knowledge concept similarity and learner mastery, and employs an algorithm for path planning. In the experiments, two metrics—the concept sequence degree and learning efficiency—are used to assess our work. Experimental results demonstrate that the method presented enhances the coherence and relevance of recommended learning paths, and achieves a higher concept sequence degree, indicating that knowledge concepts are arranged in a manner consistent with the learning sequence, which aligns more closely with learners’ cognitive preferences. Moreover, across various learning progresses and path lengths, it effectively addresses weak knowledge areas, significantly enhancing learning efficiency.

1. Introduction

With the growing popularity of online education technology, an increasing number of courses are being published online, which is encouraging more people to become involved in online learning. The advantages of online learning are often summarized as the “5 Anys”—anyone, anytime, anywhere, any course, any chapter. Research in the field of education [1,2,3] indicates that the accessibility of online learning enables learners to access any chapter of any course at any time and from anywhere. While this flexibility offers numerous benefits, it also presents significant challenges. Learners may encounter a vast array of learning resources. Unlike offline learning, where learners are typically guided by the tutors, online learners exhibit greater autonomy, as they must independently identify knowledge gaps and devise their own learning paths to address these deficiencies. Consequently, when faced with a plethora of learning resources in an online environment without clear guidance, learners may experience what is known as a “learning trek” or “cognitive overload”. This phenomenon can significantly reduce learning efficiency and diminish motivation, leading to negative consequences such as stress, confusion, cognitive strain, and a lack of insight.
To mitigate the risk of learners becoming overwhelmed by the abundance of online learning resources and losing track of their learning paths, it is imperative to develop coherent learning paths tailored to their specific needs and preferences. These structured pathways provide guidance and direction, helping learners navigate through the material effectively, and maintain engagement and motivation throughout their learning journey. In light of this problem, considerable research has been conducted on learning path recommendations, employing various methodologies such as collaborative filtering [4,5], knowledge graphs [6,7,8], cognitive feature modeling of users [9,10,11], and social intelligence [12]. However, research on learning path recommendations often adopts the same principles as recommendation systems in other domains, including product, food, and movie recommendations. This approach typically generates isolated and discrete suggestions, which are unsuitable for learning path recommendation scenarios. Moreover, while learners’ interests are frequently prioritized in learning path recommendations, their knowledge acquisition status and degree of mastery are often overlooked. Consequently, from the perspective of enhancing learning outcomes and addressing knowledge gaps, the effectiveness of existing path planning and recommendations remains extremely limited. Thus, two critical questions warrant further investigation. RQ1: how do we implement a learning path recommendation that aligns with learners’ cognitive patterns while considering the sequential relationships among learning paths? RQ2: how can a learning path be effectively established to reflect the order of knowledge point acquisition while accounting for the learner’s current knowledge mastery?
Learning path recommendation and planning present unique challenges that are distinct from other recommendation problems. This necessitates a comprehensive consideration of the relationships among knowledge points, and the associations between learners’ cognitive patterns and these knowledge points, as well as their personalized learning requirements, such as which knowledge points they have yet to master and those that interest them. In the paper, we propose a knowledge graph-based personal learning path planning method for online learners that takes into account the relationships among knowledge points and the individual cognitive profiles of each learner. Contributions of this paper are summarized as follows:
  • An ontology is designed to conceptualize related knowledge in online learning. Based on this ontology, a knowledge graph is constructed using data from the open-source dataset MOOCCube.
  • A knowledge graph-based personal learning path planning method for online learning is proposed, which consists of a method for evaluating the similarity of knowledge concepts, a method for evaluating the concept mastery degree of the learner, and an algorithm to plan the learning path based on relationships between knowledge concepts and concepts mastery situations. This approach enables the establishment of a learning path that reflects the order of knowledge point acquisition while considering the learner’s current knowledge mastery.
  • A series of experiments are conducted across various scenarios. Analysis of the experimental results demonstrates that the proposed method generates learning paths with improved sequencing of knowledge concepts, thereby enhancing learning efficiency.
The organization of this paper is as follows. In Section 2, we discuss the literature contributions related to learning path planning and recommendation, analyzing the necessity of our work. In Section 3, we present a knowledge graph-based personal learning path planning method, which includes the construction of the knowledge graph in Section 3.1, the evaluation of knowledge concepts similarity in Section 3.2, the evaluation of concepts mastery in Section 3.3, and the learning path planning algorithm in Section 3.4. Moreover, in Section 4, related experiments are provided to verify the effectiveness of our work. Finally, we conclude the paper in Section 5.

2. Related Work

Planning and recommending learning paths represent a distinct challenge within the educational domain of recommendation problems. Addressing this issue necessitates research that integrates various methodologies associated with recommendation problems, including collaborative filtering, knowledge graphs, and collective intelligence methods [13]. Furthermore, it is crucial to consider the unique characteristics of this field. A significant challenge in educational path recommendations lies in developing a deeper understanding of users’ requirements and learning objectives [14].
As part of smart education, particularly within online learning environments that offer extensive resources to large audiences, optimal learning path planning and recommendations for learners must prioritize individual learning needs. This involves addressing knowledge points with weaknesses, and aligning the learning path with learners’ cognitive preferences and habits. In the following section, we will analyze existing research from multiple perspectives, including the methodologies employed in making recommendations and how the proposed learning paths can effectively meet learners’ needs and enhance their areas of weakness.

2.1. Methods Used in Educational Recommendations

Collaborative filtering-based methods, widely utilized in various domains, are extensively applied in the planning and recommendation of learning paths [15]. For instance, Mbaye B introduced an ontology-based collaborative filtering algorithm known as Ontology-CF, which leverages collaborative filtering techniques to model learners and domain knowledge, calculate similarity, predict scores, and generate recommended paths based on these scores [5]. Similarly, Wang et al. proposed a dynamic collaborative filtering algorithm [4] that recommends learning paths by dynamically calculating neighboring relationships and predicting scores based on learners’ records. Despite their widespread application, these methods exhibit two significant shortcomings in learning path planning and recommendation. First, they often encounter the cold start problem, which hinders their effectiveness in scenarios with limited data. Second, when collaborative filtering algorithms are applied in isolation for learning path planning and recommendation, the emphasis on learners’ interests may overshadow their personalized knowledge gaps, resulting in inappropriate recommendations.
Graph-based methods, particularly knowledge graph-based methods, are widely used in recommendation systems because they provide rich semantic information about items and their relationships, enhancing their accuracy and relevance, as well as addressing cold start issues by providing well-defined attributes and connections for new users and items, therefore facilitating initial recommendations [16]. Therefore, many scholars have investigated recommendation methods based on knowledge graphs without taking into account the special domain. For example, Ma et al. integrated induction of explainable rules from knowledge graphs with the construction of a rule-guided neural recommendation model, to improve robust performance over noisy item knowledge graphs, generated by linking item names to related entities [17]. Chen et al. considered ranking more than node, edge, or graph classification and proposed an improved recommendation method based on graph neural networks [18].
In the educational domain, given the unique characteristics of the education sector, knowledge graphs are extensively leveraged in the planning and recommendation of learning paths [19]. Knowledge graphs enable the conceptualization of entities such as courses and knowledge points, and the exploration of relationships among these entities, facilitating the derivation of effective learning paths. For instance, Cheng proposed a knowledge graph-based learning path recommendation method [7], in which a knowledge graph in the field of software engineering was constructed, and related information was gathered, such as the prior relationship between courses and the difficulty of each course. Using this information, the degree of course recommendation was quantitatively assessed, guiding learners toward appropriate learning paths. Chen et al. considered the semantic information in the knowledge graph and employed the TransR model to calculate the semantic vector of entities in the knowledge graph in order to improve the accuracy of learning path recommendations [20]. However, the methods in [7,20] did not take the learner’s information into account.
In line with the research conducted by [6,8], literature has emerged focusing on integrating knowledge graphs with collaborative filtering for learning path planning, which helps to address the cold start problem associated with collaborative filtering algorithms. While these methods provide the benefit of utilizing semantic relationships between knowledge points, they predominantly rely on user interests. However, they overlook the primary objective of educational recommendations, which is to assist learners in identifying and improving their weak knowledge areas to enhance learning efficiency.
Additionally, some researchers have applied intelligent algorithms, particularly intelligent evolutionary ones, such as generic or particle swarm, to the recommendation of learning paths [21,22,23,24]. However, these algorithms struggle to efficiently address large-scale combinatorial optimization problems, resulting in excessive computation and prolonged recommendation times. Specifically, they face challenges in solving learning path recommendation problems when numerous knowledge points are involved, as learners’ mastery of these points often necessitates connections across different courses.

2.2. Methods to Address Learners’ Weaknesses

There has been a notable emergence of efforts focused on crafting learning paths tailored to address learners’ weaknesses. These efforts hinge on identifying learners’ cognitive levels, achieved through traditional machine learning methods, such as clustering models, or by designing specialized cognitive models informed by learning data and customizing learning paths accordingly. As an example, as described in [10,25,26,27,28], a model was constructed using learners’ behaviors, and learning paths were developed by clustering learners’ characteristics through GA-Kmeans. While traditional machine learning clustering methods are useful, they possess inherent limitations in tailoring personalized learning path planning. The issue with these approaches lies in their tendency to offer identical recommendations to learners within the same category, thus failing to address the unique needs of individual learners.
Furthermore, numerous scholars have focused on developing cognitive diagnostic models, which can subsequently be used to plan personalized learning paths. These models assess the learning abilities of diverse learners, evaluate their mastery of knowledge points, and propose tailored learning paths to meet their needs [13,29,30]. However, it is important to note that these studies were not specifically designed for the online learning context. The cognitive diagnostic models heavily rely on learners repeatedly completing cognitive diagnostic tests, and, without access to such data, these methods become ineffective. Notably, in the meticulous diagnosis of learners in online settings, a valuable source of learning behavior data—learners’ video watching records—has been overlooked. Consequently, there is a pressing need to improve learning path recommendation methods based on these cognitive models to better accommodate online learning scenarios.
Following the analysis of the research landscape, it is apparent that existing learning path planning and recommendation methods in online learning scenarios fall short in designing paths that align with knowledge acquisition sequences based upon effectively identifying learners’ weak knowledge points. This reveals a crucial gap in methods capable of optimizing the learning sequence, enhancing both learning efficiency and the overall learning experience. In response to this gap, we propose KG-PLPPM.

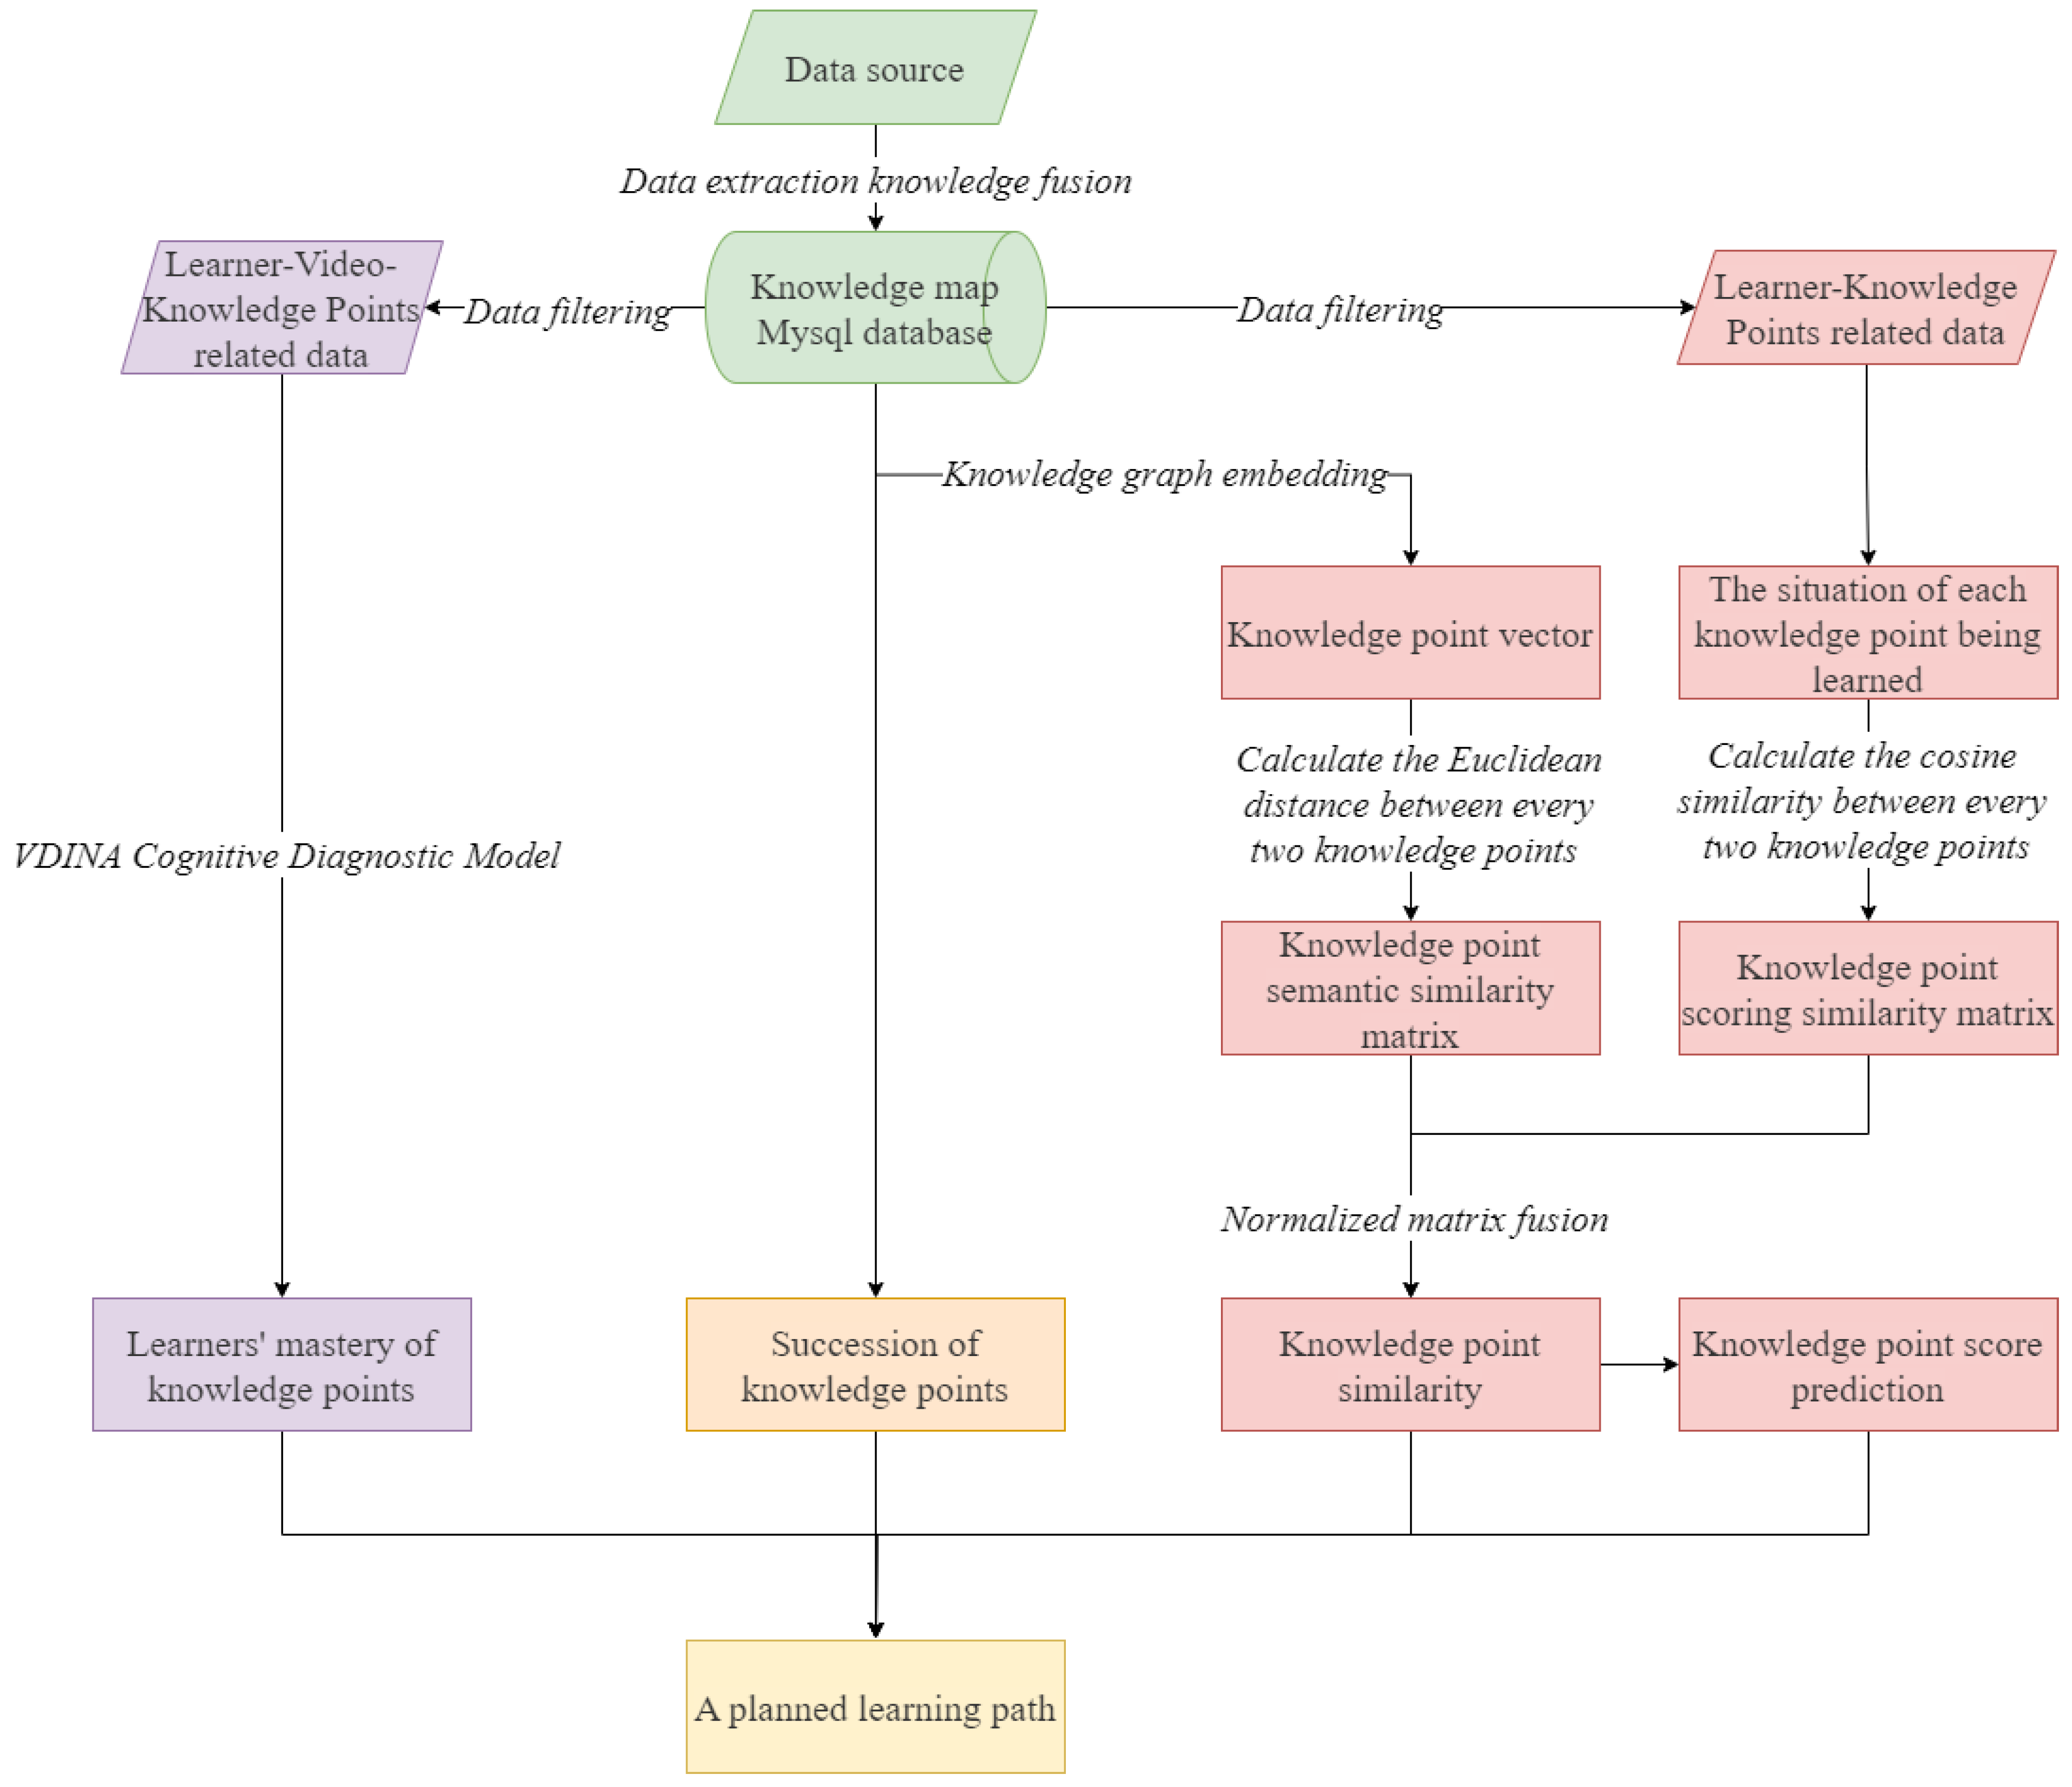
3. Knowledge Graph-Based Personal Learning Path Planning Method

This section provides details of the proposed method. First, the general procedure for the method is outlined. Next, the construction of the knowledge graphs and the evaluation of the similarities between knowledge concepts are explained. Finally, the algorithm for creating a comprehensive learning path tailored to the learner’s needs is presented.

3.1. General Procedure of KG-PLPPM

Figure 1 illustrates the general procedure of the proposed method for providing a learning path for individual learners. In the first step, as indicated by the green section of the figure, a knowledge graph is constructed to manage related data, which are then stored in a database for subsequent use. The next step involves evaluating the similarity between knowledge concepts to determine their relationships. As shown in the pink section of the figure, the method measures similarity between concepts by considering two factors: semantic similarity derived from the knowledge graph and score similarity from the user’s perspective. Meanwhile, the purple section indicates that a cognitive diagnostic model analyzes data recorded by the learning platform to identify each learner’s weak knowledge concepts. Finally, based on the calculated similarities of knowledge concepts, the mastery of those concepts assessed by the cognitive diagnostic model, and the succession relationships between them, a personalized learning path is planned and recommended for each learner, as outlined in the orange rectangle of the knowledge graph.

3.2. Knowledge Graph Construction

To conceptualize related knowledge within the domain of online learning, we begin by designing an ontology for the field. As shown in Figure 2, our ontology consists of five concept classes: Concept, Course, School, Teacher, and Field. The Field class represents a specific subject or area of education, such as Computer Science. Furthermore, each class’s related object and data properties are specialized in Figure 2.
Based on this ontology, we construct a knowledge graph using the open-source MOOCCube dataset [31], an online educational resource focused on the Computer Science domain. The MOOCCube dataset encompasses extensive information, including over 700 courses, nearly 40,000 videos, 110,000 concepts (knowledge points), and their successor relationships, along with historical learning data of 200,000 MOOC users regarding their course and video interactions. Specifically, we build the knowledge graph data layer by acquiring, extracting, cleaning, and aligning entities for knowledge fusion, thus creating a comprehensive knowledge graph for online learning.
The general process for knowledge graph construction is as follows. The MOOCCube dataset contains entity files and relationship files, both stored in JSON format. This semi-structured format facilitates a clear analysis of the extraction rules for entities, attributes, and relationships. Therefore, we adopted a rule-based and template-based knowledge extraction method, designing identification rules for these components. Using these rules, we automatically matched and identified entities, attributes, and relationships from the data source, storing the extracted results in a relational database. The database consists of entity tables with knowledge points, courses, schools, teachers, domains, students, videos, and relationship tables with domain–course, course–knowledge point, school–course, domain–knowledge point, teacher–course, school–teacher, student–course, student–video, and knowledge point succession.
Subsequently, to store, manage, and visualize the knowledge graph information using the Neo4j graph database, we generated a mapping file between the relational database and the knowledge graph ontology. Based on the mapping rules in this file, we converted the relational database into RDF data, which are formally represented in the form of SPO (Subject, Predicate, Object) triples. Each SPO triple has the format < e n t i t y , r e l a t i o n , e n t i t y > or < e n t i t y , a t t r i b u t e , a t t r i b u t e v a l u e > , representing a piece of knowledge within the knowledge graph. The RDF data were then uploaded to the Neo4j graph database, enabling the storage and visualization of a fine-grained subject area knowledge graph.

3.3. Similarity of Knowledge Concepts Evaluation

The learning path is closely linked to the relationships between different knowledge points. To enhance the accuracy of learning path recommendations, we propose a method for analyzing and evaluating the similarity between knowledge points. This method utilizes semantic information derived from the knowledge graph, as well as the user’s past learning records. The process consists of three main steps: first, calculating the semantic similarity of the knowledge nodes; second, calculating the score similarity of the knowledge nodes; and third, evaluating the final similarity by combining both semantic and score similarities.

3.3.1. The Semantic Similarity of the Knowledge Points

In the proposed method, the semantic similarity between knowledge points is determined by the relationships among entities in the knowledge graph. Given the challenges of working with high-dimensional data in the knowledge graph, it is essential to first embed the graph in a low-dimensional and dense semantic vector. Furthermore, the semantic similarity of computational knowledge points can be determined by measuring the Euclidean distance between two entities within this low-dimensional space.
To facilitate knowledge graph embedding, the TransR model is employed due to its effectiveness in addressing one-to-many and many-to-many relationships [32]. According to the foundational principles of the TransR model, the RDF triples of the knowledge graph are represented as ( E n t i t y , R e l a t i o n , E n t i t y ) , where entities include Concept, Course, School, Teacher, Field, and relations between entities include CourseHasConcept, FieldHasConcept, DependencyPrerequisite, and so on. The TransR model uses projections of the entity and the relationship space. As a result of training and optimizing the objective function, entities with actual relationships can be brought closer, whereas entities without relationships are separated. Notably, the training process of the TransR model considers both positive and negative samples simultaneously to widen the score gap between them, thereby optimizing the objective function.
When the score gap between positive and negative samples exceeds the margin, the objective function can be minimized, and the knowledge graph embedding based on the TransR model is completed. The result of knowledge graph embedding is the optimized feature expression vector of each entity and relationship. Taking the concept entity for example, suppose there are K concepts in the graph, which are recorded as a concept set S = ( S 1 , S 2 , , S K ) , and each concept S k ( 1 k K ) is embedded as a d-dimensional vector S k , S k = ( E 1 k , E 2 k , , E d k ) T , where E p k ( 0 p d ) represents the value of the j th  bit of the concept S k in the one-dimensional vector. After obtaining the embedding result of each concept, for any two concepts S i and S j , the Euclidean distance ( d ( S i , S j ) ) in Equation (1) can be used to calculate the semantic similarity ( s i m s g ( S i , S j ) ) between the two concepts, see Equation (2).
d ( S i , S j ) = p = 1 d ( E p i E p j ) 2
s i m s g ( S i , S j ) = 1 1 + d ( S i , S j ) = 1 1 + p = 1 d ( S p i S p j ) 2
S I M _ S G K × K = s i m _ s g 11 s i m _ s g 12 s i m _ s g 1 K s i m _ s g 21 s i m _ s g 22 s i m _ s g 2 K s i m _ s g K 1 s i m _ s g K 2 s i m _ s g K K
As illustrated in Equation (3), the semantic similarity between any two concepts can be represented by a S I M _ S G matrix, where s i m _ s g i j denotes the semantic similarity, s i m s g ( S i , S j ) , between concepts S i and S j . At this point, the semantic similarity of concepts based on the knowledge graph has been calculated.

3.3.2. The Score Similarity of the Knowledge Points

The similarity score of knowledge points reflects the degree of similarity from the users’ perspectives, which is determined by analyzing historical learning data of knowledge points through a collaborative filtering algorithm.
Specifically, for U learners P = { P 1 , P 2 , , P U } and K concepts S = { S 1 , S 2 , , S K } , the learner-concept learning information can be depicted using the matrix R U × K , as shown in Equation (4). Each row of R U × K represents a learner’s learning behavior, and each column represents a concept being learned. In Equation (4), r u k = 0 ( 1 u U , 1 k K ) means that the learner, P u , has not learned concept S k , while r u k = 1 denotes the opposite.
R U × K = r 11 r 12 r 1 K r 21 r 22 r 2 K r U 1 r U 2 r U K .
The learning situation vectors of all learners for concept S i can be expressed as S i = ( r 1 i , r 2 i , , r U i ) T . We can calculate the similarity between each pair of concepts using Equation (5).
s i m C F ( S i , S j ) = cos ( S i , S j ) = S i · S j S i · S j = u = 1 U S u i · S u j u = 1 U S u i 2 · u = 1 m S u j 2 ,
Then s i m _ c f i j , the obtained similarity between each pair of concepts ( s i m C F ( S i , S j ) ), can be used to form a concept scoring similarity matrix, as shown in Equation (6), in which s i m _ c f i j indicates the score similarity between concept S i and concept S j .
S I M _ C F K × K = s i m _ c f 11 s i m _ c f 12 s i m _ c f 1 K s i m _ c f 21 s i m _ c f 22 s i m _ c f 2 K s i m _ c f K 1 s i m _ c f K 2 s i m _ c f K K .

3.3.3. Fusion of Two Similarities

As stated in Equation (7), the semantic similarity between concepts calculated by knowledge graphs and the similarity scores of knowledge points derived from collaborative filtering algorithms are normalized and fused to form a final matrix of similarity ( S I M K × K ). The elements of this matrix, s i m i j , can be computed using Equation (8).
S I M K × K = s i m 11 s i m 12 s i m 1 K s i m 21 s i m 22 s i m 2 K s i m K 1 s i m K 2 s i m K K
s i m i j = α s i m _ s g i j s i m _ s g m i n s i m _ s g m a x s i m _ s g m i n + ( 1 α ) s i m _ c f i j s i m _ c f m i n s i m _ c f m a x s i m _ c f m i n
In particular, s i m _ s g m a x and s i m _ s g m i n denote the maximum and minimum values in the semantic similarity matrix, respectively. The term s i m _ s g i j s i m _ s g m i n s i m _ s g m a x s i m _ s g m i n represents the normalized semantic similarity of concepts S i and S j . Similarly, s i m _ c f m a x and s i m _ c f m i n indicate the maximum and minimum values in the scoring similarity matrix, respectively, while s i m _ c f i j s i m _ c f m i n s i m _ c f m a x s i m _ c f m i n signifies the score similarity of concepts S i and S j after normalization. Coefficient α ( 0 α 1 ) denotes the fusion factor of the two similarities. The similarity calculation of concepts has now been completed, which lays the groundwork for subsequent concept score prediction and learning path recommendation.

3.4. Concepts Mastery Evaluation

Identifying the learner’s possible weak knowledge points is crucial for planning an effective learning path. In the context of online learning scenarios, we propose a V-DINA cognitive diagnosis model that utilizes learners’ video learning records alongside the relevance of video knowledge points. Compared with the traditional DINA model [33], the proposed model overcomes several of its limitations, such as the restricted number of application scenarios due to the challenges associated with diagnostic information collection from learners’ test responses. Furthermore, we improve the simple discrete evaluation of knowledge points mastery status (mastery or non-mastery) in the DINA model by incorporating probabilistic modeling, which yields a continuous numerical assessment ranging from 0 to 1.

3.4.1. Learning Behaviors Modeling

To model the learning behaviors, we define U learners as P = { P 1 , P 2 , , P U } , V videos as J = { J 1 , J 2 , , J V } , and K concepts as S = { S 1 , S 2 , , S K } . Additionally, we define the matrix R U × V , referred to as the Learner-Video Learning Situation Matrix, to represent the situation of U learners watching the videos. Here, r u v is calculated as the ratio of the duration that learner P u spends watching video J v to the total duration of that video. The matrix Q V × K , noted as the Video-Concept Relation Matrix, is defined to indicate whether the video contains the knowledge concept or not, in which each row of the matrix is related to one video, while each column of the matrix is related to one concept. Thus, q v k = 1 indicates that video J v contains concept S k , and q v k = 0 indicates that it does not.
The cognitive level of each learner, P u , is represented by a concept mastery vector α u = { α u 1 , α u 2 , , α u K } , where each dimension corresponds to a concept and takes a continuous value from 0 to 1. Here, α u k denotes the probability that learner P u has mastered concept S k . Specifically, when learner P u has fully mastered concept S k , the value of α u k is 1. Conversely, when the learner has not mastered the concept at all, α u k is 0. The probability of learner P u watching video J v can be calculated using the following equation:
η u v = α u · q v q v · q v ,
where η u v represents the ratio of the number of concepts included in video J v that have been mastered by learner P u to the total number of concepts in video J v . α u represents the transpose of the concept mastery degree vector of learner P u , and q v denotes the v t h row of the Video-Concept Incidence Matrix, which is the concepts contained in video J v . Lastly, q v indicates the transpose of q v .
However, in real-life learning scenarios, learners’ behaviors can be random. Mastering all the concepts contained in a video does not necessarily imply that the learner has viewed the video entirety. Similarly, a learner who has completed watching the video may not have mastered all the concepts. To model these actual behaviors, we define two probability parameters. Specifically, s v ^ represents the probability of not watching the entire video while having mastered all the concepts. In contrast, g v ^ denotes the probability of watching the entire video but not mastering all concepts. Consequently, the probability of a learner watching the video in real life can be calculated with the following equation:
P v ( α u ) = P ( r u v = 1 | α u ) = g v 1 η u v ( 1 s v ) η u v ,
where P v ( α u ) is the probability of r u v = 1 ( r u v is the element in Learner-Video Learning Situation Matrix R U × V ), given that the cognitive level of learner P u is α u .

3.4.2. Evaluating Concepts Mastery of a Learner

The V-DINA method is implemented as follows. First, for the predefined Learner-Video Learning Situation Matrix and the Video-Concept Relation Matrix, the probability s v ^ and probability g v ^ for each video are estimated using the Expectation-Maximization Algorithm. Then, the concept mastery vector α u = { α u 1 , α u 2 , , α u K } for learner P u can be determined.
Specifically, α u k is a continuous value ranging from 0 and 1. We consider all possible posteriori probabilities, α , to obtain a probabilistic assessment of the learner’s mastery of each concept. This process involves probabilistic modeling of conceptual mastery. In particular, if there are K concepts, each with two states “mastered” and “not mastered”, then there are 2 K situations for K concepts.
Consequently, for learner P u , according to Equation (11), the mastery of concept S k , denoted as α u k , can be measured by a continuous value between 0 and 1. α u k ˜ represents the posterior probability of a learner’s mastery level of a specific knowledge point, which is taken as the mastery level α u k for that knowledge point. Finally, by calculating the mastery of each concept, the concept mastery vector, α u , of the learner can be determined.
α u k ˜ = P ( α u k = 1 | R u ) = α u k = 1 P ( α x | R u ) x = 1 2 K P ( α x | R u ) = α x k = 1 L ( R u | α x , s v ^ , g v ^ ) P ( α x ) x = 1 2 K P ( α x | R u ) = α x k = 1 v = 1 V L ( R u | α x , s v ^ , g v ^ ) P ( α x ) x = 1 2 K P ( α x | R u )

3.5. Learning Path Planning

In this subsection, an algorithm is proposed to create a personalized learning path for an individual, with the result of the knowledge point similarity assessment and the mastery level of knowledge points of a learner. As outlined in Algorithm 1 (see next page), the subsequent knowledge points of weak points are identified based on the knowledge graph. Through knowledge embeddings, collaborative filtering, and mastery level evaluation of knowledge points, the most similar and weakest prior knowledge points compared with the current knowledge points are selected as recommended learning nodes. This approach enables the creation of a comprehensive learning path tailored to the learner’s needs. The procedure of the algorithm is as follows:
(1)
For learner P u and course C, search for all concepts of course C in the knowledge graph, denoted as S a = { S a 1 , S a 2 , , S a K } .
(2)
Based on the concept similarity matrix, score predictions are performed for all concepts in S a . As shown in Equation (12), S P u i represents the score prediction of learner P u on concept S i ( S i S a ) . In this equation, N u represents the concepts contained in all courses learned by learner P u , t o p ( i , n ) signifies the top n concepts with the highest similarity to concept S i , s i m ( S i , S j ) indicates the similarity between concept S i and S j , and C u j denotes whether learner P u has learned concept S j or not. Specifically, when the concept has been learned, the value of C u j is 1; otherwise, it is 0. Furthermore, a concept with a higher score is more likely to be learned in the future.
S P u i = j N u , t o p ( i , n ) s i m ( S i , S j ) × C u j j N u , t o p ( i , n ) s i m ( S i , S j )
(3)
Using the concept mastery vector α u for learner P u , calculate the value of each concept of course C, which is the difference between the value of scoring prediction and the value of mastery degree. These values are then sorted in descending order and stored in the set S a u = { S a u 1 , S a u 2 , , S a u K } .
(4)
Sequentially select a concept from the set S a u as an alternative recommended node, denoting it as n o w _ c o n c e p t . Additionally, obtain the first-level prior concepts based on the knowledge graph. Using the results from the similarity matrix of knowledge points and the concept mastery vector, select the previous concept that is most similar and weakest, compared with the current alternative recommended concept ( n o w _ c o n c e p t ), and denote it as p r e _ c o n c e p t . If the concept is not already included in the current recommendation path, it should be added; otherwise, repeat step 4 with the next concept in the set S a u .
(5)
Set p r e _ c o n c e p t (obtained in step 4) as the current extracted alternative recommended concept, and repeat step 4 until there are no previous concepts related to the current concept, or the maximum path length is reached. At this point, the planned path for the current knowledge points ( p a t h _i) is established, and can be added to the final planned learning path ( p a t h _ a l l ).
(6)
Return to step 4, and repeat the process for each alternative recommended concept in the set S a u sequentially, until the planned learning path reaches the maximum length.
Algorithm 1 Personalized learning path recommendation based on knowledge graph
Input:
Computer domain knowledge graph;
A list of learner P u ’s mastery of each concept a u = { a u 1 , a u 2 a u K } ;
Collection of concepts S = { S 1 , S 2 , , S K } ;
Course A to be recommended;
Concept similarity matrix S I M K × K ;
Maximum number of successors m a x _ p r e ;
Maximum path length l e n g t h ;
A set of concept sequence relationships S pre 1 , S next 1 , S pre 2 , S next 2 , ;
Output:
The learning path recommended for learner P u .
1.  List<Concept> S a = Collection of concepts of course A;
2.  Map<String, Double> S P u = ;
   Calculating learners’ rating predictions for concepts
3.  for( S i in S a ){
4.    List<Concept> t o p ( i , n ) = Top n courses belong to N u with highest similarity to S i ;
5.    Double a, b;
6.    for( t o p ( i , n ) j in t o p ( i , n ) )
7.     if(Learner P u has learned concepts t o p ( i , n ) j )
8.      a += S I M [ i ] [ j ] ; b += S I M [ i ] [ j ] ;
9.     S P u .add( S i , a/b);
10.  }
11.  //Calculate the set of concepts to be recommended. The higher the level of
   concepts, the lower the degree of mastery and the higher the interest of learners.
12.  Map<Concept, Double> t e m p = The value of learner P u for the concepts of course
   A (score prediction-mastery level);
13.  sort( t e m p ); // Sort by value from large to small
14.  List<Concept> S a u = t e m p .key;
   A collection of concepts for the path to be recommended
15.  Recommend a learning path for each concept to be recommended
16.  List<Concept> c o n c e p t _ p a t h = ; //The learning path of each concept to be
   recommended
17.  for( S a u i in S a u ){
18.    if( c o n c e p t _ p a t h .size > l e n g t h ) break;//End of recommendation
19.    List<Concept> p a t h _ i = ;
20.    int m a x = Integer.MIN_VALUE;
21.    Concept n o w _ c o n c e p t = S a u i ;
22.    while( n o w _ c o n c e p t has prior concept && m a x _ p r e > 0){
23.     String p r e _ c o n c e p t ;
24.     for( n e w _ c o n c e p t : Prior concepts of n o w _ c o n c e p t ){
25.      int s i m n e w & n o w = s i m ( n e w _ c o n c e p t , n o w _ c o n c e p t );//Similarity
26.      int m a s t e r y = The value of n e w _ c o n c e p t in (1 − α u);//Weakness
27.      //Record the previous concept with the highest similarity + weakest
   degree as the next node on the path
28.      if( s i m n e w & n o w + m a s t e r y > m a x ){
29.        m i n = s i m n e w & n o w + m a s t e r y ;
30.        p r e _ c o n c e p t = n e w _ c o n c e p t ;
31.      }
32.    }
33.      p a t h _ i .add( p r e _ c o n c e p t );
34.      n o w _ c o n c e p t = p r e _ c o n c e p t ;
35.      m a x _ p r e −−;
36.    }
37.     c o n c e p t _ p a t h .add( p a t h _ i ); //Join learning path of weak c o n c e p t a u i
38.  }
39.   return c o n c e p t _ p a t h ;
A detailed flow chart of the method can be found in Figure 3.

4. Experiments

4.1. Experimental Settings and Parameter Settings

This section presents several experiments designed to verify the effectiveness of the proposed method in arranging knowledge sequence relationships and improving learning efficiency. The fusion factor used to calculate the similarity between knowledge points is set at 0.7. Two existing methods serve as comparisons in the experiments: the first method is Trans-CF, which is based on a knowledge graph and the traditional collaborative filtering recommendation algorithm [8], while the second method is Ontology-CF, which relies on ontology and the collaborative filtering recommendation algorithm [5].
Our experiments utilize data from the open-source MOOCCube dataset, which encompasses a wide range of information, including courses, teaching videos, knowledge points, concepts, user course selections, and video viewing records. The knowledge graph constructed from this dataset consists of 12,923 entities, such as concepts, courses, schools, teachers, and fields, as well as 173,276 relationships among them. We extracted various learner-related data provided by the MOOCCube dataset, including information on 15,921 learners, 88,220 course selection records, 11,946,959 concept learning records, and 2,384,681 video viewing records. For example, supposing we are using a learner’s data to make learning path recommendations; the path length is set as 5, with a 50% mastery of concepts along the original learning path. Using this information, KG-PLPPM plans and recommends fourteen distinct learning paths for this learner. Each node in the path is referred to as a Knowledge Point (Course). One example of a proposed learning path is: “Address (Assembly Language Programming) → Data Communication (Computer Networks) → Bits (Introduction to Computational Thinking) → Binary (Advanced Language Programming) → Operations (Advanced Language Programming)”.

4.2. Experiments on Knowledge Sequence Relationships

It is well established that following the sequence of knowledge points aids learners in learning more efficiently. Additionally, the length of the learning path (the maximum number of prior concepts in the learning path) serves as an adjustable parameter that enhances learners’ autonomy. Consequently, the first experiment focuses on the sequence relationships between the knowledge points in the planned learning path. Particularly, we examine the sequence of knowledge points with different maximum numbers of prior concepts, including 2, 4, 6, 8, and 10.
To illustrate the knowledge sequence relationships, we utilize the sequence degree of the nodes within the planned learning path. This metric effectively measures the likelihood that two adjacent nodes in the recommended learning path maintain a sequential relationship. In particular, assuming that a recommendation algorithm proposes a learning path α = a 1 , a 2 , a 3 , a 4 , , a n 1 , a n for a course being learned by a learner, the equation for calculating the sequence degree of nodes in this path is shown in Equation (13), where a i represents a recommended concept node in the learning path, and f ( a i , a i + 1 ) indicates whether there is a sequence relationship between two adjacent concepts, a i and a i + 1 , in the path. If such a relationship exists, the value of f ( a i , a i + 1 ) will be 1; otherwise, it will be 0.
C o n c e p t S e q u e n c e D e g r e e = i = 1 n 1 f ( a i , a i + 1 ) n 1
Following Equation (13), we calculate the sequence degree of the concepts recommended by our proposed KG-PLPPM, Trans-CF, and Ontology-CF. The experimental results are presented in Table 1. To analyze these results, Figure 4 illustrates the data, where the x-axis represents the maximum number of prior concepts attained during the planning of a new learning path, and the y-axis denotes the calculated sequence degree of concepts within that path. Furthermore, we use green, yellow, and orange bars to represent the sequence degree of concepts derived from KG-PLPPM, Ontology-CF, and Trans-CF, respectively.
As shown in the figure, since the length of a learning path cannot be adjusted in either Trans-CF or Ontology-CF, the sequence degrees of the learning paths recommended by these methods, across various maximum numbers of prior concepts, remain virtually identical and close to zero. Consequently, the concepts within these learning paths appear disorganized and chaotic, which hinders systematic learning. In contrast, a monotonically increasing trend is observed in the sequence degree of the learning path recommended by the KG-PLPPM method as the maximum number of prior concepts increases. Notably, regardless of the maximum number of prior concepts, the sequence degree of the learning path suggested by the KG-PLPPM method is significantly higher than that of Trans-CF and Ontology-CF. This indicates that the concepts in the learning path planned by our proposed method are arranged in a more coherent sequence, allowing learners to grasp the fundamental concepts first before progressing to more advanced topics in a structured manner. The proposed method aligns more closely with typical learner habits, enhances the learning experience, increases user satisfaction, and improves explainability.

4.3. Experiments on Learning Efficiency

This experiment focuses on the learning efficiency of a learner following a particular learning path. More specifically, a learner’s learning efficiency is measured by the improvement in his or her knowledge concept mastery after engaging with various learning paths within the same period of learning time. The V-DINA model is employed to calculate the mastery of these concepts.
We use the data from the MOOCCube dataset, which contains records that demonstrate how a learner studies a course. It is considered to be the original learning path, represented as α = a 1 , a 2 , a 3 , a 4 , , a s u m 2 , a s u m 1 , a s u m . After the learner has studied the first k% of the concepts along the path within the same learning time, three new learning paths can be planned, respectively, using KG-PLPPM, Trans-CF, and Ontology-CF, expressed as β = a 1 , a 2 , a 3 , a 4 , , a s u m 2 , a s u m 1 , a s u m , χ = a 1 , a 2 , a 3 , a 4 , , a s u m 2 , a s u m 1 , a s u m , and δ = a 1 , a 2 , a 3 , a 4 , , a s u m 2 , a s u m 1 , a s u m .
Based on this setup, we use the V-DINA model to compute the mastery degree of each knowledge concept included in the course for a learner following diverse learning paths.
Consequently, the original learning path recorded in the database serves as a basis for comparing diverse learning paths. Compared with the basis, as in Equations (14)–(16), the proportion of improvement in knowledge concept mastery after following the learning paths obtained through KG-PLPPM, Trans-CF, and Ontology-CF can be calculated.
β _ i m p r o v e _ C o u r s e i = C o n c e p t i C o u r s e i t h e k n o w l d g e c o n c e p t m a s t e r y d e g r e e f o l l o w i n g β C o n c e p t j C o u r s e i t h e k n o w l d g e c o n c e p t m a s t e r y d e g r e e f o l l o w i n g α × 100 %
χ _ i m p r o v e _ C o u r s e i = C o n c e p t i C o u r s e i t h e k n o w l d g e c o n c e p t m a s t e r y d e g r e e f o l l o w i n g χ C o n c e p t j C o u r s e i t h e k n o w l d g e c o n c e p t m a s t e r y d e g r e e f o l l o w i n g α × 100 %
δ _ i m p r o v e _ C o u r s e i = C o n c e p t i C o u r s e i t h e k n o w l d g e c o n c e p t m a s t e r y d e g r e e f o l l o w i n g δ C o n c e p t j C o u r s e i t h e k n o w l d g e c o n c e p t m a s t e r y d e g r e e f o l l o w i n g α × 100 %
To enhance the sensitivity analysis of our method, we conduct experiments to assess the impact on learning efficiency across various scenarios. These scenarios include varying values of k% (the percentage of learned concepts in the learning path) and the length of the learning path (the maximum number of prior concepts), allowing us to comprehensively evaluate our method’s performance under different conditions.

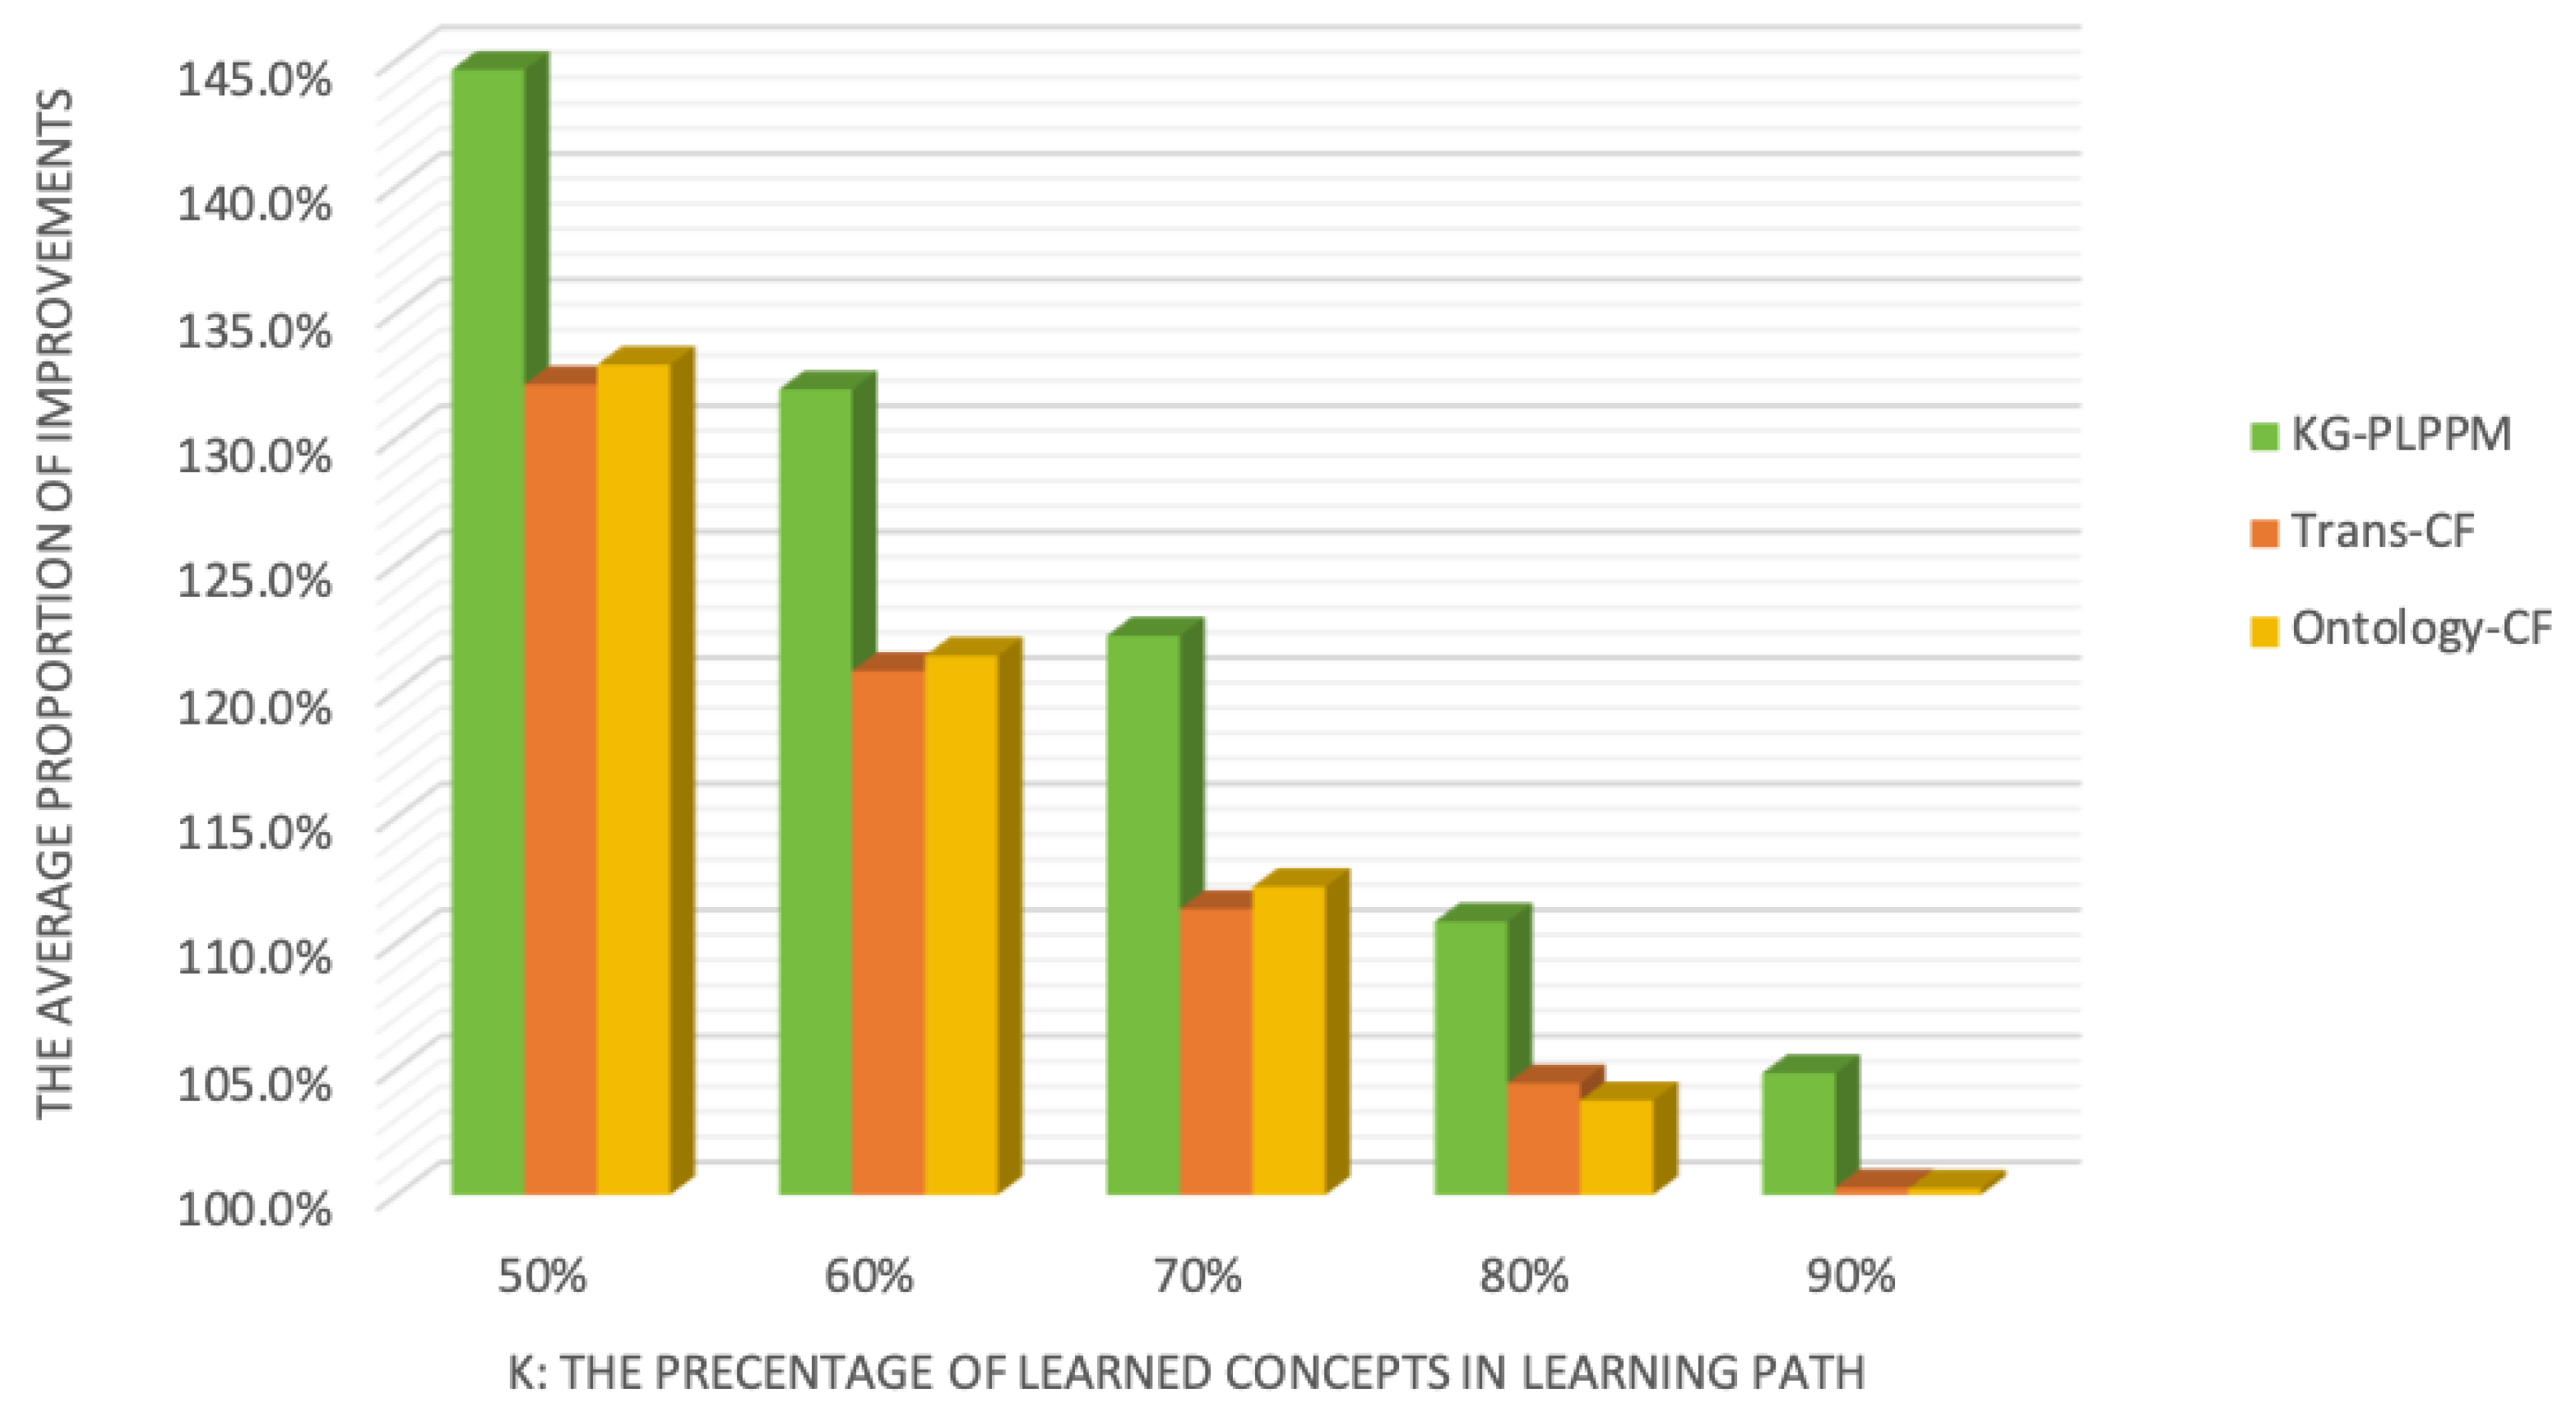
4.3.1. Experiments with Different Percentages of Learned Concepts in the Learning Path

In our experiments, we maintain a fixed learning path length of 4. We investigate the variable k%, which represents the percentage of concepts learned along the original learning path provided by the dataset. The values of k% considered in our experiment include 50%, 60%, 70%, 80%, and 90%. The experimental results are presented in Table 2. To analyze the experimental results, Figure 5 displays the variable k% on the horizontal axis, and the average proportion of improvement in knowledge concept mastery on the vertical axis. Specifically, the green bar represents results from KG-PLPPM, the orange bar depicts results from the Trans-CF method, and the yellow bar illustrates outcomes from the Ontology-CF method. It can be seen that the proposed method outperforms the other two.

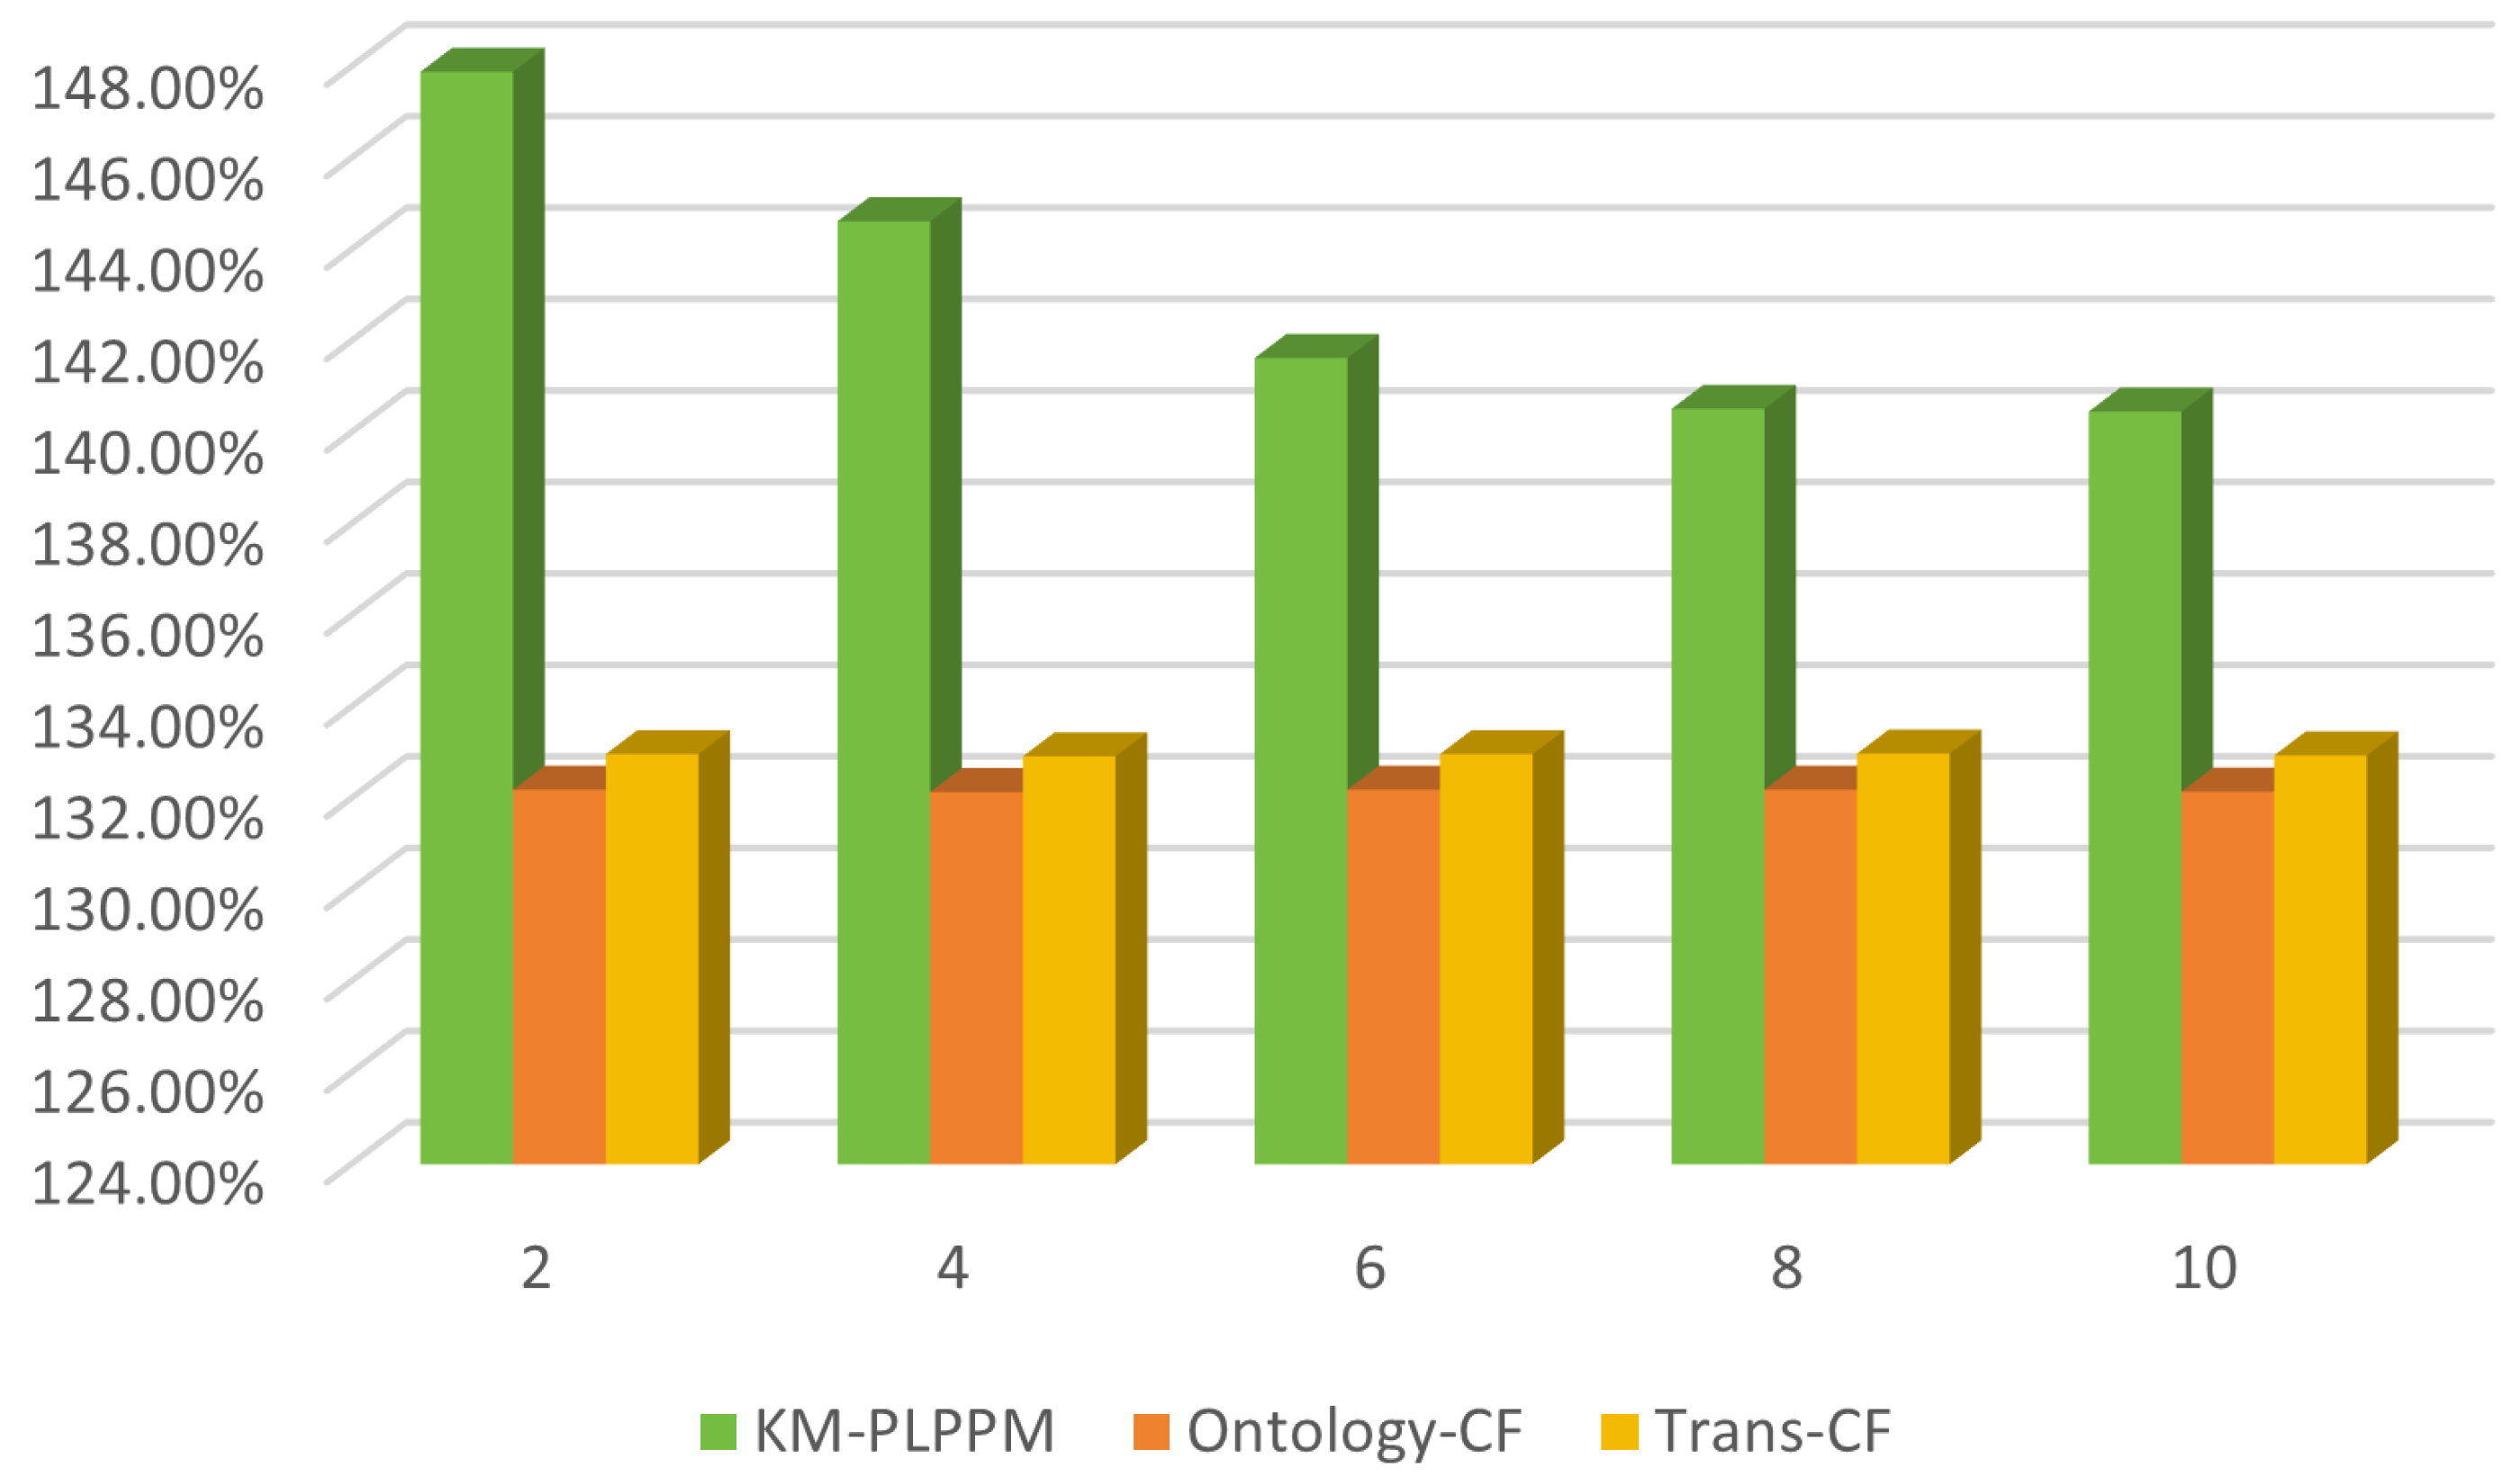
4.3.2. Experiments with a Variety of Learning Path Lengths

In the experiments, we select the k% value of 50%, which demonstrated the most substantial improvement in learning efficiency in prior experiments. Building upon this finding, we examine variable learning path lengths of 2, 4, 6, 8, and 10 to assess the enhancement of learning efficiency across three methods.
The corresponding experimental results are presented in Table 3 and Figure 6. In Figure 6, the horizontal axis represents the variable learning path lengths, while the vertical axis indicates the average proportion of improvement in knowledge concept mastery achieved by following a learning path generated by a particular method. Similarly, the green, orange, and yellow bars illustrate the results obtained from our KG-PLPPM method, the Trans-CF method, and the Ontology-CF method. It can be noticed that all three methods provide learners with a learning path that is superior to the original learning path in terms of knowledge mastery. Meanwhile, when the path length is set to any value of 2, 4, 6, 8, or 10, KG-PLPPM consistently outperforms other methods in terms of percentage improvement in learning efficiency.

5. Discussion

Upon analyzing the experimental results, we observe from Table 2 and Figure 5 that the ordinate values of the three colored bars are all greater than 100 percent, indicating that all three methods provide learners with a path that enhances mastery of knowledge concepts compared with the original learning path. However, as k increases, the heights of the green, orange, and yellow columns exhibit a downward trend. There is a reason for this phenomenon: when the total length of the path remains unchanged, but the percentage of learning progress completed increases, the longer the original learning path adopted by the learner and the shorter the recommended learning path will be. Consequently, learning efficiency gradually declines, leading to the decreased heights of all three colored bars. When considering various values of k, the green bars consistently show significantly higher values compared with the orange and yellow bars, indicating that the KG-PLPPM method is the most effective for improving learning efficiency by enabling learners to effectively master knowledge concepts.
Focusing on the proposed KG-PLPPM, we can notice from Table 3 and Figure 6 that the efficiency decreases as the path length setting increases. This decrease can be attributed to learners dedicating more time to mastering prerequisite knowledge associated with weaker concepts along longer learning paths. Simultaneously, this phenomenon has also been demonstrated in experiments to analyze the effectiveness of our method using a variety of learning path length configurations and k% (the percentage of learned concepts in the learning path) values. Table 4 summarizes these experimental results.
Despite the better performance exhibited by KG-PLPPM, the current work has certain limitations that will guide our future research directions. First, the current KG-PLPPM requires that the recommended and planned path lengths be set to specific values. Therefore, we aim to enhance the learning path planning and recommendation method to intelligently determine the optimal length based on individual learner’s historical data. This enhancement will advance the personalization and intelligence of the learning path planning and recommendation method, maximizing its effectiveness in improving learners’ efficiency. Second, mastery of learning knowledge points significantly affects the effectiveness of learning path recommendations; however, this mastery is difficult to measure and is assumed to be known in the proposed method. Thus, follow-up research can be conducted utilizing diverse and multimodal data on learners’ learning behaviors to diagnose their cognitive states. For instance, key and mouse behaviors can be analyzed to assess learners’ attention levels while engaging with specific knowledge point videos. This will enable us to better evaluate learners’ mastery of the material and provide them with learning paths that are more closely aligned with their individual mastery levels.

6. Conclusions

In light of the online learning scenario and issues currently existing in literature, the paper proposed a method for planning personalized learning paths based on a domain knowledge graph (KG-PLPPM), which takes into account knowledge point relationships and individual cognitive profiles of learners. Specifically, a knowledge graph for the educational domain using the open-source MOOCCube dataset was constructed. Based on that, we improved the cognitive diagnosis model and developed methods for evaluating the similarity of knowledge concepts, assessing learners’ degrees of concept mastery, and implementing an algorithm that plans learning paths by leveraging relationships between concepts and the mastery levels of those concepts. The experimental results indicate that, based on the learning path planned by KG-PLPPM, no matter how the learning path is lengthened, the nodes are arranged in the order of knowledge points. Furthermore, in learning scenarios with varying progressions and path length settings, learners following the KG-PLPPM-planned learning path can achieve a learning efficiency increase of between 104.75% and 147.89% compared with those following the original learning path. From a practical application perspective, our team has incorporated the aforementioned research into our self-developed Yoyo Smart Education Platform. The experimental results and the integration of KG-PLPPM within the platform demonstrate that our proposed KG-PLPPM can enhance the coherence and relevance of learning resource recommendations, assist learners in filling knowledge gaps, and improve overall learning efficiency.

Author Contributions

Conceptualization, Y.L. (Yishuai Lin) and B.H.; methodology, B.H.; software, C.F. and C.L.; validation, Y.L. (Yishuai Lin), B.H. and Y.L. (Yuechen Li); formal analysis, Y.L. (Yuechen Li); investigation, Y.L. (Yuechen Li); writing—original draft preparation, B.H. and Y.L. (Yuechen Li); writing—review and editing, B.H. and Y.L. (Yishuai Lin); visualization, X.W.; supervision, Y.L. (Yishuai Lin); project administration, Y.L. (Yishuai Lin) and B.H.; funding acquisition, Y.L. (Yishuai Lin) and B.H. All authors have contributed substantially to the work. All authors have read and agreed to the published version of the manuscript.

Funding

This research was supported in part by the National Natural Science Foundation of China Youth Program, grant number 62202352, 62003363, 62303485, the Basic and Applied Basic Research Program of Guangdong Province, grant number 2021A1515110518, Shaanxi Province Natural Science Basic Research Program, grant number 2022KJXX-99, and Research Project on Teaching Reform in Higher Education of Shaanxi Province, grant number 23BY024.

Informed Consent Statement

Not applicable.

Data Availability Statement

Data are contained within the article.

Conflicts of Interest

The authors declare no conflicts of interest.

References

  1. Dhawan, S. Online learning: A panacea in the time of COVID-19 crisis. J. Educ. Technol. Syst. 2020, 49, 5–22. [Google Scholar] [CrossRef]
  2. Conrad, C.; Deng, Q.; Caron, I.; Shkurska, O.; Skerrett, P.; Sundararajan, B. How student perceptions about online learning difficulty influenced their satisfaction during Canada’s Covid-19 response. Br. J. Educ. Technol. 2022, 53, 534–557. [Google Scholar] [CrossRef] [PubMed]
  3. Warrick, A. Strategies for Reducing Cognitive Overload in the Online Language Learning Classroom. Int. J. Second Foreign Lang. Educ. 2021, 1, 25–37. [Google Scholar] [CrossRef]
  4. Wang, H.; Fu, W. Personalized learning resource recommendation method based on dynamic collaborative filtering. Mob. Netw. Appl. 2021, 26, 473–487. [Google Scholar] [CrossRef]
  5. Mbaye, B. Recommender System: Collaborative Filtering of e-Learning Resources. In Proceedings of the International Association for Development of the Information Society, International Association for Development of the Information Society, Madrid, Spain, 4–7 June 2018; pp. 213–217. [Google Scholar]
  6. Amane, M.; Aissaoui, K.; Berrada, M. ERSDO: E-learning recommender system based on dynamic ontology. Educ. Inf. Technol. 2022, 27, 7549–7561. [Google Scholar] [CrossRef]
  7. Cheng, S. Research on Learning Path Recommendation Based on MOOC Platform Data in the View of Knowledge Graph. Mod. Inf. Technol. 2022, 6, 169–172. [Google Scholar]
  8. Yang, Z.; Guiyun, Z. Collaborative filtering recommendation algorithm fuses semantic nearest neighbors based on knowledge graph. In Proceedings of the 2020 Asia-Pacific Conference on Image Processing, Electronics and Computers (IPEC), Dalian, China, 14–16 April 2020; IEEE: Piscataway, NJ, USA, 2020; pp. 470–474. [Google Scholar]
  9. Raj, N.S.; Renumol, V. An improved adaptive learning path recommendation model driven by real-time learning analytics. J. Comput. Educ. 2024, 11, 121–148. [Google Scholar] [CrossRef]
  10. Wang, X.; Zhu, Z.; Yu, J.; Zhu, R.; Li, D.; Guo, Q. A learning resource recommendation algorithm based on online learning sequential behavior. Int. J. Wavelets Multiresolution Inf. Process. 2019, 17, 1940001. [Google Scholar] [CrossRef]
  11. Chen, J.; Fang, H.; Lin, H.; Zheng, H.; Yang, D.; Zhou, X. Personal Learning Recommendation Based on Online Learning Behavior Analysis. Comput. Sci. 2018, 45, 422–426+452. [Google Scholar]
  12. Tang, C.L.; Liao, J.; Wang, H.C.; Sung, C.Y.; Lin, W.C. Conceptguide: Supporting online video learning with concept map-based recommendation of learning path. In Proceedings of the Web Conference 2021, Ljubljana, Slovenia, 19–23 April 2021; pp. 2757–2768. [Google Scholar]
  13. Nabizadeh, A.H.; Leal, J.P.; Rafsanjani, H.N.; Shah, R.R. Learning path personalization and recommendation methods: A survey of the state-of-the-art. Expert Syst. Appl. 2020, 159, 113596. [Google Scholar] [CrossRef]
  14. Urdaneta-Ponte, M.C.; Mendez-Zorrilla, A.; Oleagordia-Ruiz, I. Recommendation systems for education: Systematic review. Electronics 2021, 10, 1611. [Google Scholar] [CrossRef]
  15. Tahir, S.; Hafeez, Y.; Abbas, M.A.; Nawaz, A.; Hamid, B. Smart learning objects retrieval for E-Learning with contextual recommendation based on collaborative filtering. Educ. Inf. Technol. 2022, 27, 8631–8668. [Google Scholar] [CrossRef]
  16. Lecue, F. On the role of knowledge graphs in explainable AI. Semant. Web 2020, 11, 41–51. [Google Scholar] [CrossRef]
  17. Ma, W.; Zhang, M.; Cao, Y.; Jin, W.; Wang, C.; Liu, Y.; Ma, S.; Ren, X. Jointly learning explainable rules for recommendation with knowledge graph. In Proceedings of the World Wide Web Conference, San Francisco, CA, USA, 13–17 May 2019; pp. 1210–1221. [Google Scholar]
  18. Chen, Z.; Silvestri, F.; Wang, J.; Zhang, Y.; Huang, Z.; Ahn, H.; Tolomei, G. Grease: Generate factual and counterfactual explanations for gnn-based recommendations. arXiv 2022, arXiv:2208.04222. [Google Scholar]
  19. Chen, Y.; Li, H.; Li, H.; Liu, W.; Wu, Y.; Huang, Q.; Wan, S. An overview of knowledge graph reasoning: Key technologies and applications. J. Sens. Actuator Netw. 2022, 11, 78. [Google Scholar] [CrossRef]
  20. Chen, P.; Zhu, Y. Recommendation algorithm incorporating representation learning of knowledge graph with matrix factorization. Comput. Eng. Des. 2018, 39, 3137–3142. [Google Scholar]
  21. Dwivedi, P.; Kant, V.; Bharadwaj, K.K. Learning path recommendation based on modified variable length genetic algorithm. Educ. Inf. Technol. 2018, 23, 819–836. [Google Scholar] [CrossRef]
  22. Niknam, M.; Thulasiraman, P. LPR: A bio-inspired intelligent learning path recommendation system based on meaningful learning theory. Educ. Inf. Technol. 2020, 25, 3797–3819. [Google Scholar] [CrossRef]
  23. Liu, C.; Zhang, H.; Zhang, J.; Zhang, Z.; Yuan, P. Design of a Learning Path Recommendation System Based on a Knowledge Graph. Int. J. Inf. Commun. Technol. Educ. 2023, 19, 1–18. [Google Scholar] [CrossRef]
  24. Ouissem Benmesbah, M.L.; Hafidi, M. An improved constrained learning path adaptation problem based on genetic algorithm. Interact. Learn. Environ. 2023, 31, 3595–3612. [Google Scholar] [CrossRef]
  25. Lin, L.; Wang, F.; Wang, F. Research on Learning Resource Recommendation Based on Learner Model. In Proceedings of the 2022 5th International Conference on Education Technology Management, Lincoln, UK, 16–18 December 2022; pp. 45–50. [Google Scholar]
  26. Ali, S.; Hafeez, Y.; Humayun, M.; Jamail, N.S.M.; Aqib, M.; Nawaz, A. Enabling recommendation system architecture in virtualized environment for e-learning. Egypt. Inform. J. 2022, 23, 33–45. [Google Scholar] [CrossRef]
  27. Li, J. A recommendation model for college English digital teaching resources using collaborative filtering and few-shot learning technology. Comput. Intell. Neurosci. 2022, 2022, 1233057. [Google Scholar] [CrossRef] [PubMed]
  28. Agarwal, A.; Mishra, D.S.; Kolekar, S.V. Knowledge-based recommendation system using semantic web rules based on Learning styles for MOOCs. Cogent Eng. 2022, 9, 2022568. [Google Scholar] [CrossRef]
  29. Paulsen, J.; Valdivia, D.S. Examining cognitive diagnostic modeling in classroom assessment conditions. J. Exp. Educ. 2022, 90, 916–933. [Google Scholar] [CrossRef]
  30. Wanichsan, D.; Panjaburee, P.; Chookaew, S. Enhancing knowledge integration from multiple experts to guiding personalized learning paths for testing and diagnostic systems. Comput. Educ. Artif. Intell. 2021, 2, 100013. [Google Scholar] [CrossRef]
  31. Yu, J.; Luo, G.; Xiao, T.; Zhong, Q.; Wang, Y.; Feng, W.; Luo, J.; Wang, C.; Hou, L.; Li, J.; et al. MOOCCube: A large-scale data repository for NLP applications in MOOCs. In Proceedings of the 58th Annual Meeting of the Association for Computational Linguistics, Online, 5–10 July 2020; pp. 3135–3142. [Google Scholar]
  32. Lin, Y.; Liu, Z.; Sun, M.; Liu, Y.; Zhu, X. Learning entity and relation embeddings for knowledge graph completion. In Proceedings of the AAAI Conference on Artificial Intelligence, Austin, TX, USA, 25–30 January 2015; Volume 29. [Google Scholar]
  33. De La Torre, J. DINA model and parameter estimation: A didactic. J. Educ. Behav. Stat. 2009, 34, 115–130. [Google Scholar] [CrossRef]
Figure 1. The general procedure of KG-PLPPM.
Electronics 14 00255 g001
Figure 2. An ontology for conceptualizing online learning resource data.
Electronics 14 00255 g002
Figure 3. The detailed algorithm flow chart of KG-PLPPM.
Electronics 14 00255 g003
Figure 4. Comparison experiment of concept sequence degrees.
Electronics 14 00255 g004
Figure 5. Comparison experiments of learning efficiency with different percentages of learned concepts in the learning path.
Electronics 14 00255 g005
Figure 6. Comparison experiments of the learning efficiency with different lengths of learning paths.
Electronics 14 00255 g006
Table 1. The experimental results of concept sequence degrees obtained by the three methods.
The Maximum Number of Prior ConceptsConcepts Sequence Degree
Trans-COntology-CFKG-PLPPM
20.00440.00340.2895
40.00440.00340.4751
60.00440.00340.5531
80.00440.00340.5855
100.00440.00340.6023
Table 2. The experimental results of the average learning efficiency with variable k% in the learning path length of 4.
The Percentage of Learned Concepts in Learning PathThe Average Proportion of Improvements
KG-PLPPMTrans-CFOntology-CF
50%144.62%132.14%132.92%
60%131.95%120.78%121.38%
70%122.18%111.34%112.22%
80%110.84%104.13%103.75%
90%104.83%100.29%100.26%
Table 3. The experimental results of the average learning efficiency with variable learning path length in k % = 50 % .
The Learning Path LengthThe Average Proportion of Learning Efficiency Improvements
KG-PLPPMTrans-CFOntology-CF
2147.89%132.19%132.97%
4144.62%132.14%132.92%
6141.63%132.19%132.97%
8140.52%132.19%132.98%
10140.46%132.15%132.94%
Table 4. Experiments with a variety of learning path lengths and the percentage of concepts learned.
The Learning Path LengthThe Average Proportion of Learning Efficiency Improvements
50%60%70%80%90%
2147.89%134.12%123.38%111.46%104.75%
4144.62%131.95%122.18%110.84%104.83%
6141.63%130.12%120.96%110.21%104.86%
8140.52%129.77%120.42%109.98%104.94%
10140.46%129.69%119.96%109.92%104.97%
Disclaimer/Publisher’s Note: The statements, opinions and data contained in all publications are solely those of the individual author(s) and contributor(s) and not of MDPI and/or the editor(s). MDPI and/or the editor(s) disclaim responsibility for any injury to people or property resulting from any ideas, methods, instructions or products referred to in the content.

