Article

Aging-Aware Character Recognition with E-Textile Inputs

1
School of Informatics, Xiamen University, Xiamen 361005, China
2
China Mobile (Hangzhou) Information Technology Co., Ltd., Hangzhou 311121, China
*
Author to whom correspondence should be addressed.
Electronics 2025, 14(19), 3964; https://doi.org/10.3390/electronics14193964
Submission received: 4 August 2025 / Revised: 16 September 2025 / Accepted: 22 September 2025 / Published: 9 October 2025
(This article belongs to the Special Issue End User Applications for Virtual, Augmented, and Mixed Reality)

Abstract

E-textiles, a type of textile integrated with conductive sensors, allows users to freely utilize any area of the body in a convenient and comfortable manner. Thus, interactions with e-textiles are attracting more and more attention, especially for text input. However, the functional aging of e-textiles affects the characteristics and even the quality of the captured signal, presenting serious challenges for character recognition. This paper focuses on studying the behavior of e-textile functional aging and alleviating its impact on text input with an unsupervised domain adaptation technique, named A2TEXT (aging-aware e-textile-based text input). We first designed a deep kernel-based two-sample test method to validate the impact of functional aging on handwriting with an e-textile input. Based on that, we introduced a so-called Gabor domain adaptation technique, which adopts a novel Gabor orientation filter in feature extraction under an adversarial domain adaptation framework. We demonstrated superior performance compared to traditional models in four different transfer tasks, validating the effectiveness of our work.

1. Introduction

In the past decade, XR techniques, including Virtual Reality (VR), Augmented Reality (AR), Mixed Reality (MR), etc., have undergone rapid development. On the one hand, various head-mounted displays have emerged, such as Microsoft HoloLens, Oculus Rift, HTC Vive, and the recent Apple Vision Pro, greatly extending user experiences of XR. On the other hand, the concept of the metaverse [1] has spread rapidly over many areas, further promoting the popularity of XR among general consumers.
As the current representative device to access content in the metaverse, mobile headsets have demonstrated remarkable improvements, especially in user mobility, leading to urgent requirements with respect to novel interaction techniques. To be specific, bulky keyboards and mice are no longer suitable. Hands, together with the body, are freed to perform various gestures for operations, like pointing at or manipulating objects. While many modalities can be adopted to capture gestures (visual, optical, IMU-driven, etc.), the human body has the potential to become the most convenient and ready-to-use interaction surface. Sensors can be directly attached to the body [2,3]. E-textiles provide a more comfortable and convenient on-body solution and thus are considered a promising candidate for the next generation of mobile user input. Regarding text input, there are many possible candidate devices; however, they present various drawbacks. Firstly, holding the device [4] is inconvenient and not always possible; secondly, hand wearables [5] could be cumbersome in a mobile context and suffer from precision problems; thirdly, eye or head tracking [6] requires considerable visual attention and constant head movements, which are difficult in a mobile environment and quickly tire out the user; fourthly, although vocal text entry [7] seems to be the most natural technique and exhibits good performance, it may not be available in private or even confidential situations. In contrast, e-textiles do a good job of avoiding these problems and thus they are beginning to be adopted in several studies for text input [8,9]. However, a major issue with e-textiles is functional aging [10]. During their service life, e-textiles are exposed to different influential elements or processes (such as mechanical stress, chemical corrosion, etc.), leading to aging and functional loss, which greatly distorts captured signals. Such issues are especially serious for direct text input methods [9,11].
This paper explores the use of stable and durable handwritten recognition for XR scenarios with e-textiles as the user interface. We investigate, maybe for the first time so far as we know, the impact of e-textile functional aging on text input and show how to alleviate such an issue in the following step which focuses on handwritten recognition with a domain adaptation technique. Promising results were achieved compared to existing methods for handwritten character recognition. The main contributions of this study include the following:
  • A deep kernel-based two-sample test method for data distribution validation. A deep neural network is used to extract a feature representation of the high-dimensional image data, under which the source domain and target domain can be well separated, and thus obtain a well-parameterized kernel.
  • A Gabor domain adaptation technique for handwritten character recognition, with a newly designed Gabor orientation convolution introduced for consideration of transformation invariance.
  • A series of experiments to demonstrate the feasibility of proposed techniques.
The remainder of the manuscript is organized as follows. Related studies are examined in Section 2. Technical details, including methods of data preparation, data distribution analysis, and character recognition, are distilled in Section 3, Section 4, and Section 5, respectively. Experimental results are reported in Section 6 and Section 7 provides a summary of the whole manuscript.

2. Related Work

2.1. Interaction with E-Textile

As an emerging class of wearable devices, e-textiles are promising candidate as the next-generation platform for human body sensing and control [12]. Due to their high sensitivity, passive wireless operation, multitasking capability, low cost, and easy installation, e-textiles are drawing attention from both the research community and industry. In addition, more recently, their use is being explored more and more in various interaction scenarios. A common way of using them is to directly touch [13] or manipulate/deform the textile [14]. Mid-air gestures have also been explored in [15]. In terms of interaction tasks, some studies used e-textiles for motion capture [16], on-body actuation [17], human activity recognition [18], and ubiquitous non-driving-related activities in cars [19], etc. It is worth pointing out that some studies [9] also investigated hows e-textiles could be used for text input, which was one of their most common and fundamental functions in various applications.
A critical issue regarding the interaction usage of e-textiles is aging, which affects the reliability and durability of product [10]. This paper explores the functional aging of e-textiles to alleviate the impact on interaction. Although having been noticed in many studies, the evolution of the functionality of e-textiles over their usage time, where worsening is observed in most cases, is not yet well understood and few studies have discussed how to alleviate such impacts, especially on interaction.

2.2. Character Recognition

Text entry for XR is far from perfect, driving a variety of studies to fit various contexts of use [20]. Typing and handwriting are currently the two most common text entry technologies. Some HCI studies [21] have proven that handwriting recognition is generally superior to an on-screen keyboard in some scenarios. As the core of handwriting-based text input, character recognition has been well studied, with various machine learning techniques being adopted in the early stages, such as linear classifier, k-nearest neighbors [22], non-linear classifier, support vector machines [23], neural networks [24], and convolutional neural networks [25]. The rise of deep learning provided new chances and challenges. Convolutional neural network-based methods were proposed [26,27], due to their high performance. Many handwritten text databases were constructed accordingly, such as USPS (U.S. Postal Service) [28], MNIST (Modified National Institute of Standards and Technology) [29], and their extensions (such as EMNIST [30], QMNIST [31]).
We focus on character recognition under a special scenario, with e-textile inputs, which are more sparse, noisy, and complex. Even more unfortunately, the characteristics of input signals change dynamically due to the functional aging of e-textiles, which has not yet been considered in existing works [9,11].

2.3. Unsupervised Domain Adaptation

A commonly encountered problem in deep learning applications is the degradation of performance due to “domain shift” [32]. Unsupervised domain adaptation has thus attracted a lot of attention to bridge the gap between the labeled source domain and the unlabeled target domain. Various methods have been proposed, such as adversarial learning [33], self-training [34], consistency regularization [35], prototypical alignment [36], feature disentanglement [37], etc.
We explore how domain adaptation can be used in a special case, the functional aging of sensors, seeking to exploit the inherent law of such aging for better performance. Different from existing applications, the source domain and target domain are closely related, as the data of both were collected from the same device under different conditions. We firstly showed the existence of a distribution discrepancy between the two domains using a deep kernel-based two-sample test, and then designed a novel unsupervised domain adaptation technique to address the problem.

3. Data Preparation

Although there are some pre-existing datasets for character recognition, as mentioned above, characters drawn with wearable devices have quite different characteristics, usually making models trained with existing datasets perform poorly. Therefore, we constructed a dataset containing 8460 images of handwritten characters with a wearable device prototype that we designed ourselves.

3.1. Data Collecting

We used a commercially available flexible array pressure sensor (model number: FS-ARR-44 × 44, https://cn.film-sensor.com/product/rpps-1600/, accessed on 25 June 2023). This type of sensor is composed of a combination of polyester film, a highly conductive material, and nanoscale piezoresistive material. When pressure is applied to the sensing area, the bottom flexible pressure-sensitive layer and the top flexible pressure-sensitive layer contact with each other and thus electricity is conducted, resulting in a change of the resistance output, which varies with the pressure.
A total of 45 participants were recruited and asked to write 36 characters (26 letters and 10 numbers) with aged sensors which had been extensively used, presenting issues such as decreased accuracy and slow response. Each character was repeated 5 times, resulting in a total of 8100 samples being collected (referred to as sensor source domain data, SSDA). For the purpose of contrast, we also used a new sensor to re-capture a total of 360 samples, including 10 samples per character (referred to as sensor target domain data, STDA). When the participant was drawing, the sensor recorded each frame of pressure as a 40 × 40 matrix of data. A terminal program received these data frames in real-time and identified valid press points. The user’s input session was considered as finished if no valid input was detected within a 1.5 s time interval.

3.2. Data Pre-Processing

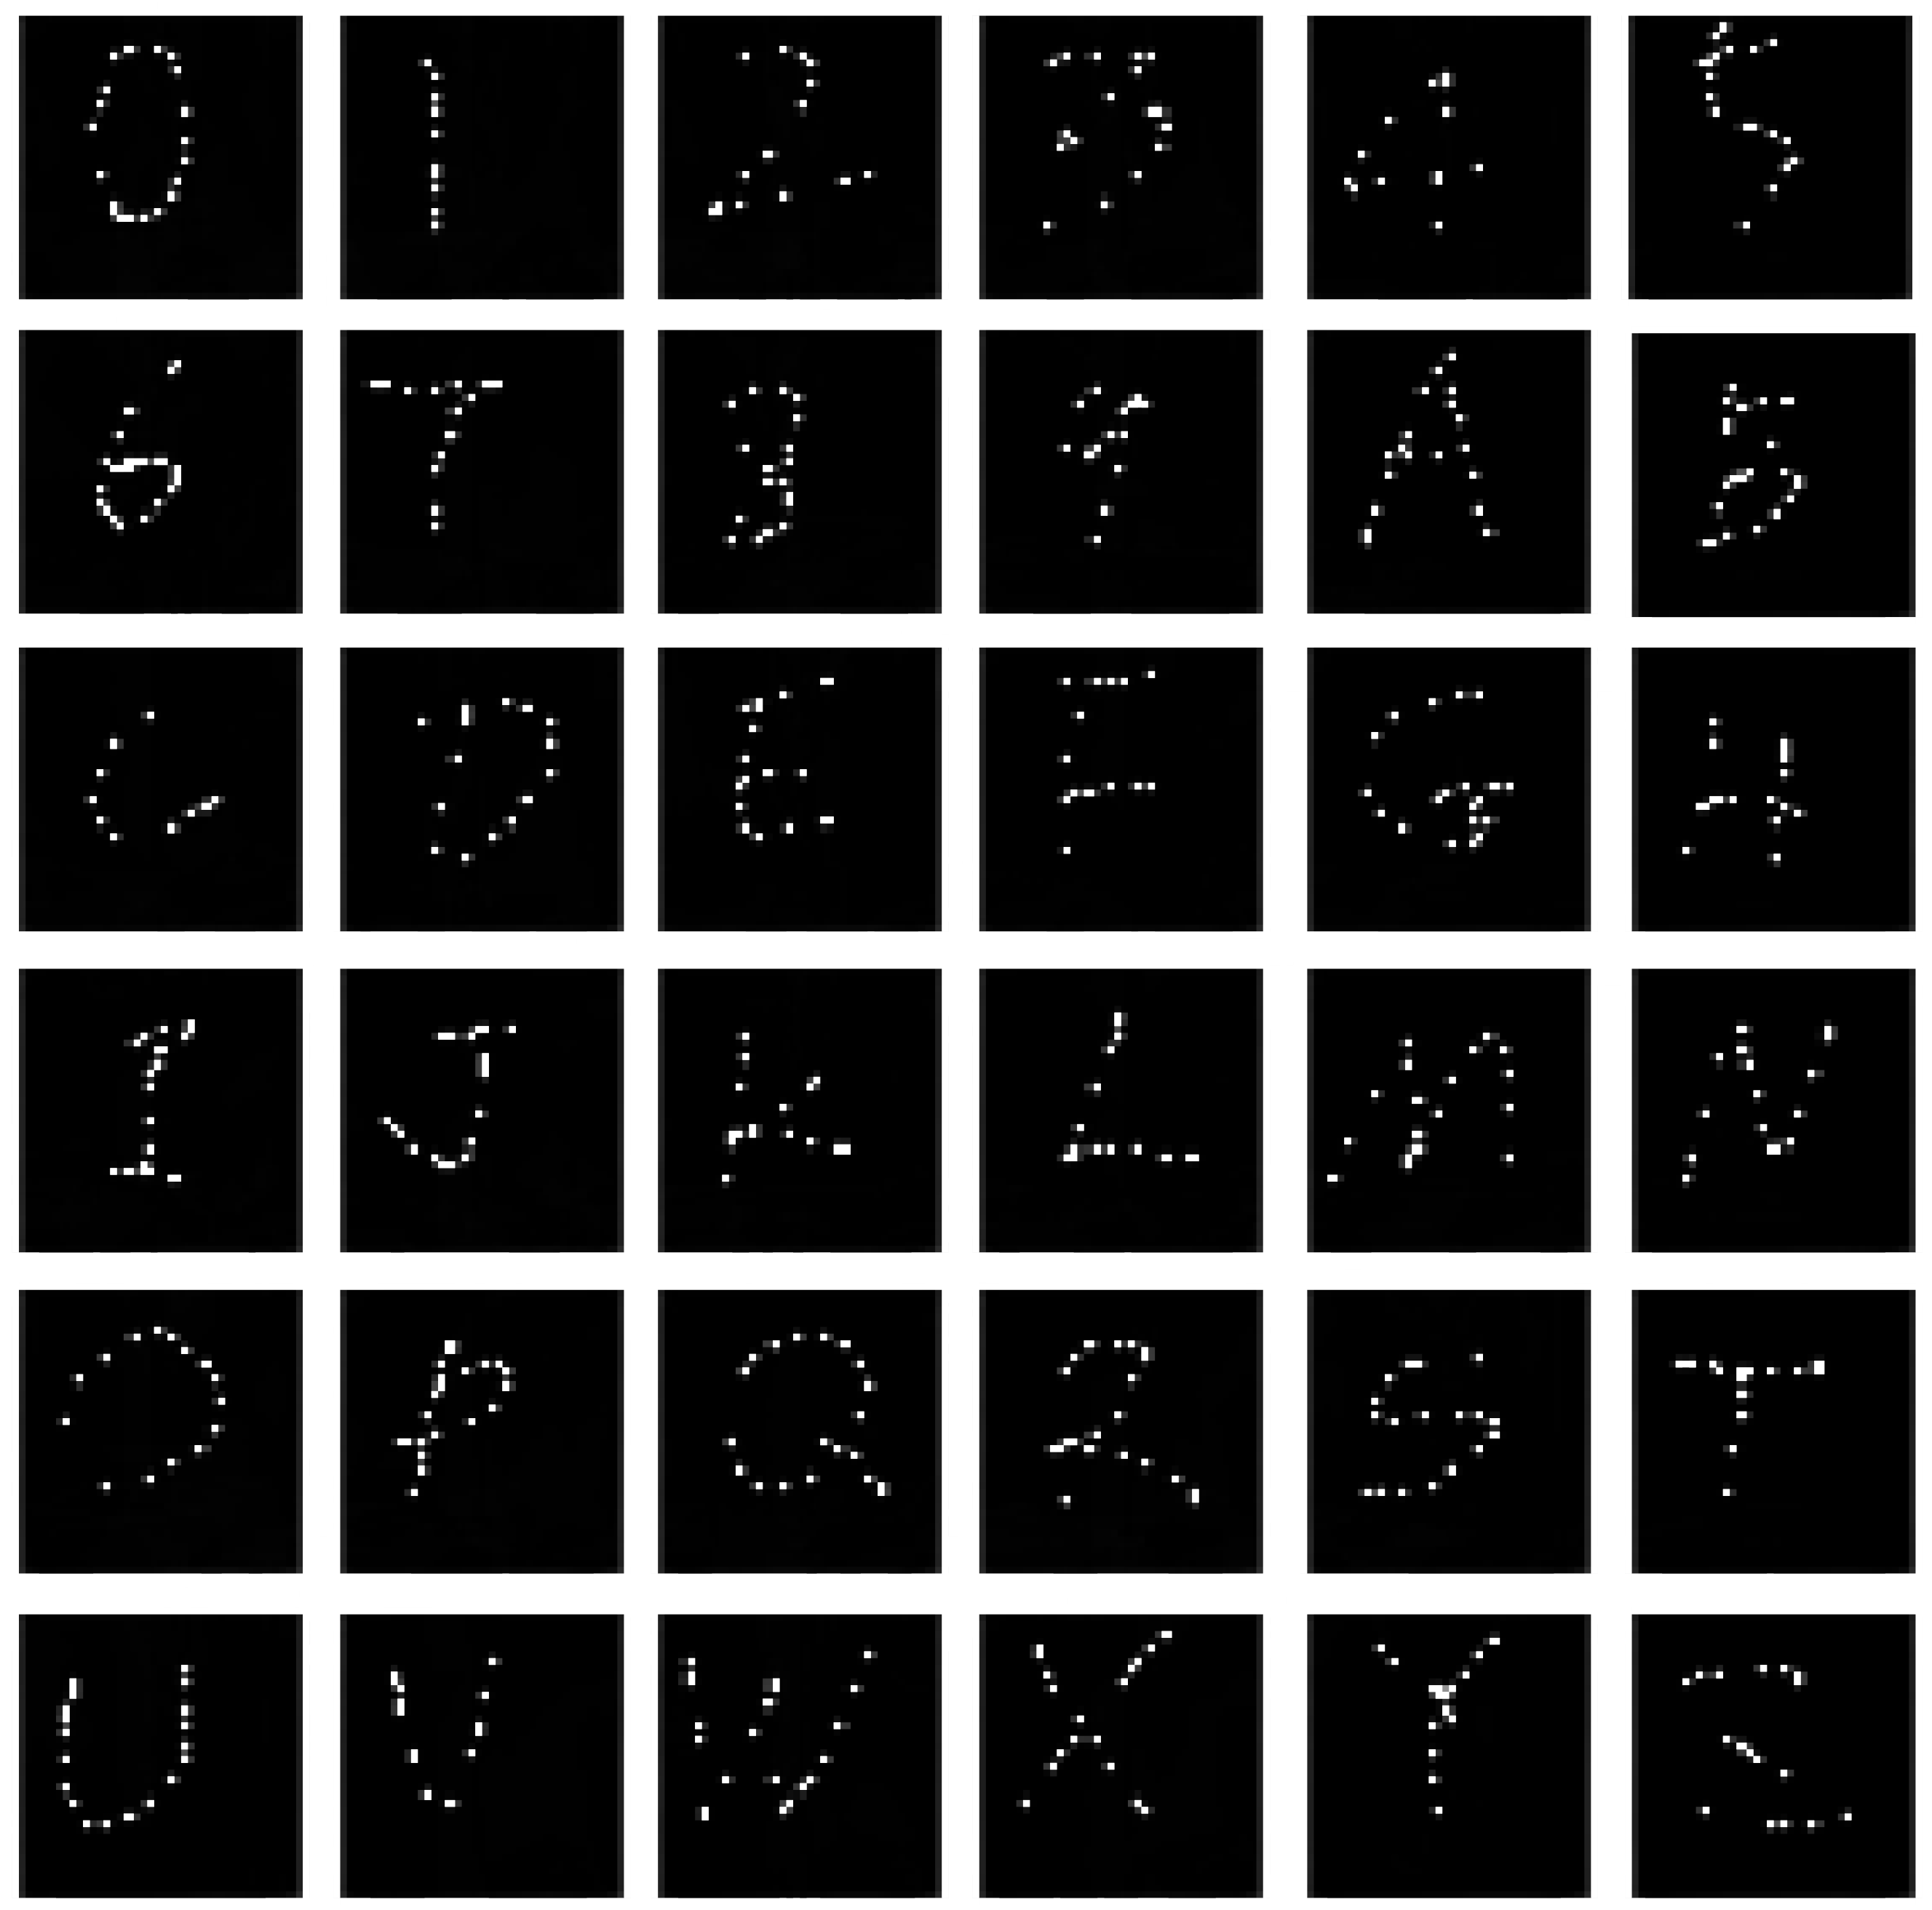
Figure 1 shows the raw sequence frame data for character “0”, which looks chaotic. We performed preliminary numerical filtering to exclude outliers, such as those that have abnormal pressure values at the boundary. At the same time, the maximum pressure value point of each frame was taken as the position of the user’s writing in the current frame. Frames with recorded positions were superimposed to form a matrix of pressure, which was finally binarized, as shown in Figure 2.

3.3. Data Augmentation

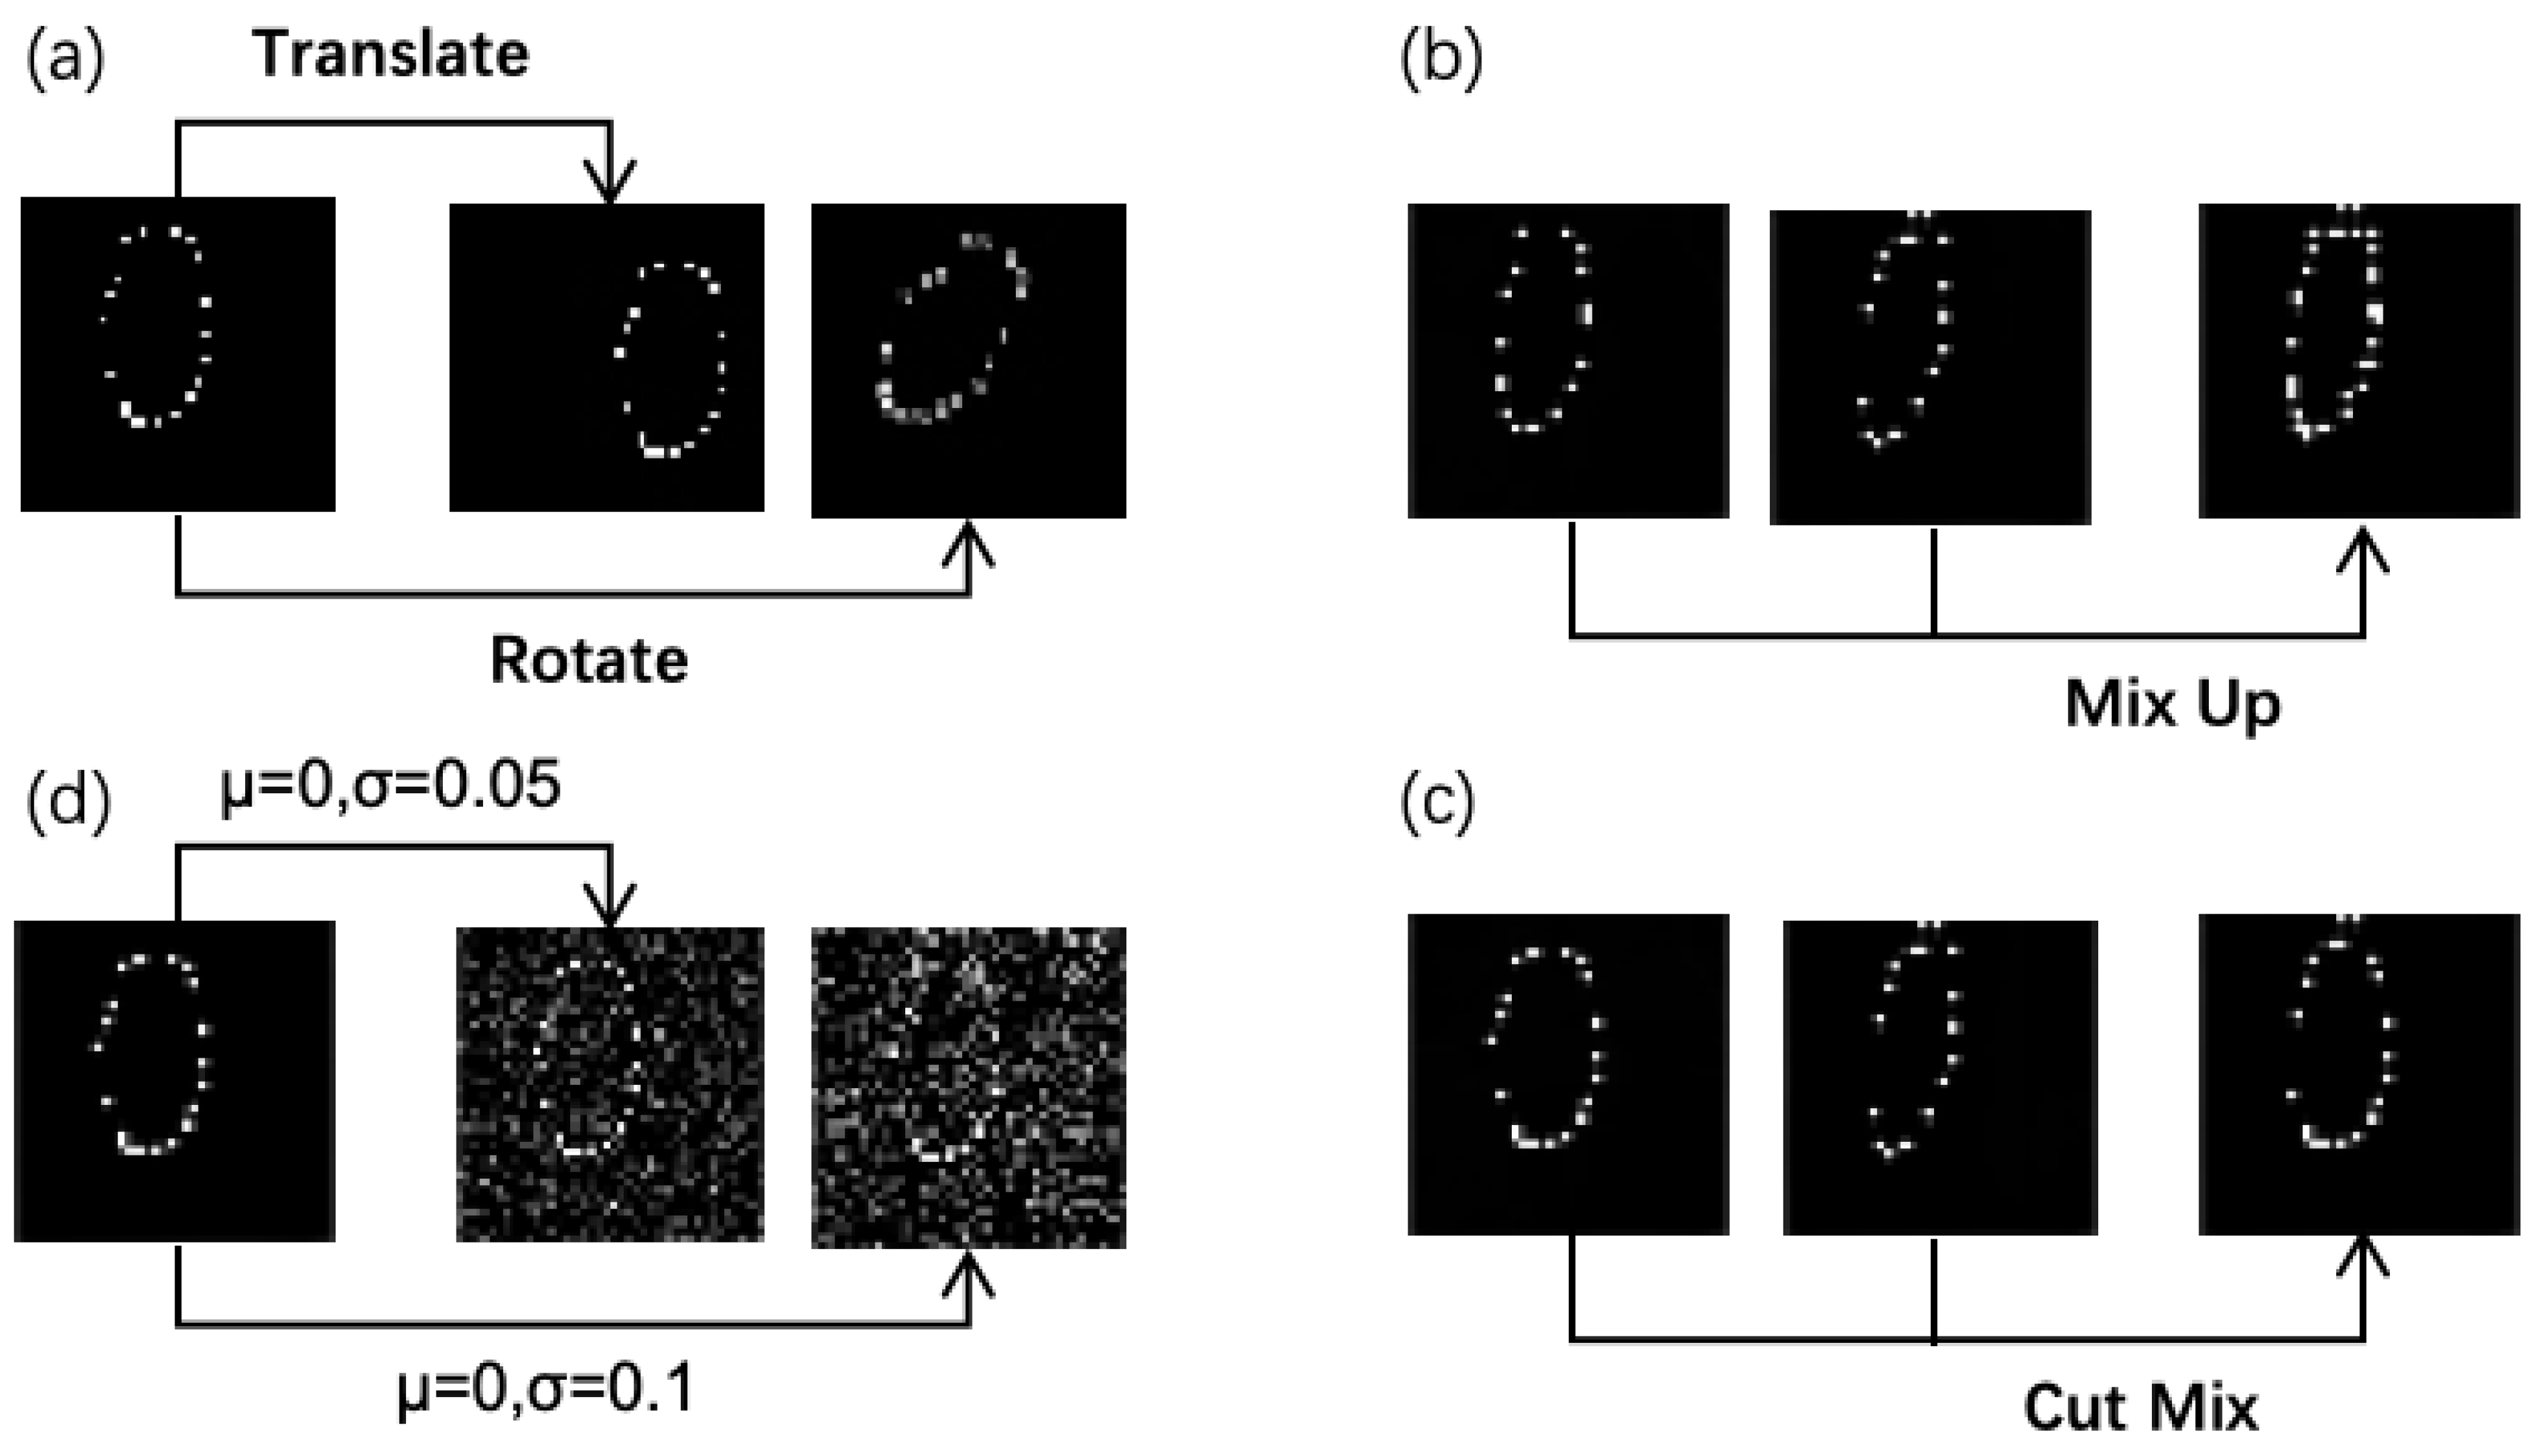
Due to limited time and budget, the scale of the collected raw data is quite small. We therefore augment the dataset in several different ways, including by using a tailored mosaic stitching method and some regular methods such as geometric transformation, mix up, cut mix, and adding noise (see Figure 3).
Mosaic stitching was originally proposed in YOLOv4 [38] as a manner to increase the diversity of images while disguised as an increase of the batch size. It crops four randomly selected images and stitches them together to form a new one. Meanwhile, batch normalization is performed on the four selected images to reduce reliance on the batch size and allow for training on a single GPU. However, the original method may generate strange results, as shown in the first row of Figure 4. We notice that the captured signal of characters from the e-textile are usually quite sparse. Based on this, we designed a filtering strategy to select stitching images accordingly to avoid such strange results. To be specific, we categorize a stitching point into isolate ( i = 2 9 P i = 0 ), end ( i = 2 9 P i = 1 ) or connection ( i = 2 9 P i = 2 ), according to the configuration of its neighborhood, as shown in the second row of Figure 4, where P i = 1 indicates the point is a character point while P i = 0 refers to a background one. Both isolate and end points are treated as “break point”. An image is considered as more coherent if it contains more connection points. For all images of the same character, we selected those with higher coherence for stitching. The bottom row of Figure 4 shows a result generated with the new strategy for comparison.

4. Data Distribution Analysis

The functional aging of the e-textile will affect the characteristics of collected handwritten data, leading to different data distributions. To validate this, we performed a two-sample test on datasets collected before and after sensor aging. While traditional methods such as the t-test and Kolmogornov–Smirnov test are commonly used, strong parametric assumptions about the distributions being studied are required. Moreover, they perform poorly on high-dimensional data. Non-parametric methods have also been explored, based on kernels [39]. These methods constructed a kernel mean embedding for each distribution and measured the difference between two embeddings, which was usually defined as the maximum mean discrepancy (MMD) [40]. Despite working well for simple distributions with appropriate kernels, many problems in reality usually involve distributions with complex structures, which is difficult address with simple kernels. We follow the recent trend [41,42] of building a test with a deep neural network-parameterized kernel.

4.1. Problem Formulation

Let S B = { b i } i = 1 m and S A = { a j } j = 1 n be samples of hand-drawn images collected from an e-textile device before and after aging, with the corresponding distributions being B and A. We wish to know whether B = A , meaning S B and S A come from the same distribution. The problem could be formulated as a hypothesis test with a null hypothesis H 0 : B = A and alternative H 1 : B A [40]. The hypotheses make a statement about a population parameter, and the test statistic t ( S B , S A ) is the corresponding estimate from the samples. H 0 is rejected for some rejection region of t. The significance level α (or Type I error) denotes the probability that H 0 is rejected even if it is true. The test power denotes the probability that H 0 is correctly rejected if H 1 is true. For a kernel-based two-sample test, a distance metric (MMD on a Reproducing Kernel Hilbert Space (RKHS)) between probability distribution is used with the definition given below [40]:
M M D ( B , A ; k ) = sup f H k , f H k 1 | E b B [ f ( b ) ] E a A [ f ( a ) ] | ,
for an RKHS k with kernel k : X × X . Its unbiased estimator is
M M D ^ ( S B , S A ; k ) : = 1 n ( n 1 ) i j ( k ( b i , b j ) + k ( a i , a j ) k ( b i , a j ) k ( a i , b j ) ) .

4.2. Deep Kernel Test

The choice of the kernel k, mentioned above, affects the test power in finite sample sizes. We follow [41] to parameterize the kernel k with a deep neural network, which is used to extract a separable feature representation of the high-dimensional
k ( b , a ) = [ ( 1 ϵ ) g 0 ( ψ ω ( b ) , ψ ω ( a ) ) + ϵ ] g 1 ( b , a ) .
Here, ψ ω is a deep neural network for feature extraction with parameter ω and g 0 and g 1 are Gaussians with length scales σ 0 and σ 1 . Both kernel parameters and neural network parameters can be determined by training ψ ω to maximize the maximum mean discrepancy:
M M D = M M D ^ ( S B t r , S A t r ; k ) .
Here, the sample data S B and S A are divided into training fold ( S B t r and S A t r ) and test fold ( S B t e and S A t e ). The test statistic t ( S B , S A ) = M M D ^ ( S B , S A ) for a trained kernel can then be calculated from the test fold of the source and target data S B t e , S A t e . Then, a permutation test can be used to determine whether H 0 : B = A can be rejected.

5. Aging-Aware Character Recognition with Gabor Domain Adaptation

The success of many machine learning algorithms is built on the assumption that the training and test data are in the same feature space and have the same distribution. However, the response rate and sensitivity of sensors may decrease due to aging, which was validated in distribution analysis (see the experimental results in Section 6.1). The discrepancy between distributions of training and test data will inevitably have a negative effect on the following recognition step. We thus propose a domain-adaptive recognition model to address the issue.
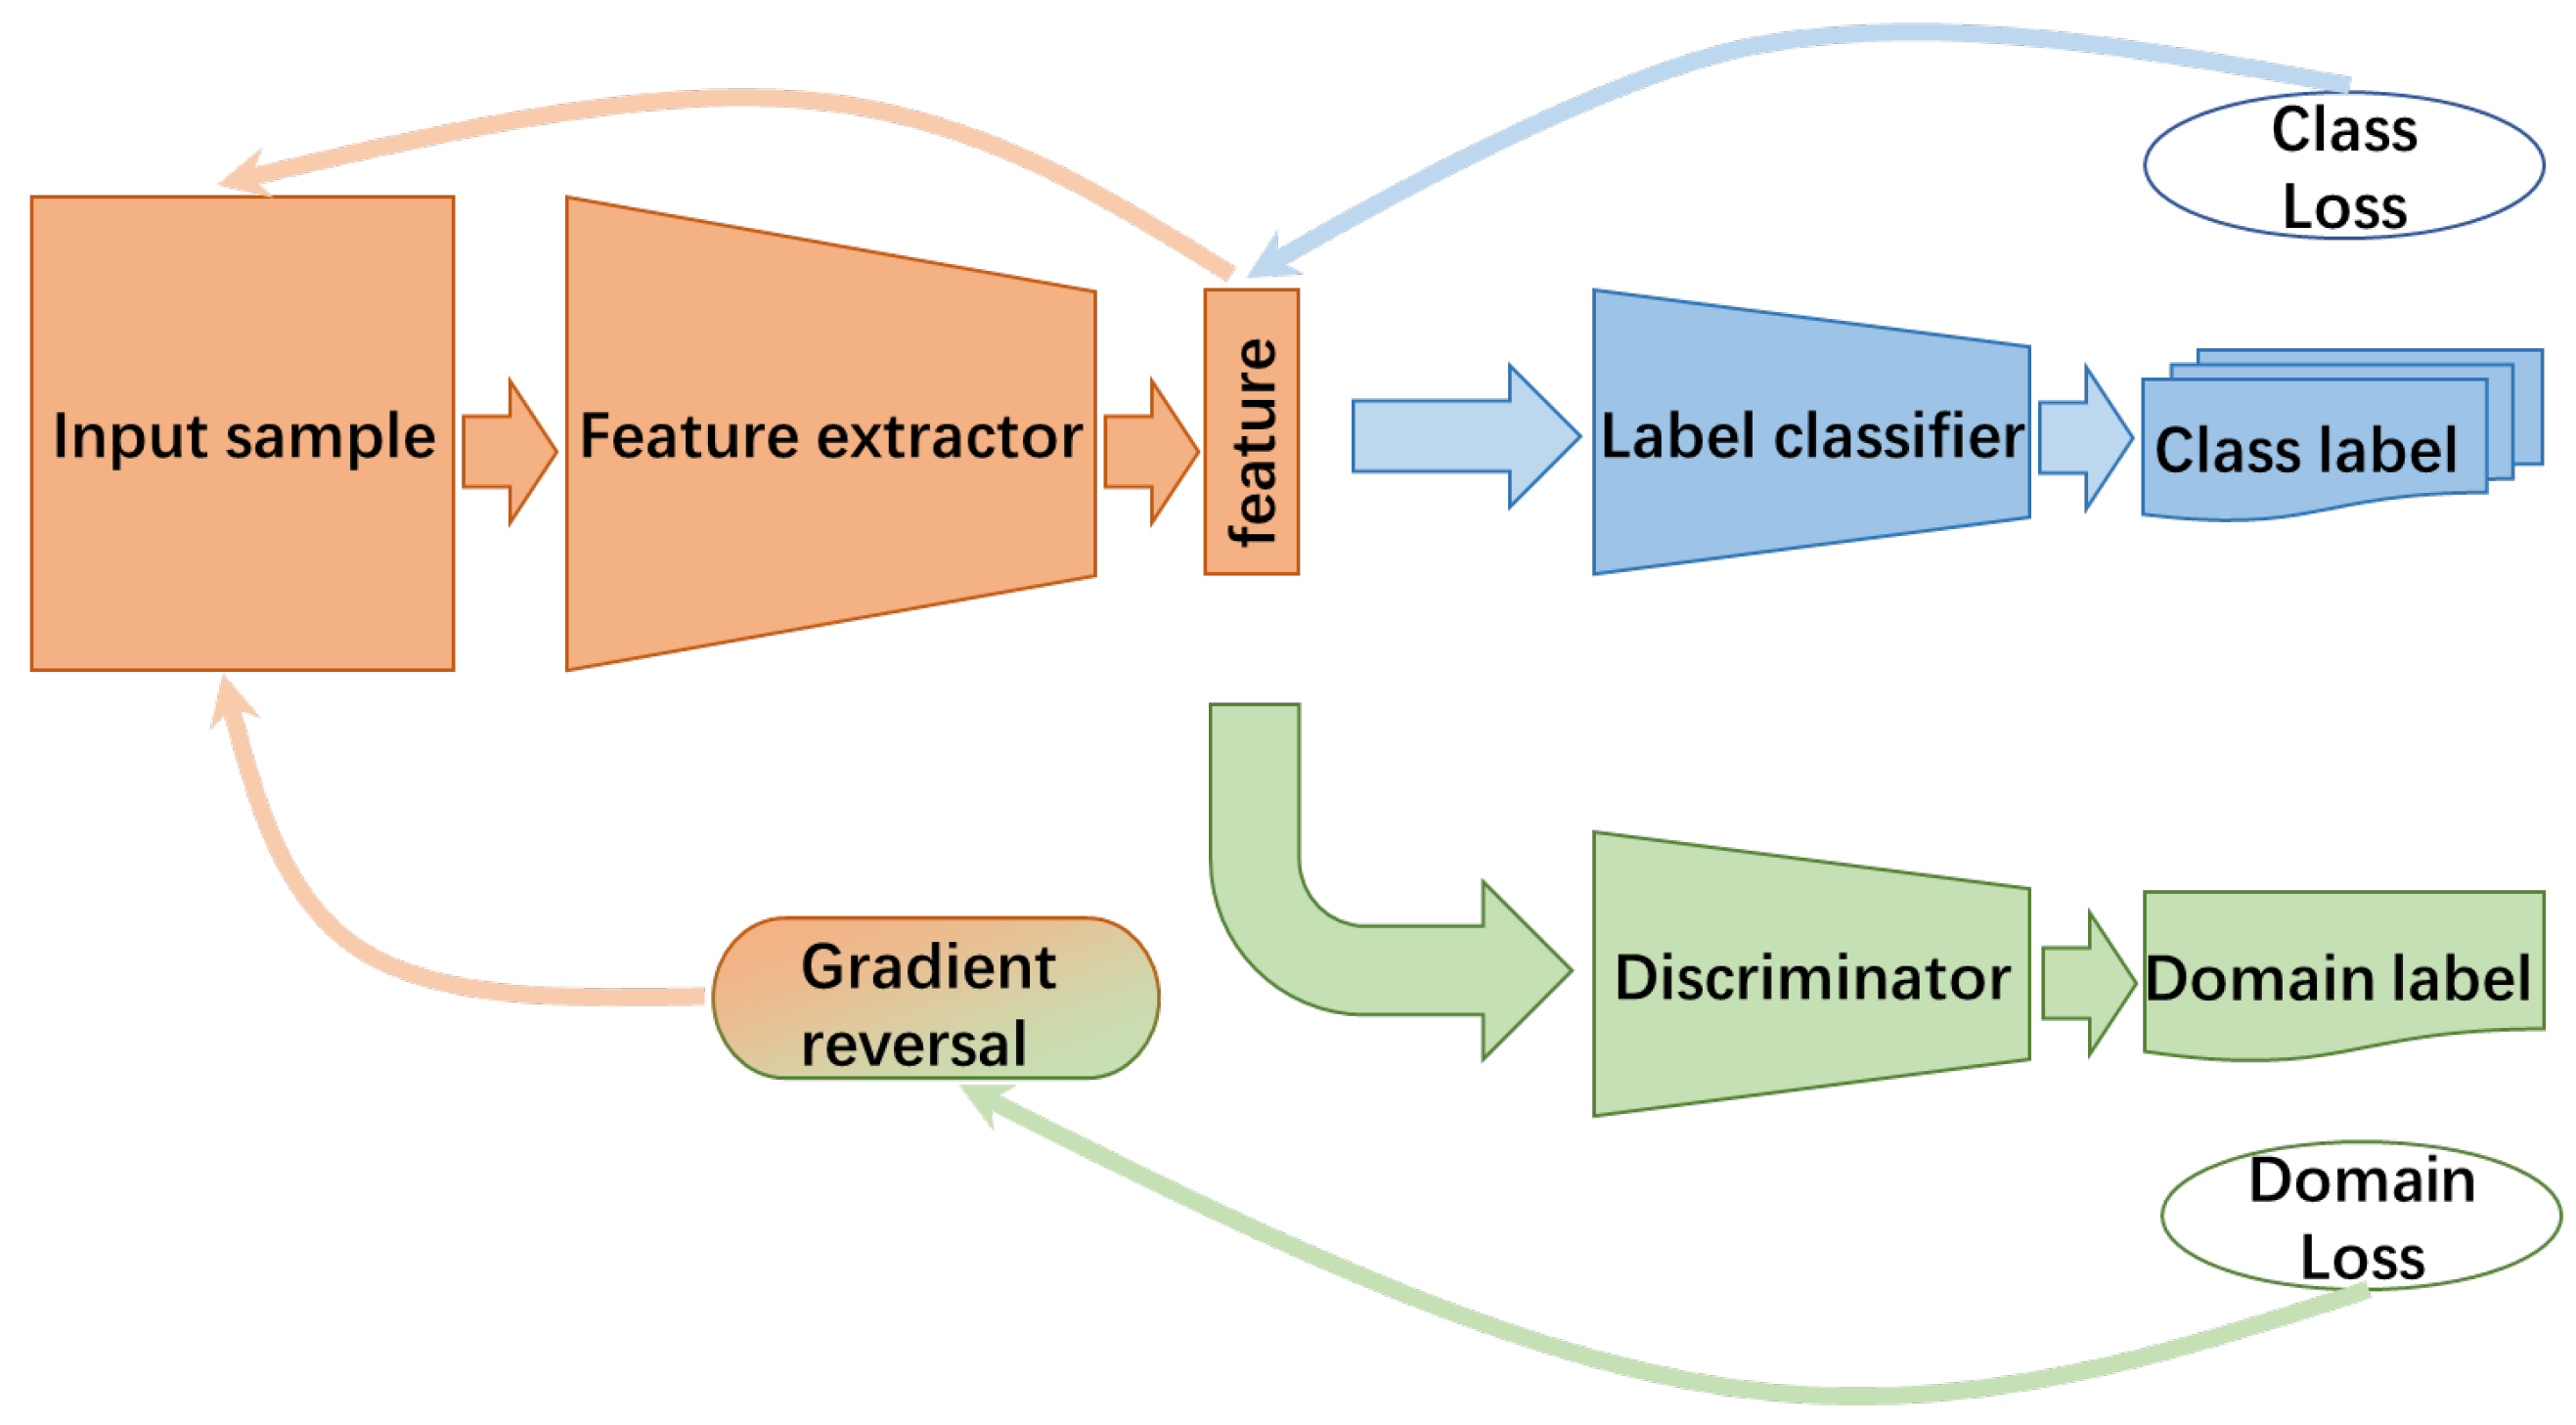
Our aging-aware character recognition model shares a similar framework with a routine adversarial-based domain adaptation framework [43]. As shown in Figure 5, the whole process consists of three parts. (1) The first is a feature extractor f e to generate a D dimensional feature vector e R D by mapping the input data into feature space. Let θ e be the parameters of all the layers in feature mapping, then e = f e ( x ; θ e ) . (2) The second is a label classifier f c to map e to label L e , with the parameters being θ c . (3) The third part is a discriminator f d , with parameters θ d , to map the feature vector e to label d.
The major difference is that the basic convolution operator in the feature extractor is replaced with a novel Gabor orientation convolution (GOConv) to more effectively learn a feature representation (see the left bottom part of Figure 5, which can capture the transformations in the input sample.
Transformation invariance is an important factor for handwritten character recognition. For deep learning, some attempts have been made to enhance model capacity towards transformation, such as the inclusion of a deformable filter [44] and rotating filter [45], as well as a Gabor filter [46,47,48]. We investigated how a Gabor filter could be incorporated in a adversarial-based domain adaptation framework, other than for use in offline pre-processing, as in previous studies. The Gabor filter was first introduced by Gabor [49] as the basis for Fourier transform in an information theory application, with the definition given below:
G ( u , v ) = k u , v 2 σ 2 e ( k u , v 2 z 2 / 2 σ 2 ) [ e i k u , v z e σ 2 / 2 ] ,
where z = ( x , y ) , k u , v = k v e i k u , k v = ( π / 2 ) / 2 v 1 , k u = u π U , with v = 0 , , V , v being the frequency, u being the orientation, and σ = 2 π . For a convolution filter C i , o , we can manipulate it with Gabor filter banks to enhance the feature maps:
C i , u v = C i , 0 G ( u , v ) ,
where ∘ is an element-by-element product operation and G ( u , v ) is a group of Gabor filters with different orientations and scales. Furthermore, we have the Gabor orientation filter (GoF), defined as:
C i v = ( C i , 1 v , , C i , U v ) ,
which will then be used to replace the original convolution filter in the feature extractor:
F o = G O C o n v ( F i , C i ) ,
where C i is the ith GoF and F o and F i are output and input feature maps, respectively. The channels of F o are obtained by the following convolution:
F i , k o = n = 1 N F i ( n ) C i , u = k ( n ) ,
where n refers to the nth channel of F i and C i , u , F i , k o is the kth orientation response of F i o . Weights of GoF are updated in the back-propagation process, with the gradient of the sub-filters in GoFs summed-up as shown:
δ = L C i , o = u = 1 U L C i , u G ( u , v ) , C i , o ( 2 ) = C i , o ( 1 ) η δ .
The aim of the recognition model is to learn a mapping f : S L to classify characters either in the source or target domain. We want to make the features e domain-invariant, which is equivalent to making the distributions of the source and target (B and A, respectively) similar. However, measuring the dissimilarity of B and A is non-trivial, given that they are constantly changing in the learning process and that e is a high-dimensional vector. An indirect way is to look at the loss of the discriminator f d , provided that its parameters θ d have been trained to discriminate between the two feature distributions in an optimal way. Finally, we have the following objective function for θ e , θ c , and θ d :
E ( θ e , θ c , θ d ) = i = 1 , 2 , , N S d i = 0 c ( f c ( f e ( b i ; θ e ) ; θ c ) , a i ) λ i = 1 , 2 , , N d ( f d ( f e ( b i ; θ e ) ; θ d ) , a i ) = i = 1 , 2 , , N S d i = 0 c i ( θ e , θ c ) λ i = 1 , 2 , , N d i ( θ e , θ c ) ,
which is then solved with a standard stochastic gradient solver.

6. Experimental Results

6.1. Data Distribution

We ran experiments on three different datasets (USPS, MNIST, and our SSDA + STDA) to compare the deep kernel-based method with two regular methods (MMD with a simple Gaussian kernel and Gaussian kernel mean embedding). Table 1 shows the paired t-test results with α = 0.05 . The notation √ means that the deep kernel-based method gained an advantage against the other two, while × means it did not. Our deep kernel method showed the best averaged test ability on two real datasets (SA and MNIST). When applied to the USPS dataset, the deep kernel method was still better than the simple Gaussian kernel method, but worse than mean embedding. The reason was that mean embedding could directly capture the difference between two samples without repeatedly learning the kernel when there was less information about a single sample.
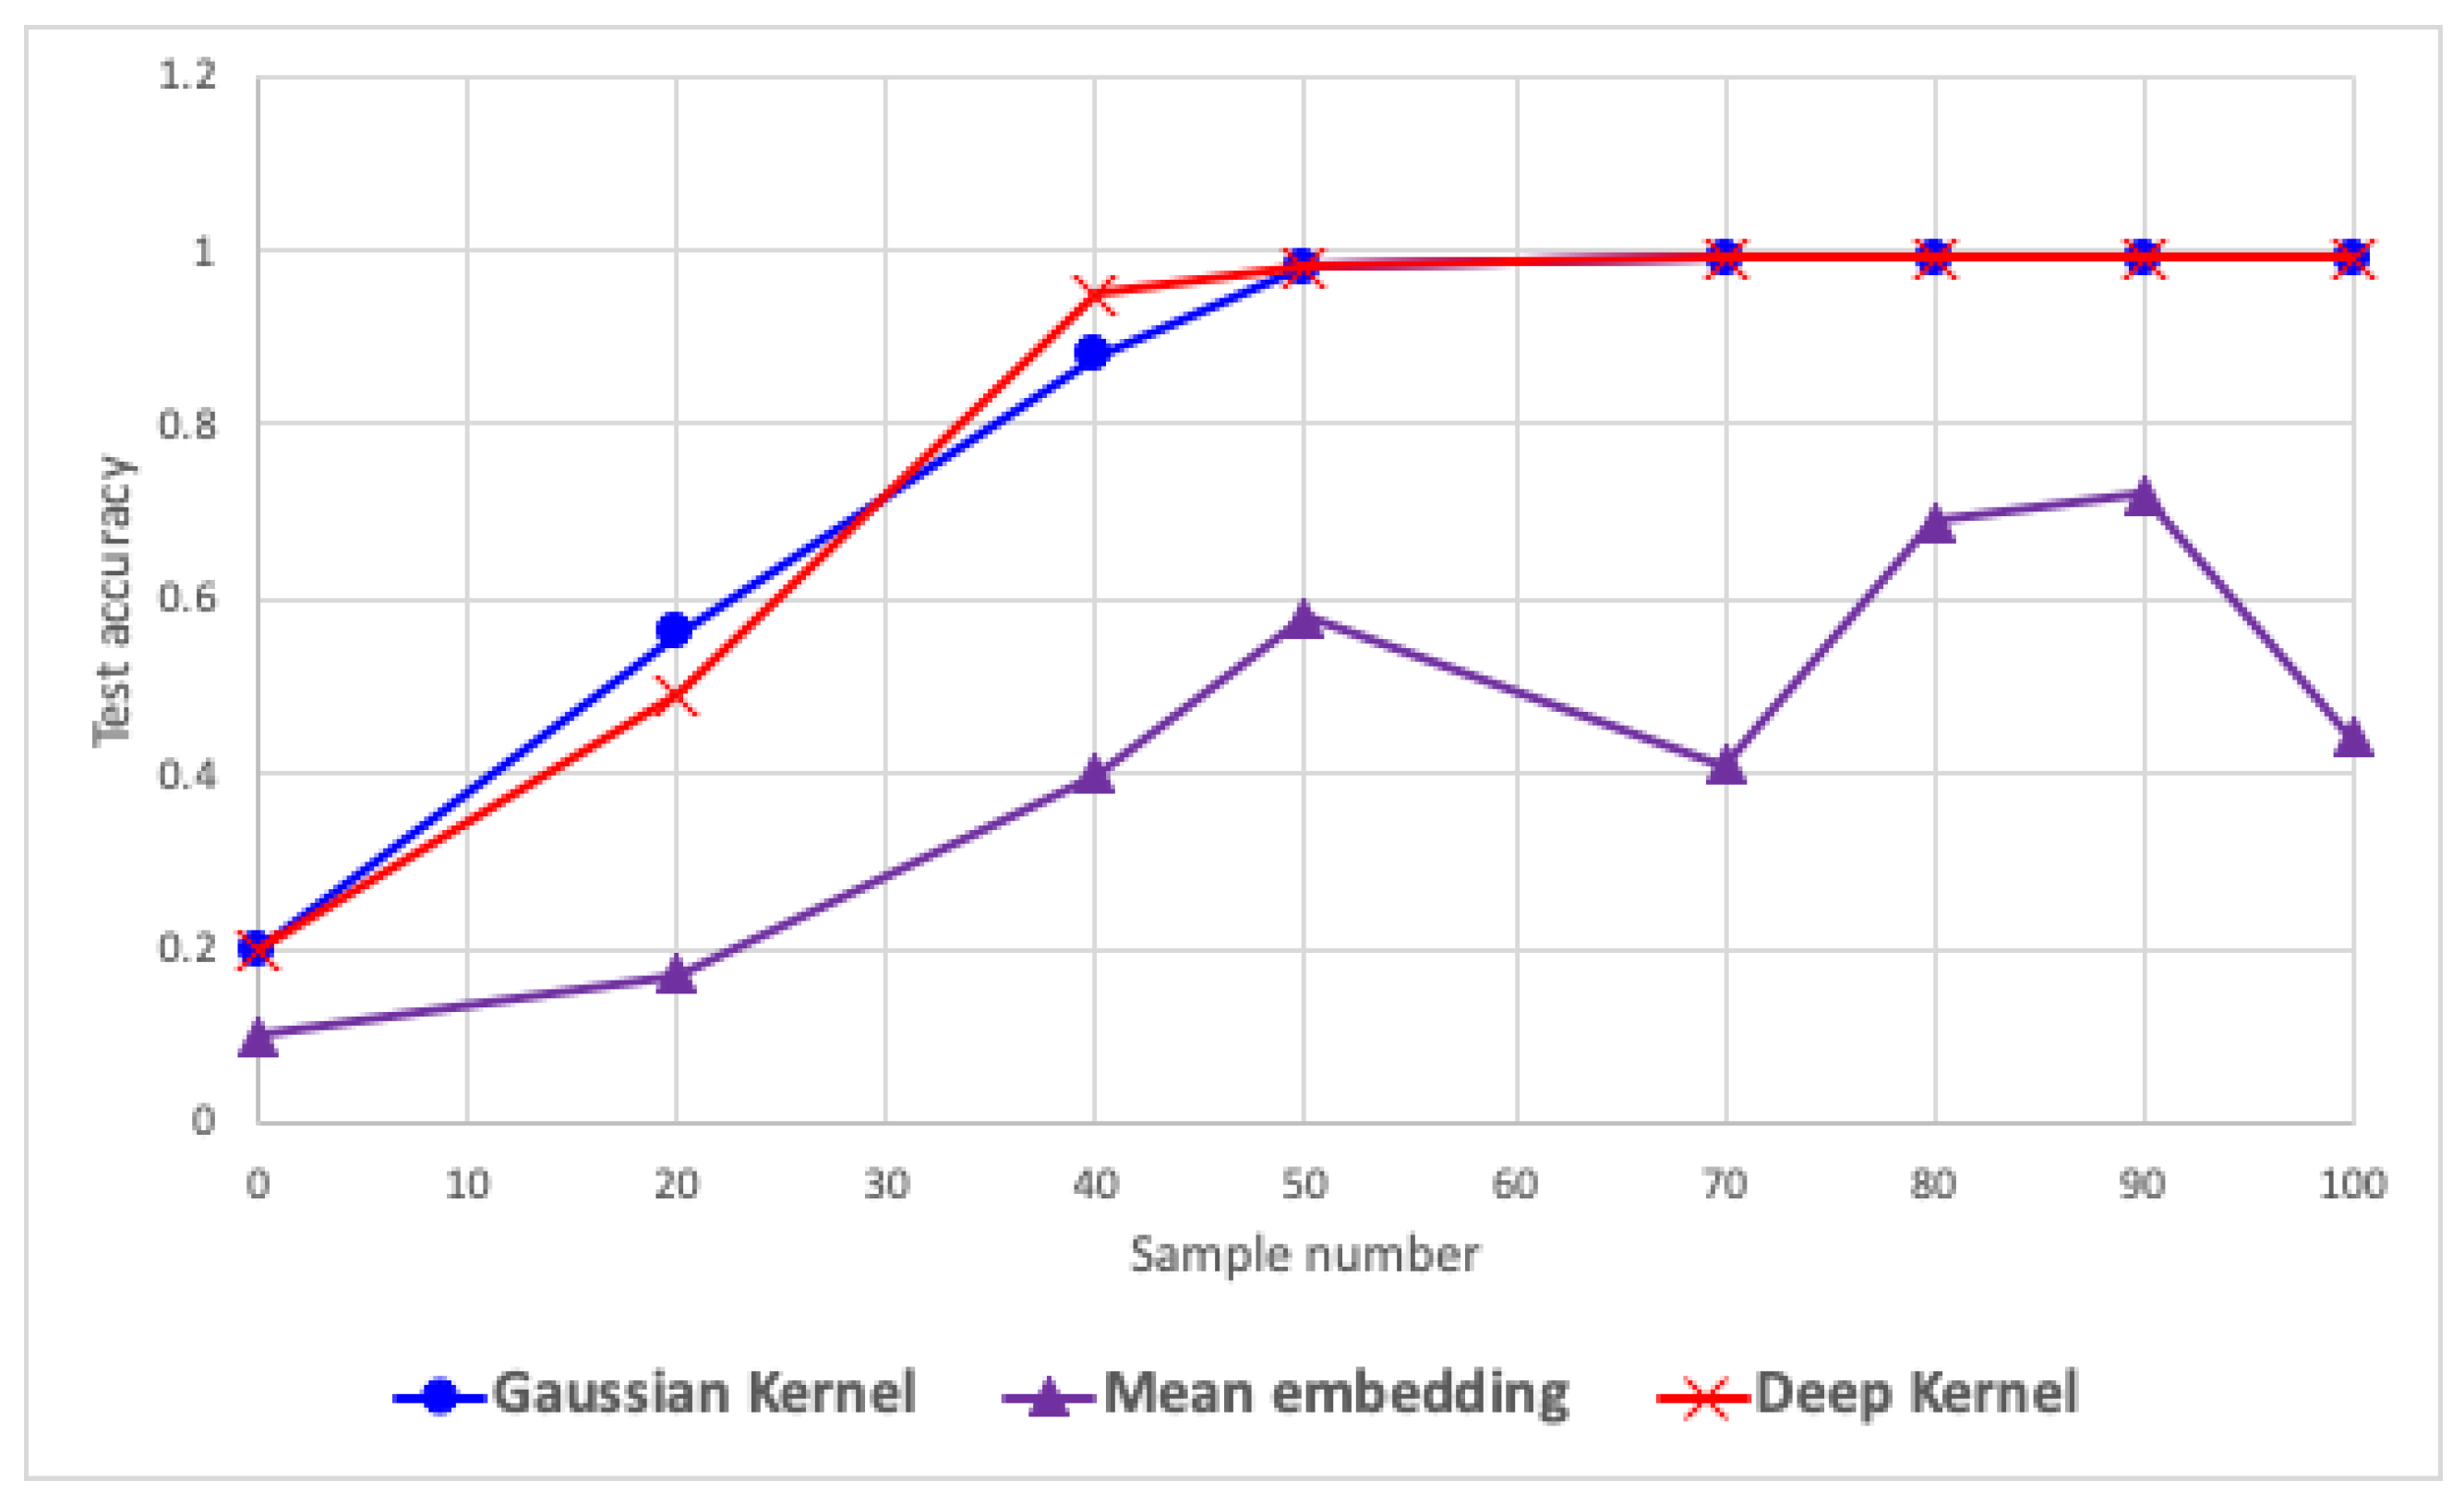
Figure 6 further demonstrates the test results (including accuracy and standard deviation) for the three methods on the real dataset SA with α = 0.05 . We investigated the differences between SSDA and STDA when n b , the number of samples for test, was set to be 0, 20, 40, 50, 70, 80, 90, and 100. We could see that kernel-based methods (either simple kernel or deep kernel) were far better than the traditional mean embedding method when n b 50 , with the accuracy approximating 1. The reason for this was that the kernel-based methods considered arbitrary orders of data by using MMD to measure the distribution difference between two groups of data, while the mean embedding method could only exploit the low-order information of the data.
Finally, the averaged test accuracy and standard deviation for the real captured dataset SA under significance level α = 0.05 is given in Table 2. Our method was apparently better than the simple Gaussian kernel method or Gaussian mean embedding method. The average probability to correctly reject the hypothesis was 0.91. We could also see the test accuracies of the three methods all increased as the number of samples grew. Moreover, both the deep kernel- and simple kernel-based methods could achieve 1 for the probability of correctly rejecting the hypothesis. Compared with mean embedding, which only extracted the low-order information of the data, the deep kernel- and simple kernel-based methods could exploit the higher-order information of the data by using MMD to measure the discrepancy of distribution, and thus achieved a higher probability of correctly rejecting the hypothesis.

6.2. Character Recognition

We performed a series of experiments to validate the effectiveness of our model and its improvement against traditional methods:
  • Different datasets: We investigated the transfer of knowledge learned from the SSDA dataset to the STDA dataset, denoted as SSDA → STDA, and other combinations including USPS → QMNIST, MNIST → QMNIST, and MNIST + EMNIST → SSDA + STDA.
  • Different data augmentation: We augmented real samples from the source domain in various ways, as mentioned in Section 3.3, for the task SSDA → STDA, to determine the optimal augmentation strategy for our model.
  • Different distribution measures: We investigated the optimal distribution measurement for our model in the SSDA → STDA task by adjusting the loss according to different distribution metrics.
Table 3 shows the experimental results of different methods (both the baseline method and ours) in different tasks. For the distribution metrics of the model, we set L c and L c to be logistic regression loss and L d to be binomial cross-entropy loss. The proposed model achieved the optimal recognition rate (character level: the proportion of characters that were correctly recognized out of all the characters [50]) under all four types of migration tasks when compared with DAN [51], SAN [52], and UDA [53]. When migrating knowledge from SSDA as the source domain to STDA on real sensor data without data enhancement, the recognition accuracy of the model was around 75.6 % , improving by around 2–13% compared to the traditional models. Meanwhile, the recognition rate was maintained in the range of 75–83% for different migration tasks, and higher accuracy could be achieved for tasks with fewer categories (e.g., USPS → QMNIST and MNIST → QMNIST). The recognition rates of each algorithm under USPS → QMNIST and MNIST → QMNIST tasks were generally better than those under SSDA → STDA and MNIST + EMNIST → SSDA + STDA tasks due to the difference in the difficulty of the migration recognition task, as the source and target domain data of the former contains only numeric characters, while the latter also contains alphabetic characters. In addition to this, the recognition rate of each model was lower under the sensor data migration task (SSDA → STDA) and better than the results for all other dataset migration tasks. This was probably due to the fact that the raw sensor data (without augmentation) had various defects such as inconsistency, monotonous style, and missing strokes. Compared with those traditional datasets, the real captured e-textile data needed more data enhancement operations to improve the quality.
Table 4 shows the effect of different data augmentation methods on our recognition model when performing SSDA → STDA. The source domain data were expanded using different data enhancement strategies, with a fixed batch size of 128. Half of the dataset consisted of real samples from the source domain and the other half consisted of data-enhanced synthetic samples. “Mosaic” refers to the improved mosaic stitching method proposed in Section 3.3. Clearly, compared to the result of 75.6% in Table 3 (without data enhancement), all the data enhancement strategies had positive effects on the results and were able to largely improve the recognition rate of the model. Simple basic geometric transformations led to the least improvement as they only expanded the dataset but did not enrich the diversity of the data images; mix up (mixing two samples proportionally) and cut mix (filling the rest of the data proportionally) improved the linear understanding of the samples compared to adding Gaussian noise. The mosaic stitching with a targeted filtering strategy proposed in this paper achieves the best classification results. Compared with mix up and cut mix, which only mix two samples, mosaic stitching fuses four images at one time, which greatly enriches the diversity of data samples and reduces the number of operations per batch, and the recognition rate of the model reaches 96.9%.
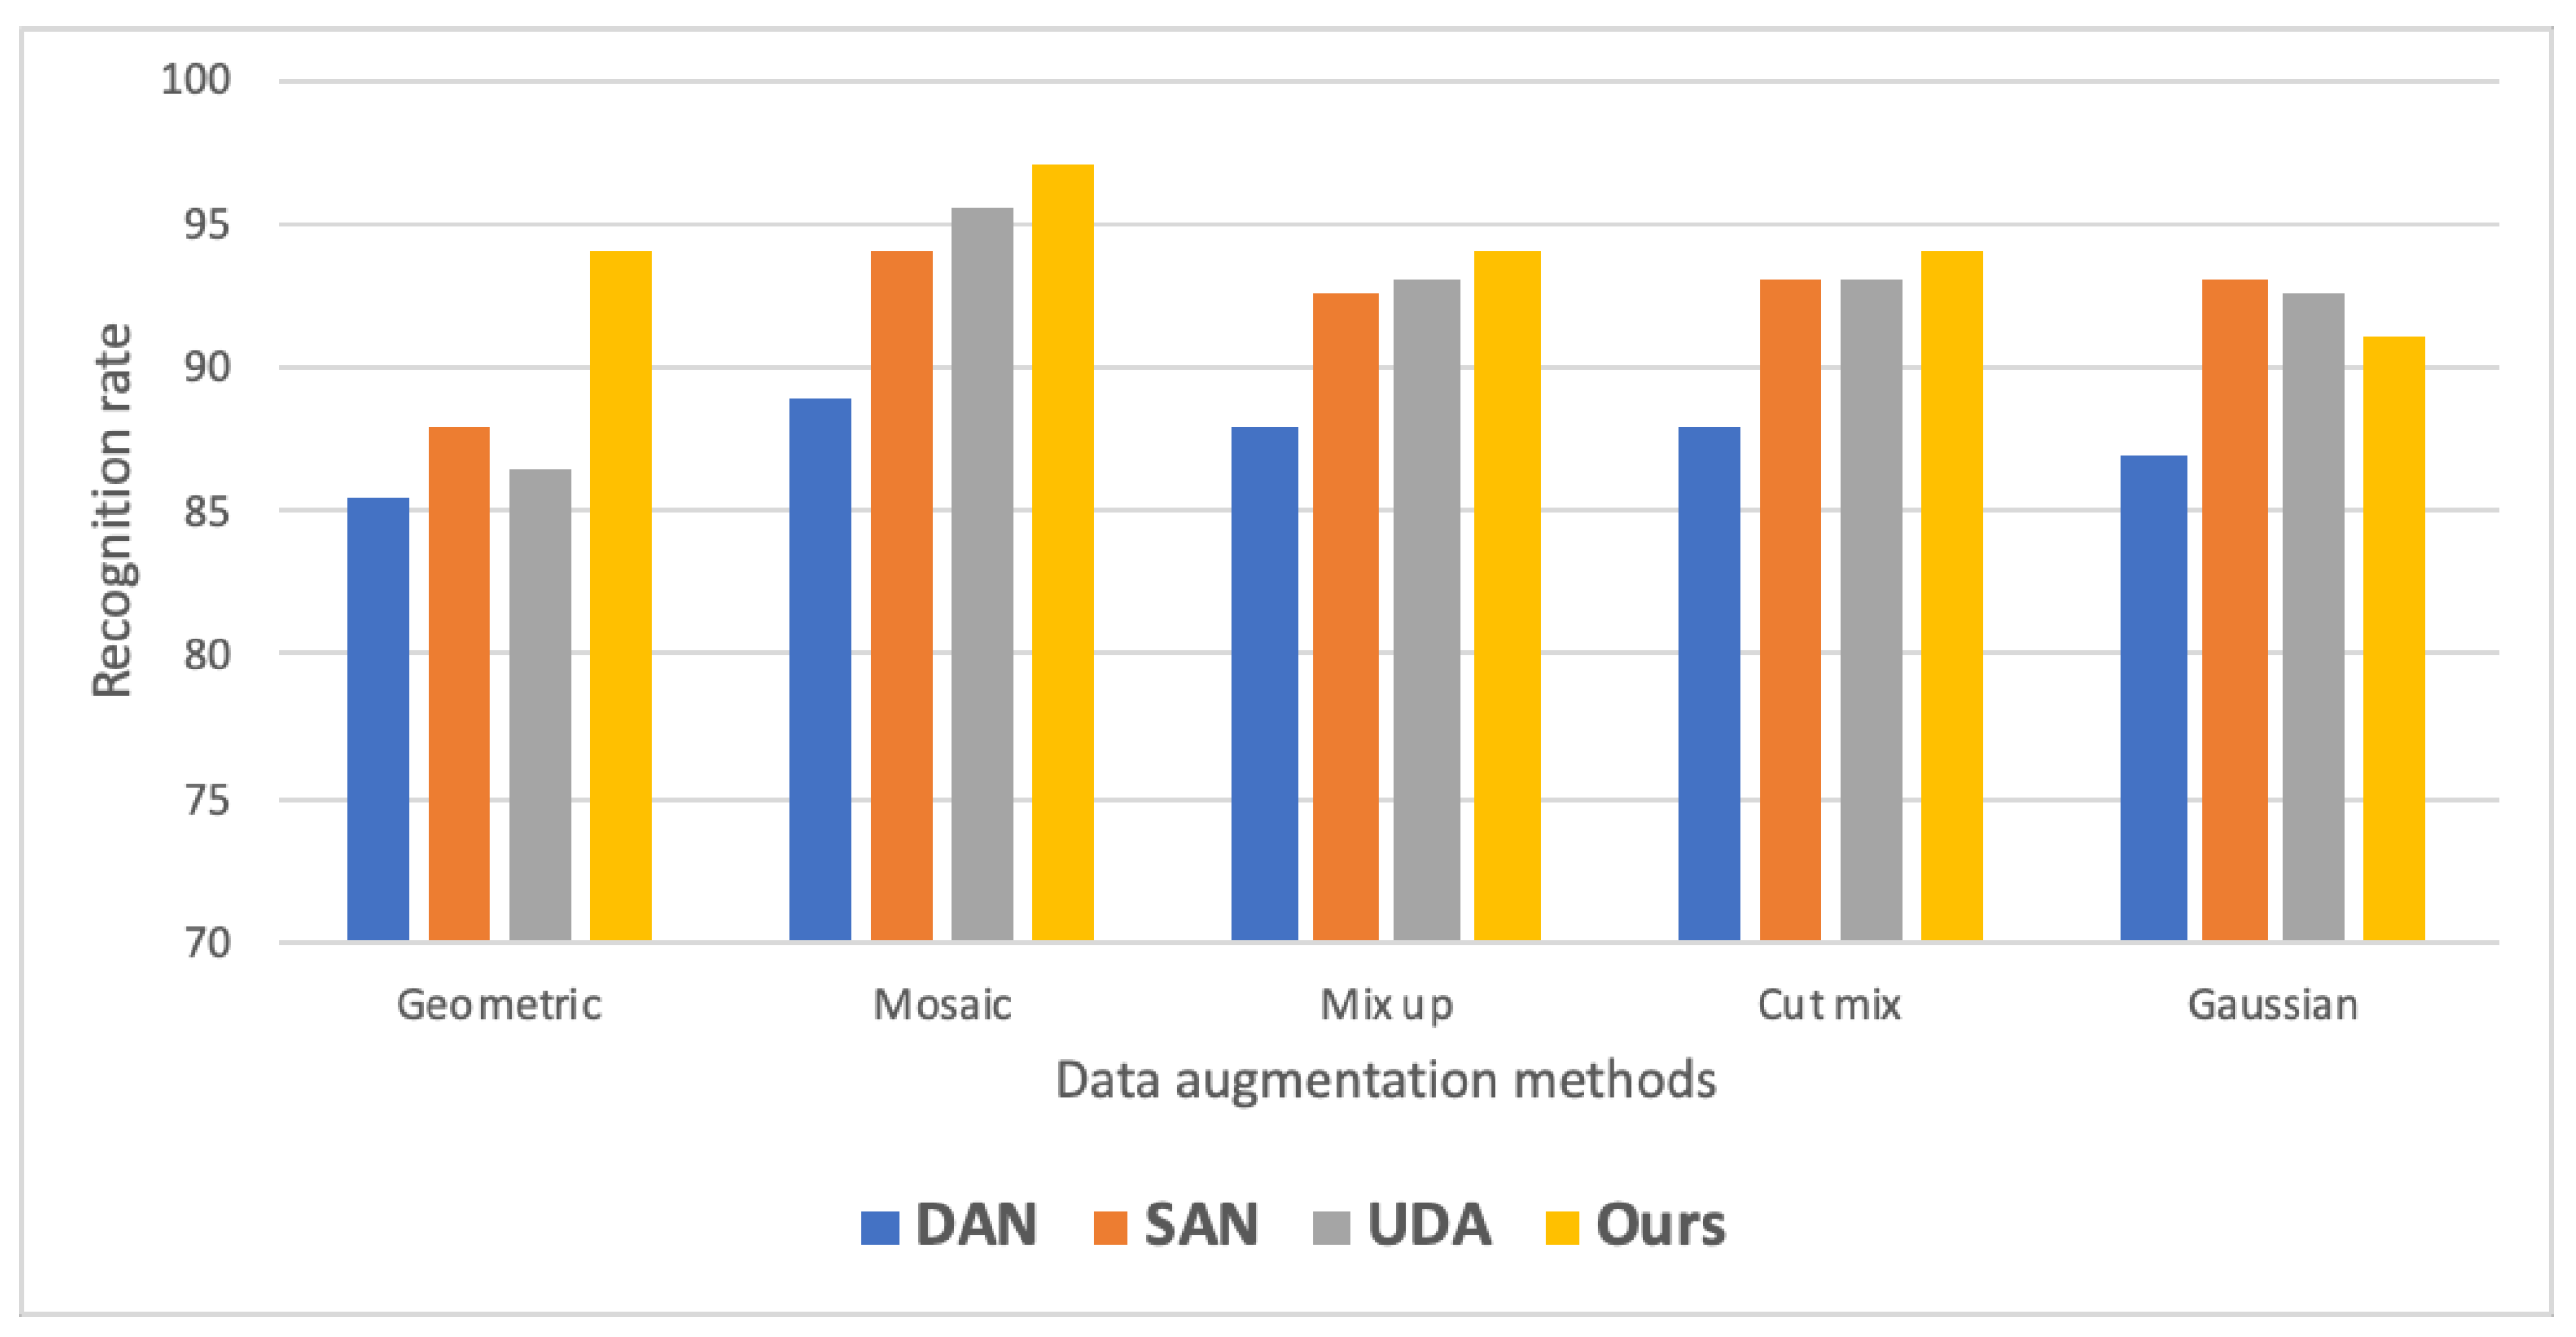
Alongside this, we further investigated the impact of data augmentation methods on different recognition models with the SSDA → STDA task. As shown in Figure 7, all the data enhancement strategies had positive effects on the recognition rate of each model. The improvements of mix up and cut mix were not as good as that of mosaic, which was consistent with the fact that mosaic could synthesize images with more variations. Compared with DAN, SAN, and UDA, the proposed model had more obvious advantages in reducing the data distribution in the source and target domains, and the recognition rate was improved by 2–8% compared with DAN.
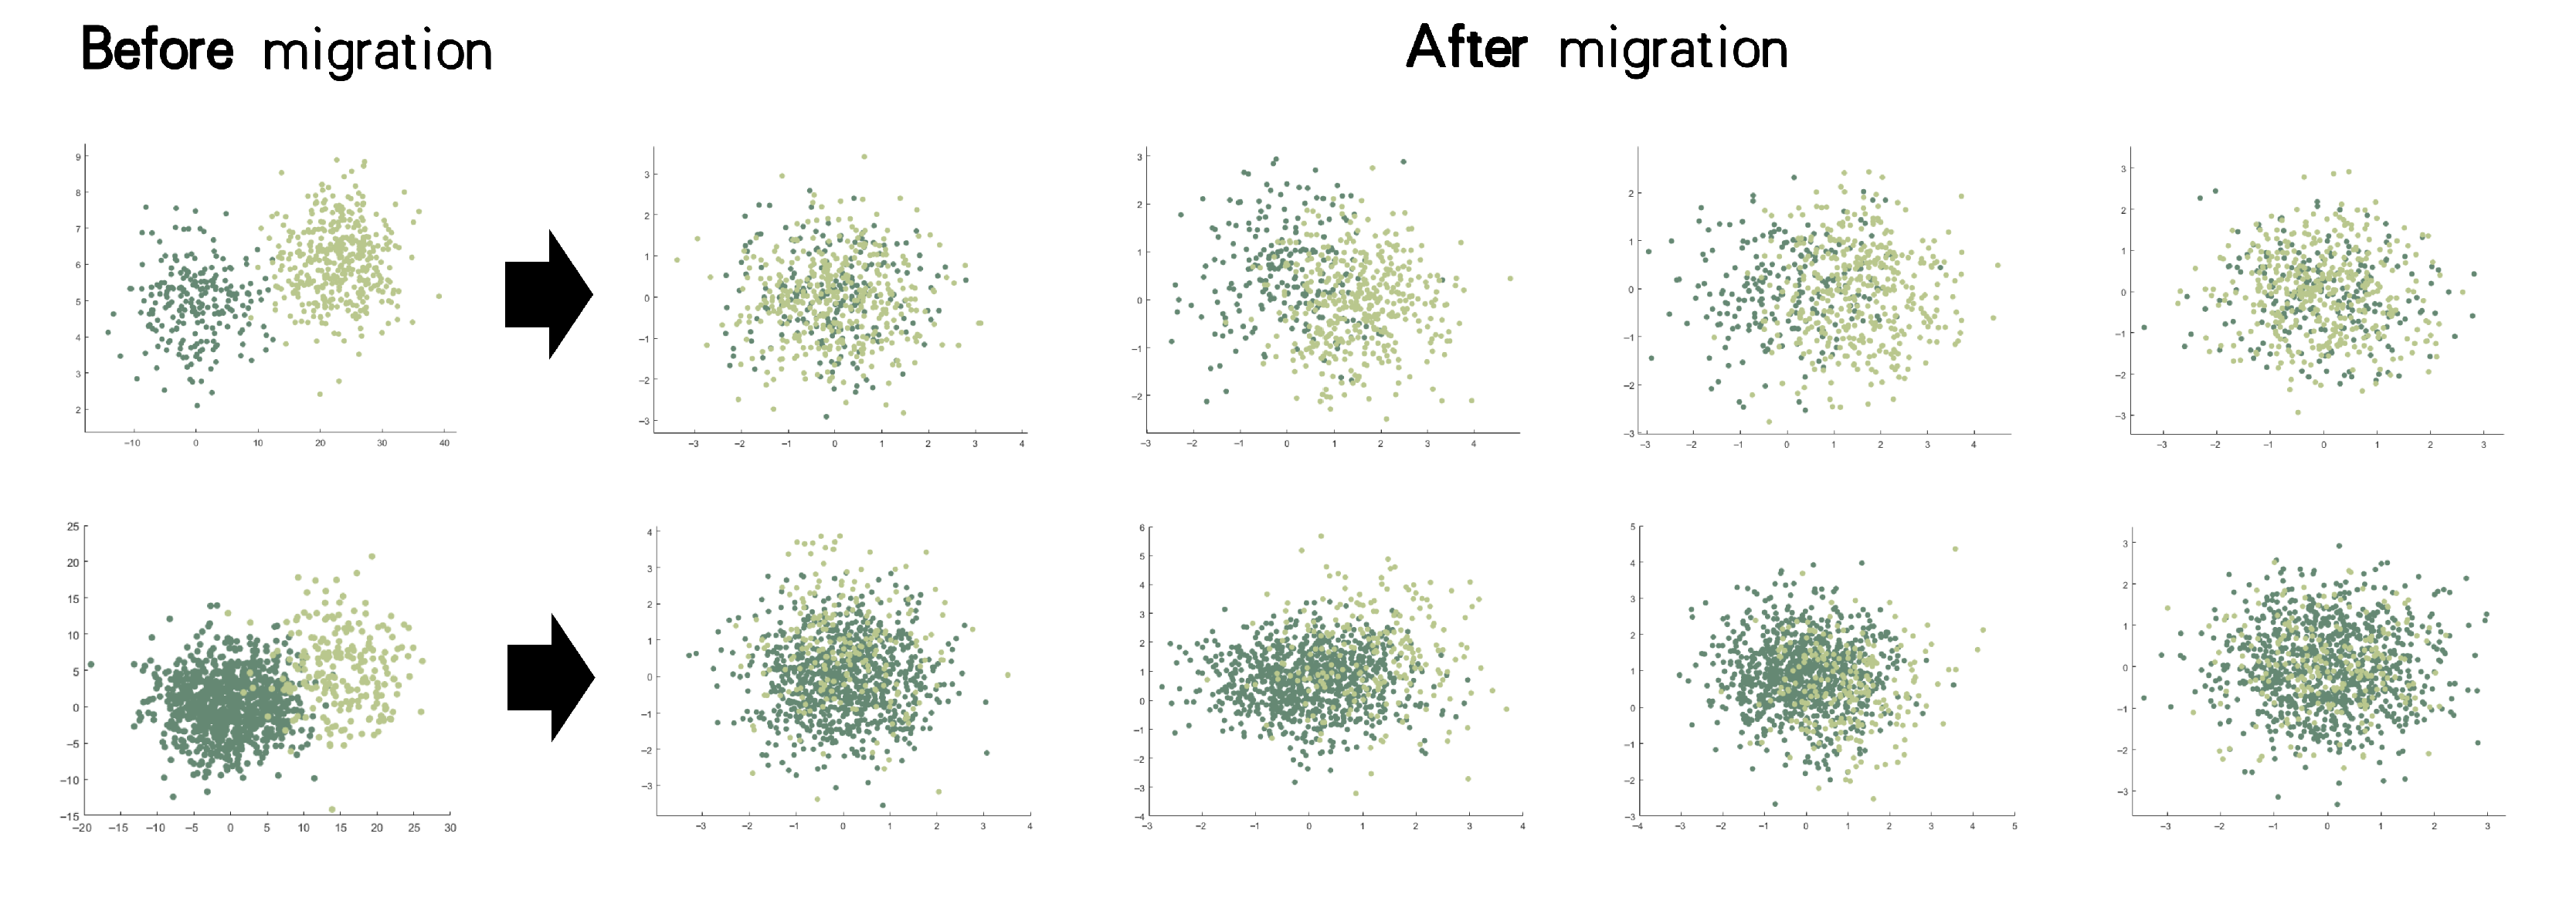
To investigate how different distribution metrics would affect recognition rate, we chose to use different measures for loss function in training on two tasks: MNIST → QMNIST (digit only) and SSDA → STDA (digit + characters). From Figure 8, we can see that MMD was not always the optimal choice, although it was commonly used by many transfer learning models. In some cases, the Wasserstein distance led to slightly better results against MMD. It is worth noting that the Kullback–Leibler (KL) divergence would approximate to infinity while Jensen–Shannon (JS) divergence would become a constant when the distribution of the real samples and the distribution of the synthetic samples did not overlap at all (indicating that they were mutable). In contrast, the Wasserstein distance remained smooth. When optimizing the parameter with SGD, the KL divergence and JS divergence often resulted in zero gradient in back-propagation. Similarly, if two distributions in the mapped high-dimensional feature space had little or no overlap, the KL divergence and JS divergence could not measure the distance between the two distributions and thus could not provide a gradient, while the Wasserstein distance did provide a meaningful gradient. The advantage of Wasserstein distance over KL divergence and JS divergence was that even if the distributions of the two dataset had very little or no overlap, it could still reflected the proximity of the two distributions. In summary, the Wasserstein distance is a natural measure of the distance between different continuous distributions compared to MMD, KL divergence, and JS distance measures. It not only gave a measure of distance, but also provided a scheme for transforming one distribution into another, while maintaining the geometric characteristics of the distribution itself. This was the reason why optimal results were obtained using the Wasserstein distance as the distribution measure for model optimization.
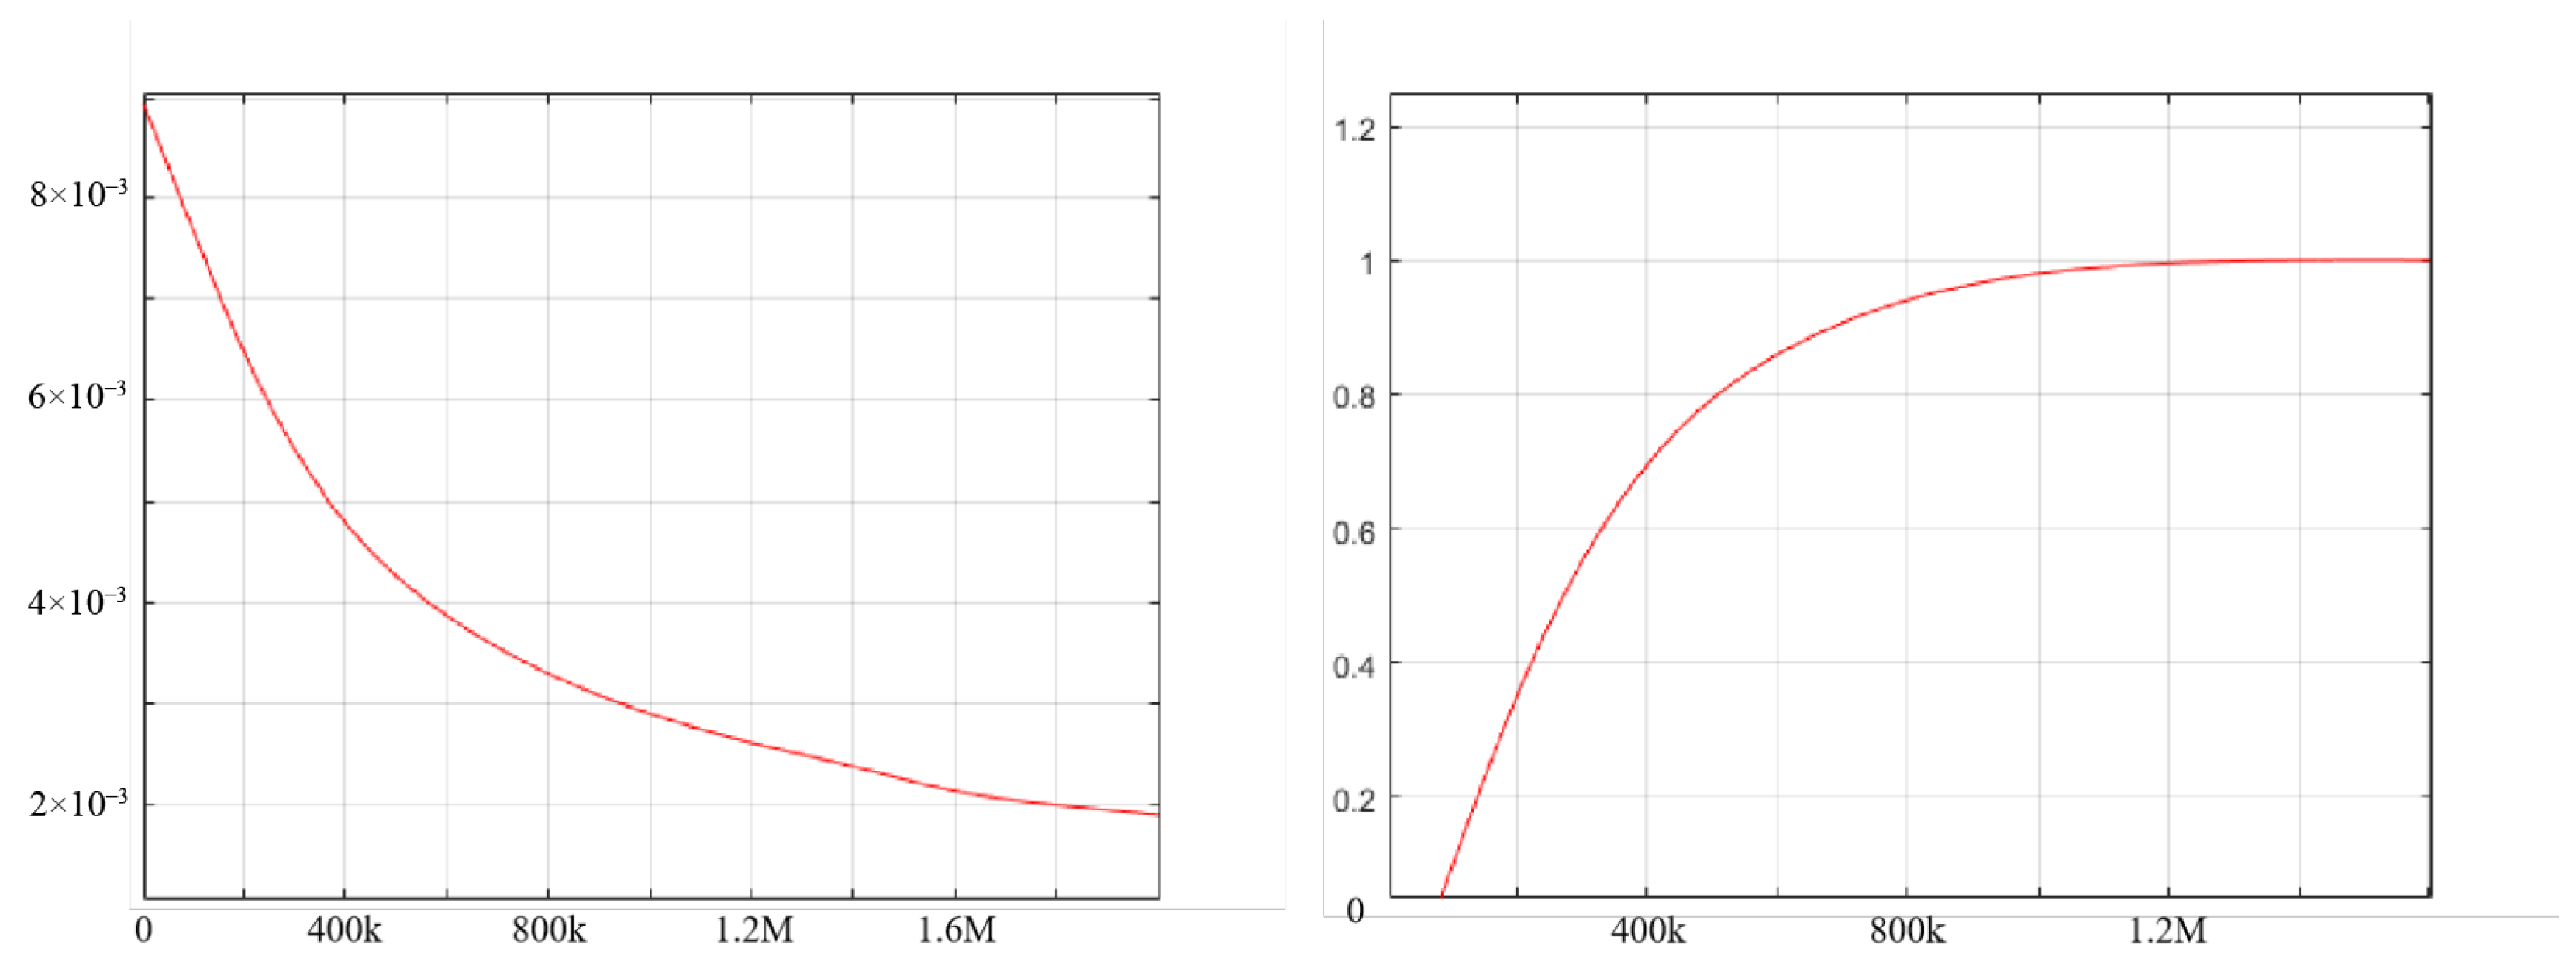
Finally, the change of the learning rate η and the gradient inversion layer parameters λ during the training process of performing the SSDA → STDA migration task are shown in Figure 9. In the process of training the model, with the initial learning rate η 0 set to 10 × 10 3 , the learning rate η was able to converge quickly to under 2 × 10 3 with the training iterations. The gradient inversion layer parameter λ is an adaptive parameter that controls the training process to shape the feature weights between the two target samples. The value of the fixed adaptive parameter λ was keep constant during the experiments, and the value of λ gradually approached 1 from the initial 0 with the training iterations. This indicated that the model converged quickly and had good generalization ability.
Figure 10 shows the convergence variation of the losses, using the benchmark conditions of the SSDA → STDA task, a mosaic stitching enhancement approach with a targeted screening strategy, and Wasserstein distance as a distribution metric.

7. Conclusions

This paper aims to alleviate the impact of aging in an e-textile-based interaction, with handwritten character recognition as the example. We firstly validated the distribution discrepancy between data collected from the e-textile before and after aging. Then, a novel adversarial domain adaptation framework for the recognition of handwritten characters from an e-textile device was designed, with a Gabor orientation convolution operation integrated for feature extraction. Better results were achieved with our method compared to existing ones. Aging is a complex phenomenon, and this study marks just a small step toward understanding its existence and impact on downstream algorithms. In the future, we would like to investigate the modeling of functional aging behavior with deep learning and incorporate the model into various interaction scenarios, so that we can deal with the problem better in a continuous manner rather than the current discrete way. Moreover, the current study does not pay special attention to similar characters, such as number ‘0’ and the letter ‘o’. This issue needs to be carefully addressed to make the algorithms robust in real applications.

Author Contributions

Conceptualization, J.L. and Y.C.; Methodology, Y.R.; Software, C.H.; Validation, Y.R.; Writing—original draft, Y.C.; Writing—review & editing, J.L.; Supervision, J.L. All authors have read and agreed to the published version of the manuscript.

Funding

This research was funded by the Fundamental Research Funds for the Central Universities, China (No. 20720230106).

Institutional Review Board Statement

Not applicable.

Informed Consent Statement

Not applicable.

Data Availability Statement

The original contributions presented in this study are included in the article. Further inquiries can be directed to the corresponding author.

Acknowledgments

The authors thank Ying Wang for the early exploration on the topic.

Conflicts of Interest

Authors Chenkang He and Juncong Lin were employed by Xiamen University. The remaining authors declare that the research was conducted in the absence of any commercial or financial relationships that could be construed as potential conflicts of interest.

References

  1. Lee, L.H.; Braud, T.; Zhou, P.; Wang, L.; Xu, D.; Lin, Z.; Kumar, A.; Bermejo, C.; Hui, P. All one needs to know about metaverse: A complete survey on technological singularity, virtual ecosystem, and research agenda. arXiv 2021, arXiv:2110.05352. [Google Scholar] [CrossRef]
  2. Zhang, Y.; Kienzle, W.; Ma, Y.; Ng, S.S.; Benko, H.; Harrison, C. ActiTouch: Robust touch detection for on-skin AR/VR interfaces. In Proceedings of the 32nd Annual ACM Symposium on User Interface Software and Technology, New Orleans, LA, USA, 20–23 October 2019; pp. 1151–1159. [Google Scholar]
  3. Hachisu, T.; Bourreau, B.; Suzuki, K. Enhancedtouchx: Smart bracelets for augmenting interpersonal touch interactions. In Proceedings of the 2019 CHI Conference on Human Factors in Computing Systems, Glasgow, UK, 4–9 May 2019; pp. 1–12. [Google Scholar]
  4. Lu, Y.; Yu, C.; Yi, X.; Shi, Y.; Zhao, S. Blindtype: Eyes-free text entry on handheld touchpad by leveraging thumb’s muscle memory. In Proceedings of the ACM on Interactive, Mobile, Wearable and Ubiquitous Technologies; Association for Computing Machinery: New York, NY, USA, 2017; Volume 1, pp. 1–24. [Google Scholar]
  5. Whitmire, E.; Jain, M.; Jain, D.; Nelson, G.; Karkar, R.; Patel, S.; Goel, M. Digitouch: Reconfigurable thumb-to-finger input and text entry on head-mounted displays. In Proceedings of the ACM on Interactive, Mobile, Wearable and Ubiquitous Technologies; Association for Computing Machinery: New York, NY, USA, 2017; Volume 1, pp. 1–21. [Google Scholar]
  6. Yu, C.; Gu, Y.; Yang, Z.; Yi, X.; Luo, H.; Shi, Y. Tap, dwell or gesture? exploring head-based text entry techniques for hmds. In Proceedings of the 2017 CHI Conference on Human Factors in Computing Systems, Denver, CO, USA, 6–11 May 2017; pp. 4479–4488. [Google Scholar]
  7. Ghosh, D.; Foong, P.S.; Zhao, S.; Liu, C.; Janaka, N.; Erusu, V. Eyeditor: Towards on-the-go heads-up text editing using voice and manual input. In Proceedings of the 2020 CHI Conference on Human Factors in Computing Systems, Honolulu, HI, USA, 25–30 April 2020; pp. 1–13. [Google Scholar]
  8. Zhan, L.; Xiong, T.; Zhang, H.; Guo, S.; Chen, X.; Gong, J.; Lin, J.; Qin, Y. TouchEditor: Interaction Design and Evaluation of a Flexible Touchpad for Text Editing of Head-Mounted Displays in Speech-unfriendly Environments. In Proceedings of the ACM on Interactive, Mobile, Wearable and Ubiquitous Technologies; Association for Computing Machinery: New York, NY, USA, 2024; Volume 7, pp. 1–29. [Google Scholar] [CrossRef]
  9. Fang, F.; Zhang, H.; Zhan, L.; Guo, S.; Zhang, M.; Lin, J.; Qin, Y.; Fu, H. Handwriting Velcro: Endowing AR Glasses with Personalized and Posture-adaptive Text Input Using Flexible Touch Sensor. In Proceedings of the ACM on Interactive, Mobile, Wearable and Ubiquitous Technologies; Association for Computing Machinery: New York, NY, USA, 2023; Volume 6, pp. 1–31. [Google Scholar]
  10. Biermaier, C.; Bechtold, T.; Pham, T. Towards the functional ageing of electrically conductive and sensing textiles: A review. Sensors 2021, 21, 5944. [Google Scholar] [CrossRef] [PubMed]
  11. He, H.; Chen, X.; Mehmood, A.; Raivio, L.; Huttunen, H.; Raumonen, P.; Virkki, J. ClothFace: A batteryless RFID-based textile platform for handwriting recognition. Sensors 2020, 20, 4878. [Google Scholar] [CrossRef] [PubMed]
  12. Islam, G.N.; Ali, A.; Collie, S. Textile sensors for wearable applications: A comprehensive review. Cellulose 2020, 27, 6103–6131. [Google Scholar] [CrossRef]
  13. Parzer, P.; Perteneder, F.; Probst, K.; Rendl, C.; Leong, J.; Schuetz, S.; Vogl, A.; Schwoediauer, R.; Kaltenbrunner, M.; Bauer, S. Resi: A highly flexible, pressure-sensitive, imperceptible textile interface based on resistive yarns. In Proceedings of the 31st Annual ACM Symposium on User Interface Software and Technology, Berlin, Germany, 14 October 2018; pp. 745–756. [Google Scholar]
  14. Mikkonen, J.; Townsend, R. Frequency-based design of smart textiles. In Proceedings of the 2019 CHI Conference on Human Factors in Computing Systems, Glasgow, UK, 4–9 May 2019; pp. 1–12. [Google Scholar]
  15. Wu, T.Y.; Qi, S.; Chen, J.; Shang, M.; Gong, J.; Seyed, T.; Yang, X.D. Fabriccio: Touchless Gestural Input on Interactive Fabrics. In Proceedings of the 2020 CHI Conference on Human Factors in Computing Systems, Honolulu, HI, USA, 25–30 April 2020; Association for Computing Machinery: New York, NY, USA, 2020; pp. 1–14. [Google Scholar]
  16. Zhou, B.; Geissler, D.; Faulhaber, M.; Gleiss, C.E.; Zahn, E.F.; Ray, L.S.S.; Gamarra, D.; Rey, V.F.; Suh, S.; Bian, S. MoCaPose: Motion Capturing with Textile-integrated Capacitive Sensors in Loose-fitting Smart Garments. In Proceedings of the ACM on Interactive, Mobile, Wearable and Ubiquitous Technologies; Association for Computing Machinery: New York, NY, USA, 2023; Volume 7, pp. 1–40. [Google Scholar]
  17. Ku, P.S.; Huang, K.; Kao, C.H.L. Patch-O: Deformable Woven Patches for On-body Actuation. In Proceedings of the 2022 CHI Conference on Human Factors in Computing Systems, New Orleans, LA, USA, 29 April–5 May 2022; pp. 1–12. [Google Scholar]
  18. Xu, G.; Wan, Q.; Deng, W.; Guo, T.; Cheng, J. Smart-Sleeve: A wearable textile pressure sensor array for human activity recognition. Sensors 2022, 22, 1702. [Google Scholar] [CrossRef] [PubMed]
  19. Khorsandi, P.M.; Jones, L.; Davoodnia, V.; Lampen, T.J.; Conrad, A.; Etemad, A.; Nabil, S. FabriCar: Enriching the User Experience of In-Car Media Interactions with Ubiquitous Vehicle Interiors using E-textile Sensors. In Proceedings of the 2023 ACM Designing Interactive Systems Conference, Pittsburgh, PA, USA, 10–14 July 2023; pp. 1438–1456. [Google Scholar]
  20. Bhatia, A.; Mughrabi, M.H.; Abdlkarim, D.; Di Luca, M.; Gonzalez-Franco, M.; Ahuja, K.; Seifi, H. Text Entry for XR Trove (TEXT): Collecting and Analyzing Techniques for Text Input in XR. In CHI ’25, Proceedings of the 2025 CHI Conference on Human Factors in Computing Systems, Yokohama, Japan, 26 April–1 May 2025; Association for Computing Machinery: New York, NY, USA, 2025. [Google Scholar] [CrossRef]
  21. Ihara, A.S.; Nakajima, K.; Kake, A.; Ishimaru, K.; Osugi, K.; Naruse, Y. Advantage of handwriting over typing on learning words: Evidence from an N400 event-related potential index. Front. Hum. Neurosci. 2021, 15, 679191. [Google Scholar] [CrossRef] [PubMed]
  22. Keysers, D.; Deselaers, T.; Gollan, C.; Ney, H. Deformation models for image recognition. IEEE Trans. Pattern Anal. Mach. Intell. 2007, 29, 1422–1435. [Google Scholar] [CrossRef] [PubMed]
  23. DeCoste, D.; Schölkopf, B. Training invariant support vector machines. Mach. Learn. 2002, 46, 161–190. [Google Scholar] [CrossRef]
  24. McDonnell, M.D.; Tissera, M.D.; Vladusich, T.; van Schaik, A.; Tapson, J. Fast, simple and accurate handwritten digit classification by training shallow neural network classifiers with the ‘extreme learning machine’algorithm. PLoS ONE 2015, 10, e0134254. [Google Scholar] [CrossRef] [PubMed]
  25. Ciresan, D.C.; Meier, U.; Gambardella, L.M.; Schmidhuber, J. Convolutional neural network committees for handwritten character classification. In Proceedings of the 2011 International Conference on Document Analysis and Recognition, Beijing, China, 18–21 September 2011; pp. 1135–1139. [Google Scholar]
  26. Yang, Z.; Moczulski, M.; Denil, M.; Freitas, N.D.; Smola, A.; Song, L.; Wang, Z. Deep fried convnets. In Proceedings of the IEEE International Conference on Computer Vision, Santiago, Chile, 7–13 December 2015; pp. 1476–1483. [Google Scholar]
  27. Hertel, L.; Barth, E.; Käster, T.; Martinetz, T. Deep convolutional neural networks as generic feature extractors. In Proceedings of the 2015 International Joint Conference on Neural Networks (IJCNN), Killarney, Ireland, 12–17 July 2015; pp. 1–4. [Google Scholar]
  28. Hull, J.J. A database for handwritten text recognition research. IEEE Trans. Pattern Anal. Mach. Intell. 1994, 16, 550–554. [Google Scholar] [CrossRef]
  29. Deng, L. The mnist database of handwritten digit images for machine learning research [best of the web]. IEEE Signal Process. Mag. 2012, 29, 141–142. [Google Scholar] [CrossRef]
  30. Cohen, G.; Afshar, S.; Tapson, J.; Schaik, A.V. EMNIST: Extending MNIST to handwritten letters. In Proceedings of the 2017 International Joint Conference on Neural Networks (IJCNN), Anchorage, AK, USA, 14–19 May 2017; pp. 2921–2926. [Google Scholar]
  31. Yadav, C.; Bottou, L. Cold case: The lost mnist digits. In Proceedings of the NIPS’19: 33rd International Conference on Neural Information Processing Systems, Vancouver, BC, Canada, 8–14 December 2019; Volume 32. [Google Scholar]
  32. Donahue, J.; Jia, Y.; Vinyals, O.; Hoffman, J.; Zhang, N.; Tzeng, E.; Darrell, T. Decaf: A deep convolutional activation feature for generic visual recognition. In Proceedings of the International Conference on Machine Learning, Beijing, China, 21–26 June 2014; pp. 647–655. [Google Scholar]
  33. Meng, R.; Chen, W.; Yang, S.; Song, J.; Lin, L.; Xie, D.; Pu, S.; Wang, X.; Song, M.; Zhuang, Y. Slimmable domain adaptation. In Proceedings of the IEEE/CVF Conference on Computer Vision and Pattern Recognition, New Orleans, LA, USA, 18–24 June 2022; pp. 7141–7150. [Google Scholar]
  34. Zou, Y.; Yu, Z.; Liu, X.; Kumar, B.; Wang, J. Confidence regularized self-training. In Proceedings of the IEEE/CVF International Conference on Computer Vision, Seoul, Republic of Korea, 27 October–2 November 2019; pp. 5982–5991. [Google Scholar]
  35. Zhou, Q.; Feng, Z.; Gu, Q.; Cheng, G.; Lu, X.; Shi, J.; Ma, L. Uncertainty-aware consistency regularization for cross-domain semantic segmentation. Comput. Vis. Image Underst. 2022, 221, 103448. [Google Scholar] [CrossRef]
  36. Zhang, P.; Zhang, B.; Zhang, T.; Chen, D.; Wang, Y.; Wen, F. Prototypical pseudo label denoising and target structure learning for domain adaptive semantic segmentation. In Proceedings of the IEEE/CVF Conference on Computer Vision and Pattern Recognition, Nashville, TN, USA, 20–25 June 2021; pp. 12414–12424. [Google Scholar]
  37. Wu, A.; Han, Y.; Zhu, L.; Yang, Y. Instance-invariant domain adaptive object detection via progressive disentanglement. IEEE Trans. Pattern Anal. Mach. Intell. 2021, 44, 4178–4193. [Google Scholar] [CrossRef] [PubMed]
  38. Bochkovskiy, A.; Wang, C.Y.; Liao, H.Y.M. Yolov4: Optimal speed and accuracy of object detection. arXiv 2020, arXiv:2004.10934. [Google Scholar] [CrossRef]
  39. Schölkopf, B.; Smola, A.J. Learning with Kernels: Support Vector Machines, Regularization, Optimization, and Beyond; MIT Press: Cambridge, MA, USA, 2002. [Google Scholar]
  40. Gretton, A.; Borgwardt, K.M.; Rasch, M.J.; Schölkopf, B.; Smola, A. A kernel two-sample test. J. Mach. Learn. Res. 2012, 13, 723–773. [Google Scholar]
  41. Liu, F.; Xu, W.; Lu, J.; Zhang, G.; Gretton, A.; Sutherland, D.J. Learning deep kernels for non-parametric two-sample tests. In Proceedings of the International Conference on Machine Learning, Online, 13–18 July 2020; pp. 6316–6326. [Google Scholar]
  42. Wenliang, L.; Sutherland, D.J.; Strathmann, H.; Gretton, A. Learning deep kernels for exponential family densities. In Proceedings of the International Conference on Machine Learning, Long Beach, CA, USA, 9–15 June 2019; pp. 6737–6746. [Google Scholar]
  43. Ganin, Y.; Lempitsky, V. Unsupervised domain adaptation by backpropagation. In Proceedings of the International Conference on Machine Learning, Lille, France, 6–11 July 2015; pp. 1180–1189. [Google Scholar]
  44. Dai, J.; Qi, H.; Xiong, Y.; Li, Y.; Zhang, G.; Hu, H.; Wei, Y. Deformable convolutional networks. In Proceedings of the IEEE International Conference on Computer Vision, Venice, Italy, 22–29 October 2017; pp. 764–773. [Google Scholar]
  45. Zhou, Y.; Ye, Q.; Qiu, Q.; Jiao, J. Oriented response networks. In Proceedings of the IEEE Conference on Computer Vision and Pattern Recognition, Honolulu, HI, USA, 21–26 July 2017; pp. 519–528. [Google Scholar]
  46. Kwolek, B. Face detection using convolutional neural networks and Gabor filters. In Proceedings of the International Conference on Artificial Neural Networks, Warsaw, Poland, 11–15 September 2005; pp. 551–556. [Google Scholar]
  47. Calderon, A.; Roa, S.; Victorino, J. Handwritten digit recognition using convolutional neural networks and gabor filters. Proc. Int. Congr. Comput. Intell. 2003, 42, 9-441. [Google Scholar]
  48. Chang, S.Y.; Morgan, N. Robust CNN-based speech recognition with Gabor filter kernels. In Proceedings of the Fifteenth Annual Conference of the International Speech Communication Association, Singapore, 14–18 September 2014. [Google Scholar]
  49. Gabor, D. Theory of communication. Part 1: The analysis of information. J. Inst. Electr. Eng.-Part III Radio Commun. Eng. 1946, 93, 429–441. [Google Scholar] [CrossRef]
  50. Garrido-Munoz, C.; Rios-Vila, A.; Calvo-Zaragoza, J. Handwritten Text Recognition: A Survey. arXiv 2025, arXiv:2502.08417. [Google Scholar] [CrossRef]
  51. Long, M.; Cao, Y.; Wang, J.; Jordan, M. Learning transferable features with deep adaptation networks. In Proceedings of the International Conference on Machine Learning, Lille, France, 6–11 July 2015; pp. 97–105. [Google Scholar]
  52. Cao, Z.; Long, M.; Wang, J.; Jordan, M.I. Partial transfer learning with selective adversarial networks. In Proceedings of the IEEE Conference on Computer Vision and Pattern Recognition, Salt Lake City, UT, USA, 18–23 June 2018; pp. 2724–2732. [Google Scholar]
  53. Liu, X.; Guo, Z.; Li, S.; Xing, F.; You, J.; Kuo, C.C.J.; El Fakhri, G.; Woo, J. Adversarial unsupervised domain adaptation with conditional and label shift: Infer, align and iterate. In Proceedings of the IEEE/CVF International Conference on Computer Vision, Montreal, QC, Canada, 10–17 October 2021; pp. 10367–10376. [Google Scholar]
Figure 1. Raw data collected from e-textile device.
Electronics 14 03964 g001
Figure 2. Character images obtained by pre-processing the raw data.
Electronics 14 03964 g002
Figure 3. Regular data augumentation: (a) geometric transformation; (b) mix up; (c) cut mix; (d) adding noise (blurring).
Electronics 14 03964 g003
Figure 4. Mosaic stitching. Red rectangle bounded areas are used for composition.
Electronics 14 03964 g004
Figure 5. Unsupervised domain adaptation with adversarial learning.
Electronics 14 03964 g005
Figure 6. Comparison of test accuracy for different methods.
Electronics 14 03964 g006
Figure 7. Comparison of recognition rates of different data enhancement methods under SSDA → STDA tasks.
Electronics 14 03964 g007
Figure 8. Comparison of data distribution before and after migration using different distribution metrics. The first row shows the results for the M N I S T Q M N I S T task, while the second row shows results for S S D A S T D A . From left to right, the four columns of “after migration” correspond to metrics of MMD, KL divergence, JS distance, and Wasserstein distance, respectively.
Electronics 14 03964 g008
Figure 9. Change of learning rate (left) and gradient inversion layer parameter (right) during training.
Electronics 14 03964 g009
Figure 10. Changes of losses corresponding to discriminator (left), classifier (middle), and total (right).
Electronics 14 03964 g010
Table 1. Comparison for significance test.
DatasetsGaussian KernelMean Embedding
USPS×
MNIST
SA
Table 2. Comparison of average test accuracy for different methods.
NMean EmbeddingGaussian KernelDeep Kernel
200 0.188 ± 0.010 0.414 ± 0.050 0.555 ± 0.044
400 0.363 ± 0.017 0.921 ± 0.032 0.996 ± 0.004
600 0.619 ± 0.021 1.000 ± 0.000 1.000 ± 0.000
800 0.797 ± 0.015 1.000 ± 0.000 1.000 ± 0.000
1000 0.894 ± 0.016 1.000 ± 0.000 1.000 ± 0.000
Avg 0.572 0.867 0.910
Table 3. Recognition rates of different models for four types of migration tasks.
TasksMethodsAccuracy
SSDA → STDADAN [51]62.3 ± 4.22
SSDA → STDASAN [52]69.5 ± 2.48
SSDA → STDAUDA [53]73.7 ± 0.83
SSDA → STDAA2TEXT75.6 ± 1.25
USPS → QMNISTDAN74.7 ± 1.28
USPS → QMNISTSAN78.1 ± 1.91
USPS → QMNISTUDA78.8 ± 0.69
USPS → QMNISTA2TEXT80.4 ± 1.82
MNIST → QMNISTDAN76.7 ± 1.58
MNIST → QMNISTSAN79.2 ± 1.13
MNIST → QMNISTUDA80.5 ± 0.97
MNIST → QMNISTA2TEXT82.1 ± 1.08
MNIST + EMNSIT → SSDA + STDADAN68.4 ± 0.91
MNIST + EMNSIT → SSDA + STDASAN69.8 ± 0.63
MNIST + EMNSIT → SSDA + STDAUDA73.5 ± 0.55
MNIST + EMNSIT → SSDA + STDAA2TEXT77.8 ± 0.93
Table 4. Impact of data augmentation methods on the recognition rates of our model under SSDA → STDA tasks.
Data Enhancement MethodsAccuracy
Geometric88.6 ± 2.3
Mosaic96.9 ± 0.5
Mix up94.2 ± 1.1
Cut Mix94.4 ± 0.7
Gaussian90.7 ± 1.7
Disclaimer/Publisher’s Note: The statements, opinions and data contained in all publications are solely those of the individual author(s) and contributor(s) and not of MDPI and/or the editor(s). MDPI and/or the editor(s) disclaim responsibility for any injury to people or property resulting from any ideas, methods, instructions or products referred to in the content.