Abstract
Global Navigation Satellite System (GNSS) spoofing, which manipulates PVT solutions through false measurements, increasingly threatens GNSS reliability and user safety. However, most existing simulator-based spoofers, constrained by their inability to access real-time ionospheric information (e.g., Global Ionosphere Maps, GIMs) from external sources, struggle to replicate authentic total electron content (TEC) along each signal propagation path accurately and in a timely manner. In contrast, widespread dual-frequency (DF) receivers with access to the internet can validate local TEC measurements against external references, establishing a pivotal spoofing detection distinction. Here, we propose an Ionospheric Information-Assisted Spoofing Detection Technique (IIA-SDT), exploiting the inherent consistency between TEC values derived from DF pseudo-range measurements and external references in spoofing-free scenarios. Spoofing probably disrupts this consistency: in simulator-based full-channel spoofing where all channels are spoofed, the inaccuracies of the offline ionospheric model used by the spoofer inevitably cause TEC mismatches; in partial-channel spoofing where the spoofer fails to control all channels, an unintended PVT deviation is induced, which also causes TEC deviations due to the spatial variation of the ionosphere. Basic principles and theoretical analysis of the proposed IIA-SDT are elaborated in the paper. Simulations using ionospheric data collected from 2023 to 2024 at a typical mid-latitude location are conducted to evaluate IIA-SDT performance under various parameter configurations. With a window length of 5 s and satellite number of 8, the annual average detection probability approximates 75% at a false alarm rate of , with observable temporal variations. Field experiments across multiple scenarios further validate the spoofing detection capability of the proposed method.
1. Introduction
Current Positioning, Velocity, and Timing (PVT) applications heavily rely on the Global Navigation Satellite System (GNSS). However, the dependency of GNSS-reliant systems on PVT services exposes them to the risk of spoofing attacks [1]. GNSS spoofing, which involves introducing erroneous measurements to victim receivers, can result in incorrect or manipulated PVT solutions, thereby posing an increasingly serious threat to GNSS accessibility and user safety. Numerous field experiments have demonstrated the potential risks of GNSS spoofing across various application scenarios, including drones, vehicles, and smart mobile terminals [2,3,4,5,6].
On the other hand, the capability of dual-frequency (DF) GNSS receivers to effectively mitigate ionospheric delay and enhance PVT accuracy has led to a growing number of users adopting the DF reception technique. Concurrently, all major modern GNSS systems are broadcasting navigation signals across multiple frequencies [7,8,9,10]. Beyond improving accuracy, DF GNSS has great potential in spoofing defense. The additional PVT information provided by a second frequency band directly complicates effective spoofing attacks [11]. Moreover, DF reception does not impose stringent requirements on auxiliary sensors or specific user motion patterns, which broadens its applicability in anti-spoofing contexts. Nevertheless, prior research on DF GNSS spoofing defenses remains limited.
In [12], the benefits of DF GNSS in countering single-frequency (SF) spoofing are discussed and assessed through field experiments. An anti-spoofing method based on the Carrier-to-Noise Ratio (C/N0) pattern of DF signals is introduced in [13], and the idea of utilizing cross-correlation of P(Y) code modulated in L1 and L2 frequencies as well as range differences are also proposed in [14]. These methods demonstrate excellent detection performance against spoofing attacks generated by an SF signal simulator. From position aspects, a straightforward DF defense approach is Direct Position Comparison (DPC), which verifies the consistency of PVT solutions independently derived from each frequency. DPC effectively detects SF spoofing but fails when spoofers generate inter-frequency consistent signals. Such attacks are feasible with modern hardware simulators or software-defined radios (SDRs), as demonstrated in [15,16], which showed a seamless DF spoofing attack capable of steering a vehicle along a preset trajectory. Additionally, Receiver Autonomous Integrity Monitoring (RAIM) [17] has been widely applied with detection of blind spots in full-channel spoofing scenarios, and its multi-frequency variation [18] has also been studied. However, for DF receivers, the ionosphere-free combinations make the observation equations exactly determined, leaving no residuals to expose spoofing-induced inconsistencies.
In summary, existing methods largely check the consistency between frequencies at the signal or position level. While these techniques are generally effective against SF spoofing, they cannot reliably detect self-consistent DF spoofing, which ensures inter-frequency consistency across all signals. In practice, such DF spoofing is not only theoretically feasible but can be easily implemented, and is capable of generating dual-frequency signals with synchronized signal quality and PVT solutions [19]. This practical vulnerability underscores a critical gap: the detection capacity of existing DF anti-spoofing methods is limited when encountering self-consistent DF spoofing, and ongoing research remains important and meaningful.
A key feature of DF GNSS receivers is that signals traverse the ionosphere, introducing a frequency-dependent delay known as ionospheric delay [20]. By exploiting this property, DF receivers can estimate the ionospheric delay along each signal path, which corresponds to the total electron content (TEC) [21]. The ionosphere has complex spatial and temporal variation characteristics, and real-time Global Ionospheric Maps (GIMs) are readily available from various online platforms, including the Jet Propulsion Laboratory (JPL) [22], WuHan University (WHU) [23], the International GNSS Service (IGS) [24], etc.
However, for existing simulator-based spoofers, acquiring real-time ionospheric references from the internet adds significant cost, inconvenience, and complexity. In practice, spoofers usually rely on Spherical Harmonic (SH) models, such as Klobuchar [25] or NeQuick [26], to approximate local ionospheric conditions. They then compute ionospheric delays for each visible satellite and impose these on the spoofed signals. Inevitably, compared to real-time GIM references, such model-based ionospheric states deviate more from reality.
Based on the above discussion, this paper proposes an Ionospheric Information-Assisted Spoofing Detection Technique (IIA-SDT) based on a consistency check between DF TEC measurements and a reliable external GIM TEC reference. Different from traditional methods that rely on internal signal-level or position-level consistency between different frequencies, the novelty of IIA-SDT lies in exploiting the discrepancy between spoofed and true ionospheric states, which comes from an external source. By leveraging this external physical-layer reference, IIA-SDT effectively addresses the shortcomings of conventional methods that fail when facing inter-consistent DF spoofers.
In spoofing-free cases, the discrepancy between TEC measurements derived from DF pseudo-ranges and real-time GIM reference values typically remains within the receiver’s measurement error range. In spoofing cases, IIA-SDT facilitates detection through the following key deviations:
- SF Bias (SFB): When only one out of two DF pseudo-ranges of a satellite is intentionally biased by a spoofer while the other is not, a significant anomaly in the TEC measurement is introduced.
- Ionospheric Model Bias (IMB): TEC values emulated by a simulator-spoofer, relying on an offline SH model, such as the Klobuchar model, usually deviate from the corresponding TEC references.
- Position-Related Bias (PRB): When spoofing signals are not strong enough to override all authentic ones, the receiver may simultaneously track both, leading to partial-channel spoofing, which could cause the computed position to deviate from both the true and spoofed positions [27]. Such deviation also leads to inconsistencies between TEC references derived from the biased position and the TEC values corresponding to the actual or spoofed locations due to ionospheric spatial variation.
These bias sources grant the proposed IIA-SDT method a broad applicability, enabling it to effectively detect a wide range of spoofing scenarios, including SF spoofing, partial-channel (PC) DF spoofing, and full-channel (FC) DF spoofing based on a simulator using an offline ionospheric model. In this paper, we present the method in detail through theoretical derivation, simulation analysis, and field experiments.
The structure of the subsequent content of this paper is as follows. In Section 2, the basic principles of IIA-SDT are elaborated. In Section 3, a GLRT-based detector is derived, and its theoretical performance is analyzed with simulation results. In Section 4, the effectiveness of IIA-SDT is evaluated through multiple sets of spoofing experiments. Finally, in Section 5, the characteristics and applicable scenarios of the proposed method are discussed and summarized. The table of abbreviations is also provided in the List of Abbreviations part.
2. Basic Principles of Ionospheric Information-Assisted Spoofing Detection Technique
Ionospheric Information-Assisted Spoofing Detection Technique (IIA-SDT) detects spoofing by identifying discrepancies between TEC values derived from DF pseudo-ranges and external references (e.g., IGS GIM). These discrepancies are contributed to by three major sources: SFB, IMB, and PRB. SFB is typically related to SF spoofing attacks, which can be effectively detected by DPC. Therefore, we focus on the other two types of biases in the rest of this work. IMB is caused by the lack of real-time ionospheric data access for low-cost simulator-spoofers. Additionally, power constraints on spoofers often result in PC attacks, where PRB emerges due to biased PVT solutions.
This section elaborates on the IIA-SDT mechanism in three sections: Section 2.1 reviews the impact of the ionosphere on GNSS observations. Section 2.2 analyzes the ionospheric modulation and demodulation process in spoofing cases, facilitating the understanding of TEC biases. Section 2.3 details the characteristics of IMB and PRB.
2.1. Impact of the Ionosphere on GNSS Observations
Due to the dispersion characteristics of the ionosphere, for GNSS signals with a carrier frequency of , the group refractive index of the signal in the ionosphere can be approximated as [28]:
where is the electron density within the volume element along the signal propagation path, and is the first-order Taylor expansion coefficient of the group delay refractive index. The equivalent additional distance caused by the group refraction during the signal propagation from satellite position to user position is
where is the total electron content along the propagation path between and , measured in . A commonly used unit for TEC is TECU, where .
By utilizing the fact that ionospheric delay is approximately proportional to the TEC along the propagation path, DF GNSS users can eliminate ionospheric delays by ranging individually at two different carrier frequencies [20]. Assuming there are a total of M satellites, with each satellite clock bias corrected through the ephemeris and the receiver inter-frequency hardware delay corrected through calibration, the DF pseudo-range observations of the m-th () satellite can be expressed as
where represents pseudo-range corresponding to the l-th frequency, i.e., . and denotes the ionosphere-free pseudo-range, is the geometric distance between the user and the m-th satellite, c is the speed of light in vacuum, is the user clock bias, and represents the observation noise. By solving the systems of equations, one can obtain that
thereby completing the measurement of the total electron content along the propagation path.
2.2. Ionospheric Modulation and Demodulation
Figure 1 depicts the ionospheric modulation and demodulation processes in spoofing scenarios. As depicted in Figure 1a, since current simulator-spoofers typically lack access to a real-time external ionospheric reference, a feasible way to simulate the ionospheric behavior is to compute DF ionospheric delays for each satellite using an SH model and corresponding SH coefficients [29,30], where the SH coefficients may be derived from a pre-downloaded GNSS almanac or even a default configuration. Subsequently, these computed ionospheric delays are applied to DF spoofing signals, constituting the ionospheric modulation by the spoofer. As will be discussed later in this section, the ionospheric impact on a specific signal propagation path computed using an SH model cannot perfectly reflect the actual impact of the real ionosphere, which results in IMB in both PC and FC simulator-based spoofing cases.
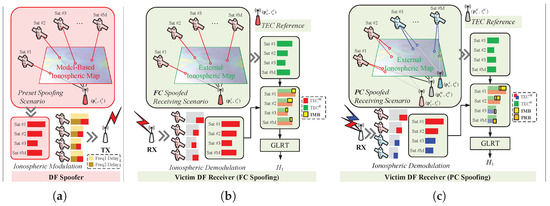
Figure 1.
(a) Ionospheric modulation process conducted by the spoofer based on an SH model and the preset spoofing scenario. (b) Ionospheric demodulation process conducted by IIA-SDT in an FC spoofing case where IMB contributes to the GLRT decision. (c) Ionospheric demodulation process conducted by IIA-SDT in a PC spoofing case where both IMB and PRB contribute to the GLRT decision.
Meanwhile, as described in Section 2.1, DF GNSS users can measure the TEC along each signal propagation path through DF pseudo-range observations. This process can be considered as the ionospheric demodulation. Additionally, a large number of GNSS users can access real-time reference ionospheric information from external sources. Existing research has validated the reliability and accuracy of the Vertical Total Electron Content (VTEC) provided by the IGS GIM products, where VTEC can be simply regarded as a projection of TEC onto an imaginary vertical propagation path [24]. By subtracting the TEC reference from the TEC measurement , the impact of IMB is reflected in FC spoofing (Figure 1b), or the combined impact of IMB and PRB in PC spoofing (Figure 1c), is reflected in PC spoofing, which is the backbone of IIA-SDT.
2.3. Characteristics of IMB and PRB
The effectiveness of IIA-SDT in detecting spoofing attacks stems from its ability to exploit two types of biases: Ionospheric Model Bias (IMB) and Position-Related Bias (PRB). IMB arises from discrepancies between the ionospheric models used by the spoofer and the real-time ionospheric conditions provided by external references (e.g., GIM). PRB, on the other hand, results from the mismatch between the user’s computed position used for TEC reference calculation and the receiver’s actual location, which influences TEC measurements. In this section, without loss of generality, the characteristics of IMB and PRB are discussed using the classical BeiDou Satellite System (BDS) Klobuchar model and GIM from IGS IONEX files as illustrative examples.
In this paper, all ionospheric reference data are taken from CODE’s one-day predicted ionospheric maps of IGS GIM products, which can provide real-time availability without latency. Since one-day predicted ionospheric maps do not include RMS information, we assume that the daily RMS values are close to those reported in the previous day’s Rapid product. This requires users to cache one day of Rapid data so that the corresponding RMS values can be used for real-time TEC residual analysis. Also, it should be emphasized that BDS is only taken as an example to demonstrate quantitative results. The proposed IIA-SDT framework itself is not limited to any specific constellation; as long as dual-frequency pseudo-range measurements are available, it can be directly applied to other modern GNSS systems such as GPS and Galileo. The conclusions drawn are equally applicable to other ionospheric models and external references.
2.3.1. IMB
IMB is time-varying. Figure 2a,b, respectively, illustrate the month-by-month and diurnal variation patterns of the mean and variance of the difference between the VTEC estimated by the BDS Klobuchar model () and the VTEC reference () provided by IGS GIM over the period from 2023 to 2024 for an example user location (40.00° N, 116.33° E). Model estimations are computed with the SH coefficients in the broadcast almanac, while the references , which are assumed to be unbiased, are obtained from the GIM products available on the IGS website. Figure 3a,b depicts the month-by-month and diurnal comparison of the root mean square error (RMSE) of VTEC, , estimated by the BDS Klobuchar model against the RMSE of the IGS GIM reference. The results reveal that there is almost always a non-negligible bias present in predictions made by the SH model. Moreover, while the SH model’s VTEC prediction capability exhibits certain monthly and diurnal variation patterns, the RMSE of the SH model prediction is generally much larger than that of the reference values.
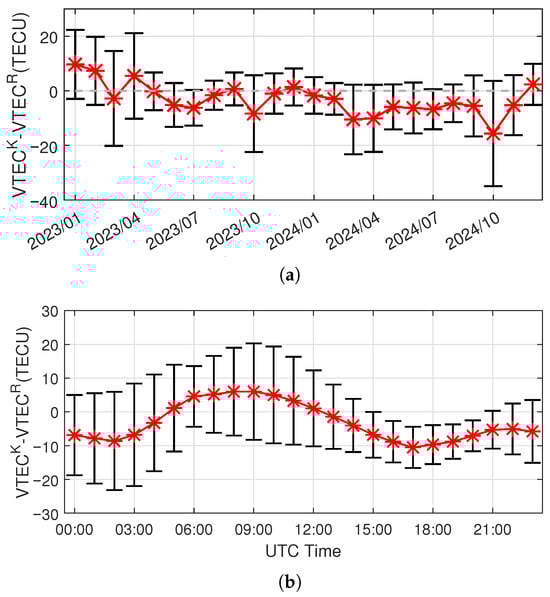
Figure 2.
(a) Month-by-month and (b) diurnal variation patterns of the mean and variance of the SH VTEC prediction residual, namely, the difference between the VTEC prediction made by the Klobuchar model and the GIM reference values.
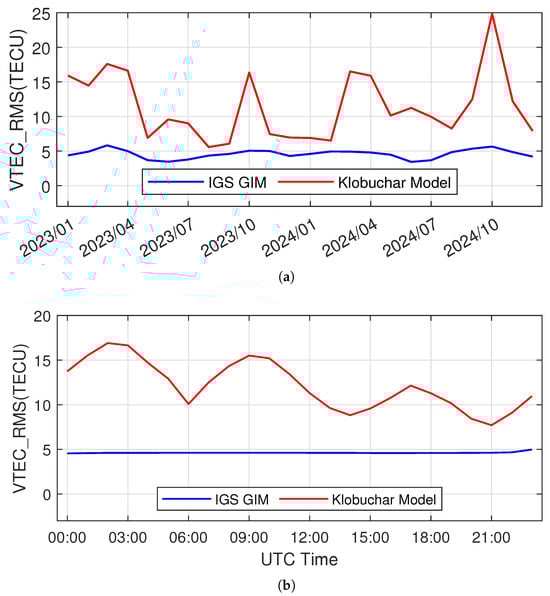
Figure 3.
(a) Month-by-month and (b) diurnal variation patterns of the RMS error of the VTEC prediction made by the Klobuchar model and the RMS error of the GIM reference directly provided by an IGS IONEX file.
Additionally, it is worth clarifying that although we select a mid-latitude location (40.00° N, 116.33° E) as an example spoofing location, it serves as a representative benchmark across low- to mid-latitude spoofing locations. While IMB is globally present, its magnitude exhibits latitudinal variations and a relation to solar activity levels. The literature [31] investigated residual STD of multiple ionospheric models (e.g., Klobuchar, NeQuick-C, and BDGIM), demonstrating that model errors generally decrease with increasing latitude except for peaks near 20° S and 20° N. These findings suggest that the effectiveness of IIA-SDT in detecting spoofing targeting a mid-latitude location can reasonably extend to lower-latitude cases, where IMB is typically more significant.
2.3.2. PRB
PRB originates from the spatial variation of the ionosphere. Based on ionospheric data during 2023–2024, Figure 4 reveals the relationship between the PRB RMS and two-dimensional position deviation, with the example reference location (PRB origin) marked as a red spot. Here, to simplify the following analysis and isolate the influence of elevation angle, a fixed satellite elevation angle of 90° is taken. The results indicate that PRB is more sensitive to latitude deviation than longitude due to the fact that the north–south gradient of mid-latitude TEC is much greater than the east–west gradient [32]. When the latitude deviation exceeds 7.5° (southward), the RMS value of PRB reaches twice the GIM reference RMS (∼5 TECU), implying acceptable detectability. However, user position deviation also causes deviation in the satellite elevation angle, resulting in more complex PRB variation characteristics in actual situations.
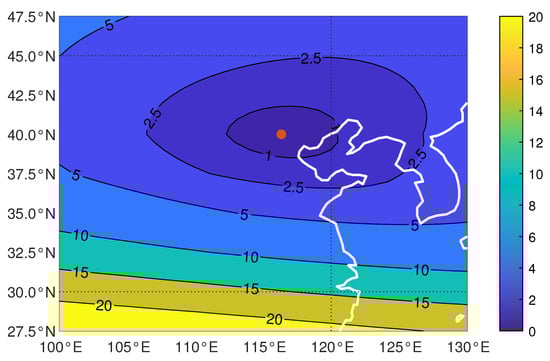
Figure 4.
PRB RMS measured in TECU, using data collected from 2023 to 2024. The PRB origin, marked as a red spot, is located at (40.00° N, 116.33° E).
3. Detection Statistics and Simulation Analysis of IIA-SDT
Based on the principle of IIA-SDT in Section 2.1, this following context firstly describes GLRT-based detector in IIA-SDT, leveraging the biases in the TEC measurement-reference differences caused by the spoofer. Then, the performance of IIA-SDT is evaluated via simulations under FC simulator-based spoofing, which is a representative situation that distinguishes IIA-SDT from previous DF anti-spoofing techniques such as DPC and RAIM.
3.1. GLRT-Based Spoofing Detection Algorithm
Intuitively, the GLRT-based detector in IIA-SDT evaluates whether there is discrepancy between the locally estimated TEC and the external reference, which can indicate the presence of spoofing. The derivation proceeds by first formulating spoofing-free and spoofing hypotheses, then modeling the noise and other parameters, deriving the corresponding detector, and finally obtaining the detection probability to evaluate performance.
Let M denote the total number of satellites and N denote the length of a detection window. The ionospheric information modulated on the DF pseudo-ranges can be demodulated using (4). In the absence of spoofing () and in the presence of spoofing (), the measured TEC of the m-th () satellite at the i-th () sample, , is modeled as follows, respectively:
where denotes the ground truth of TEC along the m-th satellite propagation path, is a zero-mean Gaussian observation noise with a standard deviation (STD) of ; represents the noise-free TEC value in the spoofing case, distorted by SFB, IMB, or (and) PRB. Among them,
where and denote the reference TEC value and its inherent error for the m-th signal propagation path. The uncertainty of is typically directly provided by the reliable external source such as IGS ionospheric products in the form of RMS. It should be noticed that , and are modeled as time-independent terms within the detection window because the ionospheric variations are slow compared to the detection window length, which is typically less than 1 min.
To simplify the discussions, assume the noise variances of DF pseudo-range observations, , are channel-, frequency-, and time-independent within the detection window, namely,
Then, the STD of is calculated as follows:
Utilizing the external GIM grids, reference TEC value for the m-th satellite () and its STD (), which is approximated with its RMS error, are computed as follows:
where and H are the radius of Earth and the height of the ionosphere in the single layer model (SLM) [20]; and are temporal–spatial grids provided by the external reference such as IGS GIM in the form of 3D tensors; are the longitude and latitude of the Ionosphere Pierce Point (IPP) of the m-th signal, respectively, which are related to user position and the m-th satellite position ; represents the user receiving time; and is the elevation angle of the satellite.
Subsequently, the reference is subtracted from the measurement and then normalized by its STD to obtain the normalized TEC residual for the m-th satellite at the i-th sample in the detection window:
Substituting (5) into (10), under and can be written as follows:
where
follows a standard Gaussian distribution , and
Define
where
Assuming , a further approximation can be made:
Then, Equation (11) can be rewritten in a vector form:
Taking as an unknown but determinate variable, a GLRT-based detector can be constructed [33]:
where represents the maximum likelihood estimate (MLE) of the unknown bias , and is the detection threshold. Substituting MLE
into (15) and taking the logarithm, the final expression for the detector can be obtained, given a false alarm rate :
where is the inverse function of the complementary error function of the chi-square distribution with degrees of freedom M, , which is defined as
Here, is the Gamma function. The relationship between the detection probability and the false alarm probability is given by the following equation:
where is the probability distribution function of the noncentral chi-square random variable with degrees of freedom of M and a positive noncentrality parameter
3.2. Simulation Analysis
The detection performance of IIA-SDT under various parameter configurations is evaluated here using simulation experiments in FC spoofing cases, where IMB is the major contributor of . As an example, the user’s position is fixed at a representative mid-latitude location (), and simulations are based on the BDS Klobuchar model and ionospheric data collected from IGS GIM within 2023–2024 as an example. The ionospheric reference used here is obtained from CODE’s one-day predicted ionospheric maps. The parameters used in the simulations are listed in Table 1.

Table 1.
Simulation parameters.
In the simulation setup, the satellite azimuth and elevation angles are uniformly distributed to emulate diverse geometric conditions in the real world:
This design implies that IMB does not originate from the point-wise discrepancy between the authentic ionosphere and the attacker’s emulated ionosphere right over the user’s true location. Instead, IMB reflects regional ionospheric differences across the user’s vicinity, determined by each satellite’s specific line-of-sight trajectory, i.e., azimuth and elevation. Figure 5 shows the variation of (), which is directly contributed by IMB here, with azimuth and elevation angle: satellites with low elevation from the southern sky () tend to cause greater IMBs.
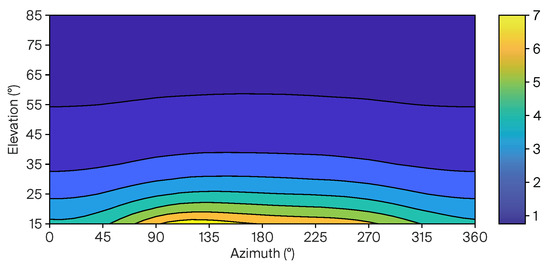
Figure 5.
Variation of (), directly contributed by IMB here, with azimuth and elevation angle.
3.2.1. Temporal Analysis
As discussed in Section 2.3.1, IMB exhibits significant temporal variation, which results in the time-varying detection performance of IIA-SDT. Figure 6 illustrates the average spoofing detection performance of IIA-SDT for each month in the year 2023–2024, with a constant false alarm rate . By comparing Figure 3a, it is observed that the more biased the Klobuchar model is in a given month, the better the detection performance of IIA-SDT. Similarly, Figure 7 displays the variation in IIA-SDT’s detection probability for each hour of the day, which approximately aligns with the diurnal variation of the model RMS error shown in Figure 2b.
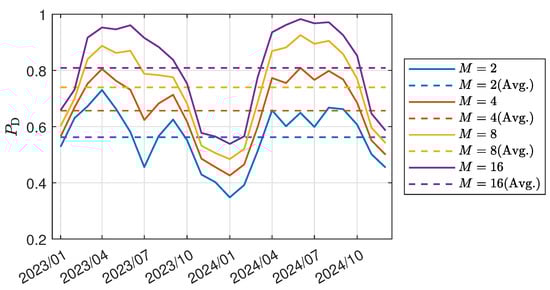
Figure 6.
Variation of IIA-SDT spoofing detection performance for each month in the year 2023–2024. The detection probability is calculated by first averaging DTEC data across azimuth range of 360° and elevation range of 15°–85° at each hourly epoch, then computing hourly detection probability with a window length of 5 based on hourly averaged DTEC value, and finally averaging all hourly results across all days within each month.
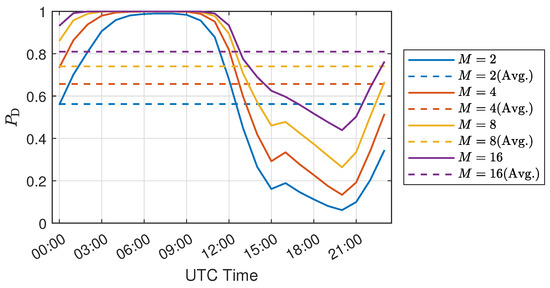
Figure 7.
Diurnal variation pattern of spoofing detection performance of IIA-SDT in the year 2023–2024. Similar to Figure 6, the detection probability is calculated by averaging DTEC data across azimuth range of 360° and elevation range of 15°–85° at each hourly epoch, then computing hourly detection probability with a window length of 5, and finally averaging hourly results over the two-year period.
Additionally, simulation results in Figure 6 and Figure 7 also suggest that the number of satellites participating in the detection, M, has a pronounced effect on the detector’s performance. In other words, due to the existence of IMB, more satellites generally lead to a greater difference in the distribution of detection statistics under the and hypotheses by contributing to the noncentrality parameter , resulting in stronger bias detection capabilities. When 8 satellites are available, the average detection performance across different months reaches about 75%, and it exceeds 80% when the number of satellites increases to 16.
3.2.2. Window Length
Figure 8 illustrates the average detection performance of IIA-SDT with various detection window lengths N and satellite count M in the form of receiver operating characteristic (ROC) curves. The simulation results indicate that, in addition to satellite count M, the average detection performance of IIA-SDT improves as the detection window length N increases. This phenomenon can be attributed to the fact that, due to the observation noise being approximated as white Gaussian noise, time-domain accumulation suppresses the influence of observation noise, thereby helping to reveal biases caused by spoofing. For example, with 16 fixed satellites, the detection performance depicted by purple curves with a window length of 10 approximates 90%, which is about 35% higher than that with a window length of 1 at .
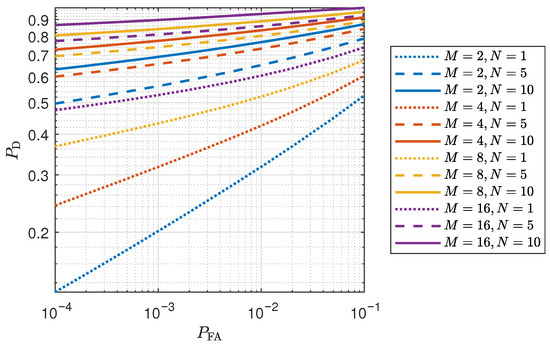
Figure 8.
Spoofing detection performance of IIA-SDT, averaged within 2023–2024, with various detection window lengths N and satellite counts M in the form of ROC curves.
4. Field Experiments
To evaluate the effectiveness and performance of the proposed method, a series of field experiments are conducted in this section. While spoofers can utilize various ionospheric models (e.g., Klobuchar, NeQuick), our experiments validate the proposed method using the Klobuchar model as a case study. Moreover, in scenarios where spoofers omit the ionospheric model entirely or disregard the differential signal delays between DF signals caused by the ionosphere, the resultant IMB of the spoofing signals becomes substantially larger, rendering them more susceptible to detection by IIA-SDT. Furthermore, the applicability of the proposed method is also assessed through the insights gained from the experimental results.
4.1. Data Collection
A total of five experimental datasets are collected as shown in Figure 9. First, authentic DF pseudo-range observations are collected on UTC 09:38, local time (Beijing time) 17:38, 6 January 2025, utilizing a DF BDS receiver connected to an outdoor GNSS antenna, which constitutes the non-spoofing dataset, ds1. Then, a GNSS simulator (SPIRENT GSS900) is set up to generate DF spoofing signals based on the Klobuchar model parameters and orbital data of that day [34]. Two spoofing positions are investigated: Beijing, China (BJ, N, E) and Jinan, China (JN, N, E). DF pseudo-range observations are extracted using the DF BDS receiver in these two FC spoofing cases (ds2, ds3). Finally, through post-processing, raw observations from ds1 and ds2(ds3) are aligned in time, and subsets of channels are selected from each to create the PC spoofing dataset, ds4(ds5). The detailed information of all datasets is shown in Table 2.
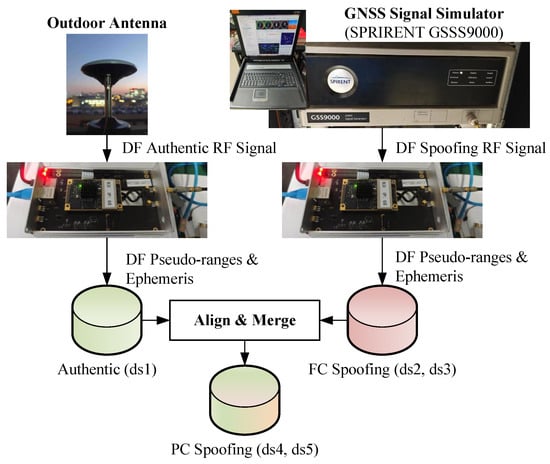
Figure 9.
Data collection using (1) an outdoor antenna, as the non-spoofing dataset (ds1); (2) a spoofer based on a SPIRENT simulator, as the FC spoofing datasets (ds2, ds3); (3) merged observations, as the PC spoofing datasets (ds4, ds5).
Table 2.
Experimental data collection settings.
4.2. IIA-SDT Experimental Results
In the following field experiments, parameters in Table 3 are used. The CODE’s one-day predicted ionospheric maps are used to obtain the ionospheric reference.
Table 3.
Experimental parameters.
4.2.1. Non-Spoofing Test Case
Figure 10a shows that the normalized GLRT-based IIA-SDT detection statistics in all detection windows in ds1 are less than 1, where is set according to the false alarm rate . There are no false alarms triggered, suggesting a robust performance in the non-spoofing case. Figure 10b depicts MLE estimates of normalized biases, , in one of the detection windows, supporting the detection result with near-zero and unbiased values across all channels. Figure 10c depicts the azimuth and elevation angles of satellites involved in this experiment, namely, sky plot, as complementary information.
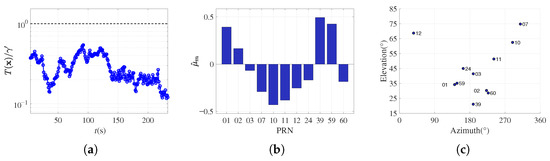
Figure 10.
Spoofing detection results in the non-spoofing case. (a) Normalized GLRT statistics across all detection windows in ds1 with black dotted line representing threshold and blue curves indicating test statistics; (b) MLE in a single detection window, sampled from ds1; (c) Sky plot.
4.2.2. Full-Channel Spoofing Test Cases
As depicted in Figure 11a,d, the normalized GLRT statistics exceed 1 in all detection windows within both FC spoofing cases (ds2, ds3), achieving an ideal detection with no missed detection. The MLE estimations of normalized TEC bias, , within a single detection window shown in Figure 11b,e support these ideal detection results: the TEC values computed by the spoofer with the Klobuchar model exhibit an IMB of 0.42–1.72 STD in ds2, and an IMB of 0.93–1.24 STD in ds3 on each signal propagation path. The existence of , which is mainly contributed by IMB in FC cases, enables IIA-SDT to detect simulator-based FC spoofing. Specifically, if one focuses on the satellites with significant deviations in Figure 11b—PRN 06, 09, 16, and 24—it may be observed that they are all satellites located south and with lower elevation angles, as shown in Figure 11c. This result is consistent with Figure 5, which indicates that for the specific mid-latitude location, satellites in that direction usually bring more significant IMBs.
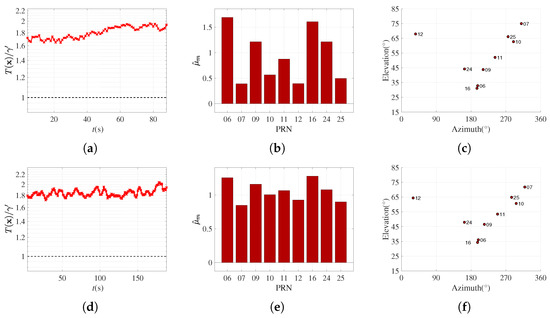
Figure 11.
Spoofing detection results in the presence of FC spoofing: (a,d) normalized GLRT statistics in all detection windows within ds2(BJ) and ds3(JN), respectively, with black dotted line representing threshold and red curves indicating test statistics; (b,e) MLE in a single detection window, each sampled from ds2 and ds3, respectively; (c,f) sky plot of ds2/ds3.
4.2.3. Partial-Channel Spoofing Test Cases
As depicted in Figure 12a,c, the normalized GLRT statistics exceed 1 in all detection windows within both PC spoofing test cases (ds4, ds5), with no missed detection. This demonstrates the robust spoofing detection capability of IIA-SDT when a spoofer controls only a subset of channels to maintain power concealment and causes deviations in the user’s positioning result, ensured by the combined effect of PRB and IMB.
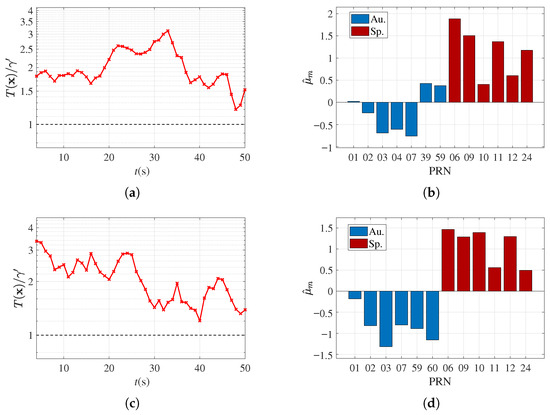
Figure 12.
Spoofing detection results in the presence of PC spoofing: (a,c) normalized GLRT statistics across all detection windows in PC spoofing datasets ds4(BJ) and ds5(JN), respectively, with black dotted line representing threshold and red curves indicating test statistics; (b,d) MLE in a single detection window, each sampled from ds4 and ds5, respectively.
For ds4 (∼ northward positioning deviation), Figure 12b shows that for authentic channels remain near zero, while the spoofed channels exhibit even more positive biases compared to the corresponding FC case (Figure 11b). These positive biases can be attributed to PRB: the northward positioning deviation moves the IPP of spoofing signals away from its preset position to a higher-latitude region, causing the spoofer to further overestimate the TEC, resulting in greater .
For ds5 (∼ southward positioning deviation), Figure 12d shows that for authentic channels are influenced by a negative PRB. The southward deviation brings the IPP closer to the equator, leading the GIM reference to overestimate TEC, resulting in a negative PRB for authentic signals. However, for the spoofed channels, the influence of PRB is negligible here since the positioning results do not deviate significantly from the preset position in latitude (∼ northward).
4.3. Comparison with Existing Methods
In this section, Direct Position Comparison (DPC) and multi-frequency Receiver Autonomous Integrity Monitoring (RAIM) are selected as representative conventional methods for performance comparison with IIA-SDT.
Position solutions were computed using BDS B1I and B3I pseudo-range observations from each of the five datasets listed in Table 2. Figure 13 illustrates the results of single-frequency positioning using BDS B1I and B3I signals, as well as the average horizontal deviation between them in the east–north coordinate system centered on the mean of the B1I positioning results. Although the spoofing scenarios in (d) and (e) are static, unintended user motion appears as an artifact of PC spoofing. This occurs because the coexistence of authentic and spoofed signals breaks the consistency of satellite observations. As a result, the computed position deviates from both the true position and the spoofer’s preset trajectory, manifesting as apparent motion. Nonetheless, across all five test cases, the mean horizontal positioning deviations between the B1I and B3I solutions remain at the meter or sub-meter level. These findings indicate that the DPC method struggles to counter spoofing attacks that maintain inter-frequency consistency, such as the PC and FC dual-frequency spoofing cases considered here.
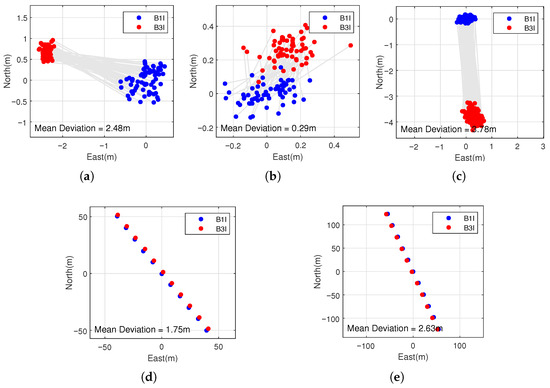
Figure 13.
Comparison of BDS B1I positioning results and BDS B3I positioning results for DPC: (a) non-spoofing (ds1), (b) FC spoofing, BJ (ds2), (c) FC spoofing, JN (ds3), (d) PC spoofing, BJ (ds4), and (e) PC spoofing, JN (ds5).
The RAIM detection results are presented in Figure 14, with the false alarm rate set to . As shown, RAIM fails in the full-channel spoofing scenarios, where all detection statistics remain below the threshold, resulting in missed detections. In contrast, RAIM successfully detects spoofing in the partial-channel cases (ds3 and ds4), which is consistent with its theoretical performance bounds.
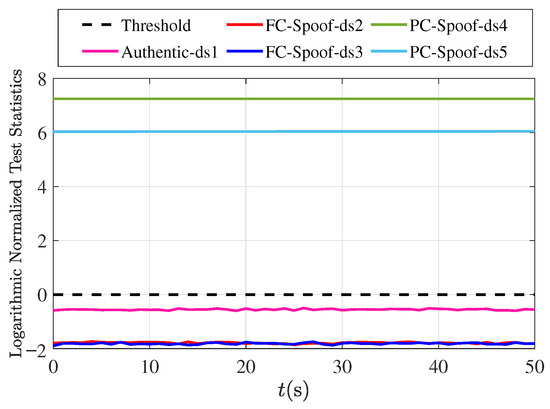
Figure 14.
Detection results of RAIM methods in five experiment scenarios.
In summary, IIA-SDT is effective across all spoofing scenarios tested in our experiments, outperforming both DPC and RAIM. The proposed method not only addresses the limitations of conventional DF anti-spoofing techniques in detecting attacks with inter-frequency navigation-level consistency but also provides a reliable, physics-based solution for spoofing detection in real-world GNSS applications.
5. Discussion and Conclusions
This section discusses the main strengths and limitations of the proposed IIA-SDT method, and then summarizes the overall contributions of this work.
5.1. Discussion
The analysis and experiment verification demonstrate that IIA-SDT can provide reliable spoofing detection across a range of scenarios. Its main strengths can be summarized as follows.
- Universal Applicability. IIA-SDT does not assume SF spoofing. IIA-SDT effectively identifies both FC and PC DF spoofing attacks, regardless of the preset location or the user’s positioning deviation. This is achieved by leveraging the inherent IMB of offline models like the Klobuchar model, which is widely adopted by spoofers, and the PRB induced by positioning deviation when mixed authentic and spoofed signals are used. In addition, the method is system-independent and can be directly applied to BDS, GPS, Galileo, and other dual-frequency constellations.
- Physical-level Verification. Unlike DPC and RAIM, which are based on position-level consistency checking between two frequencies, IIA-SDT exploits the discrepancies between the spoofed TEC values and reliable external TEC references such as IGS GIM, which provide reliable physical TEC values. This physics-based verification enables IIA-SDT to detect spoofing attacks even with inter-frequency navigation-information-level consistency.
Despite these advantages, several limitations about spoofing scenarios and data dependence must be noted.
- Vulnerability to advanced spoofers. If attackers could replicate real-time ionospheric information with high fidelity in a full-channel attack, IIA-SDT, and existing methods like DPC and RAIM, would all lose effectiveness. However, the feasibility of such attacks is limited in practice. Accessing and applying real-time GIM data requires continuous internet connectivity, additional hardware/software modules, and low-latency data processing. These factors substantially increase the cost and complexity of the spoofer. And for dynamic scenarios such as UAVs or vehicles, it is particularly challenging to achieve full-channel synchronization with authentic signals while simultaneously injecting realistic ionospheric variations. However, if attackers transmit extreme high-power spoofing signals that fully suppress authentic signals—effectively equivalent to full-channel spoofing—IIA-SDT also becomes ineffective when real-time ionospheric information is replicated. In such spoofing cases, further anti-spoofing techniques based on direction-of-arrival (DOA) measurements [35,36] or assistance from Inertial Navigation Systems (INSs) [37,38], etc., become essential.
- Dependence on external real-time ionospheric data. IIA-SDT relies on access to external GIM services, and temporary loss of connectivity may reduce its effectiveness. To mitigate this, practical deployment could include backup measures such as local caching of recent GIM products, fusing data from multiple providers, or employing lightweight prediction models to extrapolate short-term ionospheric variations. Future work may also explore non-networked solutions such as using broadcast ionospheric models as local prediction schemes as auxiliary references.
5.2. Summary and Conclusions
The paper presents the Ionospheric Information-Assisted Spoofing Detection Technique (IIA-SDT) as a robust solution for GNSS spoofing detection. By exploiting discrepancies between locally measured ionospheric delays and reliable external references, which are typically contributed by IMB caused by the biased offline model often used by spoofers and PRB caused by unintended position deviation in PC spoofing, IIA-SDT addresses the critical limitations of conventional DF anti-spoofing methods in detecting spoofing attacks with inter-frequency consistency. Using the historical ionosphere data in 2023–2024, we investigate the average level and temporal variation of IMB, and the spatial variation of PRB. Furthermore, the average detection performance of IIA-SDT is analyzed using simulation experiments. Finally, its effectiveness is verified in field experiments, with both FC and PC spoofing cases included. Compared with existing methods such as DPC and RAIM, IIA-SDT introduces a novel physical-layer consistency check. While its effectiveness may degrade against advanced full-channel spoofers or in the absence of external ionospheric data, IIA-SDT substantially improves resilience against realistic spoofing threats and is best deployed as part of a multi-layered defense framework.
Author Contributions
Conceptualization, Z.W., X.X., Y.M., Z.Z., and H.L.; methodology, Z.W. and X.X.; software, Z.W.; validation, Z.W.; formal analysis, Z.W.; investigation, Z.W. and X.X.; resources, H.F., Y.X., and H.L.; data curation, Z.W.; writing—original draft preparation, Z.W. and X.X.; writing—review and editing, Z.W., X.X., Y.M., Z.Z., and H.L.; visualization, Z.W.; supervision, H.L.; project administration, H.F., Y.X., and H.L.; funding acquisition, H.F., Y.X., and H.L. All authors have read and agreed to the published version of the manuscript.
Funding
This work was supported by the Science and Technology Project of State Grid Corporation of China (Research and Application of Key Technologies for Autonomous and Controllable Power Beidou High Reliable Space-Time Service, No. SGIT0000XTJS2400242).
Data Availability Statement
The original contributions presented in this study are included in the article. Further inquiries can be directed to the corresponding author.
Conflicts of Interest
Author Haixuan Fu was employed by the company State Grid Information & Telecommunication Industry Group Co., Ltd. Author Yuhao Xiao was employed by the company State Grid Sichuan Electric Power Company Information & Telecommunication Company. The remaining authors declare that the research was conducted in the absence of any commercial or financial relationships that could be construed as a potential conflict of interest.
List of Abbreviations
| Abbreviation | Full Form |
| BDS | BeiDou Satellite System |
| C/N0 | Carrier-to-Noise Ratio |
| DF | Dual Frequency |
| DPC | Direct Position Comparison |
| DOA | Direction of Arrival |
| FC | Full Channel |
| GIM | Global Ionospheric Map |
| GLRT | Generalized Likelihood Ratio Test |
| GNSS | Global Navigation Satellite System |
| GPS | Global Positioning System |
| IGS | International GNSS Service |
| IMB | Ionospheric Model Bias |
| INS | Inertial Navigation System |
| IPP | Ionospheric Pierce Point |
| IIA-SDT | Ionospheric Information-Assisted Spoofing Detection Technique |
| PC | Partial Channel |
| PVT | Position, Velocity, and Timing |
| RAIM | Receiver Autonomous Integrity Monitoring |
| RMSE | Root Mean Square Error |
| SF | Single-Frequency |
| SH | Spherical Harmonic |
| SFB | Single-Frequency Bias |
| TEC | Total Electron Content |
| TECU | Total Electron Content Unit |
| VTEC | Vertical Total Electron Content |
References
- Meng, L.; Yang, L.; Yang, W.; Zhang, L. A Survey of GNSS Spoofing and Anti-Spoofing Technology. Remote Sens. 2022, 14, 4826. [Google Scholar] [CrossRef]
- Wang, K.; Chen, S.; Pan, A. Time and Position Spoofng with Open Source Projects. Black Hat Eur. 2015, 148, 1–8. [Google Scholar]
- Zeng, K.; Liu, S.; Shu, Y.; Wang, D.; Li, H.; Dou, Y.; Wang, G.; Yang, Y. All Your GPS Are Belong To Us: Towards Stealthy Manipulation of Road Navigation Systems. In Proceedings of the 27th USENIX Security Symposium (USENIX Security 18), Baltimore, MD, USA, 15–17 August 2018; pp. 1527–1544. [Google Scholar]
- Zheng, X.; Sun, H. Hijacking Unmanned Aerial Vehicle by Exploiting Civil GPS Vulnerabilities Using Software-defined Radio. Sens. Mater. 2020, 32, 2729. [Google Scholar] [CrossRef]
- Mit, R.; Zangvil, Y.; Katalan, D. Analyzing Tesla’s Level 2 Autonomous Driving System Under Different GNSS Spoofing Scenarios and Implementing Connected Services for Authentication and Reliability of GNSS Data. In Proceedings of the 33rd International Technical Meeting of the Satellite Division of The Institute of Navigation (ION GNSS+ 2020), Virtual Event, 21–25 September 2020; pp. 621–646, ISSN 2331-5954. [Google Scholar] [CrossRef]
- Sun, Y. Autonomous Integrity Monitoring for Relative Navigation of Multiple Unmanned Aerial Vehicles. Remote Sens. 2021, 13, 1483. [Google Scholar] [CrossRef]
- Russian Space Systems. GLONASS Interface Control Document: Code Division Multiple Access Open Service Navigation Signal in L2 Frequency Band. 2016. Available online: https://russianspacesystems.ru/Business/ICD-GLONASS-CDMA-L2.-Edition-1.0-2016.pdf (accessed on 26 September 2025).
- China Satellite Navigation Office. BeiDou Navigation Satellite System Signal in Space Interface Control Document (v3.0); China Satellite Navigation Office: Beijing, China, 2019. [Google Scholar]
- Anthony, R.T.; Kerns, R.M. NAVSTAR GPS Space Segment/Navigation User Segment Interfaces (IS-GPS-200). 2022. Available online: https://www.navcen.uscg.gov/sites/default/files/pdf/gps/IS-GPS-200N.pdf (accessed on 22 August 2022).
- European GNSS Supervisory Authority. Galileo Open Service: Signal in Space Interface Control Document (OS SIS ICD): Issue 2.1; Publications Office: Luxembourg, 2023. [Google Scholar]
- Psiaki, M.L.; Humphreys, T.E. GNSS Spoofing and Detection. Proc. IEEE 2016, 104, 1258–1270. [Google Scholar] [CrossRef]
- Sathyamoorthy, D.; Kazmar, A.F.A.; Rozlan, A.S.M.; Ghazali, M.G.A.; Najib, N.H.S.M. Evaluation of The Effect of Spoofing on Dual-Frequency Global Navigation Satellite System (GNSS). J. Eng. Technol. Appl. Phys. 2024, 6, 100–107. [Google Scholar] [CrossRef]
- Wang, X.; Yang, J.; Huang, M. A Deep Learning GNSS Spoofing and Jamming Detection Method with Dual-Frequency C/N0 Heatmap. Meas. Sci. Technol. 2024, 35, 126303. [Google Scholar] [CrossRef]
- Wen, H.; Huang, P.Y.R.; Dyer, J.; Archinal, A.; Fagan, J. Countermeasures for GPS Signal Spoofing. In Proceedings of the 18th International Technical Meeting of the Satellite Division of the Institute of Navigation (ION GNSS 2005), Long Beach, CA, USA, 13–16 September 2005; pp. 1285–1290. [Google Scholar]
- Artaud, G.; de Latour, A.; Dantepal, J.; Ries, L.; Maury, N.; Denis, J.C.; Senant, E.; Bany, T. A New GNSS Multi Constellation Simulator: NAVYS. In Proceedings of the 2010 5th ESA Workshop on Satellite Navigation Technologies and European Workshop on GNSS Signals and Signal Processing (NAVITEC), Noordwijk, The Netherlands, 8–10 December 2010; pp. 1–8, ISSN 2325-5455. [Google Scholar] [CrossRef]
- Bartunkova, I.; Eissfeller, B. Broadband Multi-Frequency GNSS Signal Simulation with GPU. In Proceedings of the 2016 IEEE/ION Position, Location and Navigation Symposium (PLANS), Savannah, GA, USA, 11–14 April 2016; pp. 477–490, ISSN 2153-3598. [Google Scholar] [CrossRef]
- Parkinson, B.W.; Axelrad, P. Autonomous GPS Integrity Monitoring Using the Pseudorange Residual. Navigation 1988, 35, 255–274. [Google Scholar] [CrossRef]
- Guo, J.; Lu, M.; Cui, X.; Feng, Z. A New RAIM Algorithm for Triple-Frequency GNSS Receivers. In Proceedings of the 2011 International Technical Meeting of the Institute of Navigation, San Diego, CA, USA, 24–26 January 2011; pp. 271–278. [Google Scholar]
- Islam, S.; Bhuiyan, M.Z.H.; Liaquat, M.; Pääkkönen, I.; Kaasalainen, S. An Open GNSS Spoofing Data Repository: Characterization and Impact Analysis with FGI-GSRx Open-Source Software-Defined Receiver. GPS Solut. 2024, 28, 176. [Google Scholar] [CrossRef]
- Hernández-Pajares, M.; Juan, J.M.; Sanz, J.; Aragón-Àngel, A.; García-Rigo, A.; Salazar, D.; Escudero, M. The Ionosphere: Effects, GPS Modeling and the Benefits for Space Geodetic Techniques. J. Geod. 2011, 85, 887–907. [Google Scholar] [CrossRef]
- Cheng, J.; Jiang, C.; Jia, C.; Ding, J.; Li, H.; Qi, B. Evaluation of Ionospheric Delay Extraction Model Using Dual-Frequency Multisystem Observations. IEEE Sens. J. 2023, 23, 16197–16209. [Google Scholar] [CrossRef]
- Mannucci, A.J.; Wilson, B.D.; Yuan, D.N.; Ho, C.H.; Lindqwister, U.J.; Runge, T.F. A Global Mapping Technique for GPS-Derived Ionospheric Total Electron Content Measurements. Radio Sci. 1998, 33, 565–582. [Google Scholar] [CrossRef]
- Villiger, A.; Dach, R. International GNSS Service: Technical Report 2018; Technical report; IGS Central Bureau, Bern Open Publishing: Bern, Switzerland, 2019; ISBN 9783906813929. ISSN 2297-8526. [Google Scholar]
- Hernández-Pajares, M.; Juan, J.M.; Sanz, J.; Orus, R.; Garcia-Rigo, A.; Feltens, J.; Komjathy, A.; Schaer, S.C.; Krankowski, A. The IGS VTEC Maps: A Reliable Source of Ionospheric Information Since 1998. J. Geod. 2009, 83, 263–275. [Google Scholar] [CrossRef]
- Klobuchar, J.A. Ionospheric Time-Delay Algorithm for Single-Frequency GPS Users. IEEE Trans. Aerosp. Electron. Syst. 1987, AES-23, 325–331. [Google Scholar] [CrossRef]
- Radicella, S.M. The NeQuick Model Genesis, Uses and Evolution. Ann. Geophys. 2009, 52, 417–422. [Google Scholar] [CrossRef]
- Wang, Q.; Li, H.; Lu, M. Residual Vector Analysis Method (RVAM) for Evaluating the Performance of GNSS Part of Channels’ Replay Attacks. In Proceedings of the 2013 IEEE China Summit and International Conference on Signal and Information Processing, Beijing, China, 6–10 July 2013; pp. 561–565. [Google Scholar] [CrossRef]
- Kaplan, E.D.; Hegarty, C. Understanding GPS/GNSS: Principles and Applications; Artech House: Norwood, MA, USA, 2017. [Google Scholar]
- Takuji, E. Software-Defined GPS Signal Simulator. Contribute to osqzss/gps-sdr-sim Development by Creating an Account on GitHub. 2015. Available online: https://github.com/osqzss/gps-sdr-sim (accessed on 1 November 2015).
- Sarkar, M.; Panjwani, B. NavIC tri-band (L1, L5, S) SPS simulator. GPS Solut. 2024, 29, 7. [Google Scholar] [CrossRef]
- Wang, N.; Li, Z.; Yuan, Y.; Huo, X. BeiDou Global Ionospheric Delay Correction Model (BDGIM): Performance Analysis During Different Levels of Solar Conditions. GPS Solut. 2021, 25, 97. [Google Scholar] [CrossRef]
- Schaer, S.; Beutler, G.; Rothacher, M. Mapping and Predicting the Ionosphere. In Proceedings of the IGS AC Workshop, Darmstadt, Germany, 9–11 February 1998. [Google Scholar]
- Kay, S.M. Fundamentals of Statistical Signal Processing; PTR Prentice-Hall: Englewood Cliffs, NJ, USA, 1993. [Google Scholar]
- Spirent Communications Plc. SimGen Software User Manual: Software for the Spirent Range of Satellite Navigation Simulator Products, DGP00686AAA, issue 5-02 SR02, 2016. Available online: https://67fff93bef5e27578656-8f1778939e817ae59616c14c8e4da60d.ssl.cf1.rackcdn.com/Manuals/SimGEN/DGP00686AAA%20Issue%206-00%20SimGEN%20Software%20User%20Manual.pdf (accessed on 29 September 2016).
- Zhao, Y.; Shen, F.; Qi, B.; Meng, Z. DOA Estimation under GNSS Spoofing Attacks Using a Coprime Array: From a Sparse Reconstruction Viewpoint. Remote Sens. 2022, 14, 5944. [Google Scholar] [CrossRef]
- Wang, H.; Li, H.; Zhong, M.; Lu, M. A Space-Time-Ambiguity Decomposition Method for DOA Estimation Enhancing Anti-Spoofing Via Rotating Dual Antennas. IEEE Trans. Aerosp. Electron. Syst. 2024, 60, 7643–7662. [Google Scholar] [CrossRef]
- Ma, Y.; Li, H.; Lu, M. Spoofing Detection Technologies for GNSS/Multi-sensor Fusion Positioning. J. Navig. Position 2024, 12, 114–122. [Google Scholar]
- Zhang, C.; Wang, D.; Wu, J. Two-Dimensional Directions Determination for GNSS Spoofing Source Based on MEMS-Based Dual-GNSS/INS Integration. Remote Sens. 2024, 16, 4568. [Google Scholar] [CrossRef]
Disclaimer/Publisher’s Note: The statements, opinions and data contained in all publications are solely those of the individual author(s) and contributor(s) and not of MDPI and/or the editor(s). MDPI and/or the editor(s) disclaim responsibility for any injury to people or property resulting from any ideas, methods, instructions or products referred to in the content. |
© 2025 by the authors. Licensee MDPI, Basel, Switzerland. This article is an open access article distributed under the terms and conditions of the Creative Commons Attribution (CC BY) license (https://creativecommons.org/licenses/by/4.0/).