1. Introduction
In recent years, advances in Artificial Intelligence (AI), and especially in the field of Deep Learning (DL), have significantly impacted various sectors. One of the areas where these innovations have been particularly relevant is biometrics, with a prominent focus on face recognition. Based on DL models, these systems allow current solutions to carry out the complex tasks of person identification and verification, maintaining a high level of accuracy even under adverse conditions. Thanks to its high accuracy, face recognition has become a fundamental component in applications like access control for company premises and airport boarding lounges.
Beyond its influential role in key sectors, face recognition represents a booming technology. According to [
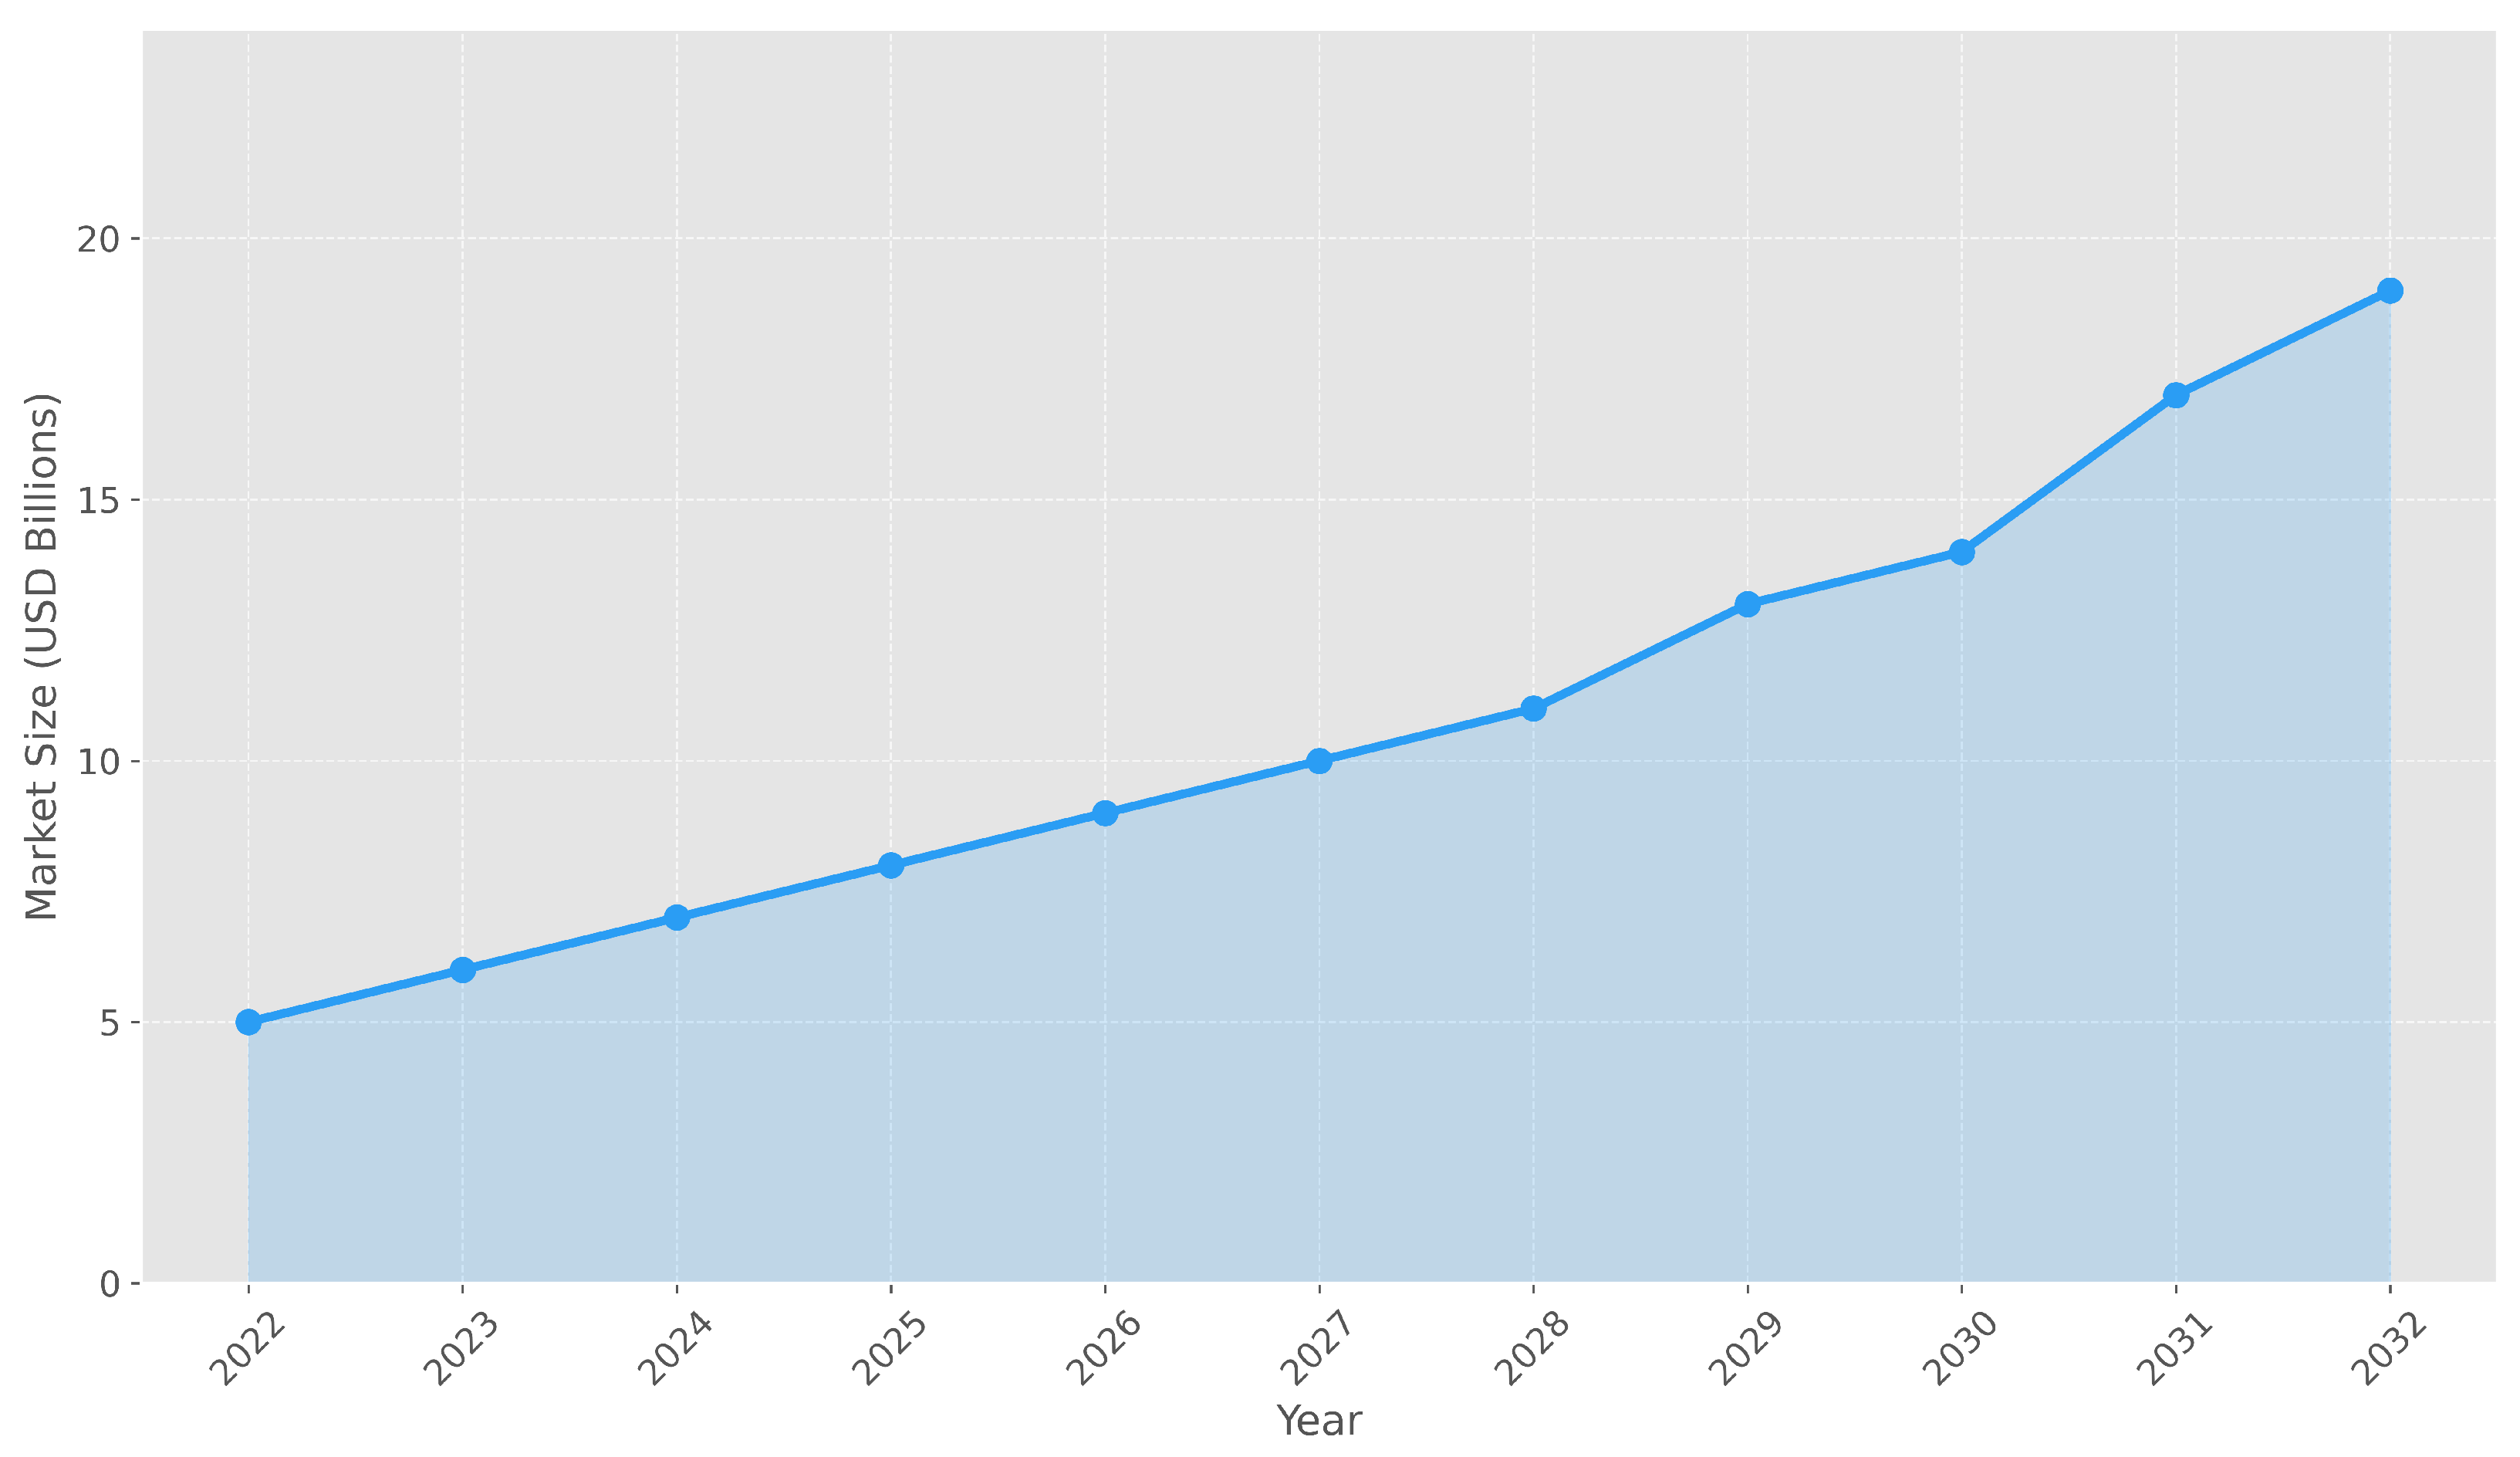
1], its market revenue demonstrates a consistently growing trend, with an estimated Compound Annual Growth Rate (CAGR) of approximately 14% over the forecast horizon. Initiating at USD 5 billion in 2022, the market is projected to expand to approximately USD 9 billion by 2026 and exceed USD 13 billion by 2029. As technological maturation progresses, revenue streams are expected to increase further, reaching USD 17 billion by 2031 and USD 19 billion by 2032. This growth trajectory is illustrated in
Figure 1.
This rapid market growth underscores the growing reliance on face recognition systems across diverse sectors. However, despite their widespread adoption, current systems continue to encounter significant technical challenges when implemented in real-world scenarios. In these cases, most of these systems are implemented as Closed-Set Recognition (CSR) models and trained on a predefined set of labeled face images corresponding to known identities. Under this paradigm, the models are designed to assign each input face to one of the known identities, operating under the assumption that all faces to be observed during testing are part of the training set. However, in many real-world scenarios, it is common for the system to encounter people who were not involved during training. This situation, formerly known as Open-Set Recognition (OSR) [
2,
3], requires not only the correct identification of known identities but also the ability to detect unknown faces.
Furthermore, face recognition systems have traditionally relied on Convolutional Neural Networks (CNNs). However, due to their inherent limitations in capturing long-range dependencies and global context, recent research has explored alternative architectures with improved capabilities for modeling global representations. Among these, the Vision Transformer (ViT) [
4], introduced in 2020, has garnered significant interest within the computer vision community, as it captures global relationships between different parts of an image rather than focusing solely on local patterns (as CNNs do).
In light of the above, the present study conducts a comparative analysis of CNN and ViT architectures for face recognition in OSR scenarios. The main objective is to compare the performance of both architectures in scenarios that require accurate facial recognition from known identities and the detection of unknown faces with high precision.
The rest of the document is structured as follows:
Section 2 presents an overview of CNN, ViT, and OSR.
Section 3 reviews relevant existing literature in the domain of face recognition.
Section 4 and
Section 5, respectively, describe the models selected for comparison in this study and detail the experimental methodology employed.
Section 6 offers a discussion of the results, along with an in-depth analysis, before finally,
Section 7 summarizes the key conclusions.
2. Background
This section provides an overview of CNNs and ViTs, emphasizing their main features and suitability for biometric face recognition. Furthermore, the concept of OSR is introduced, as is the OpenMax algorithm used in this study to address the associated challenges.
2.1. Convolutional Neural Networks
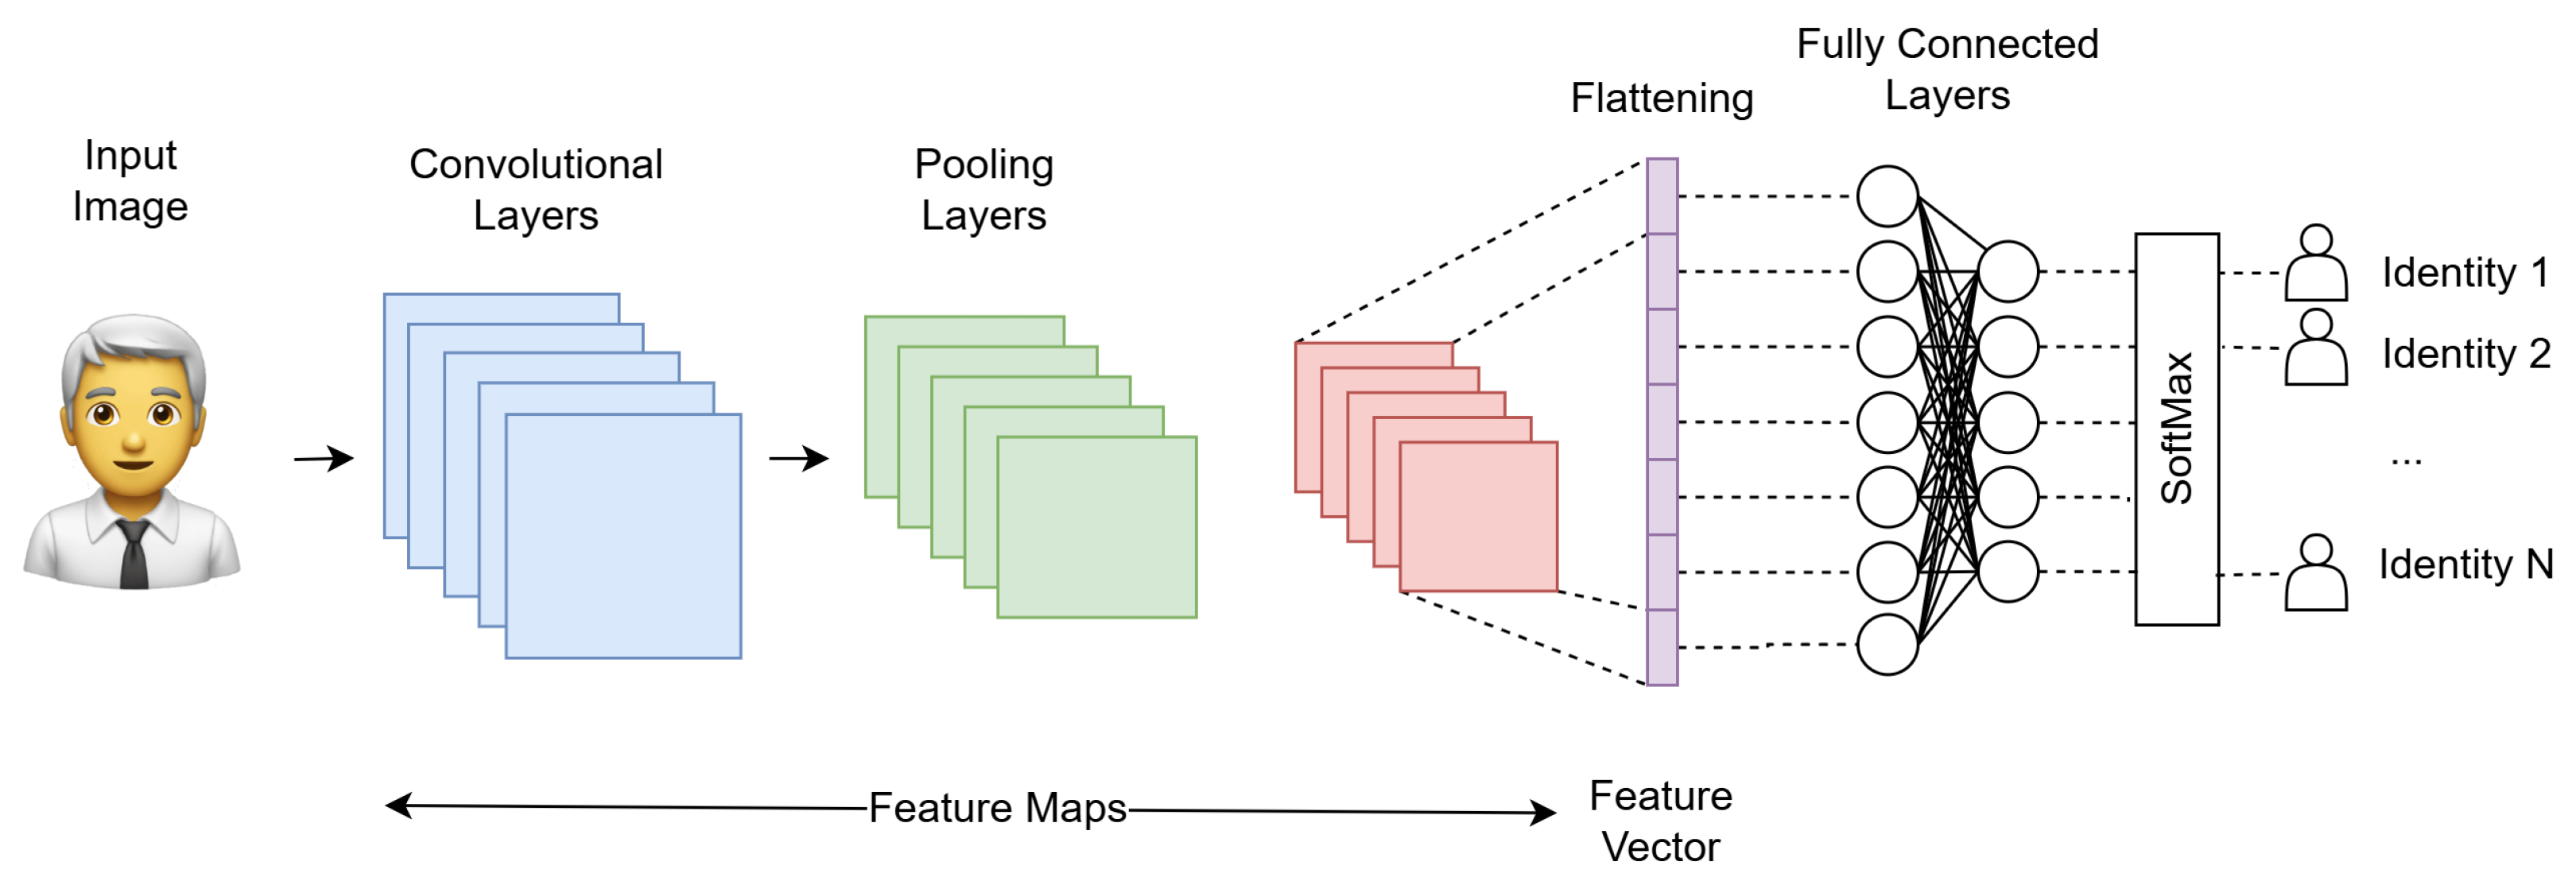
CNNs are a type of DL architecture commonly utilized in computer vision applications. These networks operate through a sequence of layers that apply filters, also known as kernels, to input images [
5], progressively extracting features ranging from basic elements such as edges, colors, and gradients to more complex, high-level representations that can distinguish specific objects or categories. The initial convolutional layers focus on feature extraction by scanning the image with filters, while subsequent pooling layers reduce the spatial dimensions of the data, emphasizing the most relevant features [
6]. The final steps involve flattening the data and passing it through fully connected layers to perform the classification task. An overview of a typical CNN architecture for face recognition is illustrated in
Figure 2.
Despite their widespread success, CNNs have certain limitations. According to [
7], a primary concern is their lack of interpretability, as these models often operate as black boxes with limited transparency regarding their decision-making processes. Additionally, CNNs are susceptible to domain shift, which can lead to performance deterioration when applied to data that differs from the original training set.
2.2. Vision Transformers
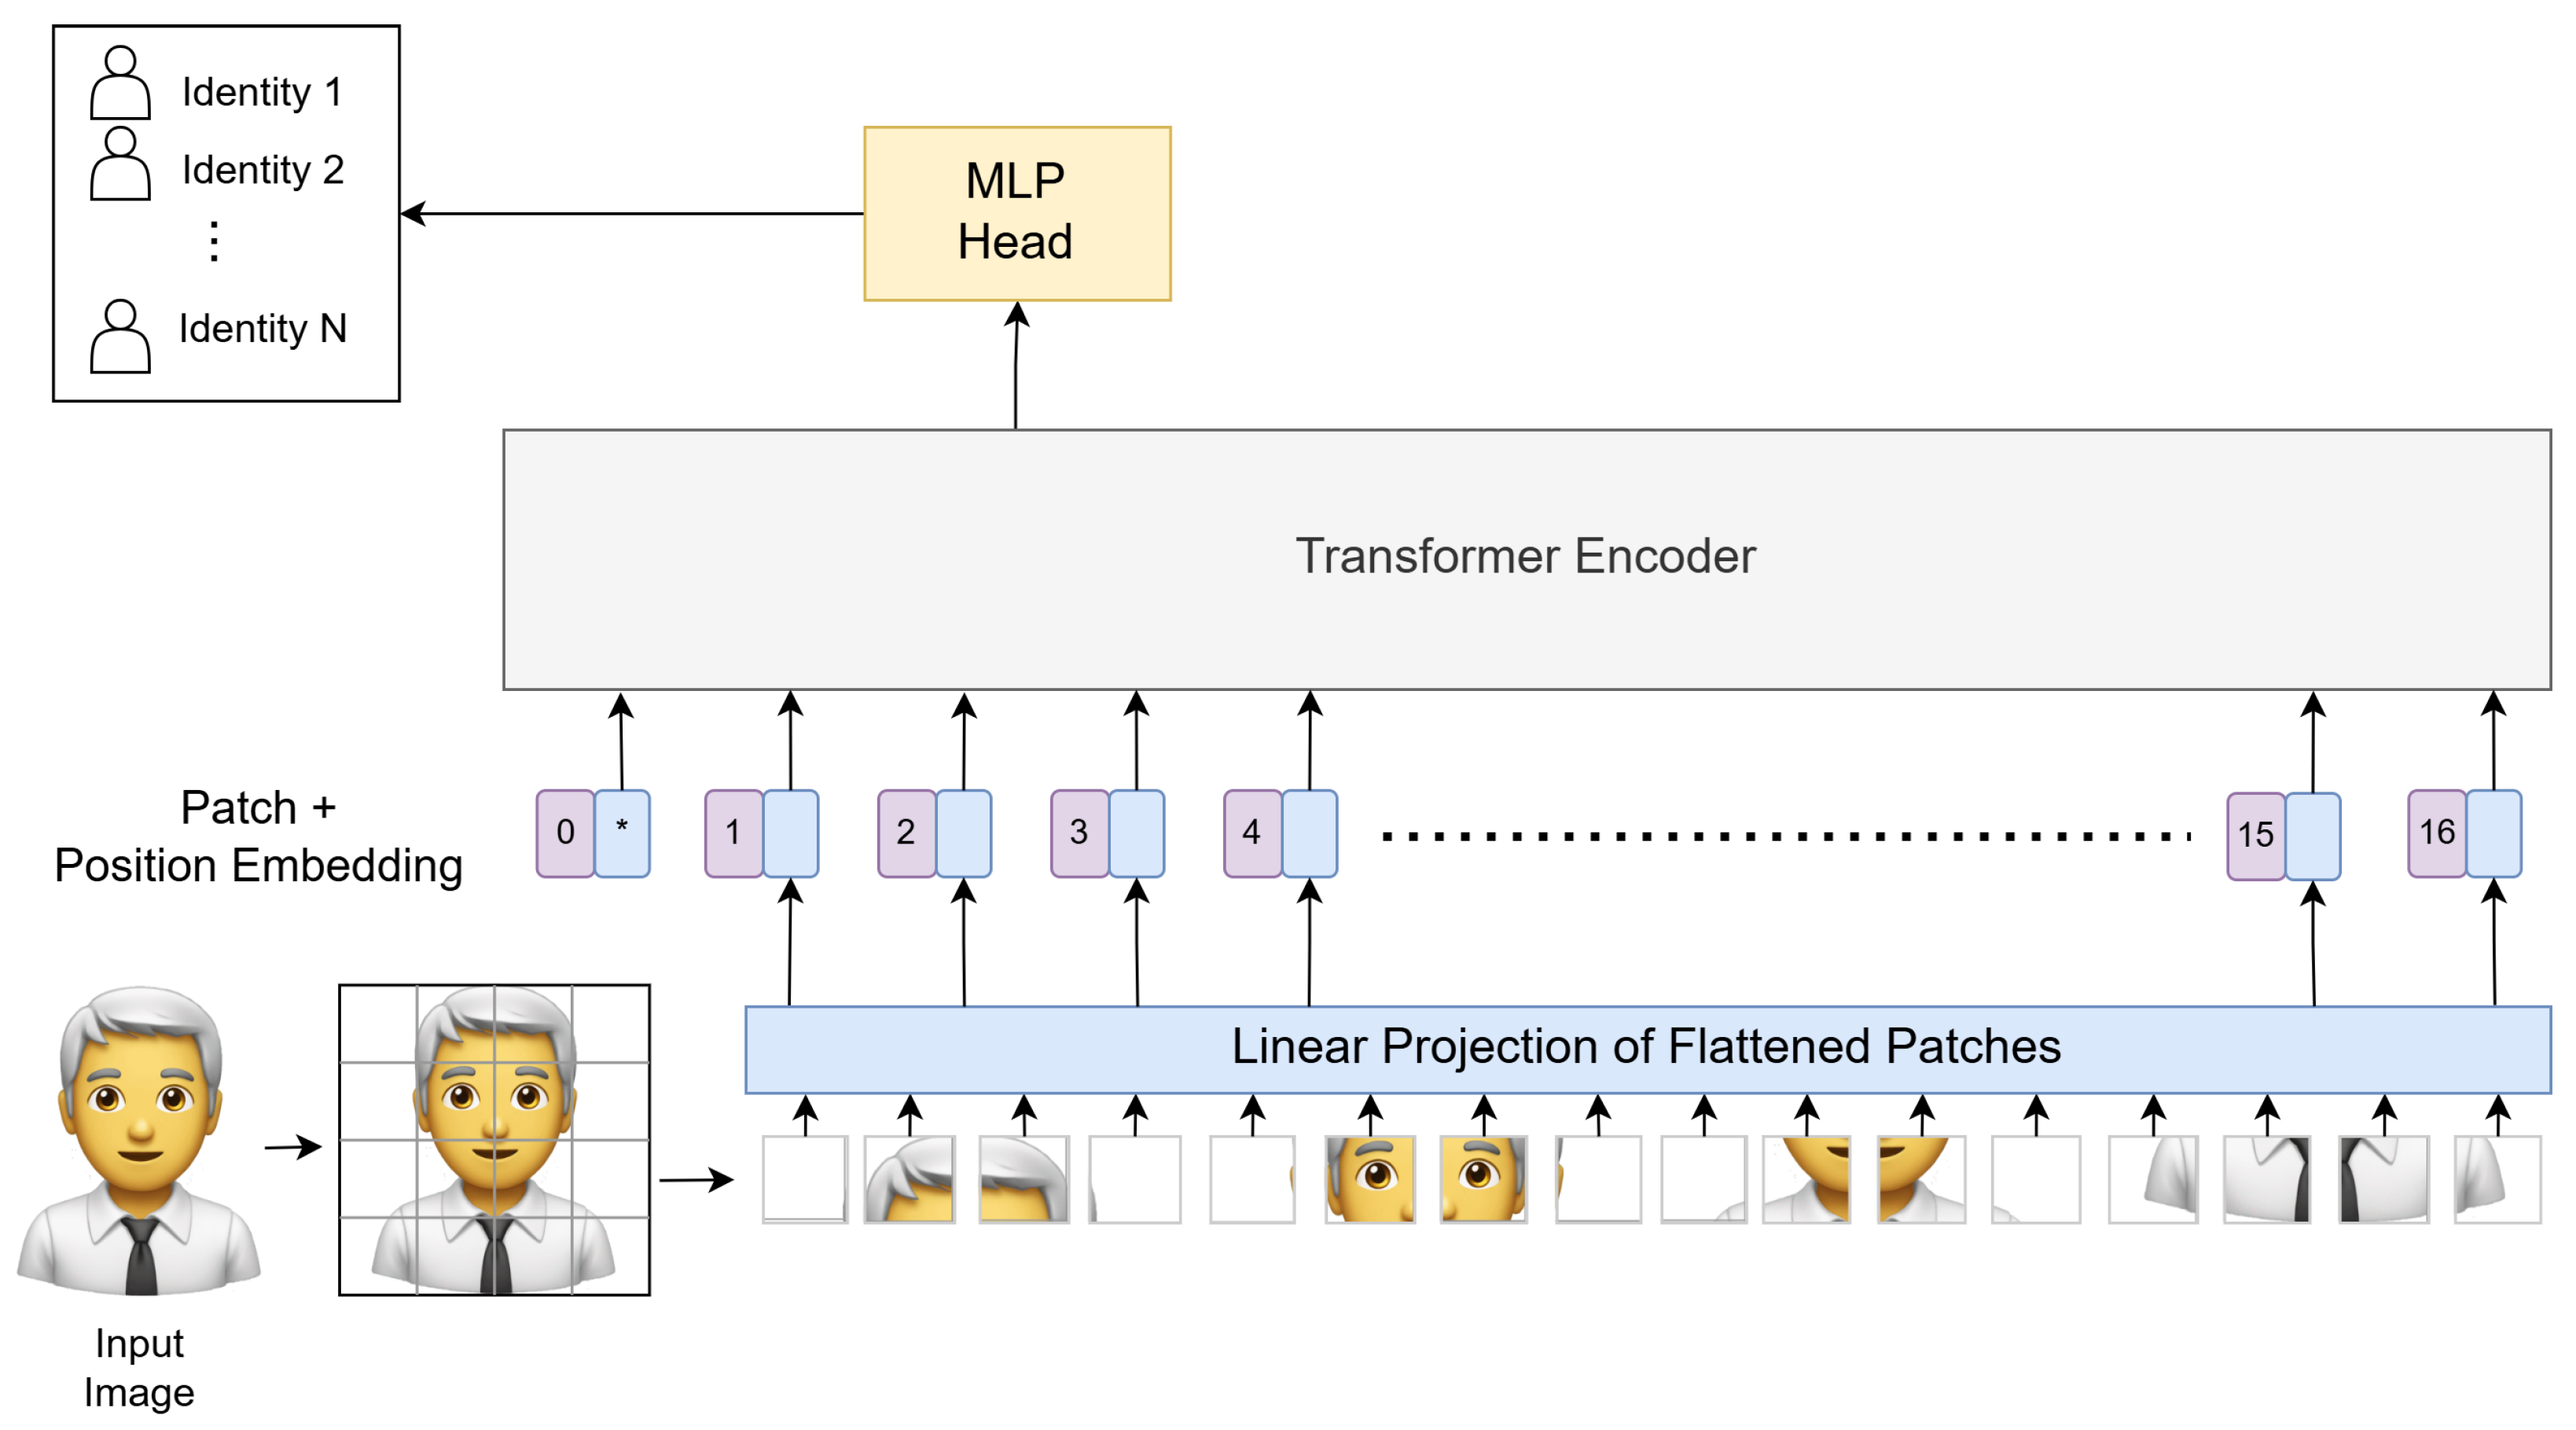
ViTs employ an entirely different methodology for image processing, dividing them into smaller patches, which are then flattened and converted into a sequence of tokens through linear projection. These tokens are subsequently processed through multiple transformer encoder layers, which are effective at capturing relationships across different image regions. This is achieved via the multi-head self-attention mechanism [
5].
Figure 3 provides a visual representation of the ViT architecture for face recognition.
As reported by [
7], ViTs have achieved state-of-the-art performance on several benchmark datasets, demonstrating excellent results on large-scale datasets such as ImageNet-21k [
8] and JFT-300M [
9] and outperforming many CNNs in terms of accuracy. For example, ViT has achieved accuracies of 88.55% on ImageNet and 94.55% on CIFAR-100 [
4].
Nevertheless, it is important to consider some of the limitations associated with ViTs. They generally require larger training datasets compared to CNNs and tend to demand higher computational resources. Moreover, as a relatively newer architecture, there is less established knowledge and fewer best practices available for their implementation compared to CNNs [
7].
2.3. Theoretical Analysis: Convolutional Neural Networks vs. Vision Transformers
Building upon the CNN and ViT architectures discussed in previous sections, the primary distinction between these models lies in their methods of processing spatial information within images. CNNs perform local, hierarchical analysis through convolutional layers, progressively extracting increasingly complex features from small, contiguous regions. Conversely, ViTs adopt a global processing approach by dividing images into patches and treating them as sequences of tokens. This methodology enables ViTs to model long-range dependencies across the image, overcoming the limitations inherent to local CNN operations.
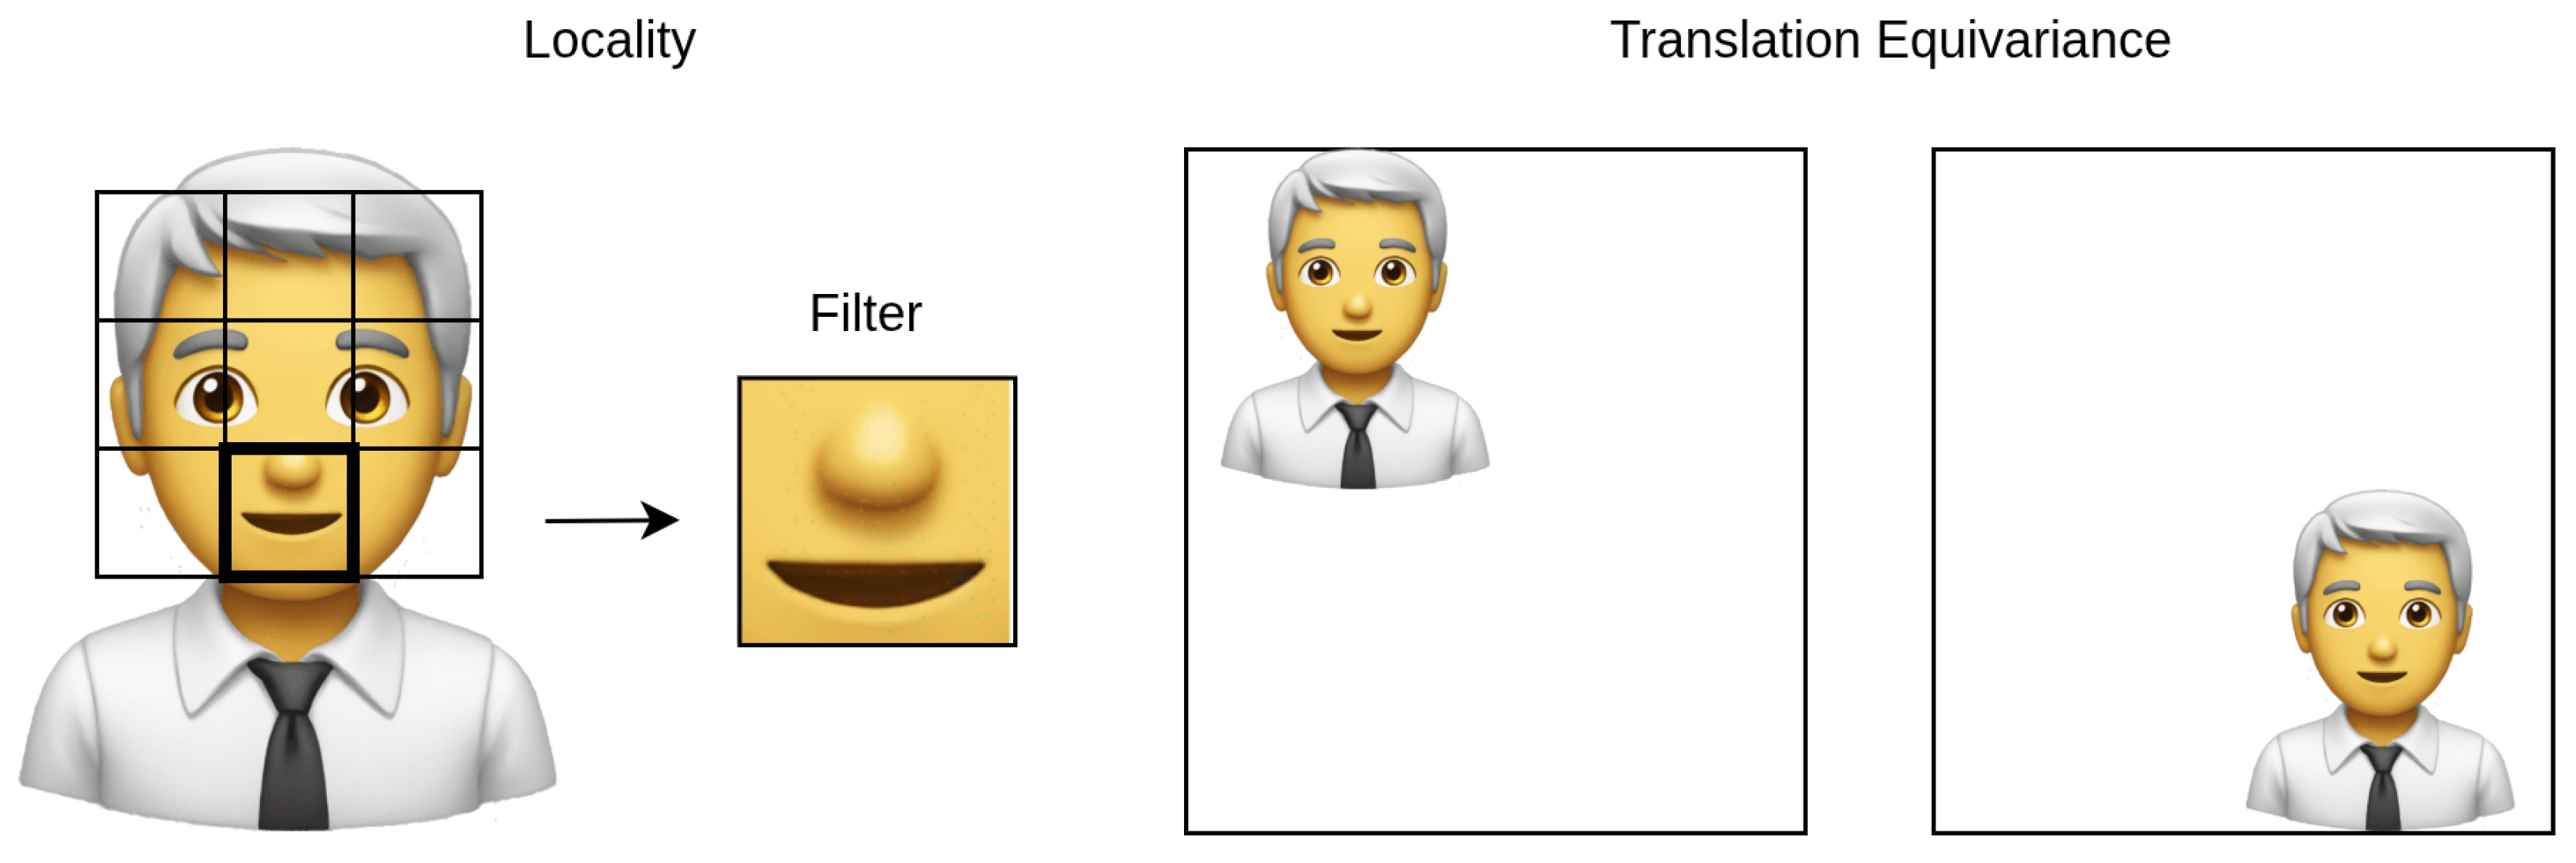
As noted in [
4], this fundamental difference influences their inductive biases. CNNs inherently incorporate biases such as locality, emphasizing the importance of nearby pixels, and translation equivariance, recognizing patterns regardless of their position (see
Figure 4). These biases facilitate assumptions about image structure and enhance training efficiency, particularly when data resources are limited. In contrast, ViTs do not possess these domain-specific biases, providing greater flexibility to learn diverse spatial relationships. However, this lack of inherent biases necessitates larger volumes of training data to effectively learn image structures from scratch.
2.4. Open-Set Recognition and OpenMax
As previously mentioned, image classification models are typically trained within a CSR scenario. This means that the model is trained using images belonging to a predefined set of classes, referred to as known classes. Fundamentally, the training process for classification models relies on the assumption that all classes the model will encounter during testing have been previously observed during training.
However, during testing, images from unknown classes may be encountered in real-world applications. In such situations, the model incorrectly classifies these images as belonging to one of the known classes, since it lacks the ability to recognize images of unknown classes and does not consider the possibility that an image may not belong to any of the classes with which it was trained.
To address this issue, one potential solution involves applying a threshold to the maximum probability produced by the SoftMax layer. The concept is that when an image of unknown classes is introduced, the probabilities assigned to known classes would be low; implementing a threshold can help classify such images as unknown. However, this approach has been shown to be insufficient, as discussed in [
10]. Their study demonstrates that even images entirely unrelated to known classes can sometimes produce high probabilities that surpass the threshold, resulting in misclassifications.
Consequently, methods such as OpenMax [
10] have been developed to enable the model to classify images of known classes while effectively handling those from unknown classes, thereby enhancing performance in OSR scenarios. This method improves the capability of the SoftMax layer to include unknown class prediction. Specifically, the scores obtained from the fully connected layer preceding the SoftMax layer are utilized to determine whether an image is significantly different from the training data. These scores are referred to as the Activation Vector (AV).
The OpenMax algorithm accounts for the likelihood of errors within the recognition system, which is used to assess whether an image belongs to the unknown class. To facilitate this assessment, an adaptation of Meta-Recognition [
11] is used, involving the evaluation of model scores to identify prediction errors and determine whether an image originates from the unknown class. Additionally, previous research on Meta-Recognition [
11] examined the final scores utilizing Extreme Value Theory (EVT), establishing that these scores conform to Weibull distribution. In this context, such distribution is fitted for each known class, a fitting process that is described in detail below.
For each correctly classified image, obtain the AV.
For each known class, compute the Mean Activation Vector (MAV) by averaging the AVs of all correctly classified training samples belonging to that known class.
Calculate a Weibull distribution to the largest distances (tail size) between the AVs and the MAV for each known class.
Once the Weibull distribution has been fitted for each known class, the OpenMax algorithm is employed during the testing phase to enhance the detection of images belonging to unknown individuals. When a new image is presented, its AV is computed, and the subsequent estimation process is carried out as described below.
Sort the known classes in the activation vector in descending order of their activation values.
Initialize the weights to 1 for all known classes.
For the known classes (top classes to revise) with the highest activation values, compute a weight using the distance between the image and the MAV for that known class, along with the corresponding Weibull Cumulative Distribution Function (CDF) probability.
Modify the original AV by applying the weights to obtain a revised AV.
Calculate the activation value for the unknown class by computing a pseudo-activation.
Calculate the new OpenMax probabilities using the revised AV (including the unknown class).
To conclude, OpenMax classifies an image as belonging to the unknown class either when the highest probability corresponds to the unknown class or when the highest probability among the known classes does not exceed a predefined threshold .
3. Related Work
Until five years ago, CNNs dominated the field of computer vision. However, in 2020, the landscape began to change with the introduction of ViTs by the authors of [
4]. This work demonstrated that ViTs can achieve high levels of accuracy in image classification tasks, provided that proper training is carried out. In particular, when ViTs are trained on small- to medium-sized datasets, such as ImageNet with 1000 classes and 1.3 M images, without applying significant regularization, they fail to outperform CNNs due to the lack of certain inductive biases, such as locality and translational equivariance. However, when ViTs are pre-trained with large-sized datasets, such as ImageNet-21k (a superset of ImageNet with 21,000 classes and 14 M images) or JFT-300M, before being fine-tuned to smaller datasets, they can match or even surpass the results of the CNNs. In summary, large-scale training tends to outperform reliance solely on inductive biases.
In order to justify the superior performance of ViTs over CNNs, a comparative analysis of the representations generated by both architectures was carried out in [
12]. The study concludes that ViTs present more uniform representations across all layers, unlike CNNs, which exhibit a hierarchical structure in which extracted features are progressively more abstract with increasing depth. These differences are attributed to the self-attention mechanism—which allows for capturing global information from the first layers—as well as to residual connections, which facilitate the efficient propagation of features from lower to higher layers.
In the field of face recognition, the authors of [
5] conducted a comparative analysis of different architectures, demonstrating that ViTs outperform CNNs in accuracy for face identification and verification tasks across five diverse datasets. Specifically, ViTs were evaluated against widely used CNN architectures, including EfficientNet [
13], Inception [
14], MobileNet [
15], ResNet [
16], and VGG [
17]. The study also indicates that ViTs’ inference speed is competitive: although approximately 24% slower than MobileNet, the fastest model tested, ViTs possess roughly seven times more parameters. Additionally, ViTs exhibit greater robustness to variations in image distance and are notably more effective in managing partial occlusions of the face, owing to their global receptive fields that are less impacted by local obstructions compared to CNNs. Overall, the results suggest that ViTs provide superior performance and enhanced adaptability under varying conditions.
Further studies [
18] confirmed the advantage of transformer-based models, including ViT and Swin Transformer [
19], in face recognition tasks involving masked faces. These models, pre-trained on ImageNet-21k, achieved accuracies above 90% for unmasked images and around 87% for masked images, illustrating the importance of large-scale pre-training in complex real-world scenarios. Similarly, the authors of [
20] proposed the Sparse Vision Transformer (S-ViT) for face recognition, which incorporates relative positional encoding [
21] to better capture spatial relationships. S-ViT outperformed conventional CNNs and standard ViTs, achieving up to 3.27% higher accuracy than ResNet50 using ArcFace loss [
22]. ARTriViT [
23], a ViT-based Siamese network with triplet loss, further demonstrated the effectiveness of ViTs in handling occlusions, pose variations, lighting changes, and limited sample sizes, achieving state-of-the-art performance on the Celeb-DF v2 dataset [
24].
In addition, several hybrid architectures combining CNNs and ViTs have been proposed to capitalize on the strengths of both approaches. For example, the authors of [
25] introduced EdgeFace, a lightweight face recognition model optimized for deployment on edge devices, achieving high accuracy on LFW [
26], IJB-B [
27], and IJB-C [
28] datasets while maintaining low computational requirements. Similarly, ref. [
29] developed MobileFaceFormer, which features parallel CNN and ViT branches with a feature fusion mechanism that retains both local and global facial features. Another approach, FaceLiVT [
30], integrates a lightweight multi-head linear attention mechanism within a hybrid CNN-ViT architecture, delivering competitive performance across multiple benchmarks and enabling faster inference suitable for mobile applications. Lastly, ref. [
31] proposed a hybrid model combining CNNs, ViTs, and Multi-Layer Perceptrons (MLPs) that utilizes CNNs for local feature extraction, ViTs for capturing global context, and an MLP classifier for decision-making, resulting in improved accuracy, robustness, and computational efficiency over pure architectures.
To date, no comprehensive comparison of CNNs and ViTs has been conducted in OSR scenarios for face recognition. This study therefore aims to evaluate the performance of pure CNN and pure ViT architectures in such a scenario, with hybrid models explicitly excluded from the scope of this research.
4. Features of the CNN and ViT Models
As noted earlier, this paper compares CNNs and ViTs for face recognition in OSR scenarios; these models are detailed in the following.
The selection of CNN architectures was guided by specific criteria: (i) historical significance, representing key milestones in the development of CNNs for computer vision; and (ii) architectural diversity, covering varying levels of complexity, connectivity patterns, and number of parameters. These criteria ensure that the comparison with ViTs captures a broad range of CNN models.
Based on these considerations, the following CNN models were selected, as summarized in
Table 1: Inception-V3, ResNet50, DenseNet201, MobileNet-V3-Large, and EfficientNet-B0. These models have widespread use in the existing literature [
5,
31,
32,
33,
34] and have been extensively validated across various computer vision applications [
35,
36,
37,
38], providing a relevant benchmark for comparing traditional CNNs with transformer-based architectures.
Since the introduction of CNN architectures, a series of increasingly advanced models have contributed to significant progress in the field of DL for computer vision. In 2015, the Inception-V3 model [
14] introduced factorized convolutions and optimized module designs, improving both accuracy and computational efficiency. That same year, ResNet50 [
16] revolutionized deep network training through residual connections, enabling significantly deeper architectures without compromising performance.
Later, DenseNet201 [
39], published in 2017, proposed dense connectivity between layers to strengthen feature propagation and reduce parameter redundancy. In 2019, MobileNet-V3-Large [
40] targeted efficient inference on mobile and embedded devices by combining neural architecture search with lightweight building blocks. EfficientNet-B0 [
13], also released in 2019, achieved a balance between performance and efficiency through compound scaling and careful architecture design.
Finally, ViTs [
4] (ViT-B-16), introduced in 2020, marked a paradigm shift by adapting Transformers [
41] to computer vision, reaching competitive performance with CNNs when pre-trained on large-scale datasets.
5. Baseline Conditions for Analytical Comparison
This section provides a detailed account of the procedures followed in this study, which are divided into three main phases: pre-training, fine-tuning, and evaluation in an OSR scenario.
5.1. Pre-Training
All the models listed in
Table 1 were initially pre-trained on a large-scale dataset to learn discriminative facial representations with strong generalization capabilities. For this pre-training phase, the VGGFace2 dataset [
42] was employed, given its widespread adoption in the literature for its large volume of facial images. Developed by Oxford University, this dataset comprises a total of 3.3 M images representing 9131 individuals. The dataset is divided into two partitions: 8631 training classes containing 3.1 M images and 500 test classes containing 169,396 images. For this work, only the training split was used, which contains an average of 364 images per class. The distribution of the number of images per class in the training and testing splits, along with the total images across both splits, is illustrated in
Figure 5.
Before pre-training the models, the images underwent a comprehensive pre-processing pipeline, including resizing, channel normalization and data augmentation techniques, with the aim of improving the generalization capacity and robustness of the model to variations in the capture conditions, such as changes in illumination or posture. The images were resized uniformly to 224 × 224 pixels, and normalization was applied using a mean and standard deviation of 0.5 per channel. In addition, various data augmentation techniques were incorporated, such as random horizontal flipping, rotations up to ±15 degrees, conversion to grayscale with a 10% probability, random adjustments in brightness, contrast, saturation, and hue, random cropping with scaling between 70% and 100% of the image area, and blurring. Each of these augmentations enhanced the models’ robustness: flipping and rotations improved resilience to pose variations, grayscale conversion and color adjustments mitigated biases related to skin tone and lighting conditions, random cropping and scaling directed the models’ attention to essential facial features rather than background details, and blurring increased resilience to low-quality or out-of-focus images. The application of these augmentations reduced overfitting, allowing the models to start the subsequent fine-tuning phase with weights that captured general facial representations.
Furthermore, the set of images used was divided into 95% for training and 5% for validation in order to evaluate and monitor the generalizability of the models. The pre-training process was carried out over a maximum of 50 epochs, with both training and validation phases performed in each epoch. In addition, an early stopping strategy was implemented with a patience parameter of 5, so that if the accuracy of the validation set did not improve for 5 consecutive epochs, training was stopped early to prevent overfitting and optimize the use of computational resources.
In relation to learning rates, a uniform value of was assigned, and a combined scheduler integrating a linear warm-up phase followed by a CosineAnnealingWarmRestarts readjustment was implemented to efficiently manage the learning rate during the pre-training process.
Finally, pre-training was performed using the CrossEntropyLoss loss function, and optimization was carried out using the AdamW algorithm [
43], which combines the advantages of Adam with a weight decay regularization of
.
5.2. Fine-Tuning
After gaining a broad understanding of human faces through extensive pre-training on the large-scale VGGFace2 dataset, the models were subsequently fine-tuned using a smaller, more specific dataset containing a limited number of individuals. Specifically, the fine-tuning dataset consisted of exactly 100 people. This second phase aimed to adapt the models to the targeted dataset, thereby enhancing their performance within this particular group of people. During the fine-tuning phase, all parameters from the pre-trained models were preserved, except for the final classification layer, which was replaced and reinitialized to accommodate the change in the number of output classes from 8631 to 100.
For this second phase, 100 individuals from the CASIA-WebFace [
44] dataset were used. CASIA-WebFace [
44] is a face recognition dataset developed by the Chinese Academy of Sciences, comprising 494,414 images representing 10,575 individuals.
In this case, each of the 100 known individuals was represented by 70 training images and 10 validation images. Prior to fine-tuning, all images underwent a pre-processing procedure to ensure consistency with the pre-training phase. This process included face detection using Multi-task Cascaded Convolutional Networks (MTCNN) [
45], which cropped the facial region by removing background noise. Subsequently, each cropped face was resized to 224 × 224 pixels and normalized using a mean and standard deviation of 0.5.
Once the training and validation images of the 100 known individuals were pre-processed, the fine-tuning phase was conducted over 40 epochs using the CrossEntropyLoss function and the Adam optimizer, with a learning rate of . The final models were selected based on their validation set performance, specifically those with the highest classification accuracy.
5.3. Evaluation
After fine-tuning the models using images of 100 known individuals, their performance was first assessed in a CSR scenario to verify their ability to accurately identify these known individuals. In this scenario, the SoftMax function was used as the component responsible for converting the models’ output scores into probability distributions over the 100 known classes. This allowed for the evaluation of the models’ ability to differentiate and classify the previously mentioned 100 known people. For this purpose, 10 test images from each known person were used. These images were processed by applying MTCNN for face cropping, followed by resizing to 224 × 224 pixels and normalization using a mean and standard deviation of 0.5 in each channel.
Subsequently, the models were evaluated in an OSR scenario, which comprised both known and unknown individuals who were not part of the training set, neither during the pre-training nor the fine-tuning phases. For this scenario, the OpenMax algorithm was implemented, with the selected parameter values as summarized in
Table 2.
The selected OpenMax parameters (
,
,
) were adopted from [
46], who focused on the optimization of OpenMax parameters for OSR scenarios. More precisely, the tail size
controls the number of extreme values used to fit the Weibull distributions, with larger values reducing sensitivity to unknown faces, while smaller values could make the model more sensitive to unknown faces but also more prone to false positives. The top classes to revise
specify the number of highest-scoring known classes to be adjusted by OpenMax; increasing
may distort the probability distribution, whereas decreasing
might leave some overconfident predictions uncorrected. The threshold
was set to 0.9 to effectively balance the detection of unknown faces while maintaining high accuracy on known identities; raising
would make the model more conservative in identifying known faces, while lowering it could increase the risk of misclassifying unknown faces as known.
To simulate images of unknown people, 1000 images were used, each representing individuals from the CASIA-WebFace dataset who were not included among the known people. These images were incorporated into the test set of known people and labeled as belonging to an unknown class. As in previous steps, all images were first cropped using MTCNN, then resized to 224 × 224 pixels and subsequently normalized using a mean and standard deviation of 0.5 in each channel.
6. Results and Discussion
This section presents the results of the study, beginning with an overview of the hardware and software environment employed. Subsequently, the models’ learning behavior during the fine-tuning phase is examined through key metric training and validation curves, including loss, recall, and precision, providing insight into their performance evolution. Following this, the models’ accuracy is evaluated in both a CSR scenario, involving known individuals, and an OSR scenario, which includes unknown identities. In order to isolate the effect of the OpenMax algorithm, an ablation study is conducted by applying a threshold to the probabilities generated by SoftMax rather than implementing the OpenMax mechanism, demonstrating that the observed performance differences between models are not solely attributable to the choice of mechanism for OSR scenarios. Finally, the discussion includes an analysis of the computational cost of the evaluated models, considering both FLOPs and inference time per image.
All results reported correspond to 10 independent runs with different seeds. For each metric, the mean, standard deviation, and 95% confidence interval were computed to ensure reliability and enable a robust comparison of the models.
6.1. Hardware and Software Environment
The experiments were conducted on a Dell PowerEdge R730 (Dell Inc., Round Rock, TX, USA) server equipped with 80-core Intel Xeon Silver 4416+ processors (Intel Corporation, Santa Clara, CA, USA), 128 GB of RAM, and two NVIDIA A40 GPUs (NVIDIA Corporation, Santa Clara, CA, USA), each with 48 GB of dedicated GPU memory. The software environment was based on Ubuntu 22.04.5 LTS (Canonical Ltd., London, UK), using the Python programming language, version 3.10.12. Moreover, Python libraries, as detailed in
Table 3, played a key role in this study.
6.2. Fine-Tuning Performance
Before delving into scenario-specific results, we should first examine how the models learned from the training images during the fine-tuning phase.
Figure 6 illustrates the progression of loss, recall, and precision across epochs, with each plot corresponding to a specific metric and displaying both training and validation curves for all models. The curves represent the average performance across all runs of each model at each epoch, offering a comprehensive overview of the models’ overall behavior during the fine-tuning phase.
The training curves demonstrate effective model learning, with loss decreasing and recall and precision steadily increasing. The validation curves exhibit a similar trend, expectedly slightly below the training performance. This pattern indicates that the models effectively classify and differentiate known individuals while demonstrating a suitable generalization to unseen face images.
6.3. Closed-Set Recognition Performance
Having observed the fine-tuning performance, the next step is to assess how well the models classify known individuals. In the CSR scenario, all models perform strongly, as indicated by the macro-averaged F1 score statistics presented in
Table 4. Notably, DenseNet201 and ViT-B-16 achieve the highest mean macro-averaged F1 scores, showing a slight edge over the other CNN-based architectures. EfficientNet-B0 also performs well, with a mean macro-averaged F1 score close to these leading models. ResNet50 and Inception-V3 yield robust results, while MobileNet-V3-Large, designed for lightweight deployment, shows slightly lower performance relative to the other architectures.
6.4. Open-Set Recognition Performance
Beyond known identities, it is critical to evaluate the models’ ability to handle unfamiliar faces.
Table 5 summarizes the macro-averaged F1 score statistics obtained by the evaluated models in the OSR scenario. In this context, the ViT-B-16 model attains the highest mean macro-averaged F1 score of 90.50%, accompanied by minimal standard deviation and a narrow 95% confidence interval, indicating consistent performance. MobileNet-V3-Large and EfficientNet-B0 also demonstrate strong results, with mean macro-averaged F1 scores of 87.32% and 87.65%, respectively, and relatively low variability across runs. ResNet50 and DenseNet201 exhibit moderate performance, while Inception-V3 achieves the lowest mean macro-averaged F1 score and shows greater variability, as reflected by its larger standard deviation and wider confidence interval.
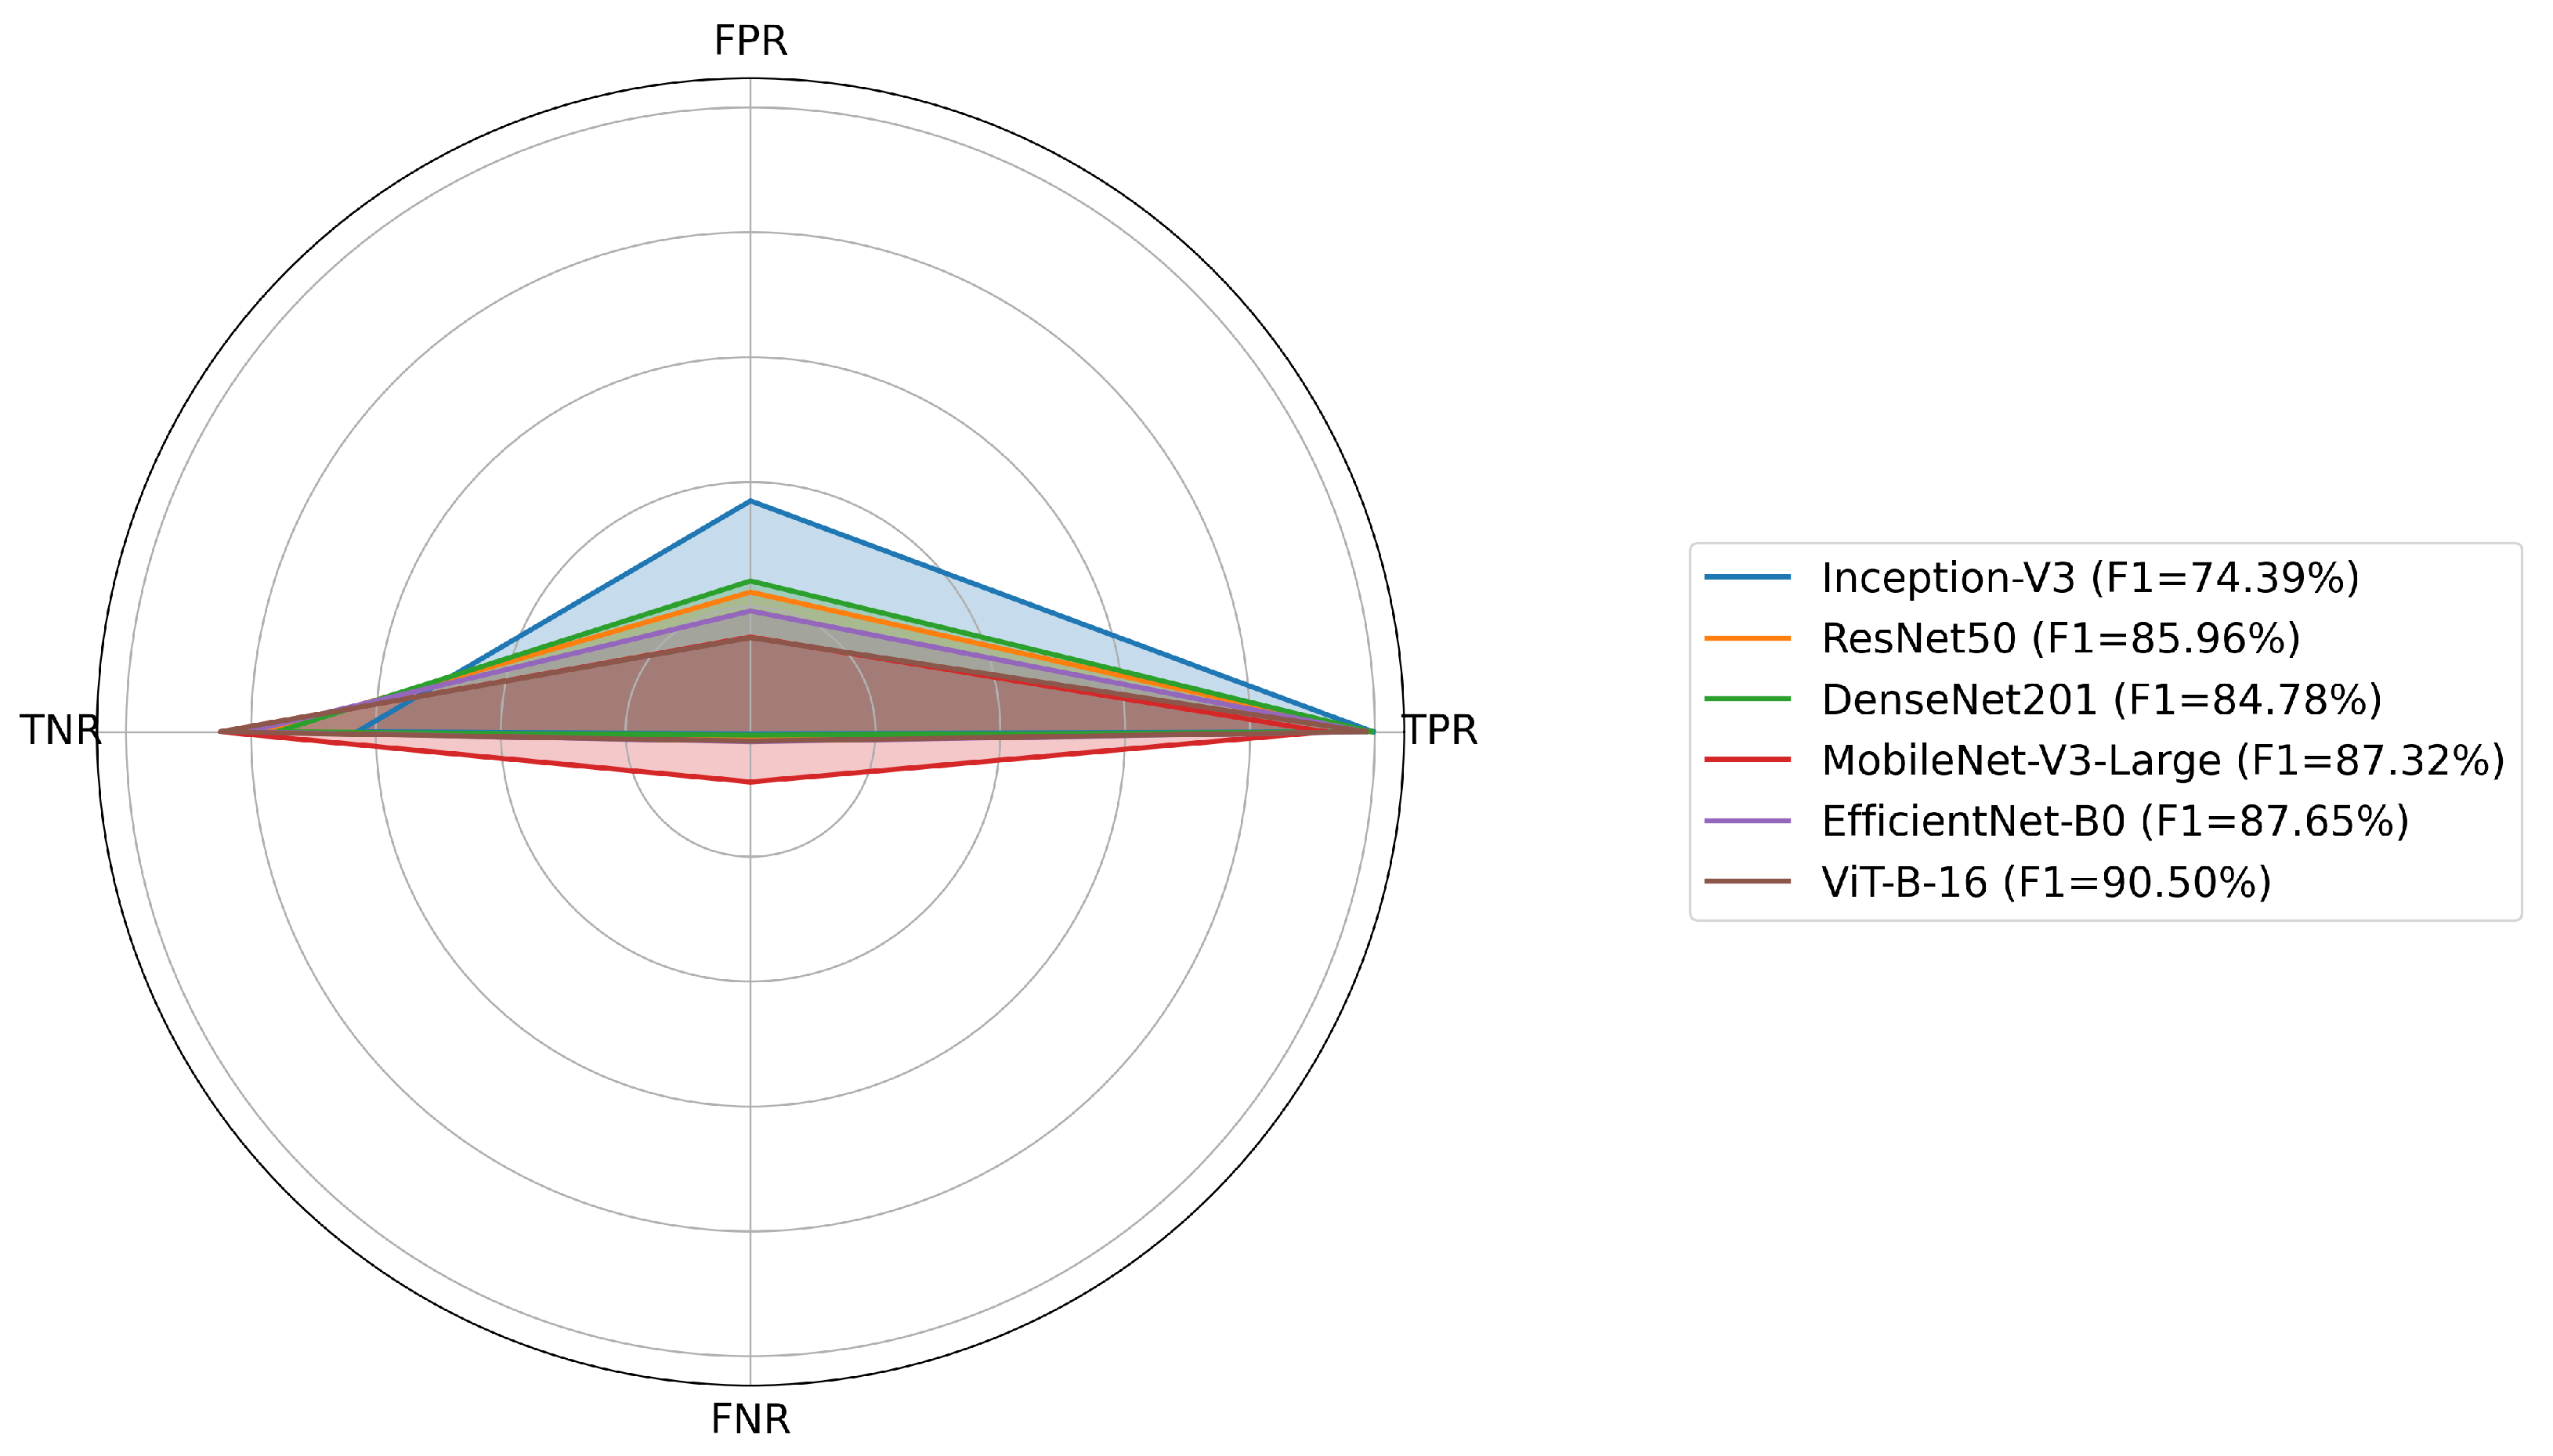
To further evaluate how the models manage both known and unknown individuals, a detailed analysis of the False Positive (FPR), True Negative (TNR), True Positive (TPR), and False Negative (FNR) Rates was conducted. As detailed in
Table 6, the ViT-B-16 model demonstrates a favorable balance, achieving a high TPR of 98.50% combined with a low FPR of 15.08%, indicating strong generalization capabilities. The EfficientNet-B0 model also performs interestingly, with a TPR of 98.42% and an FPR of 19.35%. MobileNet-V3-Large is notable for having the highest TNR at 84.81%, suggesting a conservative approach in detecting unknown individuals, though this is accompanied by a lower TPR of 91.97%. ResNet50 and DenseNet201 exhibit very high TPRs of 99.23% and 99.45%, respectively; however, their higher FPRs of 22.37% and 24.16% may indicate a greater tendency to misclassify unknown faces as known. Inception-V3 displays a comparatively weaker performance, with the highest FPR at 36.98% and the lowest TNR at 63.02%, despite achieving a near-perfect TPR of 99.70%.
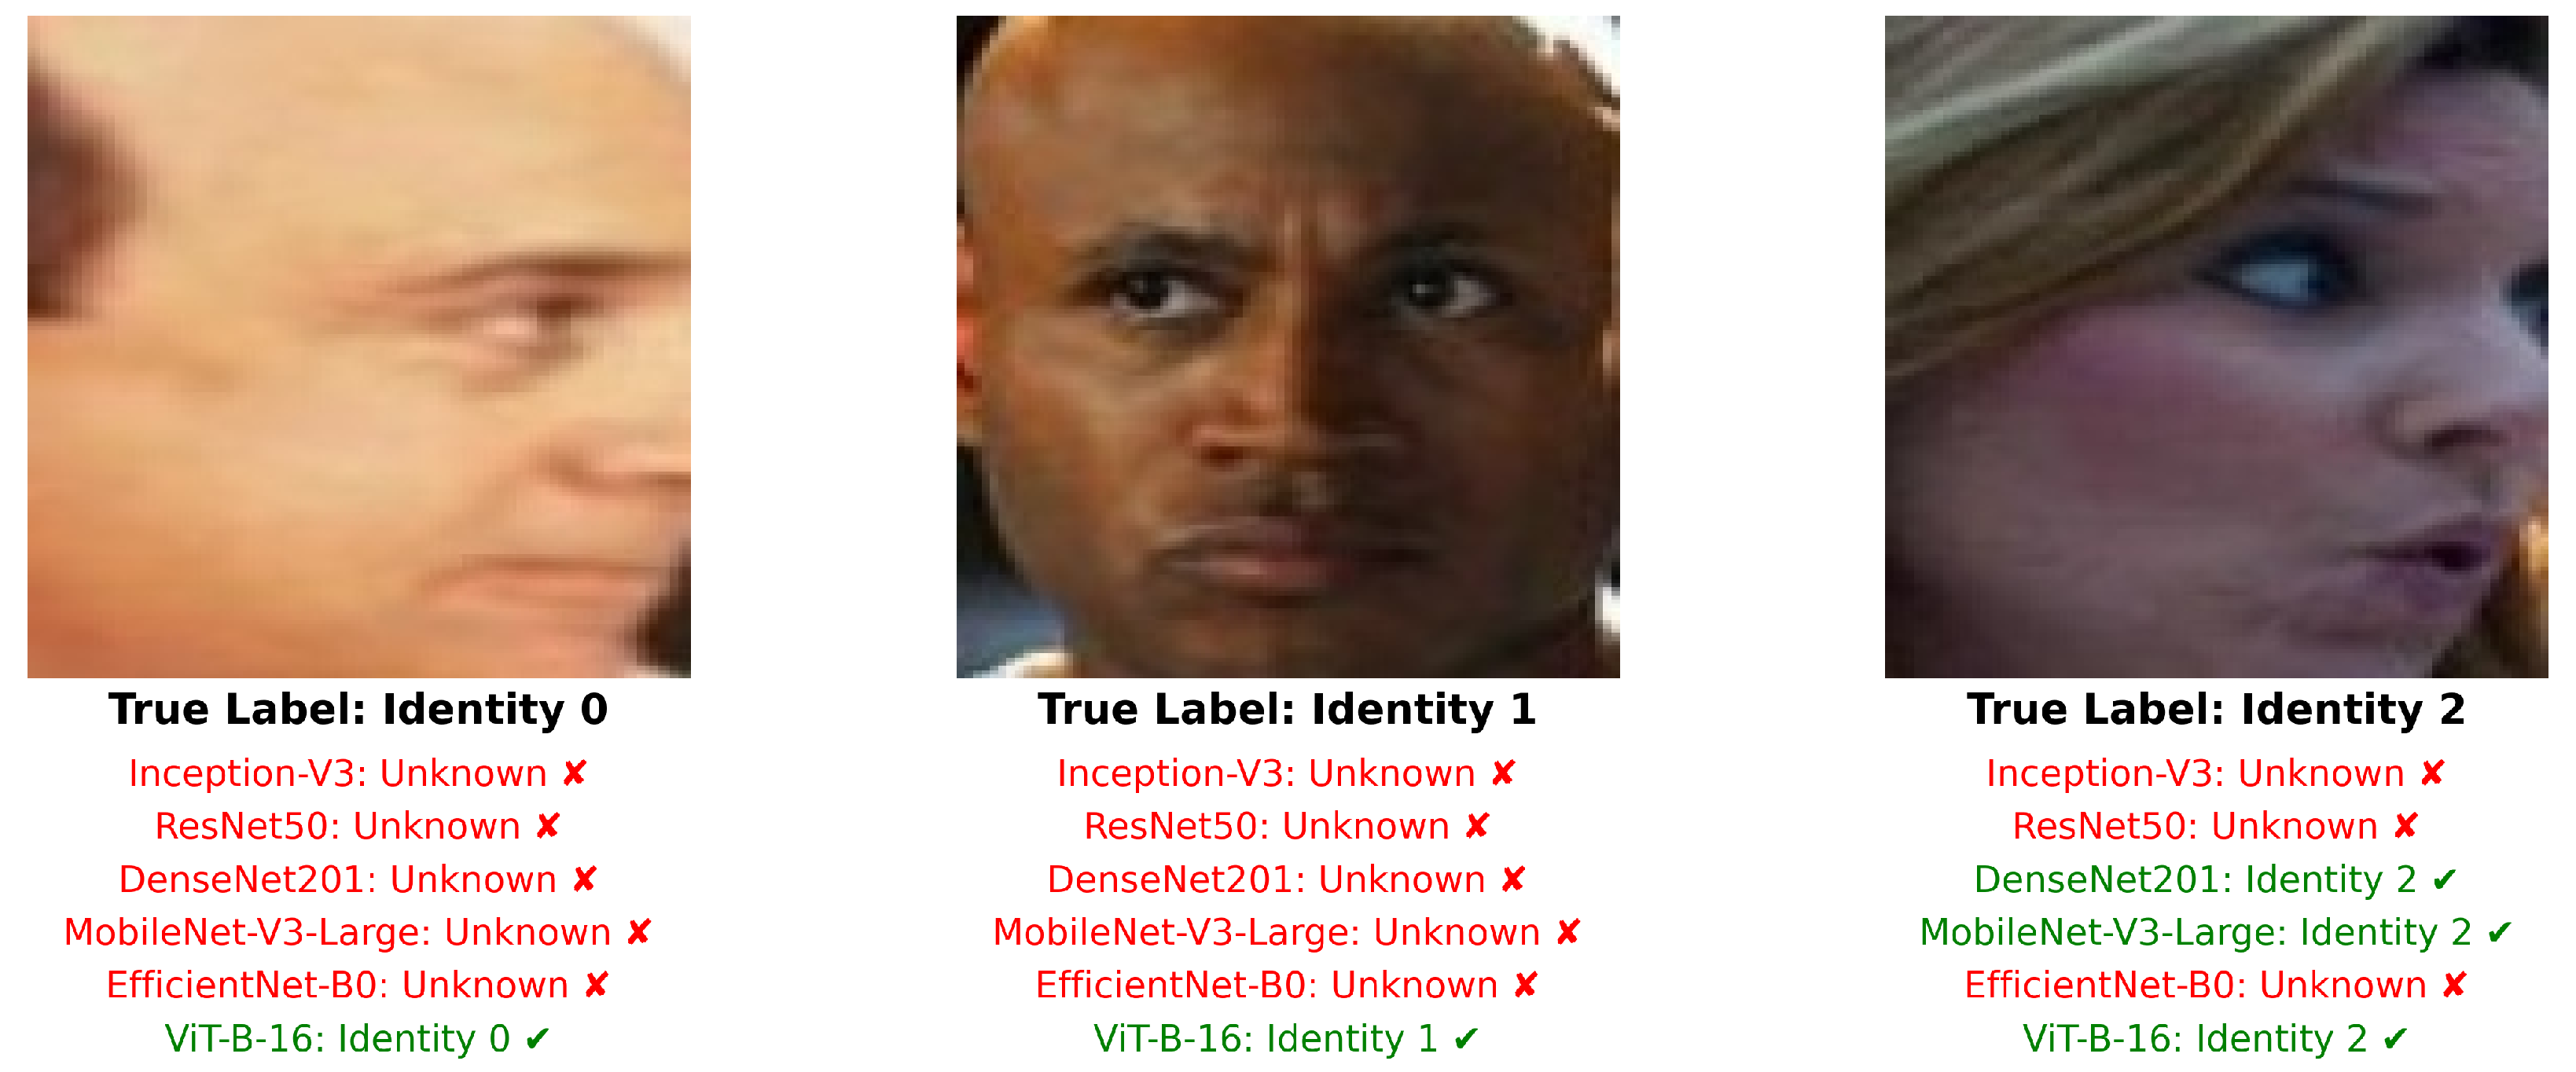
To enhance our understanding of the models’ performance in the OSR scenario,
Figure 7 and
Figure 8 illustrate three known and three unknown faces, along with their true labels and the predictions generated by each model, respectively. It can be observed that ViT-B-16 correctly classifies all six faces, demonstrating its superior accuracy and robustness compared to the other models on this set of images.
The experimental evaluation carried out highlights the challenges associated with OSR scenarios, where models must accurately distinguish between known and unknown individuals. Among all tested models, ViT-B-16 demonstrates the most balanced and robust performance, achieving the highest mean macro-averaged F1 score and maintaining an optimal trade-off between correctly identifying unknown faces and minimizing false recognitions. EfficientNet-B0 and MobileNet-V3-Large also perform strongly, with relatively low FPRs and high TNRs that make them effective at handling unfamiliar identities. By contrast, CNN-based models such as DenseNet201 and Inception-V3, despite reaching near-perfect TPRs, show higher FPRs, reflecting a tendency to misclassify unknown individuals as known. These findings suggest that ViT architectures offer superior performance in OSR scenarios and may be better suited for real-world applications where encountering unknown people is common.
Figure 9 presents a visual summary of the metrics across all evaluated models in the OSR scenario, with FPR, TPR, TNR, and FNR displayed in the radar chart on the left, and mean macro-averaged F1 scores shown in the legend.
Nevertheless, it is important to note that CNNs remain highly competitive and widely used, especially in contexts where training data is limited, such as in small- and medium-scale datasets. In these cases, ViTs tend to fail to generalize, which negatively affects their performance. An illustrative example is the study presented by [
50], which showed that when trained with approximately 20,000 images, ViTs achieved superior performance; however, when the dataset was halved, CNNs performed better. In summary, although ViTs offer clear advantages in large-scale training scenarios, CNNs continue to play a fundamental role in a variety of applications with limited data.
6.5. Ablation Study: SoftMax Thresholding and OpenMax
To evaluate whether the observed performance differences depend on the OpenMax algorithm, an ablation study was conducted using SoftMax Thresholding as an alternative. In this approach, images whose highest predicted probability did not exceed a predetermined threshold of 0.9—the same value used in OpenMax—were categorized as unknown.
Table 7 presents the corresponding macro-averaged F1 score statistics.
The results clearly demonstrate that ViT-B-16 consistently surpasses all CNN architectures in the OSR scenario, independent of whether OpenMax or SoftMax Thresholding is employed. ViT-B-16 attains the highest mean macro-averaged F1 score with minimal variance, reflecting its enhanced capacity for identifying known and unknown identities. This finding indicates that the observed differences between models are not due to the choice of using OpenMax or another alternative but rather reflect the inherent robustness and accuracy of ViT-B-16.
6.6. Computational Cost and Inference Time Analysis
In addition to evaluating model accuracy, the deployment of DL models requires consideration of their computational cost. To this end,
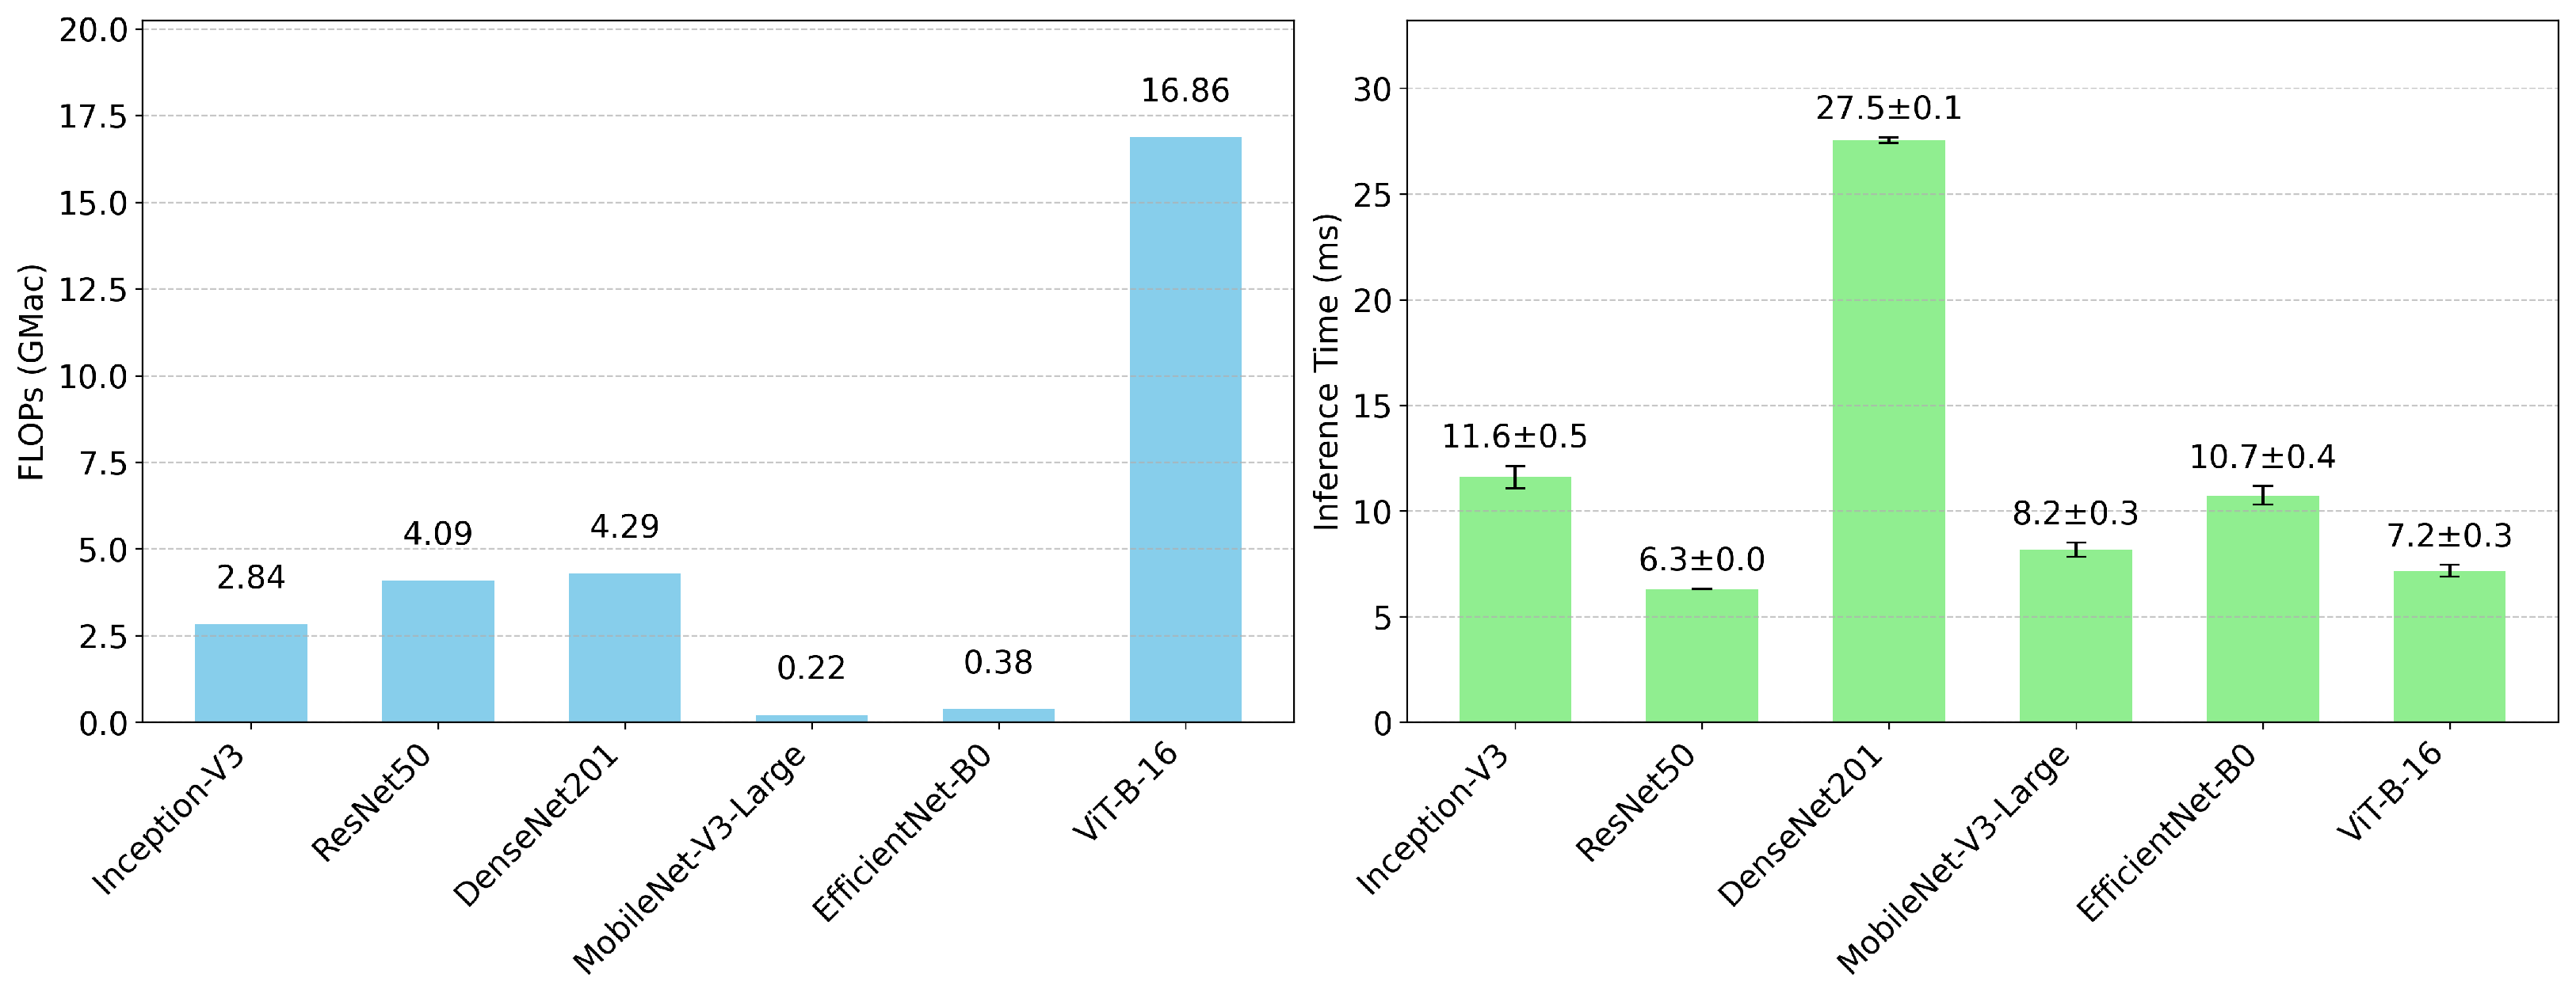
Figure 10 summarizes key metrics for all evaluated models, including floating-point operations (FLOPs) and inference time per image.
As illustrated in the graph on the left, the ViT-B-16 architecture has the highest computational cost at approximately 16.86 GFLOPs. This is mainly attributed to its attention-based design, which allows it to capture global relationships between all patches in the image, unlike CNNs, which focus on extracting local features through hierarchical convolutions. CNN architectures such as DenseNet-201 (4.29 GFLOPs), ResNet-50 (4.09 GFLOPs) and Inception-V3 (2.84 GFLOPs) offer a balance between depth and computational efficiency. Lighter models, such as MobileNet-V3-Large (0.22 GFLOPs) and EfficientNet-B0 (0.38 GFLOPs), significantly reduce the number of FLOPs, making them particularly suitable for resource-constrained environments.
The graph on the right shows the inference time per image, demonstrating that a higher number of FLOPs does not necessarily imply longer inference times. For example, the ViT-B-16 model requires an average of approximately 7.2 ms per image, remaining competitive thanks to the optimized parallelization of its attention mechanisms. Although DenseNet-201 has a lower FLOPs cost than ViT-B-16, it has a higher inference time. On the other hand, models such as ResNet-50, Inception-V3, EfficientNet-B0, and MobileNet-V3-Large show moderate inference times, indicating a balance between architectural depth and computational efficiency.
In summary, these results highlight the trade-offs between model accuracy and computational efficiency. While ViT-B-16 offers greater accuracy and robustness in capturing global dependencies in images, its high FLOPs requirements may limit its implementation in resource-constrained scenarios. On the other hand, lightweight architectures such as MobileNet-V3-Large and EfficientNet-B0 represent an attractive option, achieving competitive performance at a significantly lower computational cost, making them ideal for real-time applications or environments with limited hardware.
7. Conclusions
This paper presents a comparison between CNN and ViT architectures for face recognition in an OSR scenario. Specifically, five CNN models—Inception-V3, ResNet50, DenseNet201, MobileNet-V3-Large and EfficientNet-B0—are compared to the base ViT model, ViT-B-16. For the classification of individuals in such a scenario, the OpenMax algorithm is implemented, allowing the models to identify and assign an unknown category instead of forcing classification into one of the known identities from the training phase.
The results show that ViT-B-16 achieves the strongest performance in handling both known and unknown individuals, attaining a mean macro-averaged F1 score of 90.50% across multiple runs. These results are in line with the findings reported in related works, which demonstrate that ViTs constitute an emerging architecture capable of outperforming traditional CNNs when pre-trained on large-scale image datasets. In this work, the strong results achieved by ViT-B-16 can be attributed to such pre-training.
However, it is important to note that while the implemented VGGFace2 and CASIA-WebFace datasets are commonly used in face recognition research, they may not comprehensively represent the demographic diversity found in real-world populations. Variations in age, gender, and ethnicity can impact model performance, particularly in OSR scenarios, and may influence the overall identification accuracy of the evaluated models.
In practical applications such as surveillance and access control, the primary objective is typically to identify a specific group of individuals, rather than incorporating external individuals during training. Therefore, it is crucial to develop models that can reliably differentiate between known and unknown people, enhancing system robustness, security, and operational reliability. This work represents a further step in the development and deployment of such systems for real-world applications, where accuracy is a key requirement. As a result of the conducted study, we showed that ViTs emerge as a particularly promising alternative in OSR scenarios, especially when appropriate model pre-training is performed. Nonetheless, it is important to mention that CNNs remain highly effective and extensively utilized, especially in scenarios with limited training data, and therefore continue to serve a vital function in numerous practical applications.
In terms of future research directions, we propose conducting a comparative evaluation of different variants of ViTs, including Swin Transformers. In addition, researchers could explore hybrid models that take advantage of the complementary advantages of both approaches.
