Article

Detection and Classification of Low-Voltage Series Arc Faults Based on RF-Adaboost-SHAP

Division of Electronics and Informatics, School of Science and Technology, Gunma University, 1-5-1 Tenjin-cho, Kiryu 376-8515, Japan
*
Author to whom correspondence should be addressed.
Electronics 2025, 14(19), 3761; https://doi.org/10.3390/electronics14193761
Submission received: 20 August 2025 / Revised: 17 September 2025 / Accepted: 22 September 2025 / Published: 23 September 2025
(This article belongs to the Special Issue New Insights in Power Electronics: Prospects and Challenges)

Abstract

Low-voltage series arc faults pose a significant threat to power system safety due to their random, nonlinear, and non-stationary characteristics. Traditional detection methods often suffer from low sensitivity and poor robustness under complex load conditions. To address these challenges, this paper proposes a novel detection framework based on Random Forest (RF) feature selection, Adaptive Boosting (Adaboost) classification, and SHapley Additive exPlanations (SHAP) interpretability. First, RF is employed to rank and select the most discriminative features from arc fault current signals. Then, the selected features are input into an Adaboost classifier to enhance the detection accuracy and generalization capability. Finally, SHAP values are introduced to quantify the contribution of each feature, improving the transparency and interpretability of the model. Experimental results on a self-built arc fault dataset demonstrate that the proposed method achieves an accuracy of 97.1%, outperforming five widely used traditional classifiers. The integration of SHAP further reveals the physical relevance of key features, providing valuable insights for practical applications. This study confirms that the proposed RF-Adaboost-SHAP framework offers both high accuracy and interpretability, making it suitable for real-time arc fault detection in complex load scenarios.

1. Introduction

Low-voltage series arc faults are one of the most insidious threats to power distribution systems. Unlike short-circuit or ground faults, arc faults do not generate large overcurrent, making them difficult to detect using conventional protection devices [1]. Once sustained, arc faults can cause overheating, insulation degradation, and even electrical fires, posing a serious risk to system safety and reliability. Therefore, accurate and real-time detection of arc faults has become a key research topic in power system protection.
Existing detection methods can be broadly categorized into signal-based analysis, machine learning, and deep learning approaches. Signal-based methods primarily rely on time-domain, frequency-domain, or time–frequency features of current signals, such as crest factor, kurtosis, wavelet energy entropy, and power spectral entropy [2,3,4]. Although they provide useful insights, their sensitivity often degrades under complex and nonlinear load conditions. Traditional machine learning models—such as k-Nearest Neighbors (KNN), Linear Discriminant Analysis (LDA), and Support Vector Machines (SVM)—have also been applied to arc fault detection due to their relatively low computational cost [5,6,7]. However, these methods heavily rely on manual feature engineering and typically struggle to achieve both high accuracy and robustness. The dynamic strategy of adaptive federal learning may lead to fluctuations and instability in the training process [8]. More recently, deep learning approaches (e.g., CNNs, LSTMs) have shown promising performance by automatically extracting features from raw signals [9,10,11]. Nevertheless, their high computational complexity and poor interpretability limit deployment in real-time, resource-constrained environments.
To overcome these challenges, ensemble learning offers an effective alternative. Random Forest (RF), with its built-in feature ranking and robust generalization, provides an efficient tool for selecting the most discriminative features from arc signals [12]. Adaptive Boosting (Adaboost) enhances weak learners to boost detection accuracy and resilience to noise [13,14]. Despite their effectiveness, most existing studies focus solely on classification accuracy, neglecting interpretability, which poses a barrier for practical deployment where engineers require clear explanations of decisions.
In practical engineering scenarios, especially under household and industrial complex loads, arc faults are often masked by background noise and nonlinear interference, which makes robust detection even more challenging. Moreover, the increasing penetration of power electronic devices and renewable energy sources introduces additional harmonics and transient disturbances, further complicating signal characteristics. These realities highlight the need for detection methods that can balance accuracy, robustness, and interpretability simultaneously. In particular, interpretability has recently attracted significant attention, as black-box models hinder engineers’ confidence in adopting intelligent diagnostic tools in safety-critical systems.
This paper proposes a hybrid detection framework that integrates RF-based feature selection, Adaboost classification, and SHapley Additive exPlanations (SHAP) interpretability. The contributions are as follows:
(1)
Feature Selection with Physical Relevance: RF evaluates and ranks features extracted from arc fault signals, ensuring that the most physically meaningful and discriminative features are retained.
(2)
High-Accuracy Detection with Adaboost: The selected features are input into an Adaboost classifier, enhancing detection accuracy and robustness under complex load conditions.
(3)
Transparent Model Interpretation: SHAP values quantify the contribution of each feature to the final decision, providing interpretable results that bridge data-driven methods and physical mechanisms.
(4)
Comprehensive Experimental Validation: Extensive experiments on a self-built arc fault dataset demonstrate superior accuracy and robustness compared with traditional models, while offering enhanced interpretability.
The remainder of this paper is organized as follows: Section 2 introduces the feature extraction and selection methods. Section 3 presents the proposed RF–Adaboost–SHAP framework. Section 4 provides experimental results and discussion. Section 5 concludes and outlines future research directions.

2. Feature Extraction and Preprocessing

2.1. Collection of Series Arc Fault Data

As shown in Figure 1, an arc test platform conforming to GB/T 31143-2014 standard is built [15]. A copper electrode with a diameter of 10.0 mm is used as the moving contact, and a graphite electrode with a diameter of 8.0 mm is used as the reference static contact. By controlling the electrode gap, an arc is generated to simulate the series fault arc caused by loose terminal connections and broken wires.
Based on the samples, seven types of loads (electric kettles, electric drills, LED lights, etc.) will be collected to obtain current signal samples under normal and fault states. The sampling method employs “live-ground pair cancellation + single-line current” technology, with a live-ground pair cancellation frequency fs1 = 400 kHz and single-line current fs2 = 20 kHz. The signal sampling duration is 80,000 points for live-ground pair cancellation and 4000 points for single-line current. Arc simulators will generate both arc-pulling and non-arc-pulling data.
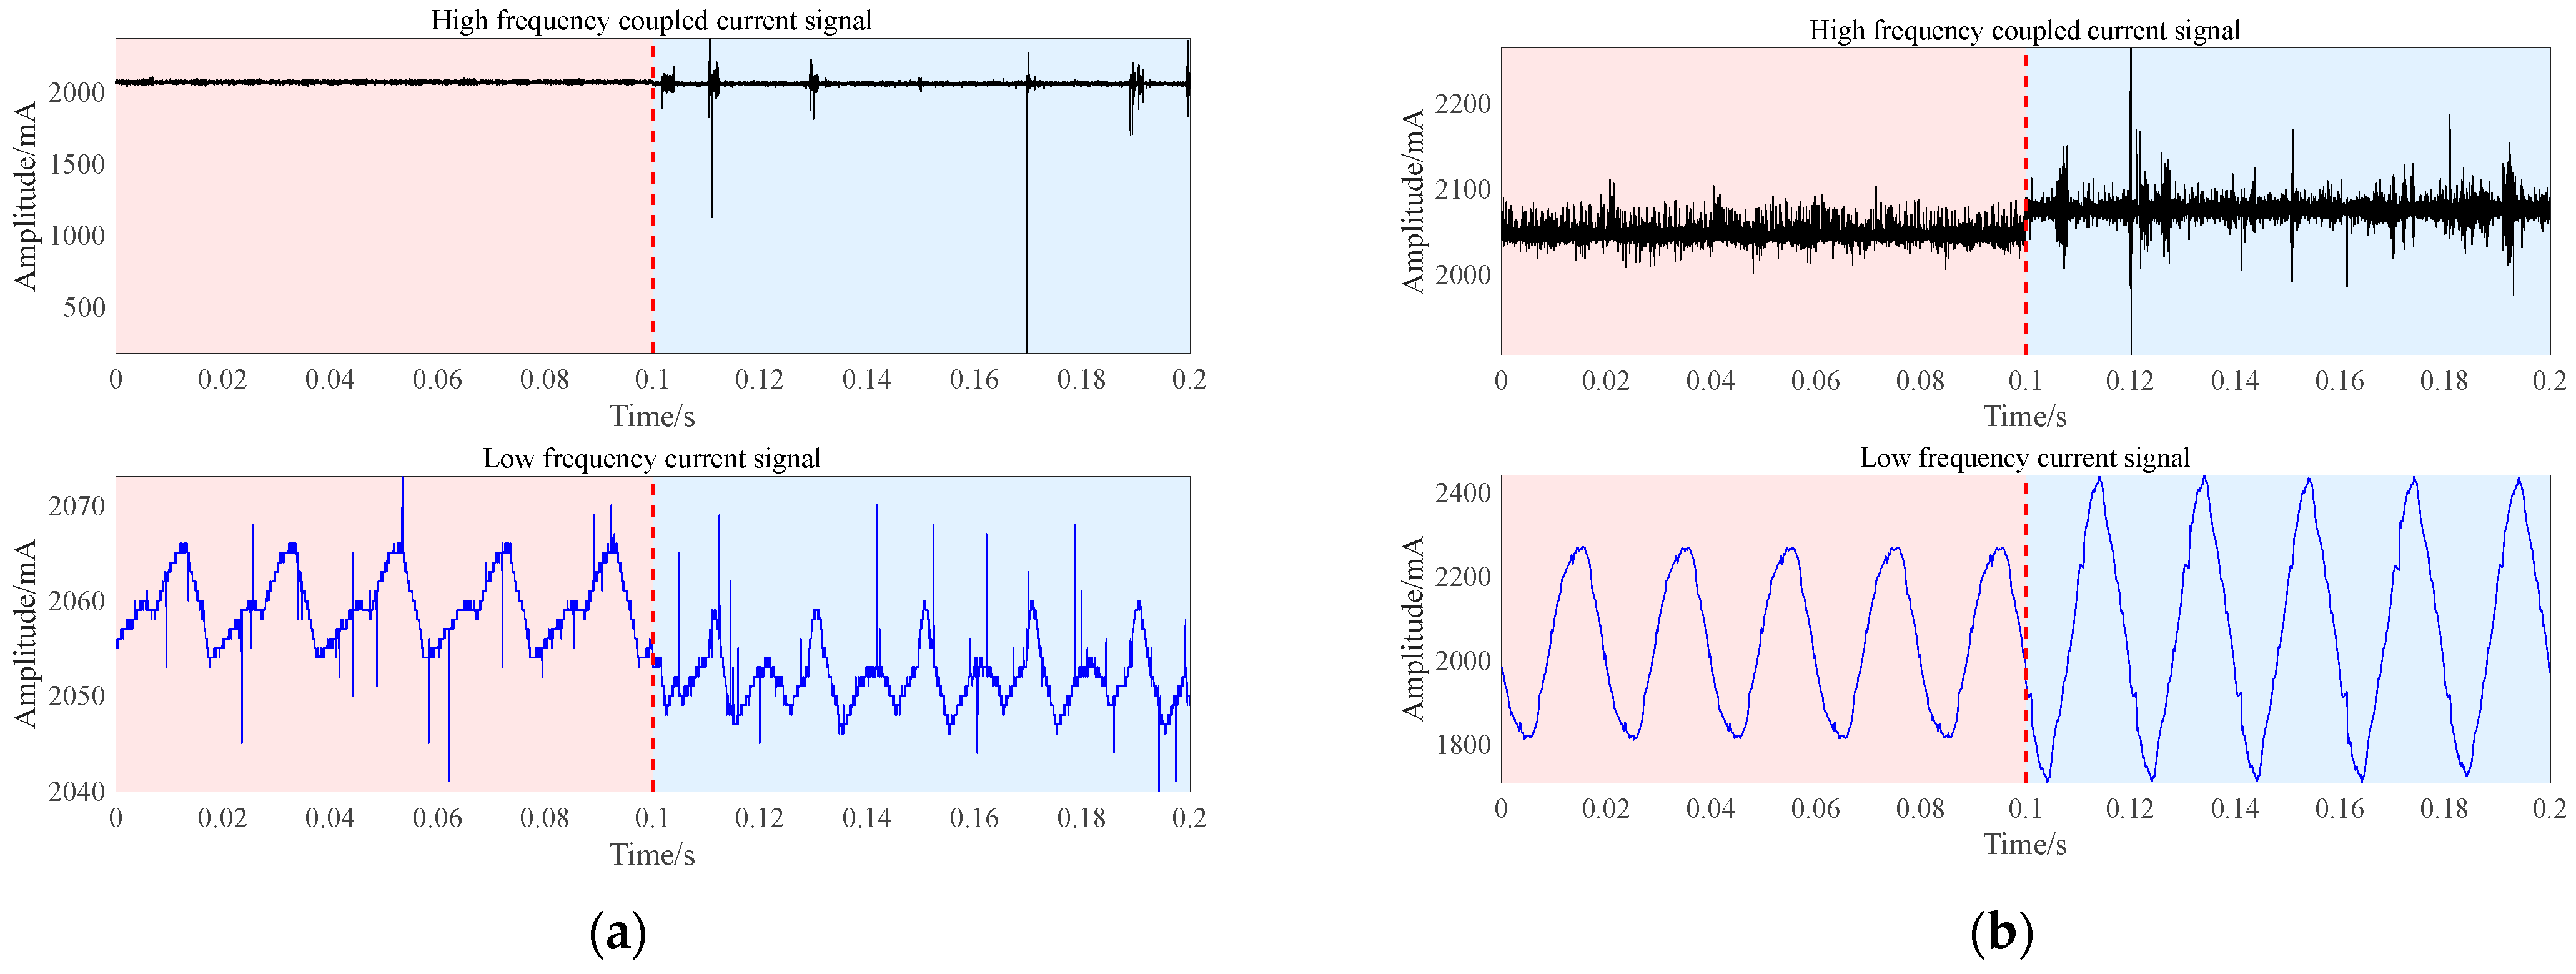
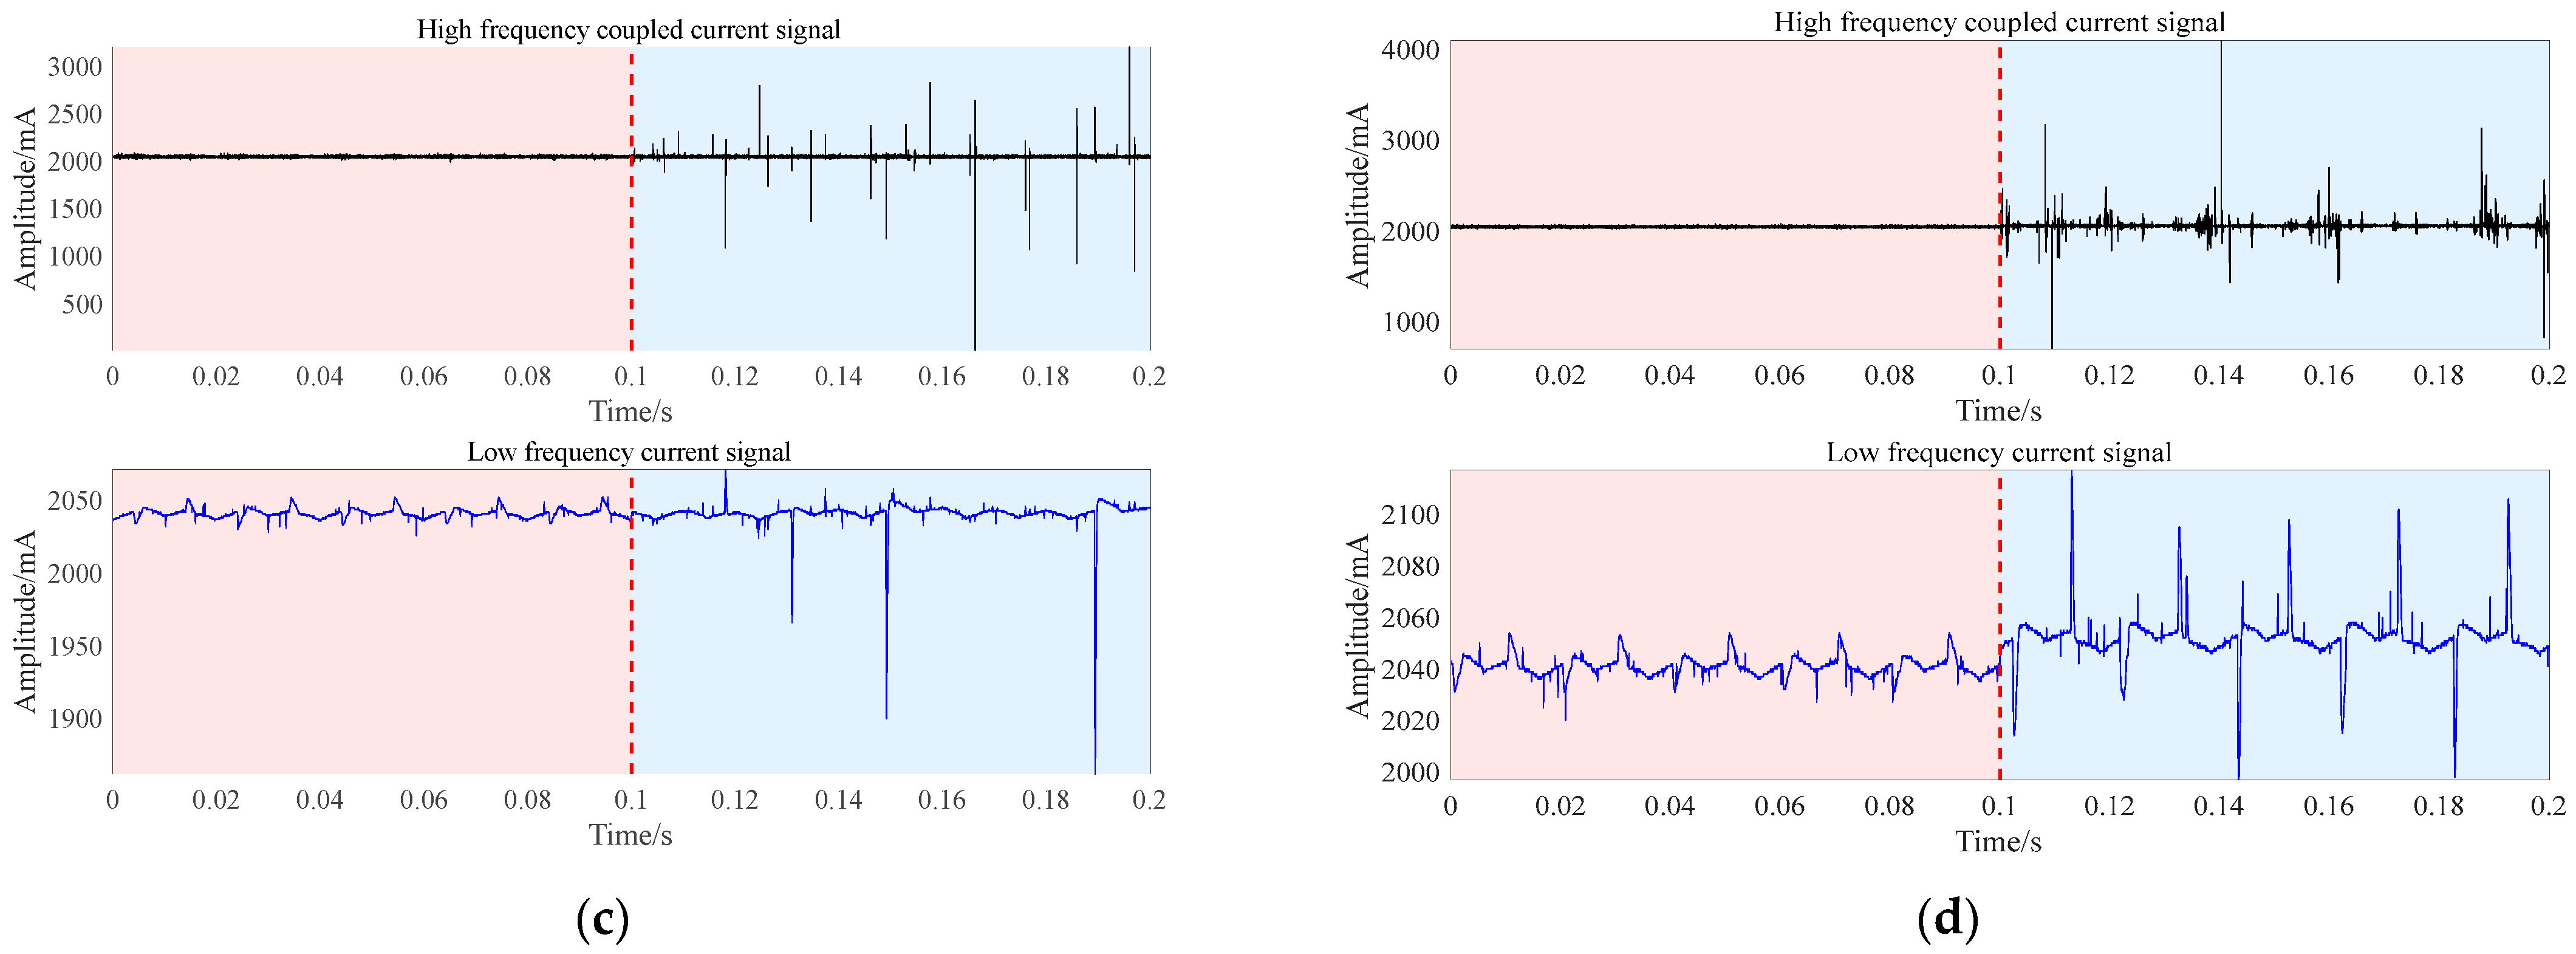
Figure 2 presents current data from four selected loads: electric fans, induction cookers, desk lamps, and humidifiers, capturing both normal operating conditions and arc discharge states. The analysis reveals distinct time-domain waveform variations (highlighted in pink sections) across different loads. While some exhibit sinusoidal patterns, others display triangular wave characteristics, with lingering effects during zero-crossing points. These variations reflect the impedance characteristics of each load and demonstrate how diverse electrical loads influence series-connected currents. Notably, current waveforms under specific loads maintain stable periodic patterns with consistent repetition between cycle periods.
In the arc state (blue portions in all figures), the current amplitude under most loads shows no significant increase compared to normal conditions, while under resistive loads, it even slightly decreases. The differences in time-domain waveform variations across different loads remain pronounced. Beyond the impact of impedance differences, randomly generated spikes, waveform defects, and zero-crossing interruptions caused by electric arcs introduce substantial diversity and randomness into the current waveform. This results in periodic variations in waveform characteristics under specific loads, with irregular patterns observed both within and between cycles.

2.2. Feature Design and Normalization

Let the zero-line cancellation signal of the fire be denoted as HF(n), where n = 1, 2, …, N, and N is the signal length. After calculating its first-order difference and denoted as DiffHF(n) (where n = 1, 2, …, N − 1), we obtain:
D i f f H F n = H F ( n + 1 ) H F ( n ) 2
The absolute value of the first-order difference signal is calculated and denoted as AbsDiffHF(n), which is given by:
A b s D i f f H F n = | D i f f H F n |
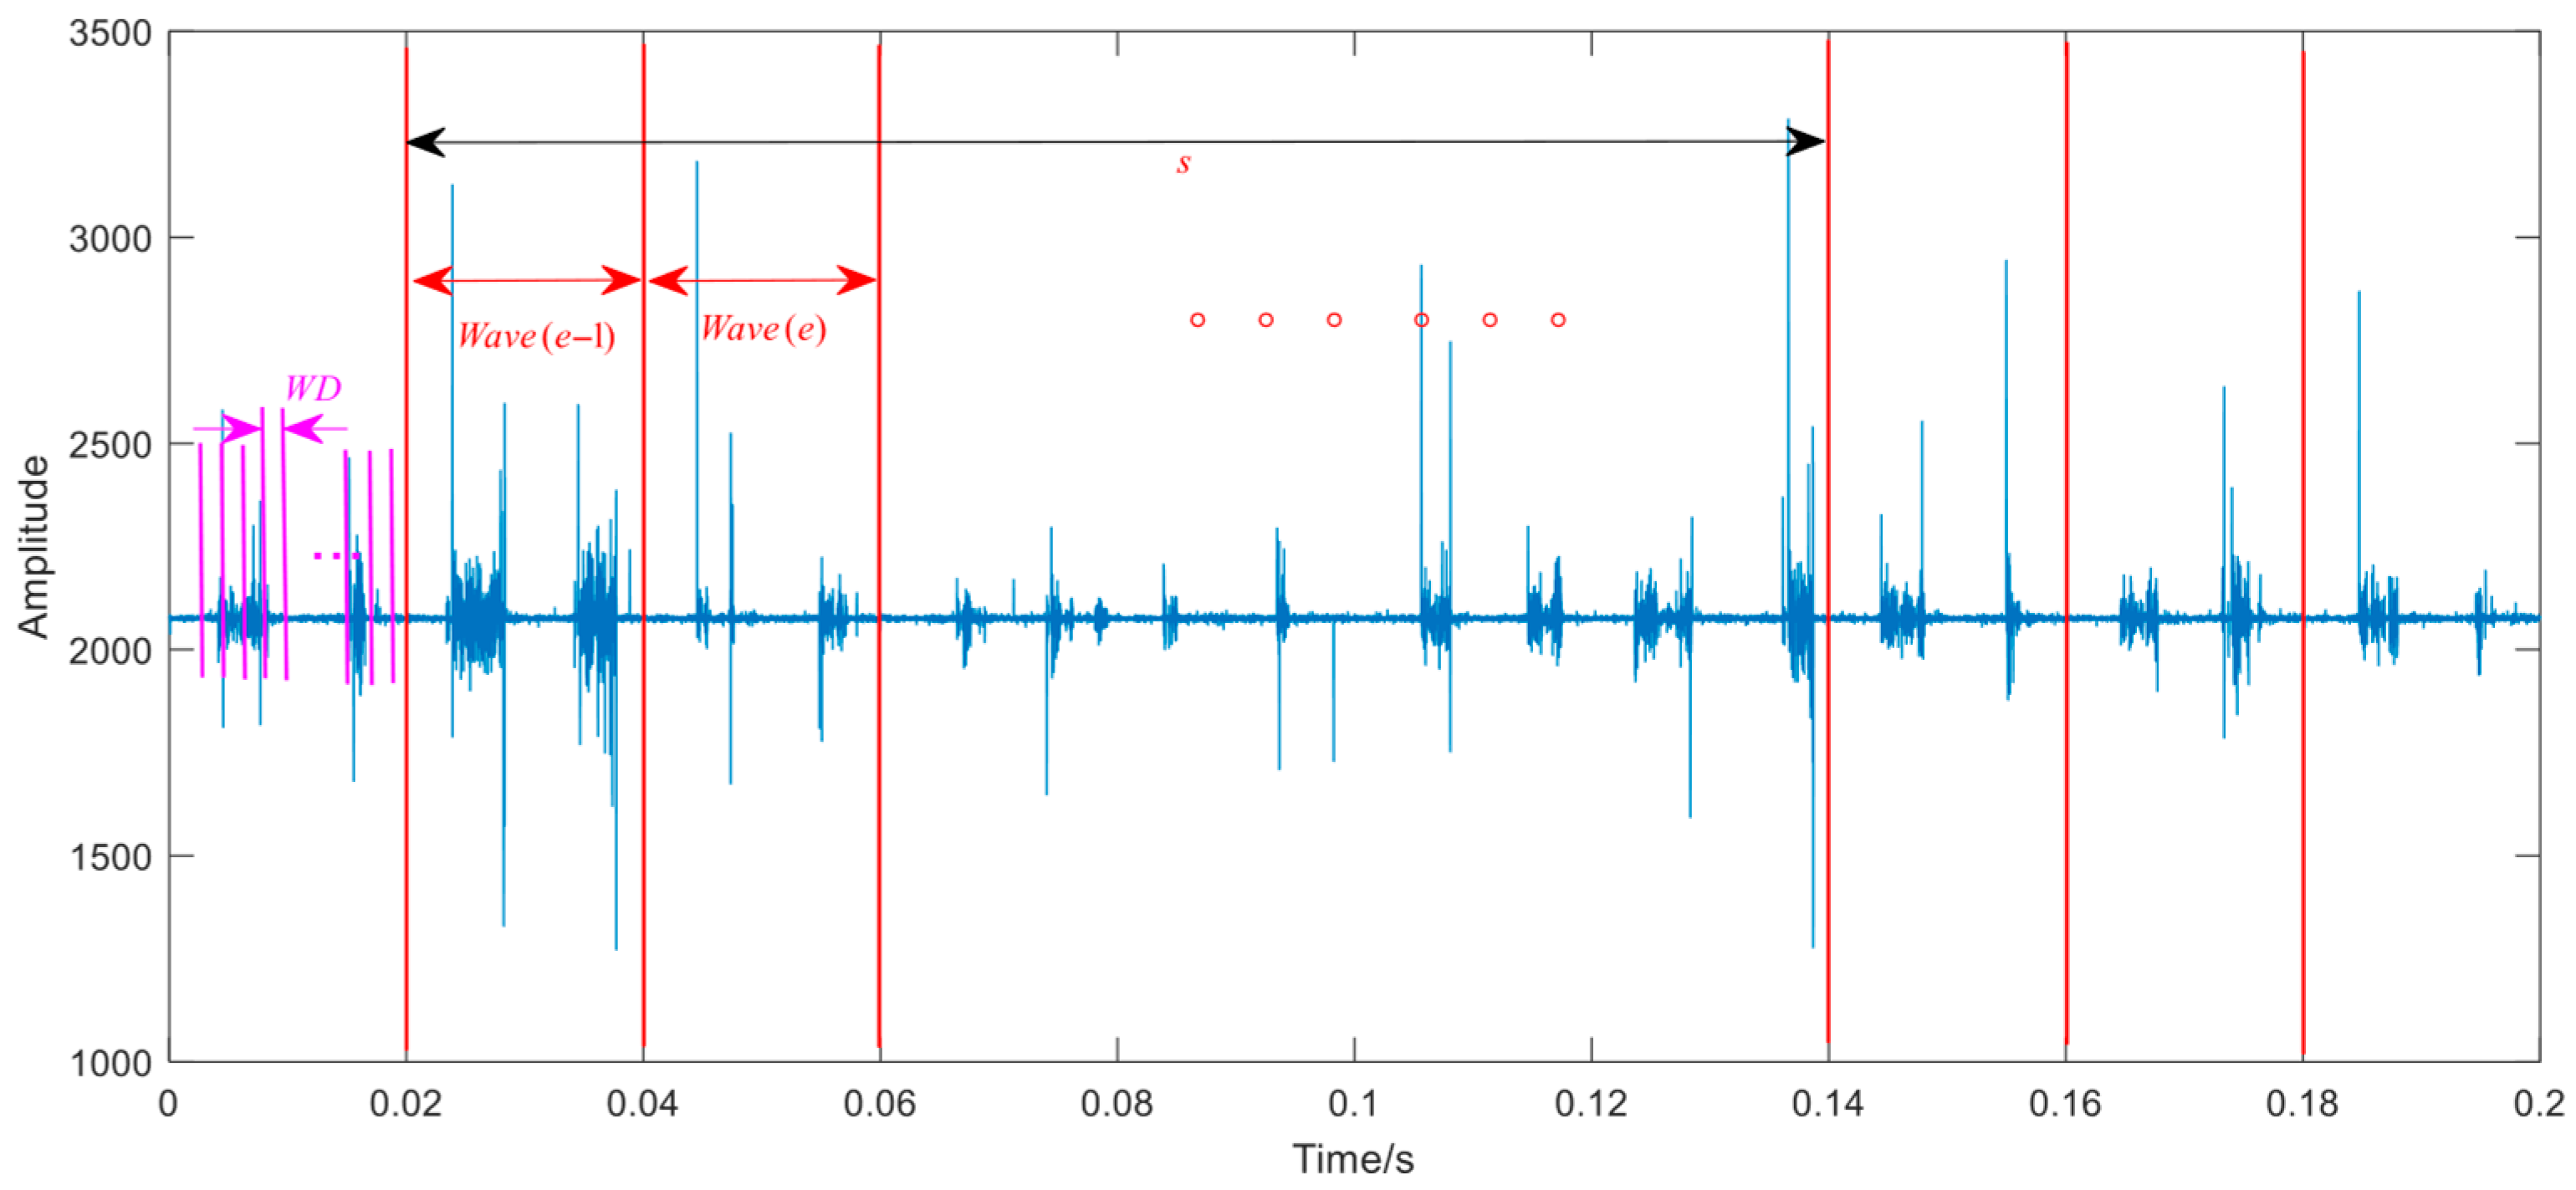
The AbsDiffHF(n) signal was used as the target for feature calculation. Fireline and neutral line pair cancellation signal feature extraction: The feature extraction dimensions are “WD sampling points-single full wave-multiple full waves”.
To eliminate potential signal biases in sampling equipment and account for power variations between identical and different loads for comparative analysis, the sampled data underwent zero-mean normalization preprocessing. When current amplitudes of certain loads slightly decrease after arc initiation, normalized processing of both normal and fault samples for these loads would mask this characteristic. Conversely, when currents exhibit intense spikes during arc operation, uniform normalization of normal and fault samples for such loads would significantly reduce the amplitude and energy of normal samples. As shown in Figure 3.
In practical application, it is reasonable and practical to sample a period of time to obtain several periodic samples and then normalize the sampling data. At the same time, the peak value of the sampling data cycle is recorded, which serves as the basis for judging whether the signal amplitude is decreasing or a sudden change or spike occurs.

3. RF-Adaboost Detection Algorithm

3.1. Random Forest Feature Selection

The fundamental concept of Random Forest (RF) involves employing the bootstrap method to resample data, where multiple samples are drawn back into the original dataset. For each sample, a decision tree is constructed. During decision tree construction, each node splits the feature space using randomly selected subsets, ultimately classifying samples with unknown labels through majority voting. When selecting features at decision nodes, the algorithm primarily employs criteria such as information gain, gain ratio, and Gini coefficient.
RF can use the out-of-bag error rate (OBB) to calculate the relative importance of features, and sort and screen features to evaluate the importance of each feature [16]. The algorithm flow of this study is shown in Figure 4.
In this paper, the RF classifier selects 30 trees for feature importance evaluation. The number of non-sampling is set to 10 each time, which has less impact on detection accuracy than the total number of features. The minimum observation number of each leaf is set to 8.
As shown in Figure 5, the study extracts 33 time-domain, frequency-domain, and wavelet packet energy features from high-frequency coupling current signals based on RF feature importance ranking. After calculating predictor importance estimates (PIE), nine features with PIE values exceeding 1.25 were selected to construct a reduced feature matrix, effectively reducing the feature dimensionality from 33 to 9. Compared to PCA-based feature reduction, the feature matrix derived through RF importance ranking retains the original data composition while preserving rich signal characteristic information.
Here are the nine features that made it to the final list.
(1)
The mean value of the full pulse amplitude of E is PMean_Mean:
P M e a n _ M e a n = 1 E e = 1 E [ 1 L l = 1 L [ 1 K l k = 1 K l p u l s e ( e , l , k ) ] ]
(2)
The pulse factor is the mean value of the pulse amplitude in the full wave E is PMean_Index:
P M e a n _ I n d e x = P M e a n _ M a x P M e a n _ M e a n
(3)
E is the mean of the maximum pulse interval in the full wave call PIntvalMax_Mean:
P I n t v a l M a x _ M e a n = 1 E e = 1 E 1 L l = 1 L [ max k = 1 , , K l 1 p u l s e I n t e r v a l ( e , l , k ) ]
(4)
E is the maximum value of the average pulse interval in the full wave call PIntvalMean_Max:
P I n t v a l M e a n _ M a x = max e = 1 , , E [ 1 L l = 1 L [ 1 K l 1 k = 1 K l 1 p u l s e I n t e r v a l ( e , l , k ) ] ]
(5)
The pulse factor of the average energy of the full wave E is E_Index:
E _ I n d e x = E _ M a x E _ M e a n
(6)
The mean value of the average current of E full wave is IMean_Mean:
I M e a n _ M e a n = 1 E e = 1 E 1 Q q = 1 Q L F ( e , q ) 2
(7)
The mean value of the full wave amplitude symmetry factor E is AmpSymIndex_Mean:
A m p S y m I n d e x _ M e a n = 1 E e = 1 E A m p S y m I n d e x ( e )
(8)
E is the maximum value of the full wave amplitude symmetry factor call AmpSymIndex_Max:
A m p S y m I n d e x _ M a x = max e = 1 , 2 , , E A m p S y m I n d e x ( e )
(9)
The number of current triangle changes in E full wave is TrianglePulseNum:
T r i a n g l e P u l s e N u m = T r i a n g l e P u l s e N u m + 1 i f C o d e I ( e + 1 ) C o d e I ( e ) = = 2   and   C o d e I ( e + 1 ) C o d e I ( e + 2 ) = = 2 or C o d e I ( e + 1 ) C o d e I ( e ) = = 2   and   C o d e I ( e + 1 ) C o d e I ( e + 2 ) = = 2
In this formula, the initial value of TrianglePulseNum is 0. CodeI(·) is the code of current change trend, which is defined as follows:
C o d e I ( e ) = 1 i f I w a v e ( e ) I w a v e ( e 1 ) I T H 0 I T H < I w a v e ( e ) I w a v e ( e 1 ) < I T H 1 I w a v e ( e 1 ) I T H
In this formula, ITH is the threshold of adjacent full wave current difference, which is obtained through optimization training.

3.2. Adaboost Classifier Optimization

The Adaboost classifier is trained using data filtered by feature selection. Its fundamental principle involves constructing multiple weak classifiers and enhancing overall recognition accuracy through weighted combinations. The training process employs 5-fold cross-validation to select optimal hyperparameters, with outputs including training accuracy, test accuracy, and various evaluation metrics.
Adaboost is an integrated algorithm that forms a strong learner through iterative learning of weak learners [17,18,19], and the process is as follows.
Assign initial weights to all data samples:
W 0 ( u ) = { ω 1 , ω 2 , , ω N }
In this formula, u = 1, 2, …, N, where N is the number of samples.
E = u = 1 N ω i I ( H i ( x u ) y u )
In this formula, H is the weak classifier; I ( · ) is the description weighted function, where i = 1, 2, …, M, represents the number of iterations; x u and y u are the sample data points.
Calculate the coefficient α i of the weak classifier in this iteration, that is, the proportion of the weak classifier in the final classifier:
α i = 1 2 ln ( 1 E E )
Update the sample weight, increase the weight for the sample with incorrect prediction, and decrease the weight for the sample with correct prediction:
W i + 1 = W i exp ( α i y u H i ( x u ) ) Z i
In this formula, W i is the weight of the sample in the i th iteration; Z i is the normalization factor, which is the sum of the weights of all samples.
The outputs of all weak classifiers are weighted according to their weight coefficients to obtain the final integrated learning results:
H ( x ) = s i g n ( i = 1 M α i H i ( x ) )

3.3. Decision Interpretability Analysis Based on SHAP

To address the interpretability challenges of AdaBoost models, the SHAP algorithm is introduced to explain the relationship between features and model classification outcomes, thereby enhancing model reliability. The SHAP algorithm is a game-theoretic approach that relies on Shapley values. By weighting the marginal contributions of all possible feature subsets through weighted averaging, it fairly allocates contribution values to each feature, thereby quantifying each feature’s impact on prediction outcomes. The formula for calculating Shapley values is:
ϕ i = s ( M S 1 ) ! S ! M ! F ( S { I } ) F ( S )
where S is all possible subsets excluding feature I; M is the total number of features; S is the number of features in S; F ( S { I } ) is the predicted value of S when feature I is included; F ( S ) is the predicted value of S.

4. Experimental and Result Analysis

4.1. Dataset and Evaluation Index

In order to evaluate the accuracy of the classification results of the model, this paper uses accuracy, sensitivity, specificity, F1 score and Kappa score to evaluate the classification effect of the model. The preprocessed data are divided into training set and test set in a ratio of 7:3 and then imported into AdaBoost model. In the training process, considering the large number of model parameters, optimizing all parameters will reduce the efficiency. Therefore, according to literature [20] and actual conditions, five main hyperparameters are selected, and the grid search method with 5-fold cross-validation is used to find the best parameter combination, while other hyperparameters remain default values. The best parameters of grid search are as follows: maximum depth estimator__max_depth is 1, learning rate learning_rate is 0.01, and the number of weak classifiers n_estimators is 50.
The visual analysis of test set classification results is shown in Figure 6a, which presents a comparison of binary prediction outcomes for 50 test samples. The model’s predicted values (Test values) show high consistency with true labels (True values), achieving an overall accuracy rate of 97.08%. The two distribution lines overlap in most sample ranges, visually demonstrating the model’s superior performance. Only 1–2 instances of deviation exist (slight separation observed in sample indices 7–10), providing reference points for subsequent error sample analysis.
Figure 6b presents the feature importance analysis results based on Shapley values, revealing the contribution mechanisms of nine low-voltage AC series arc features to the fault detection model. Features are ranked from top to bottom according to their global importance in descending order. The top-ranked feature, PIntvalMax_Mean(tz1), demonstrates the most significant impact on overall model prediction. Specifically, PIntvalMax_Mean(tz1), PMean Index(tz4), and PMean Mean(tz3) form core discriminant features with significantly higher average Shapley values than other features, indicating their dominant role in distinguishing arc states from normal conditions.
PMean_Mean (the mean of pulse amplitudes in E full-wave pulses) reflects the overall level of pulse amplitude in current signals. During arc generation, high-frequency pulse amplitudes significantly increase, so high values (red dots) typically trigger model predictions for “arc faults”, while low values (blue dots) tend to indicate “normal conditions”. PMean Index (pulse factor of average pulse amplitude) measures the concentration of amplitude distribution. In arc states, increased pulse amplitude variations lead to a marked rise in this indicator, positively contributing to model classification accuracy. PIntvalMax_Mean (mean of maximum pulse interval) reveals temporal sparsity of pulse occurrences. Normal conditions show relatively stable pulse intervals, whereas arc states exhibit increased interval fluctuations, significantly enhancing the model’s classification capability through this characteristic.
Figure 7a presents the ROC curve of the model in low-voltage series AC arc fault detection. The results show that both Class 1 (normal state) and Class 2 (arc state) achieved an AUC value of 0.99, with the micro-averaged AUC approaching 1.00 and the macro-averaged AUC remaining at 0.99, demonstrating the model’s exceptional sensitivity and specificity in distinguishing between these two categories. The ROC curve predominantly slopes upward, indicating that regardless of threshold adjustments, the model maintains a low false positive rate while achieving high detection accuracy.
Figure 7b shows the corresponding Precision–Recall (PR) curve. For Class 2, the area under the PR curve (AP value) reaches 0.998, indicating that the model maintains nearly perfect accuracy and recall rates when predicting normal states. For Class 1, the AP value is 0.913, slightly lower than Class 2 but still at an extremely high level, demonstrating the model’s highly reliable detection of arc states. The micro-average PR curve AP value of 0.995 further validates the model’s robustness in overall prediction tasks.
Based on the ROC and PR curve results, it can be concluded that the model has high classification performance in low-voltage series arc fault identification, which can take into account low false alarm rate and high detection rate, especially has strong generalization ability in distinguishing normal and fault states.

4.2. Result Comparison Analysis

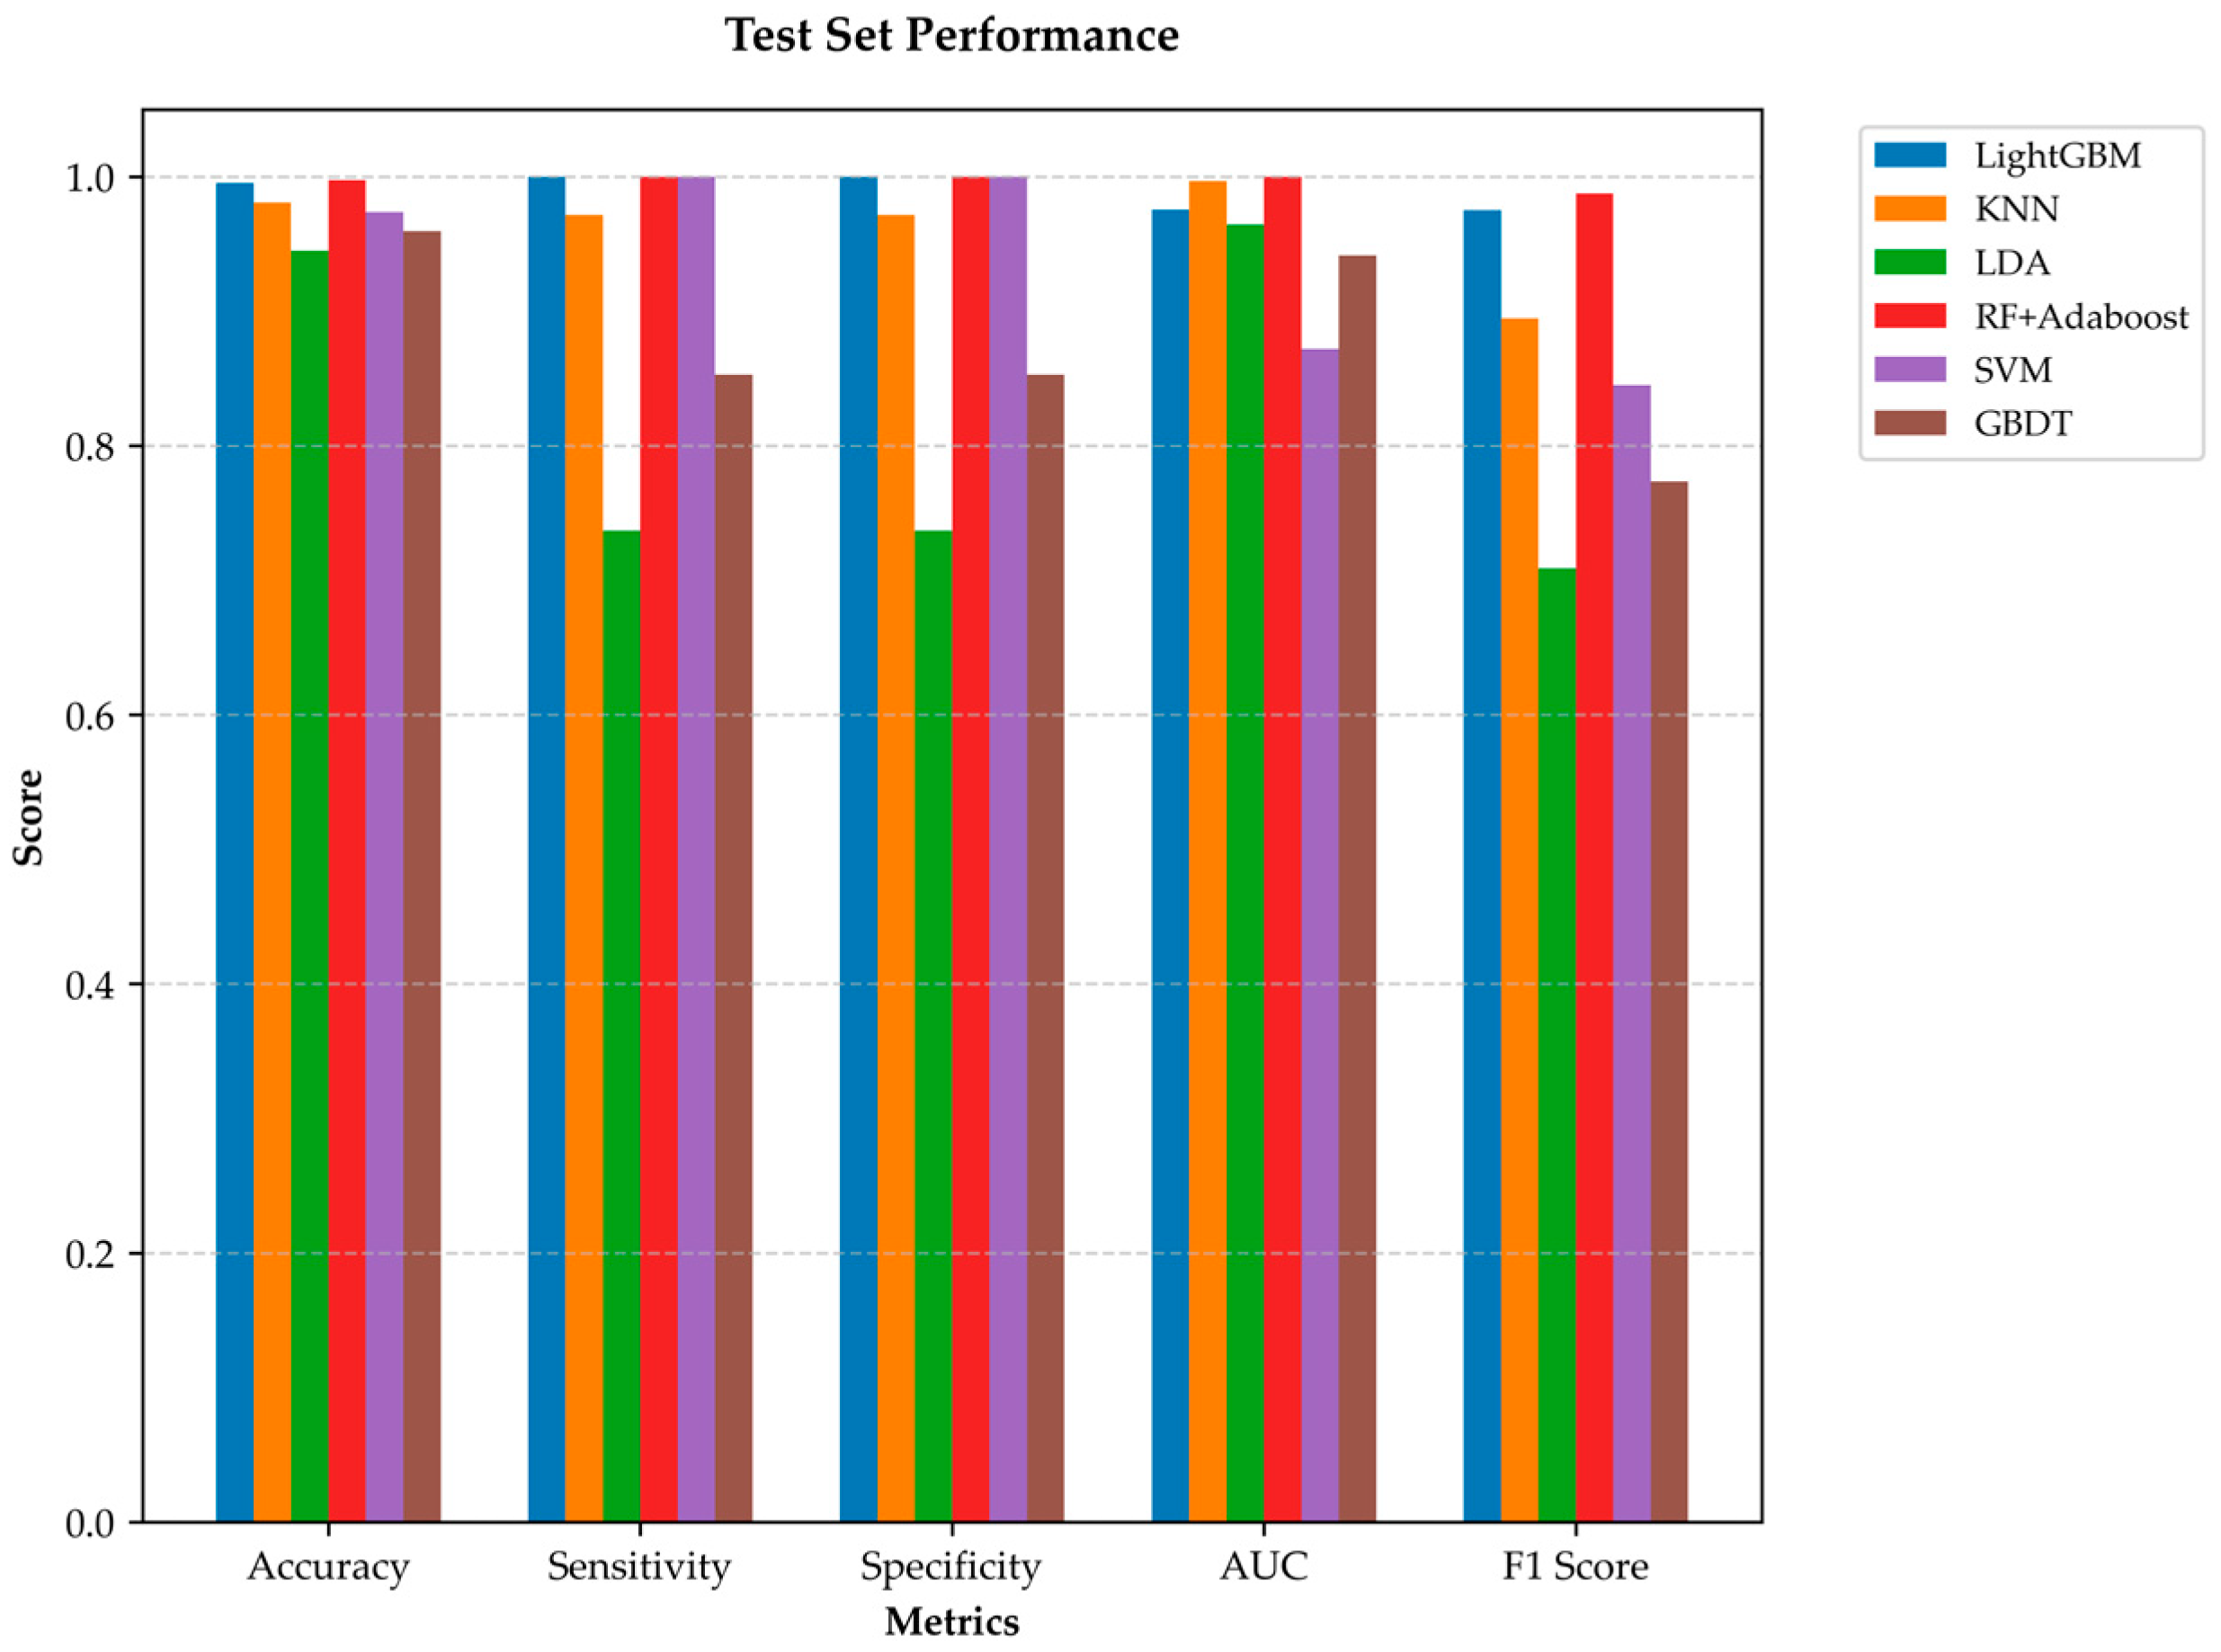
As can be seen from Table 1, the RF + Adaboost model shows comprehensive superiority among the six comparison algorithms: its five core indicators, such as accuracy (0.9708), sensitivity (0.9814), specificity (0.9815), F1 score (0.9803) and Kappa coefficient (0.9521), all rank first. Compared with the optimal contrast model (SVM), RF + Adaboost improves the accuracy by 0.83% and F1 score by 0.18%, while the Kappa coefficient is significantly increased by 2.12 percentage points, highlighting its significant advantages in classification consistency and comprehensive performance. It can be seen that the combination of RF and Adaboost can maintain high recognition rate after feature compression and has better generalization ability and execution efficiency.
Figure 8 presents a comparison chart of evaluation metrics for the test dataset across six models. The data in the figure demonstrates that the arc detection model proposed in this paper outperforms the other five arc fault detection models in diagnostic accuracy, sensitivity, specificity, AUC, and F1 score, exhibiting stable fault detection capabilities.

4.3. Confusion Matrix Analysis

As shown in Figure 9, Figure 9a and Figure 9b, respectively, display the confusion matrices of the Adaboost model on the training set and test set. In the training set (Figure 9a), the model achieves 100% accuracy in classifying both positive (label 1, 3550 samples) and negative (label 2, 7370 samples) samples, with no misclassifications occurring. This demonstrates the model’s exceptional performance in fitting the training data.
In the test set (Figure 9b), the model demonstrated outstanding overall performance. For label 1 (1434 samples), it correctly classified all 1434 instances with only 44 misclassified as label 2. For label 2 (3202 samples), it accurately categorized 3169 instances while incorrectly classifying 33 as label 1. Overall, the model maintained classification accuracy above 98% across the test set, showing balanced recognition performance between the two categories and demonstrating strong generalization capabilities. No significant performance degradation was observed in the test set, corroborating the previously reported 97.08% accuracy rate and highlighting the model’s robustness in imbalanced sample scenarios.

5. Conclusions

This paper proposed a hybrid detection framework for low-voltage series arc faults that integrates RF-based feature selection, Adaboost classification, and SHAP interpretability. The experimental results verified that the method achieves higher accuracy and robustness compared with conventional models, with an overall accuracy of 97.1% on the test dataset. Moreover, SHAP analysis highlighted the relative importance of key signal features, providing a transparent explanation of the classification process and bridging the gap between model predictions and physical mechanisms.
Compared with traditional shallow learning methods, the proposed approach shows superior adaptability to complex load environments while maintaining lower computational complexity than deep learning models. These advantages make it highly promising for real-time fault monitoring and embedded system applications. However, the main limitation of this method lies in its high computational complexity, which may lead to difficulties in real-time deployment. Meanwhile, model tuning is complicated, overfitting risk exists, and its performance is highly dependent on the quality and diversity of training data. The generalization ability on unknown loads still needs to be verified.
Future work will focus on expanding the method to detect multiple arc fault types (e.g., parallel and ground arcs), integrating advanced signal enhancement techniques, and validating the approach under large-scale power grid scenarios to further assess its engineering feasibility.

Author Contributions

Conceptualization, L.Q.; Methodology, L.Q.; Formal analysis, T.K.; Writing—original draft, L.Q.; Writing—review and editing, S.H. All authors have read and agreed to the published version of the manuscript.

Funding

This research received no external funding.

Data Availability Statement

The original contributions presented in this study are included in the article. Further inquiries can be directed to the corresponding author.

Conflicts of Interest

The authors declare no conflicts of interest.

References

  1. Yang, J.H.; Fang, H.Y.; Zhang, R.C.; Yang, K. An Arc Fault Diagnosis Algorithm using Multinformation Fusion and Support Vector Machines. R. Soc. Open Sci. 2018, 5, 180160. [Google Scholar] [CrossRef] [PubMed]
  2. Yu, Q.F.; Lu, W.H.; Yang, Y. Multi-branch Series Fault Arc Detection Method based on Deep Long Short-term Memory Network. J. Comput. Appl. 2021, 41 (Suppl. 1), 321–326. [Google Scholar]
  3. Zhang, S.W.; Zhang, F.; Wang, Z.J. Series Arc Fault Identification Method Based on Energy Produced by Wavelet Transformation and Neural Network. Trans. China Electrotech. Soc. 2014, 29, 290–295, 302. [Google Scholar]
  4. Jiang, R.; Fang, Y.D.; Bao, G.H. An Improved Mayr Model Applicable to Low Voltage Series Arc Faults. Electr. Appl. Energy Effic. Manag. Technol. 2019, 21, 14–18. [Google Scholar]
  5. Wang, H.T.; Kang, J.Y.; Lin, Y.G. Low-Voltage Series Arc Fault Detection Based on Multi-Feature Fusion and Improved Residual Network. Electronics 2025, 14, 1325. [Google Scholar] [CrossRef]
  6. Wang, R.; Ma, T.T.; Zhao, Y.C. A series photovoltaic DC arc fault locating method based on electromagnetic radiation delay estimation. Trans. China Electrotech. Soc. 2023, 38, 2233–2243. [Google Scholar]
  7. Wang, Y.; Liu, L.M.; Li, S.N. Arc Fault Detection based on Empirical Wavelet Transform Composite Entropy and Feature Fusion. Power Syst. Technol. 2023, 47, 1912–1919. [Google Scholar]
  8. Gao, Z.W.; Xiang, Y.H.; Lu, S.X.; Liu, Y.X. An optimized Updating Adaptive Federated Learning for Pumping Units Collaborative Diagnosis with Label Heterogeneity and Communication Redundancy. Eng. Appl. Artif. Intell. 2025, 152, 110724. [Google Scholar] [CrossRef]
  9. Yang, K.; Zhuang, H.H.; Dong, Y.L. Modeling of Electric Vehicle Driving Motor and Load Simulation System and Arc Fault Simulation Research. J. Electron. Meas. Instrum. 2024, 38, 237–245. [Google Scholar]
  10. Wang, W.; Xu, B.Y.; Zou, G.F. Low-voltage AC Series Arc Fault Detection Method based on Voltage Characteristic Energy. Power Syst. Prot. Control 2023, 51, 81–93. [Google Scholar]
  11. He, Z.P.; Li, W.L.; Deng, Y.Y.; Zhao, H. The Detection of Series AC Arc Fault in Low-Voltage Distribution System. Trans. China Electrotech. Soc. 2023, 38, 2806–2817. [Google Scholar]
  12. Shan, X.J.; Zheng, X. Research on Identification Model of Low Voltage Arc Characteristics Based on Wavelet Analysis. Electr. Energy Manag. Technol. 2021, 6, 7–14. [Google Scholar]
  13. Jiang, J.; Li, W.; Wen, Z.H. Series Arc Fault Detection based on Random Forest and Deep Neural Network. IEEE Sens. J. 2021, 21, 17171–17179. [Google Scholar] [CrossRef]
  14. Jin, H.; Gao, W.; Yang, G.J. An intelligent Detection Method for Series Arc Fault of Photovoltaic Array. Electrotech. Electr. 2025, 1, 3–47, 66. [Google Scholar]
  15. GB/T31143—2014; General Requirements for Arc Fault Detection Devices (AFDD). China National Standardization Administration: Beijing, China, 2014.
  16. Chou, Y.; Zhang, A.; Gu, J.; Liu, J.; Gu, Y. A recognition method for extreme bradycardia by arterial blood pressure signal modeling with curve fitting. Physiol. Meas. 2020, 41, 074002. [Google Scholar] [CrossRef] [PubMed]
  17. Xu, M.M.; Zhou, H.P.; Zhao, Y.Q. Research on the Detection of Forest Fire based on Spatiotemporal Features of Flame Video. J. For. Eng. 2016, 1, 134–140. [Google Scholar]
  18. Dash, P.K.; Rekha, P.S.; Prasad, E.N.V.D.V. Detection and classification of DC and feeder faults in DC microgrid using new morphological operators with multi class AdaBoost algorithm. Appl. Energy 2023, 340, 121013. [Google Scholar] [CrossRef]
  19. Zhi, N.; An, Y.W.; Zhao, Y. Intelligent Island Detection Method of DC Microgrid based on Adaboost Algorithm. Energy Rep. 2023, 9, 970–982. [Google Scholar] [CrossRef]
  20. Zeng, S.Q.; Deng, H.; Duan, J.H. Fitting Probability Distribution of Aedes Vector Density with Cubic Spline Function and Its Risk Assessment. Chin. J. Health Stat. 2024, 41, 414–418. [Google Scholar]
Figure 1. Arc experimental platform.
Electronics 14 03761 g001
Figure 2. High frequency coupling current signal and low frequency current signal of each load: (a) Normal and arc states of fan, (b) Normal and arc states of induction cooker, (c) Normal and arc states of lamp, (d) Normal and arc states of humidifier.
Electronics 14 03761 g002aElectronics 14 03761 g002b
Figure 3. Schematic diagram of “full wave-single full wave-multiple full wave”.
Electronics 14 03761 g003
Figure 4. Flow chart of the algorithm in this study.
Electronics 14 03761 g004
Figure 5. Bar chart of feature importance ranking.
Electronics 14 03761 g005
Figure 6. Model test results: (a) Test set classification results, (b) SHAP feature honeycomb diagram.
Electronics 14 03761 g006
Figure 7. ROC and Precision–Recall curves: (a) ROC curves, (b) Precision–Recall curves.
Electronics 14 03761 g007
Figure 8. Evaluation indicators of test set for 6 models.
Electronics 14 03761 g008
Figure 9. Confusion matrix: (a) Training set confusion matrix, (b) Test set confusion matrix.
Electronics 14 03761 g009
Table 1. Summarizes the evaluation indexes of the six models.
Test MethodAccuracySensitivitySpecificityF1 ScoreKappa Coefficient
RF + Adaboost0.97080.98140.98150.98030.9521
KNN0.96280.95330.95330.95220.9113
LDA0.92210.73180.76180.70360.9057
SVM0.96250.97920.98120.94850.9309
LightGBM0.97010.98120.98020.97080.8669
GBDT0.93710.94020.94020.78040.8923
Disclaimer/Publisher’s Note: The statements, opinions and data contained in all publications are solely those of the individual author(s) and contributor(s) and not of MDPI and/or the editor(s). MDPI and/or the editor(s) disclaim responsibility for any injury to people or property resulting from any ideas, methods, instructions or products referred to in the content.