Article

WTCMC: A Hyperspectral Image Classification Network Based on Wavelet Transform Combining Mamba and Convolutional Neural Networks

1
College of Automation, Jiangsu University of Science and Technology, No. 666 Changhui Road, Zhenjiang 212100, China
2
Systems Science Laboratory, Jiangsu University of Science and Technology, No. 666 Changhui Road, Zhenjiang 212100, China
*
Author to whom correspondence should be addressed.
Electronics 2025, 14(16), 3301; https://doi.org/10.3390/electronics14163301
Submission received: 29 July 2025 / Revised: 16 August 2025 / Accepted: 17 August 2025 / Published: 20 August 2025
(This article belongs to the Section Artificial Intelligence)

Abstract

Hyperspectral images are rich in spectral and spatial information. However, their high dimensionality and complexity pose significant challenges for effective feature extraction. Specifically, the performance of existing models for hyperspectral image (HSI) classification remains constrained by spectral redundancy among adjacent bands, misclassification at object boundaries, and significant noise in hyperspectral data. To address these challenges, we propose WTCMC—a novel hyperspectral image classification network based on wavelet transform combining Mamba and convolutional neural networks. To establish robust shallow spatial–spectral relationships, we introduce a shallow feature extraction module (SFE) at the initial stage of the network. To enable the comprehensive and efficient capture of both spectral and spatial characteristics, our architecture incorporates a low-frequency spectral Mamba module (LFSM) and a high-frequency multi-scale convolution module (HFMC). The wavelet transform suppresses noise for LFSM and enhances fine spatial and contour features for HFMC. Furthermore, we devise a spectral–spatial complementary fusion module (SCF) that selectively preserves the most discriminative spectral and spatial features. Experimental results demonstrate that the proposed WTCMC network attains overall accuracies (OA) of 98.94%, 98.67%, and 97.50% on the Pavia University (PU), Botswana (BS), and Indian Pines (IP) datasets, respectively, outperforming the compared state-of-the-art methods.

1. Introduction

Hyperspectral imaging technology captures detailed spatial information along with hundreds to thousands of continuous spectral bands, enabling the detection of spectral characteristics invisible to the human eye. The advancement in Earth observation techniques and imaging spectrometry has significantly expanded hyperspectral image applications, encompassing agricultural assessment [1], environmental monitoring [2,3], mineral exploration, medical diagnostics [4,5,6,7], military target detection [8,9], atmospheric research [10], and ground cover classification. Among these applications, hyperspectral image classification, which aims to assign each pixel to its correct ground-truth category, plays a pivotal role in the precise identification of mineral resources, land use patterns, and biodiversity conservation.
Initially, hyperspectral classification predominantly employed traditional machine learning methods, such as random forest [11], support vector machines (SVM) [12], linear discriminant analysis (LDA) [13], sparse representation classification [14], and k-nearest neighbors (KNN) [15], often in combination with feature extraction or dimensionality reduction techniques like principal component analysis (PCA) [16] and Gabor filters [17]. Although these methods achieve benchmark classification accuracy, they emphasize only spectral features while neglecting rich spatial information, which constrains performance and limits broader applicability.
With the rapid development of deep learning, convolutional neural networks (CNNs) have significantly advanced hyperspectral image classification, owing to their powerful capability in extracting localized features. Hu et al. [18] first introduced the one-dimensional (1D) convolutional network for pixel-level spectral feature extraction. Subsequently, Lee et al. [19] proposed two-dimensional (2D) convolution for spatial feature extraction, while Hamida et al. [20] advanced the field further with three-dimensional (3D) convolution, enabling simultaneous spectral and spatial feature extraction. In addition, transformers have improved HSI classification accuracy by capturing long-range dependencies. Ahmad et al. [21] proposed a pyramid hierarchical spatial–spectral transformer that partitions inputs into multi-level pyramid segments, increasing efficiency on long sequences. Roy et al. [22] introduced a multimodal fusion transformer that integrates LiDAR to enhance classification. However, the quadratic complexity of standard self-attention with sequence length [23] poses practical challenges for HSI with hundreds of spectral bands.
Recently, the Mamba model has been proposed as a computationally efficient alternative to transformers, characterized by linear complexity, thus effectively handling longer input sequences of hyperspectral images. Additionally, the Mamba architecture integrates a selective attention mechanism to enhance input feature differentiation. Several Mamba-based models have been developed: Wang et al. [24] introduced the S2Mamba, employing selective state-space mechanisms for feature extraction in both spatial and spectral dimensions; and Liu et al. [25] developed HyperMamba, which adaptively scans spatial neighborhoods and dynamically refines spectral band features.
Although all the aforementioned methods have demonstrated effectiveness in enhancing the classification accuracy of hyperspectral images, several critical challenges still require further refinement. First, extracting spatial and spectral features independently and fusing them only at a later stage of the network often results in insufficient feature extraction [26]. Second, pronounced similarity and redundancy among adjacent spectral bands in hyperspectral images, together with interference between neighboring land-cover classes, hinder the extraction of discriminative spectral cues and increase boundary misclassification [27]. Finally, different ground cover types exhibit varying degrees of reliance on spatial or spectral features [24]. Ineffective fusion strategies often fail to preserve the most discriminative information, ultimately compromising classification performance. To overcome these challenges, we propose WTCMC—a novel hyperspectral image classification network based on wavelet transform combining Mamba and convolutional neural networks. The wavelet transform highlights image contour details, while CNNs are leveraged to capture contour features in the high-frequency domain and Mamba is designed to efficiently model long-sequence spectral dependencies in the low-frequency domain.
The main contributions of this study are summarized as follows:
  • We introduced a shallow feature extraction (SFE) module that leverages efficient 3D and 2D convolutional architectures to jointly capture spatial and spectral features at early network stages.
  • We proposed a low-frequency spectral mamba (LFSM) module that effectively suppresses spectral redundancy and adaptively recalibrates global spectral weights in the low-frequency domain, thereby mitigating noise and enhancing spectral representation.
  • We developed a high-frequency multi-scale convolution (HFMC) module, tailored for detailed spatial feature extraction, which accentuates image contours and reduces class boundary confusion in the high-frequency domain.
  • We designed a spectral–spatial complementary fusion (SCF) module that adaptively integrates spatial and spectral representations, selectively preserving the most discriminative features to optimize classification accuracy.

2. Related Works

With the rapid advancement of deep learning, neural network architectures including convolutional neural networks (CNNs) and Mamba have emerged as significant tools in hyperspectral image (HSI) classification. CNNs excel in local feature extraction, while Mamba models are particularly effective in modeling long-range dependencies. In addition, wavelet transform is an effective means of data preprocessing, which can capture both coarse trends and fine local variations. These advances have motivated the extensive exploration of novel and hybrid approaches to HSI classification.

2.1. Hyperspectral Image Classification Based on Wavelet Transform

Wavelet transform provides an effective preprocessing strategy for hyperspectral images. Ahmad et al. [28] presented a spectral–spatial wavelet transformer network (WaveFormer). It employs wavelet transform for invertible downsampling, which preserves data integrity while enabling attention learning. Seydi et al. [29] introduced a wavelet-based Kolmogorov–Arnold network (wav-kan) that uses wavelet functions as learnable activation functions, allowing the model to capture multi-scale spatial and spectral structure through scaling and translation. Ahmad et al. [30] further proposed a spatial–spectral wavelet Mamba (WaveMamba), which integrates wavelet transform with a spatial–spectral Mamba backbone to enhance interactions between spectral and spatial cues for HSI classification.
These deep learning models exploit wavelet transform in distinct ways. In addition, wavelet transform can also enhance the contour features and reduce noise in hyperspectral images.

2.2. Hyperspectral Image Classification Based on Convolutional Neural Networks

CNNs have demonstrated exceptional capabilities in extracting localized spatial and spectral features, leading to extensive applications in hyperspectral image classification. Several CNN variants have been specifically proposed to enhance spectral and spatial feature extraction. Jiang et al. [31] developed a fully convolutional neural network with integrated channel and spatial attention mechanisms, enhancing discriminative power. Zhao et al. [32] proposed a deformable convolutional model guided by superpixels, significantly enhancing the ability to adapt to the distribution of ground covers. Wu et al. [33] proposed a multiscale spatial–spectral shuffling convolution integrated with a 3-D lightweight transformer (MSC-3DLT) for HSI classification. They adopted a multi-scale strategy, shuffling multi-scale features to refine spatial–spectral granularity and enhance cross-scale feature interactions.
These methods employ multi-scale feature extraction and add attention mechanisms to strengthen feature representations. Nevertheless, spectral redundancy and ambiguous boundary contours in hyperspectral images still present challenges.

2.3. Hyperspectral Image Classification Based on Mamba

Mamba models, characterized by linear computational complexity and selective attention mechanisms, have recently gained attention for hyperspectral image analysis. He et al. [34] introduced a three-dimensional spectral–spatial Mamba model (3DSS-Mamba), effectively overcoming the limitations of the traditional Mamba model that struggles to adapt to high-dimensional data. Zhuang et al. [35] proposed a frequency-aware hierarchical Mamba model specifically designed to enhance feature representations within the frequency domain. Huang et al. [36] proposed a dual-branch spatial–spectral Mamba for independent spatial and spectral feature extraction. Bai et al. [37] presented a lightweight helical-scanning Mamba, mitigating spatial information loss during sequence transformation. Li et al. [38] introduced MambaHSI, achieving high accuracy through spatial and spectral feature extraction blocks. Yao et al. [39] proposed SpectralMamba, which employed segmented scanning optimized for hyperspectral images with extensive spectral bands.
Mamba-based approaches have been shown to improve both classification accuracy and computational efficiency. In this paper, we couple wavelet transform with Mamba and CNNs. Wavelet transform separates high-frequency and low-frequency content so that high-frequency subbands highlight fine spatial detail and edge contours, while low-frequency components preserve global structure and attenuate noise. Leveraging Mamba’s efficiency, long spectral sequences are modeled with the aim of extracting discriminative spectral features in the low-frequency domain, while multi-scale convolutions are introduced to capture detailed spatial structure in the high-frequency domain. Table 1 summarizes the key differences between this study and prior work.

3. Proposed Method

In this study, we propose WTCMC—a novel hyperspectral image classification network based on Wavelet Transform combining Mamba and convolutional neural networks. The overall architecture of the proposed method is illustrated in Figure 1, comprising four primary modules: shallow feature extraction (SFE), low-frequency spectral Mamba (LFSM), high-frequency multi-scale convolution (HFMC), and spectral–spatial complementary fusion (SCF).
The SFE module leverages both 3D and 2D convolutional blocks to extract shallow spectral and spatial features, with the goal of providing a comprehensive early-stage representation of hyperspectral data. The LFSM module segments spectral bands into distinct groups, which is designed to mitigate redundancy between adjacent spectral bands. The HFMC module employs multi-scale convolutional operations to capture detailed spatial and contour features from high-frequency subbands, aiming to reduce interference between adjacent yet distinct ground cover types. The SCF module adaptively selects significant spectral and spatial regions, intended to effectively integrate these features to enhance classification performance. The wavelet transform aims to minimize noise interference in LFSM and accentuate detailed spatial information within HFMC.

3.1. Preliminaries

3.1.1. Mamba Model

The state space model (SSM) is a fundamental component within the Mamba framework, characterized by an input sequence x ( t ) , a hidden state h ( t ) , and an output sequence y ( t ) . The SSM effectively models the relationship between input and output sequences through the hidden state, as described by the following ordinary differential equations:
h ( t ) = A h ( t ) + B x ( t )
y ( t ) = C h ( t ) + D x ( t )
In Equations (1) and (2), A represents the state matrix, governing the internal state of the system over time; B denotes the input matrix, reflecting the influence of the input on the hidden state; C signifies the output matrix, mapping the hidden state to the output; and D, typically unused, represents a feed-forward matrix.
Given that computational systems process discrete data, discretization of the SSM parameters is necessary. Employing zero-order hold, the discretized forms of the state matrix A and input matrix B become
A ¯ = e Δ A
B ¯ = ( Δ A ) 1 ( e Δ A I ) Δ B
In Equations (3) and (4), Δ is the time-scale parameter representing the sampling interval. Consequently, the discrete state and output equations are
h k = A ¯ h k 1 + B ¯ x k
y k = C h k + D x k
For parallel training purposes, these equations can be reformulated into a convolutional structure, leading to the following output representation:
y = x K ¯ ,
where the convolutional kernel K ¯ is defined as K ¯ = ( C B ¯ , C A ¯ B ¯ , , C A ¯ L 1 B ¯ ) , and L represents the length of the input sequence.
Despite its effectiveness, the traditional SSM is linear and time-invariant, with fixed matrices A, B, and C, limiting its adaptability to diverse inputs. To address this limitation, the selective state space (S6) model was introduced, defining Δ , B, and C as input-dependent functions. Specifically, for an input x with shape (B, L, D), matrices B and C transition from dimensions (D and N) to dimensions (B, L, and N), and the parameter Δ expands from D to (B, L, and D). Consequently, each input token possesses unique matrices B and C, enhancing adaptability. However, this variability in B and C matrices precludes parallel computation through traditional convolutional operations. To mitigate this, Mamba introduces hardware-aware optimization designs. In summary, Mamba’s contributions include selective input processing, hardware-optimized computation, and simplified architectural design, significantly improving adaptability and computational efficiency.

3.1.2. Wavelet Transform

Wavelet transform is widely utilized in data preprocessing tasks due to its capability to simultaneously emphasize detailed spatial information and retain overarching structural features. By “scanning” the original image using wavelets at various scales and measuring similarity, it effectively distinguishes between slow-varying continuous characteristics (low-frequency components) and rapidly changing, localized features (high-frequency components). Following wavelet transform, an image is decomposed into four distinct wavelet subbands: the low-frequency subband ( L L ) and three high-frequency subbands ( L H , H L , and H H ). Each subband preserves essential features from the input image. Specifically, the L L subband maintains general structural and global information, while the L H , H L , and H H subbands predominantly represent detailed spatial and contour edge information. Among various wavelet types, the Haar wavelet is particularly advantageous due to its computational simplicity, high efficiency, and heightened sensitivity to spatial edges between different ground cover types. Consequently, this study employs the Haar wavelet.
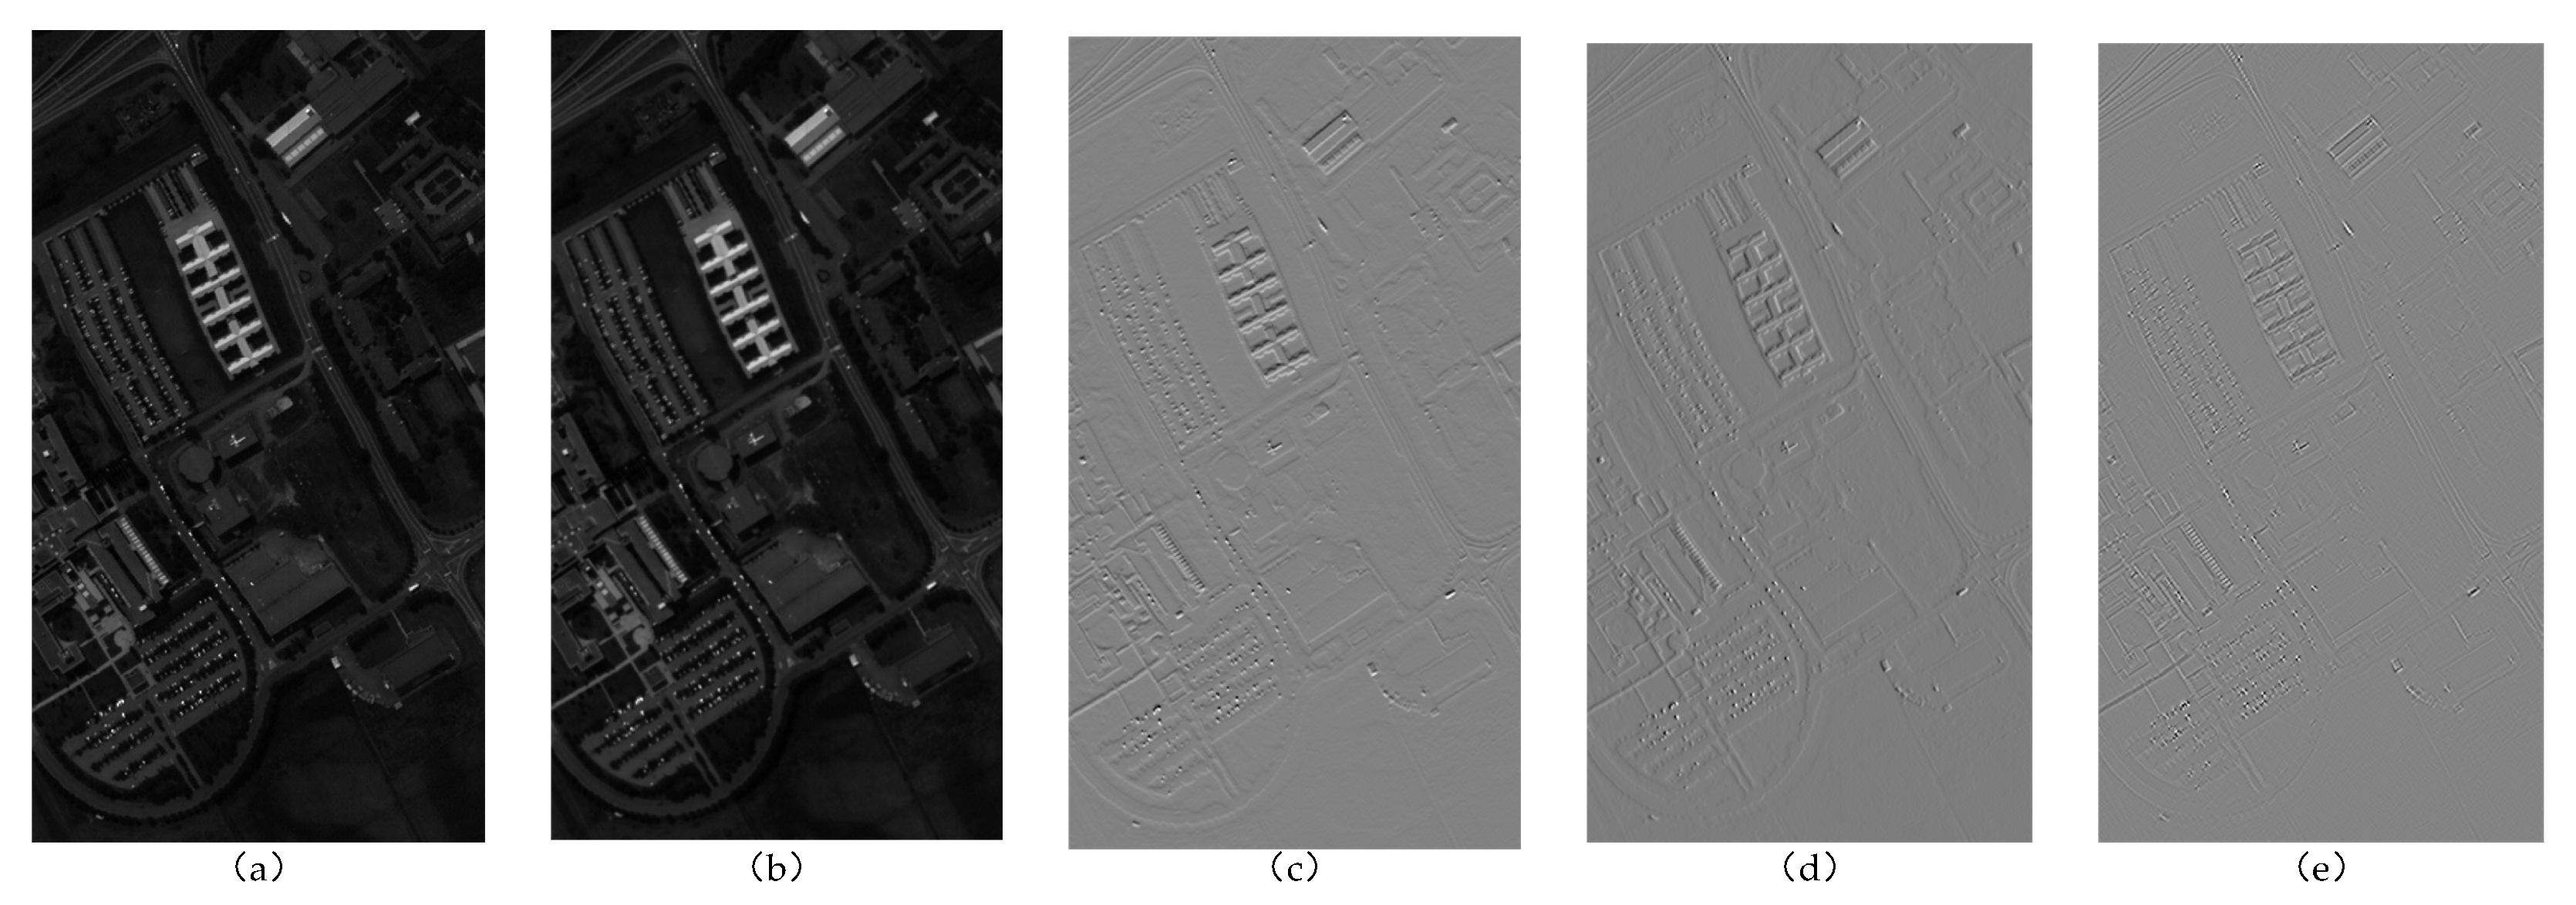
The effectiveness of wavelet transform in enhancing detailed spatial features and contour edge recognition is illustrated in Figure 2. The figure presents a representative band from the PU dataset, displaying (a) the original image, (b) the low-frequency subband LL, and (c), (d), and (e), the high-frequency subbands LH, HL, and HH, respectively. It can be observed that the low-frequency subband preserves the fundamental structure and global information, whereas the high-frequency subbands prominently highlight intricate details and edges. Therefore, applying wavelet transform effectively reduces noise interference for the low-frequency spectral Mamba module and enhances detailed spatial feature extraction in the high-frequency multi-scale convolution module.

3.2. Shallow Feature Extraction Module (SFE)

Hyperspectral images contain abundant spatial and spectral information. However, extracting spatial and spectral features independently can disrupt the inherent correlations between these features, consequently impairing subsequent deep feature extraction and lowering classification accuracy. To address this issue, we propose the shallow feature extraction module, leveraging the strength of CNNs in effectively extracting early-stage features. Specifically, our SFE module combines simple yet efficient 3D and 2D convolutional neural networks.
Due to the high dimensionality of hyperspectral images, which typically encompass hundreds or even thousands of spectral bands, redundant and non-informative bands are common, substantially increasing computational complexity. Principal component analysis (PCA) effectively mitigates this issue by compressing spectral dimensions while preserving critical information. Therefore, we initially apply PCA to reduce spectral dimensionality, subsequently dividing the resulting data into multiple smaller image patches for processing. As depicted in part (a) of Figure 1, the original hyperspectral image with dimensions (H, W, and C) undergoes PCA and is then segmented into patches, where each patch has dimensions (s, s, and p). Each image patch’s classification result corresponds to the central pixel’s class.
Figure 3 presents a detailed overview of the SFE module’s workflow. Initially, the image patches undergo a 3D convolution, followed by batch normalization and the PReLU activation function. The 3D convolution block effectively integrates shallow spatial and spectral information, mathematically represented as follows:
x = c o n v 3 d ( x )
x = B a t c h N o r m 3 d ( x )
x = P R e L U ( x )
In Equations (8)–(10), c o n v 3 d ( · ) denotes the 3D convolution operation, B a t c h N o r m 3 d ( · ) indicates batch normalization, and P R e L U ( · ) represents the Parametric Rectified Linear Unit ( P R e L U ) activation function.
Subsequently, the feature maps pass through a 2D convolution block that mirrors the structure of the 3D convolution block, comprising 2D convolution, batch normalization, and P R e L U activation. A single 3D convolutional layer is insufficient to capture the structure of spectral and spatial cues. Rather than stacking additional 3D layers, we insert lightweight 2D convolutional blocks. This is not to duplicate the 3D operation but to refine spatial structures after the initial spectral–spatial mixing.

3.3. Low-Frequency Spectral Mamba Module (LFSM)

The proposed low-frequency spectral Mamba module is specifically designed to address redundancy among adjacent spectral bands and reduce noise interference, facilitating comprehensive spectral feature extraction.
As illustrated in part (c) of Figure 1, features extracted by the shallow feature extraction (SFE) module first undergo bilinear interpolation, effectively doubling the feature sizes. This interpolation serves two critical purposes: (1) amplifying detailed spatial contours and fine image features, and (2) preserving feature sizes post-wavelet transform. Subsequently, the upscaled features undergo wavelet decomposition, as represented by the following equations:
x d o u b l e = i n t e r p o l a t e ( x )
x L L , x L H , x H L , x H H = w a v e l e t ( x d o u b l e )
In Equations (11) and (12), x d o u b l e denotes the interpolated image patches with doubled sizes, and x L L , x L H , x H L , and x H H correspond to the low-frequency and three high-frequency subbands generated by the wavelet transform, respectively.
The low-frequency subband x L L is then input into the LFSM module. Within LFSM, the spectral dimension C is partitioned into G non-overlapping groups, where each group contains N = C / G contiguous spectral bands. For each group, the N spectral bands are treated as the embedding dimension, and the number of groups G defines the input sequence length for the Mamba model. The output from the Mamba model incorporates residual connections to minimize information loss. The operational details of the spectral grouping and sequential scanning mechanism are demonstrated in Figure 4. Mathematically, the LFSM module’s input–output relationship is expressed as
x L F S M = x L L + m a m b a ( x L L ) ,
where m a m b a ( · ) denotes the base Mamba block, and x L L , x L F S M correspond to the LFSM’s input and output.

3.4. High-Frequency Multi-Scale Convolution Module (HFMC)

In the high-frequency multi-scale convolution (HFMC) module, we utilize a multi-scale feature extraction approach to effectively capture detailed spatial information from high-frequency wavelet subbands. The workflow is depicted in Figure 5. The three high-frequency subbands ( x L H , x H L , x H H ) are processed separately through three distinct branches, with different branches employing convolution kernels of different scales to capture multi-scale spatial features. Specifically, the first branch utilizes a convolutional kernel size of (3, 3), whereas the second and third branches adopt larger convolutional kernels of (5, 5) and (7, 7), respectively. Notably, after SFE processing, the feature map has spatial dimensions of 9 × 9 . To capture spatial dependencies at multiple scales, we apply the three convolutional kernel sizes introduced above, which yield receptive fields ranging from fine local neighborhoods to broader context across the patch. This design preserves local detail while aggregating larger contextual cues. Each branch involves three sequential operations: depthwise convolution, batch normalization, and activation using the Parametric Rectified Linear Unit ( P R e L U ).
The operations for each branch can be mathematically represented (taking the LH subband as an example) as follows:
x = c o n v 2 d ( x L H )
x = B a t c h N o r m 2 d ( x )
x H F M C = P R e L U ( x )
In Equations (14)–(16), c o n v 2 d ( · ) denotes the depthwise convolution, B a t c h N o r m 2 d ( · ) represents the batch normalization process, and P R e L U ( · ) signifies the activation function.
By applying convolutions with varying receptive fields, the HFMC module effectively extracts discriminative spatial features and accurately identifies the contours between adjacent yet distinct ground cover types. This capability significantly alleviates the issue of classification confusion between neighboring classes. Hence, the HFMC module capitalizes on the inherent strengths of high-frequency subbands obtained from the wavelet transform, thereby enhancing the overall classification accuracy.

3.5. Spectral–Spatial Complementary Fusion Module (SCF)

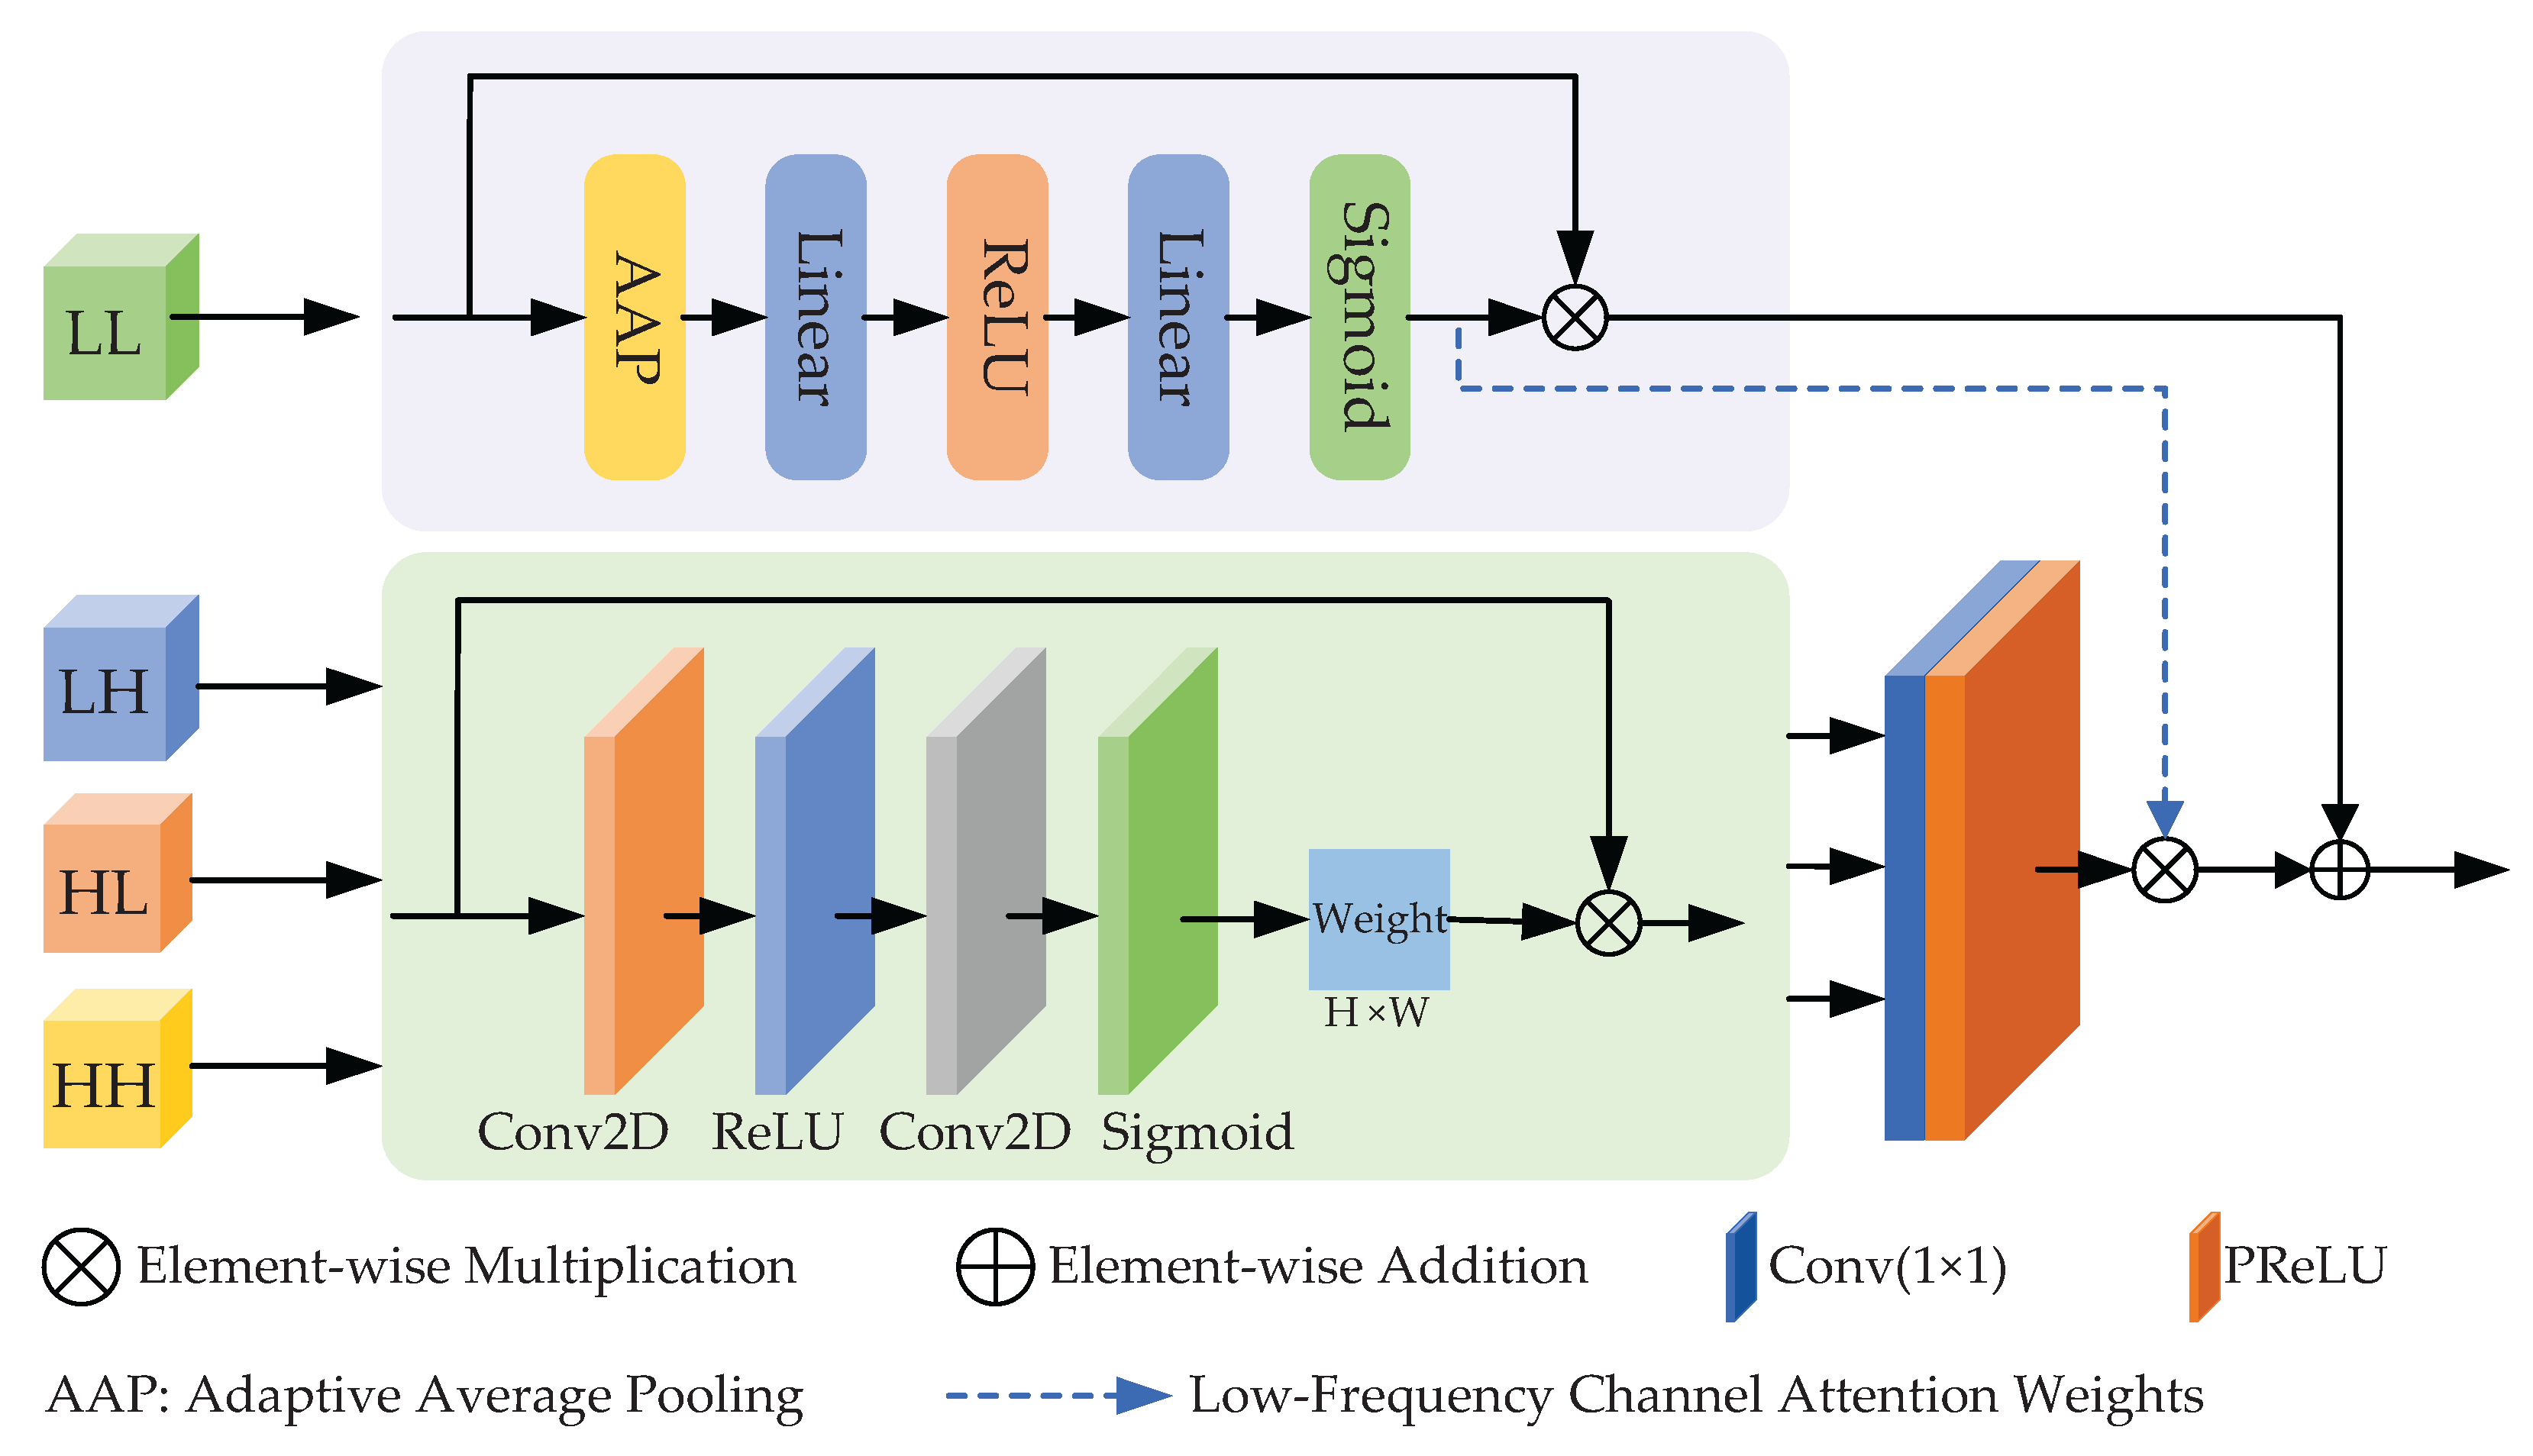
In hyperspectral image regions characterized by homogeneity and simple texture, spectral features play a dominant role in distinguishing classes. Conversely, in regions with more complex spatial patterns and textures, spatial features become increasingly critical for accurate classification. A simplistic concatenation of spatial and spectral features fails to account for this adaptive dependence and cannot effectively distinguish between informative and noisy components. Thus, an advanced and effective fusion mechanism is essential. The proposed SCF module overcomes these limitations by employing dual adaptive attention mechanisms for spectral and spatial domains, as illustrated in Figure 6.
First, spectral features extracted by the LFSM module are adaptively re-weighted channel-wise. Specifically, adaptive average pooling is applied to aggregate global information, followed by two linear layers and a nonlinear activation. The resulting values are then passed through a sigmoid function to generate channel-wise attention weights, providing an importance score for each channel. The formula flow is as follows:
x = A d a p t i v e A v g P o o l ( x L F S M )
x = L i n e a r ( R e L U ( L i n e a r ( x ) ) )
a t t s p e = S i g m o i d ( x )
x s p e = x L F S M × a t t s p e
In Equations (19) and (20), a t t s p e is the attention weight and x s p e is the weighted feature.
In parallel, spatial features derived from the HFMC module are refined through spatial attention. A 2D convolution reduces the channel dimension, followed by a R e L U activation and another convolution to produce a spatial attention map via a sigmoid function. The formula flow is as follows:
x = c o n v ( R e L U ( c o n v ( x H F M C ) ) )
a t t s p a = S i g m o i d ( x )
x s p a = x H F M C × a t t s p a
In Equations (22) and (23), a t t s p a is the attention weight and x s p a is the weighted feature.
Then, the channel attention derived from spectral features is further applied to the spatial features. The spatial features are re-weighted using the spectral attention weights. Finally, the output is the sum of the weighted spectral and spatial features. The formula is as follows:
x s p a = x s p a × a t t s p e
x o u t p u t = x s p e + x s p a
In Equations (24) and (25), x s p e is the final spectral feature, x s p a is the final spatial feature, and x o u t p u t is the feature after final fusion.

4. Experimental Results and Analysis

4.1. Experimental Datasets

To comprehensively evaluate the effectiveness of the proposed method, experiments are conducted on three widely recognized hyperspectral image datasets: the Pavia University dataset (PU) [40], the Botswana dataset (BS) [40], and the Indian Pines dataset (IP) [40].
Pavia University dataset: The dataset was collected by the ROSIS sensor over the Pavia region in northern Italy. The image size of the PU dataset is 610 × 340 with a spatial resolution of 1.3 m. The dataset retains 103 spectral dimensions after removing the noise bands. In addition, the dataset has nine different feature types and contains 42,776 labeled samples. The false color image, ground-truth map, and corresponding categories of the dataset are shown in Figure 7. We partition the data into training, validation, and test sets with ratios of 1%, 1%, and 99%, respectively. The sample counts for each split are reported in Table 2.
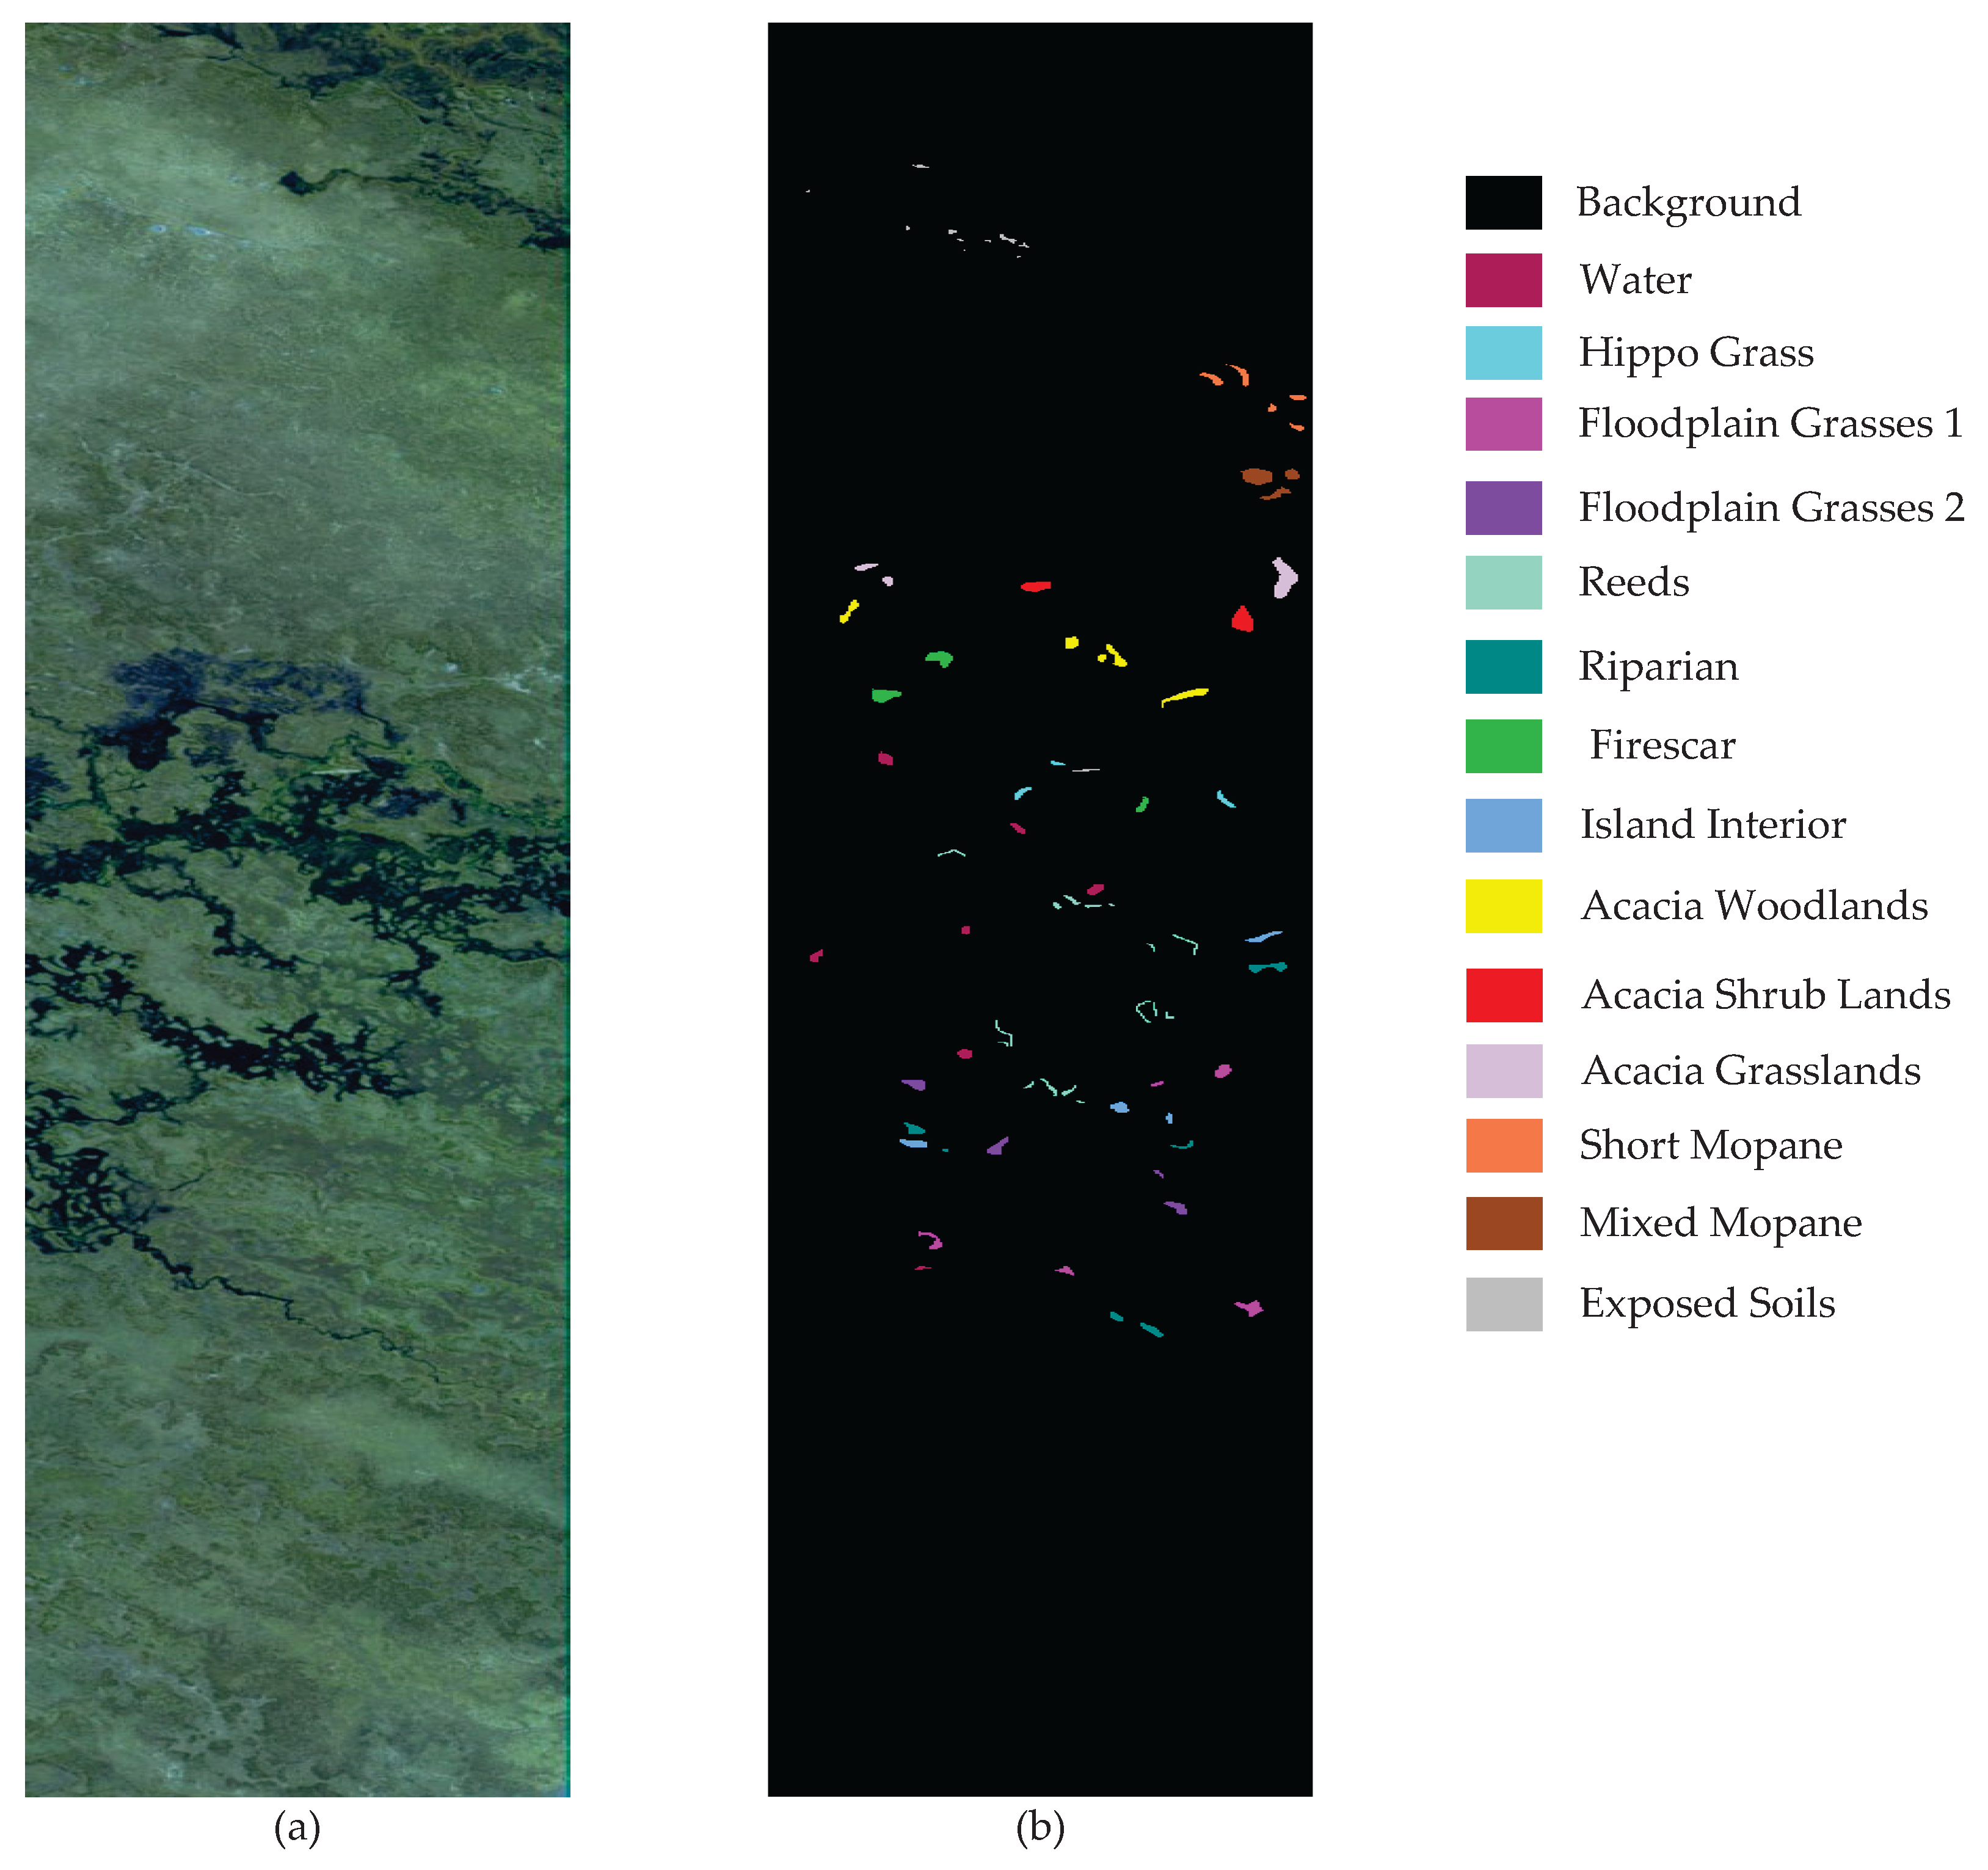
Botswana dataset: The Botswana dataset was acquired between 2001 and 2004 in the Okavango Delta region of Botswana using the well-known Hyperion sensor. The image size is 1476 × 256 with a spatial resolution of 30 m. The raw data contained 242 spectral dimensions, and 145 spectral dimensions were retained after removal of uncalibrated and noisy bands. In addition, the dataset has 14 different feature types and contains 3248 labeled samples. The false color image, ground-truth map, and corresponding categories of the dataset are shown in Figure 8. We partition the data into training, validation, and test sets with ratios of 3%, 3%, and 97%, respectively. The sample counts for each split are reported in Table 3.
Indian Pines dataset: This dataset was collected by the AVIRIS sensor in the “Indian Remote Sensing Experiment” area in the agricultural region of northwestern Indiana. The image size is 145 × 145, and the raw data contains 224 spectral dimensions, with 200 spectral dimensions retained after removal of the water absorption band. In addition, the dataset has 16 different feature types and contains 10,249 labeled samples. The false color image, ground-truth map, and corresponding categories of the dataset are shown in Figure 9. We partition the data into training, validation, and test sets with ratios of 5%, 5%, and 95%, respectively. The sample counts for each split are reported in Table 4.

4.2. Experimental Setup

All experiments were conducted using PyCharm Community 2024.3.5, with Python version 3.10 and PyTorch version 2.1.1. Computations were performed on a single NVIDIA GeForce RTX 3090 Ti GPU. Model training employed the Adam optimizer with a weight decay factor of 0.0001. A multi-stage learning rate scheduler was adopted, initializing the learning rate at 0.001 and reducing it by a factor of 0.9 every 10 epochs. For the Pavia University and Indian Pines datasets, models were trained for 100 epochs, while for the Botswana dataset, training was conducted for 200 epochs. The batch size was set to 64 for all experiments. The Mamba module retained its original hyperparameters, with the number of groups set to 4. After PCA dimensionality reduction, the spectral dimensions were set to 30 for the PU and Botswana datasets, and 90 for the IP dataset. The size of image patches was set to 13 for all datasets.
Three metrics were used to quantitatively assess classification performance: overall accuracy (OA), average accuracy (AA), and the Kappa coefficient (K). To ensure statistical reliability and minimize the impact of random fluctuations, each experiment was repeated ten times under identical settings. Reported results are presented as the mean and standard deviation across these trials.

4.3. Comparative Experiment

4.3.1. State-of-the-Art Methods for Comparison

To rigorously validate the effectiveness of the proposed WTCMC network, we compared its performance against a diverse set of state-of-the-art hyperspectral image (HSI) classification methods. The selected methods include a two-dimensional convolutional neural network (2DCNN) [19], a three-dimensional convolutional neural network (3DCNN) [20], a spectral grouping-based attention network (SpectralFormer) [41], the spectral–spatial feature tokenization transformer (SSFTT) [42], the memory-augmented spectral–spatial transformer (MassFormer) [26], a groupwise separable convolutional vision transformer (GSCVIT) [43], and the dual-branch spatial–spectral Mamba model (MambaHSI) [38].
For all experiments, the WTCMC network employed the hyperparameter settings detailed in Section 4.2. The classification results for the Pavia University, Botswana, and Indian Pines datasets are summarized in Table 5, Table 6 and Table 7. We reported per-class accuracy, overall accuracy (OA), average accuracy (AA), and the Kappa coefficient (K) for each method. The best-performing results are highlighted in bold. As shown in the tables, WTCMC achieves the highest values across all three evaluation metrics and all datasets. In addition, the classification outputs of all compared methods are visually presented in Figure 10, Figure 11 and Figure 12 to facilitate direct qualitative comparison.

4.3.2. Experimental Results on the Pavia University Dataset

Pavia University dataset experimental results (OA, AA, and Kappa): The classification results for the Pavia University dataset are summarized in Table 5. The proposed WTCMC network achieves an overall accuracy (OA) of 98.94%, an average accuracy (AA) of 98.38%, and a Kappa coefficient (K) of 98.60, outperforming all comparative methods. Specifically, WTCMC improves overall accuracy by 7.12%, 4.88%, 5.61%, 0.75%, 0.71%, 1.16%, and 2.68% over 2DCNN, 3DCNN, SpectralFormer, SSFTT, MassFormer, GSCVIT, and MambaHSI, respectively.
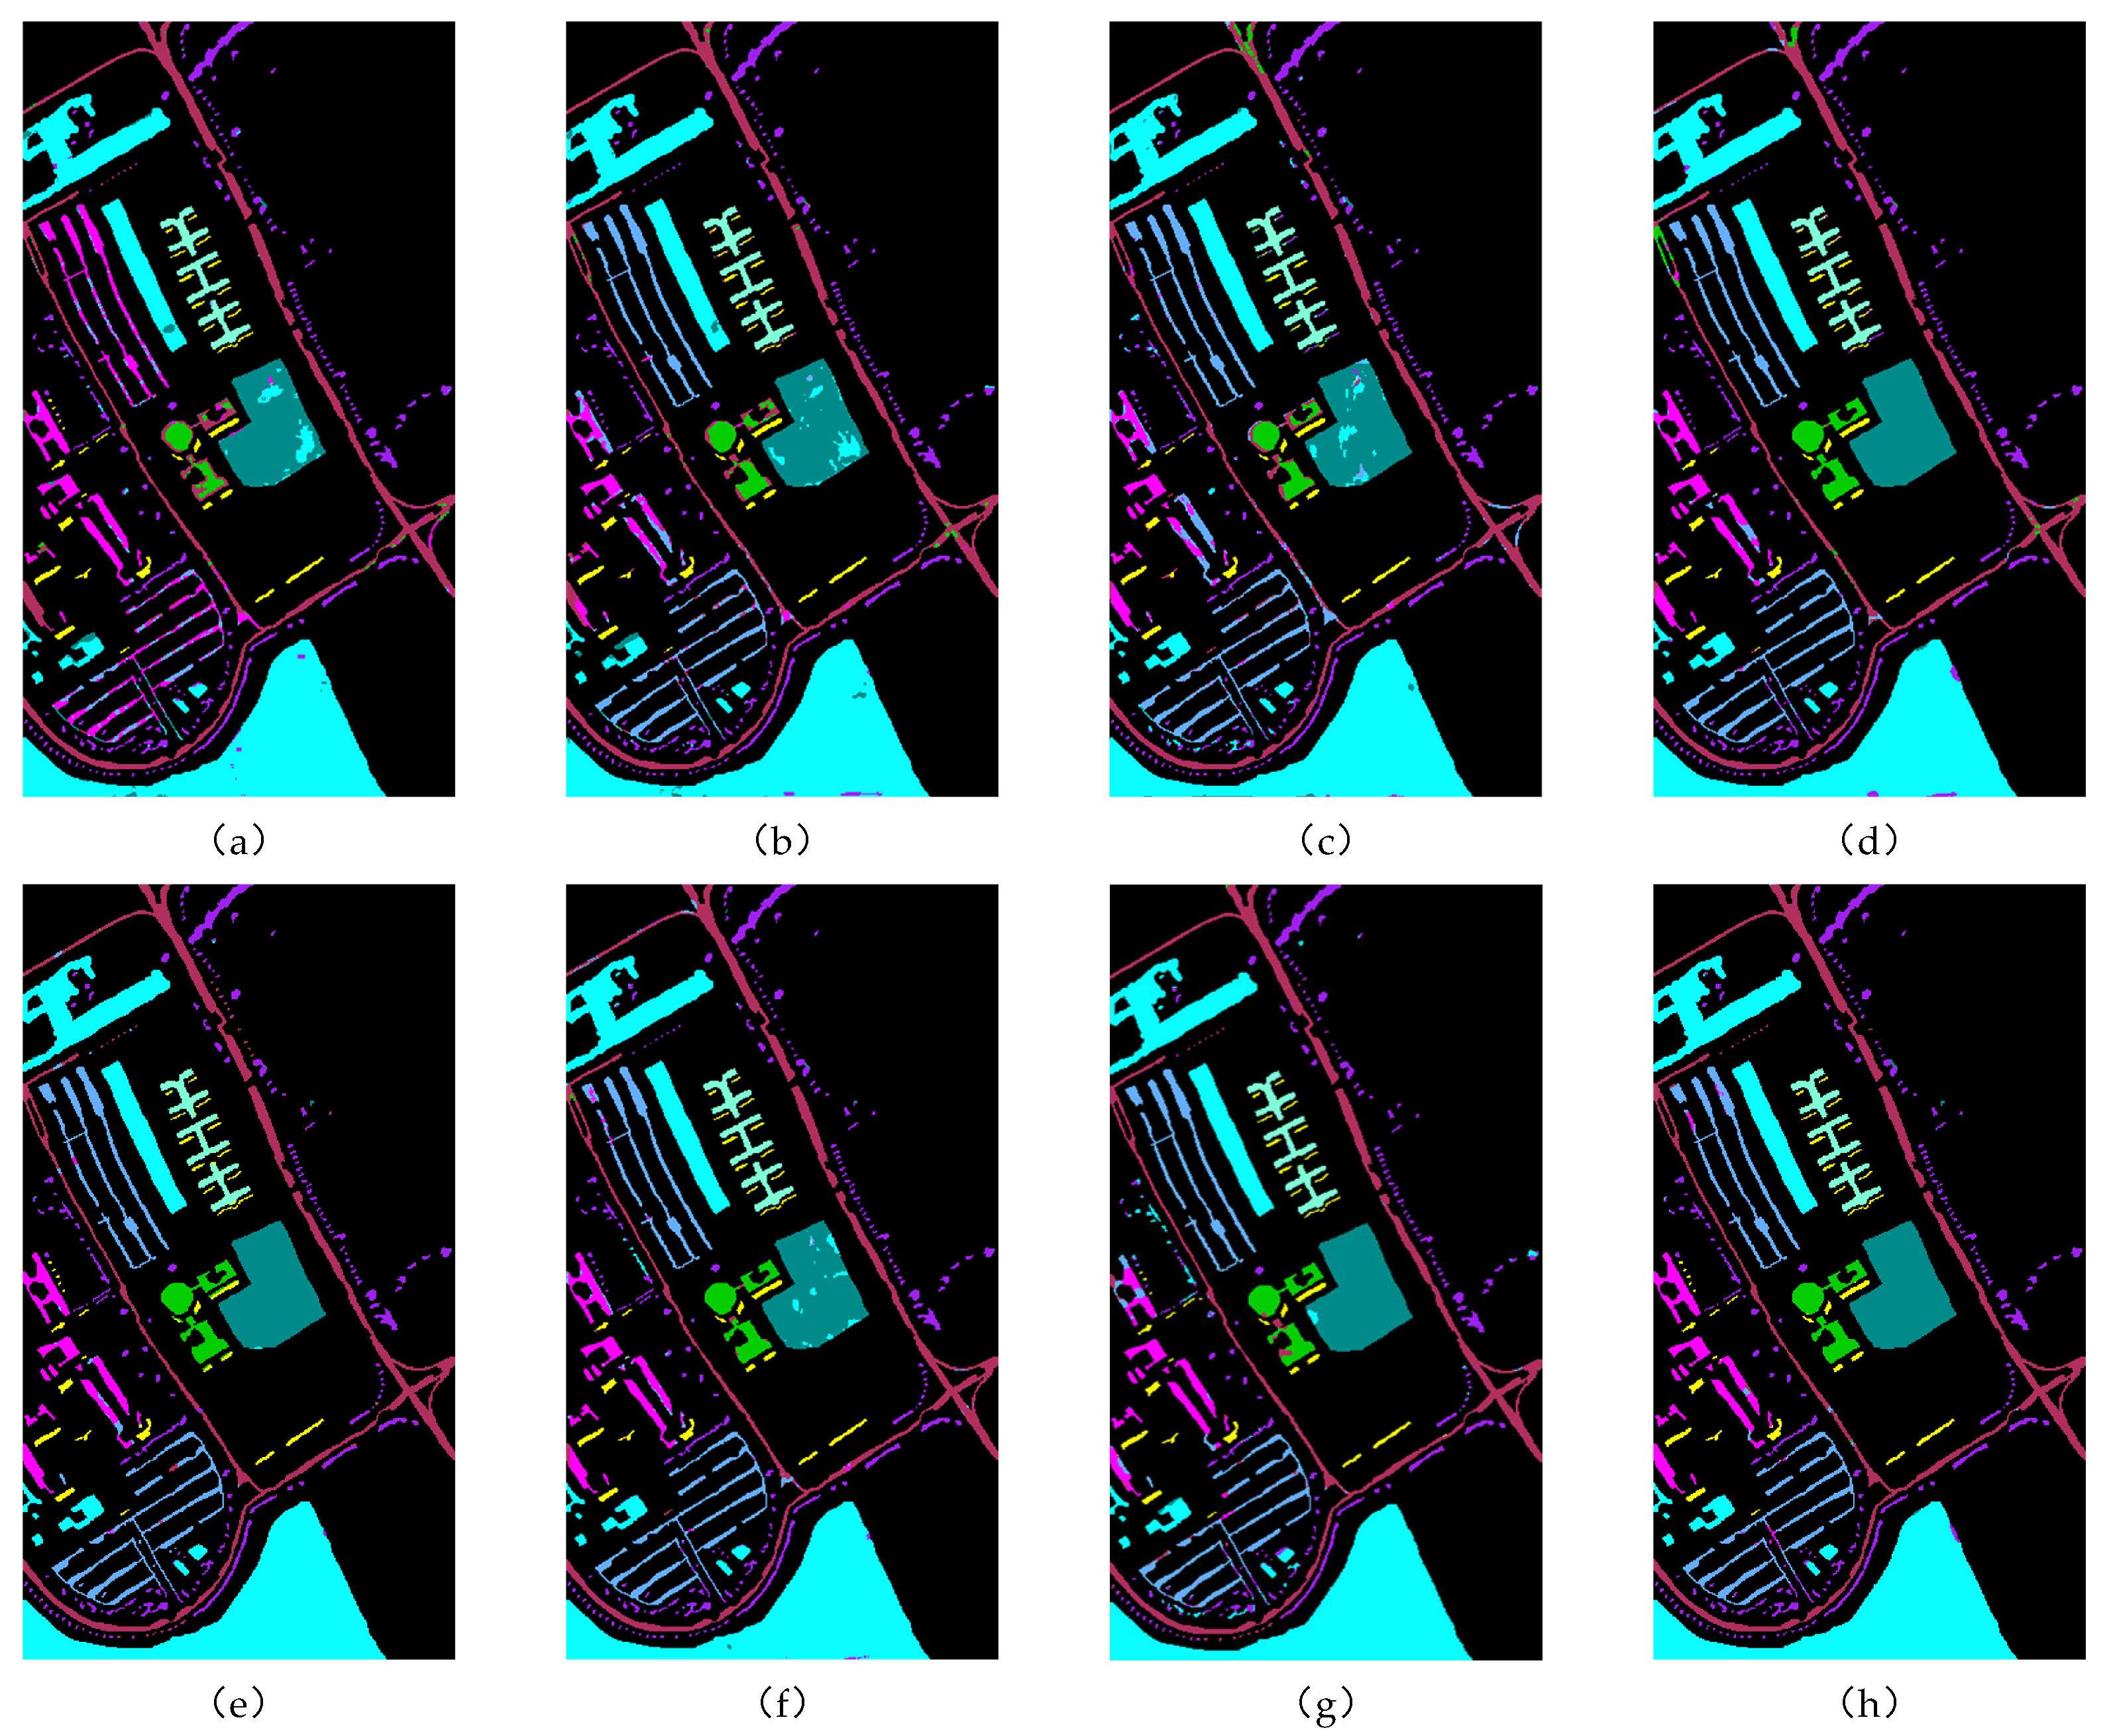
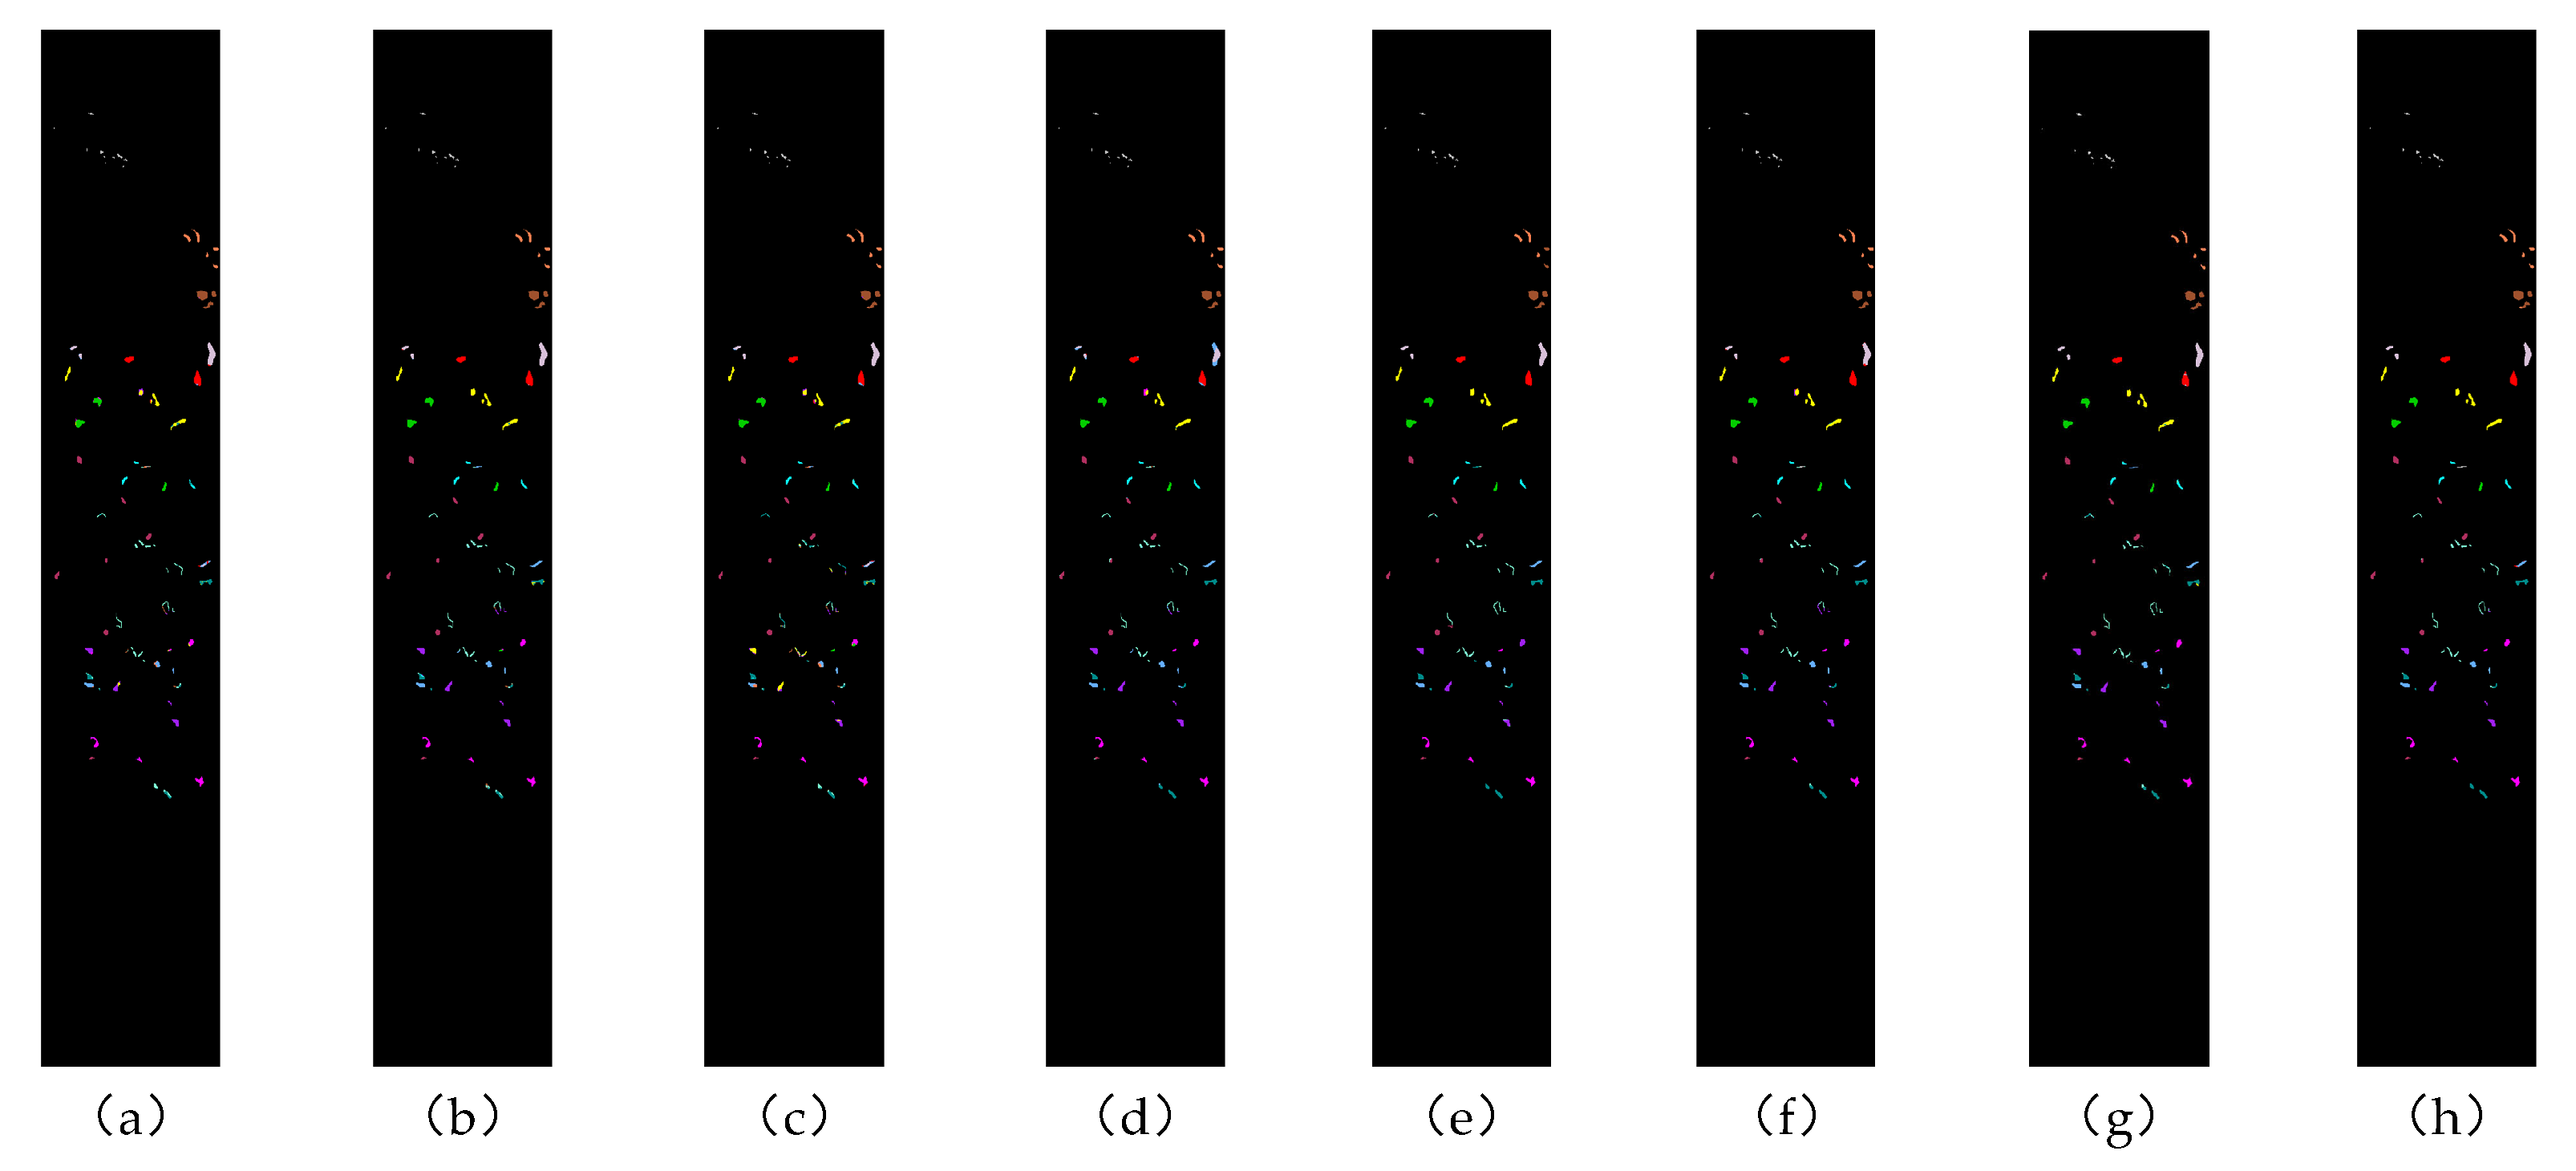
Pavia University dataset visualization results: Figure 10 presents the qualitative comparison of classification maps produced by each method on the PU dataset. Notably, the PU dataset contains a substantial number of small target samples, posing a significant challenge for accurate classification. Benefiting from the upsampling, wavelet transform and multi-scale feature extraction, WTCMC more effectively preserves fine details and object boundaries, leading to marked improvements in the classification of small and subtle structures.

4.3.3. Experimental Results on the Botswana Dataset

Botswana dataset experimental results (OA, AA, and Kappa): The classification results for the Botswana dataset are reported in Table 6. The proposed WTCMC network achieves an overall accuracy (OA) of 98.67%, an average accuracy (AA) of 98.38%, and a Kappa coefficient (K) of 98.56, surpassing all competing methods. Specifically, WTCMC improves overall accuracy by 9.72%, 4.09%, 15.84%, 3.73%, 3.98%, 0.86%, and 2.32% compared with 2DCNN, 3DCNN, SpectralFormer, SSFTT, MassFormer, GSCVIT, and MambaHSI, respectively. Our method achieves 100% accuracy on classes 2, 3, 7, and 10, underscoring WTCMC’s strong discriminative capacity and robust recognition for these categories.
Botswana dataset visualization results: Figure 11 presents the visualizations of classification results for each method on the Botswana dataset. Notably, this dataset is characterized by a predominance of small target samples and a high proportion of background pixels relative to labeled classes. The WTCMC network effectively addresses the challenge of classifying small and subtle targets, yielding substantial improvements in both visual and quantitative classification accuracy.

4.3.4. Experimental Results on the Indian Pines Dataset

Indian Pines dataset experimental results (OA, AA, and Kappa): The classification results for the Indian Pines dataset are reported in Table 7. WTCMC achieves an overall accuracy (OA) of 97.50%, an average accuracy (AA) of 97.08%, and a Kappa coefficient (K) of 97.15, outperforming all comparative methods. In terms of overall accuracy, WTCMC demonstrates improvements of 6.57%, 10.68%, 15.82%, 1.20%, 0.75%, 1.59%, and 2.72% over 2DCNN, 3DCNN, SpectralFormer, SSFTT, MassFormer, GSCVIT, and MambaHSI, respectively. Per class results show that WTCMC excels in few sample settings. For example, category 1 has only two training samples. The best of the competing methods (MambaHSI) attains 92.20%, whereas WTCMC reaches 98.10%, a 5.90 percentage point gain. These findings indicate that WTCMC maintains strong class discrimination even with very limited data.
Indian Pines dataset visualization results: Figure 12 provides visualizations of classification results for the IP dataset. Notably, WTCMC outperforms competing models along object boundaries and in few sample categories, as exemplified by classes 7 and 9. These results highlight WTCMC’s strong boundary localization and robust performance with limited training data.

4.4. Ablation Study

4.4.1. Impact of SFE, LFSM, HFMC, and SCF on WTCMC Performance

To comprehensively validate the effectiveness of each component within the proposed WTCMC network, we conduct a series of ablation experiments targeting the four key modules: the shallow feature extraction module (SFE), the low-frequency spectral Mamba module (LFSM), the high-frequency multi-scale convolution module (HFMC), and the spectral–spatial complementary fusion module (SCF). The results are summarized in Table 8 for the Pavia University, Botswana, and Indian Pines datasets.
Across all three datasets, each of the four modules demonstrably contributes to overall classification performance. Specifically, the removal of the SFE module causes a marked deterioration in the ability of the LFSM and HFMC modules to extract spectral and spatial features accurately, leading to a substantial decline in classification accuracy. Notably, even with only the shallow feature extraction (SFE) module and the classification head, the network achieves classification accuracies exceeding 90% on each dataset. These contrasts indicate that most discriminative capacity is established at the SFE with classification head, where SFE jointly extracts spectral and spatial structure with 3D and 2D convolutions, producing clean and well organized features for subsequent processing. Mechanistically, SFE reduces early feature fragmentation by coupling shallow spatial and spectral features, so LFSM and HFMC receive more favorable inputs. As a result, adding the later modules yields only modest gains in accuracy over SFE alone, because the first stage has already captured most class separating variance and the subsequent blocks mainly refine ambiguous pixels and hard boundaries.
Furthermore, for the Pavia University, Botswana, and Indian Pines datasets, removing the LFSM, HFMC, or SCF modules results in a corresponding reduction in classification performance, further emphasizing the importance of each module in the network’s overall effectiveness. Among them, the concatenation operation is used instead of SCF. The LFSM module mitigates redundancy among adjacent spectral bands, enabling more comprehensive spectral feature extraction. The HFMC module excels at capturing discriminative spatial features and enhancing boundary information between ground covers. The SCF module adaptively fuses spatial and spectral information, retaining features most conducive to accurate classification. From the above results, SFE is the primary driver of accuracy by establishing high-quality shallow spectral–spatial representations. LFSM, HFMC, and SCF add complementary, task-specific refinements that nudge overall performance further, particularly in challenging regions, leading to the best results when all four modules are used together. These results collectively demonstrate the necessity and complementary advantages of all four modules within the WTCMC network.

4.4.2. Impact of Wavelet Transform on WTCMC Performance

In the WTCMC network, the wavelet transform plays a pivotal role: It suppresses noise for the LFSM module and enhances spatial details and contours for the HFMC module. To elucidate the impact of the wavelet transform within the WTCMC network, we conducted controlled experiments in which the wavelet transform was selectively included or removed. The results, presented in Table 9, underscore the critical role of the wavelet transform across all three datasets.
As shown in Table 9, on the PU and Botswana datasets, the incorporation of wavelet transform yields substantial improvements in all three evaluation metrics, highlighting its effectiveness in enhancing spatial detail and suppressing noise. In contrast, on the Indian Pines dataset, the application of the wavelet transform is associated with a decrease in both OA and Kappa, potentially attributable to residual noise not fully addressed by the current processing pipeline. Nevertheless, a notable improvement is still observed in the AA metric, suggesting that the wavelet transform still benefits class-averaged performance, particularly for minority classes. These findings demonstrate that while the wavelet transform is broadly advantageous, its efficacy may vary depending on dataset-specific noise characteristics and the thoroughness of noise reduction strategies.

5. Discussion

In the WTCMC network, the size of the image patches and the number of spectral dimensions retained after PCA are both critical parameters that influence classification performance. Selecting an appropriate spatial neighborhood size directly impacts the classification accuracy of central pixels, as it determines the amount of contextual information available to the model. Similarly, the choice of spectral dimensionality after PCA must strike a balance between information retention and computational efficiency. In LFSM, the number of spectral groups impacts classification accuracy and computational efficiency. This section systematically investigates the impact of the patch size, the number of spectral groups, and post-PCA spectral dimensionality on the classification performance across the PU, Botswana, and IP datasets, providing practical guidance for optimizing the WTCMC framework.

5.1. Effect of the Image Patch Size

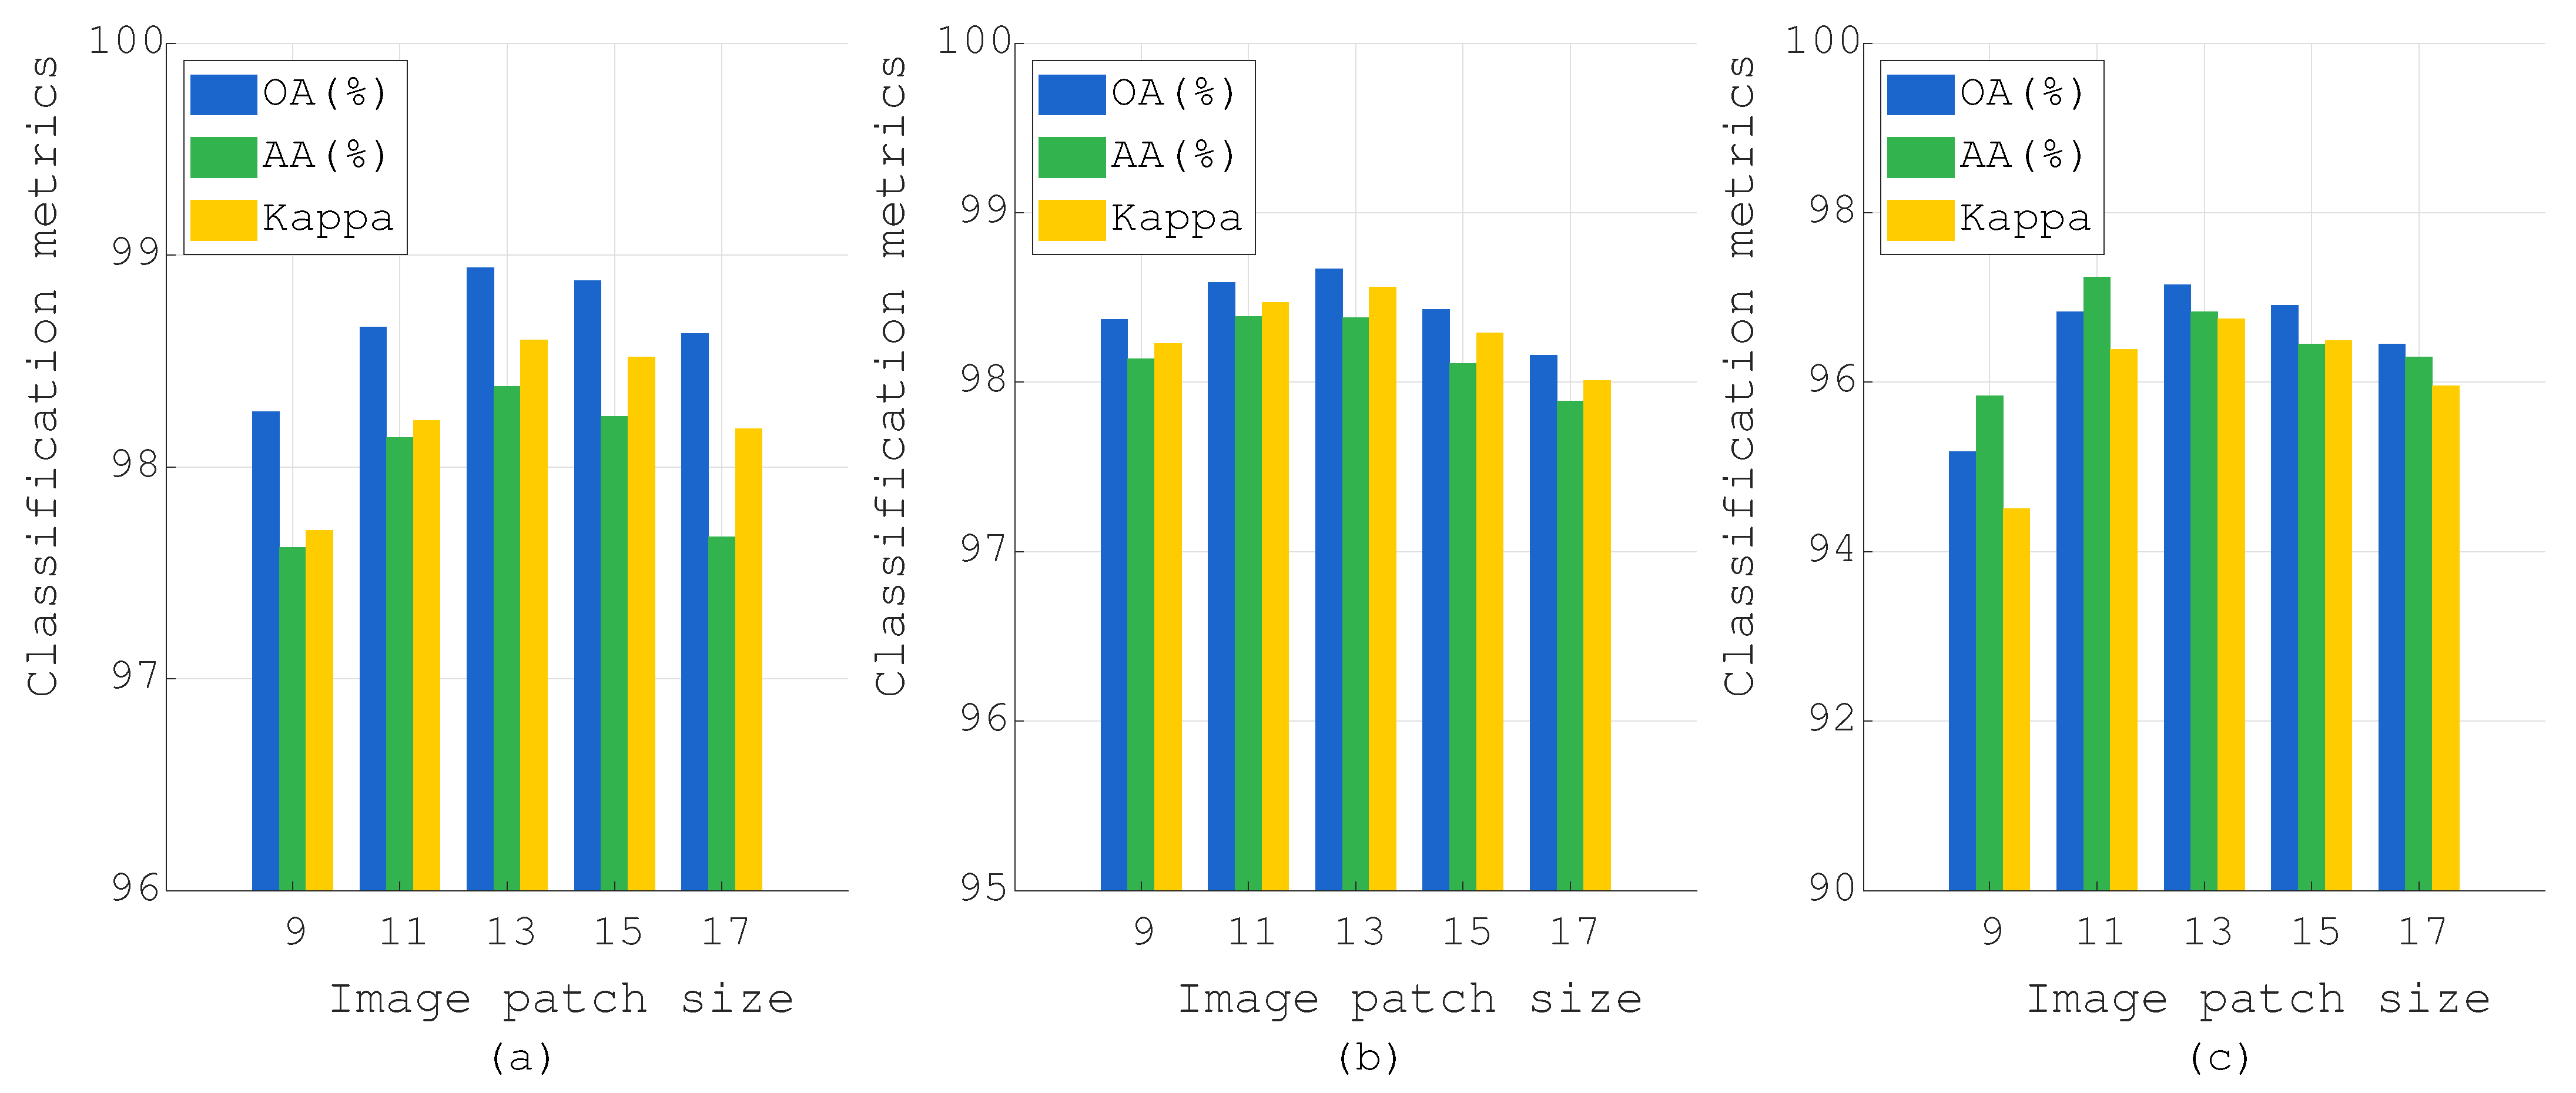
The final classification assigned by the model is determined by the category of the central pixel within each input image patch. Therefore, the selection of the spatial neighborhood reflected by the image patch size is a crucial parameter influencing classification accuracy. To systematically assess its impact, we experimented with five different patch sizes (9, 11, 13, 15, and 17) across the PU, Botswana, and IP datasets. The corresponding classification results are presented in Figure 13.
As shown in Figure 13, the optimal classification performance for all three datasets is consistently achieved when the patch size is set to 13. Specifically, for the PU dataset, all three metrics (OA, AA, and Kappa) reach their highest values at this setting. For the Botswana and IP datasets, both OA and Kappa are maximized with a patch size of 13, while the AA metric is only marginally surpassed by the result at patch size 11. Therefore, selecting an excessively large patch size may introduce irrelevant contextual information. Conversely, a patch size that is too small may fail to provide sufficient spatial context, thereby limiting classification performance. Based on these comprehensive results, we select an image patch size of 13 as the optimal configuration for the WTCMC network.

5.2. Effect of the Number of Bands After PCA

Selecting an appropriate number of spectral bands following PCA dimensionality reduction is critical for information retention and computational efficiency. To systematically investigate this effect, we varied the number of retained bands after PCA to 15, 30, 60, 90, and 120 for Botswana and IP datasets, with the maximum for the PU dataset set to 103 bands. The corresponding classification results are presented in Figure 14.
The results indicate that, for both the PU and Botswana datasets, the optimal classification performance is achieved when the number of bands is reduced to 30. In contrast, for the Indian Pines dataset, the highest accuracy is obtained when 90 bands are retained. Based on these findings, we set the number of PCA-reduced bands to 30 for the PU and Botswana datasets and 90 for the IP dataset.

5.3. Effect of the Number of Groups in LFSM

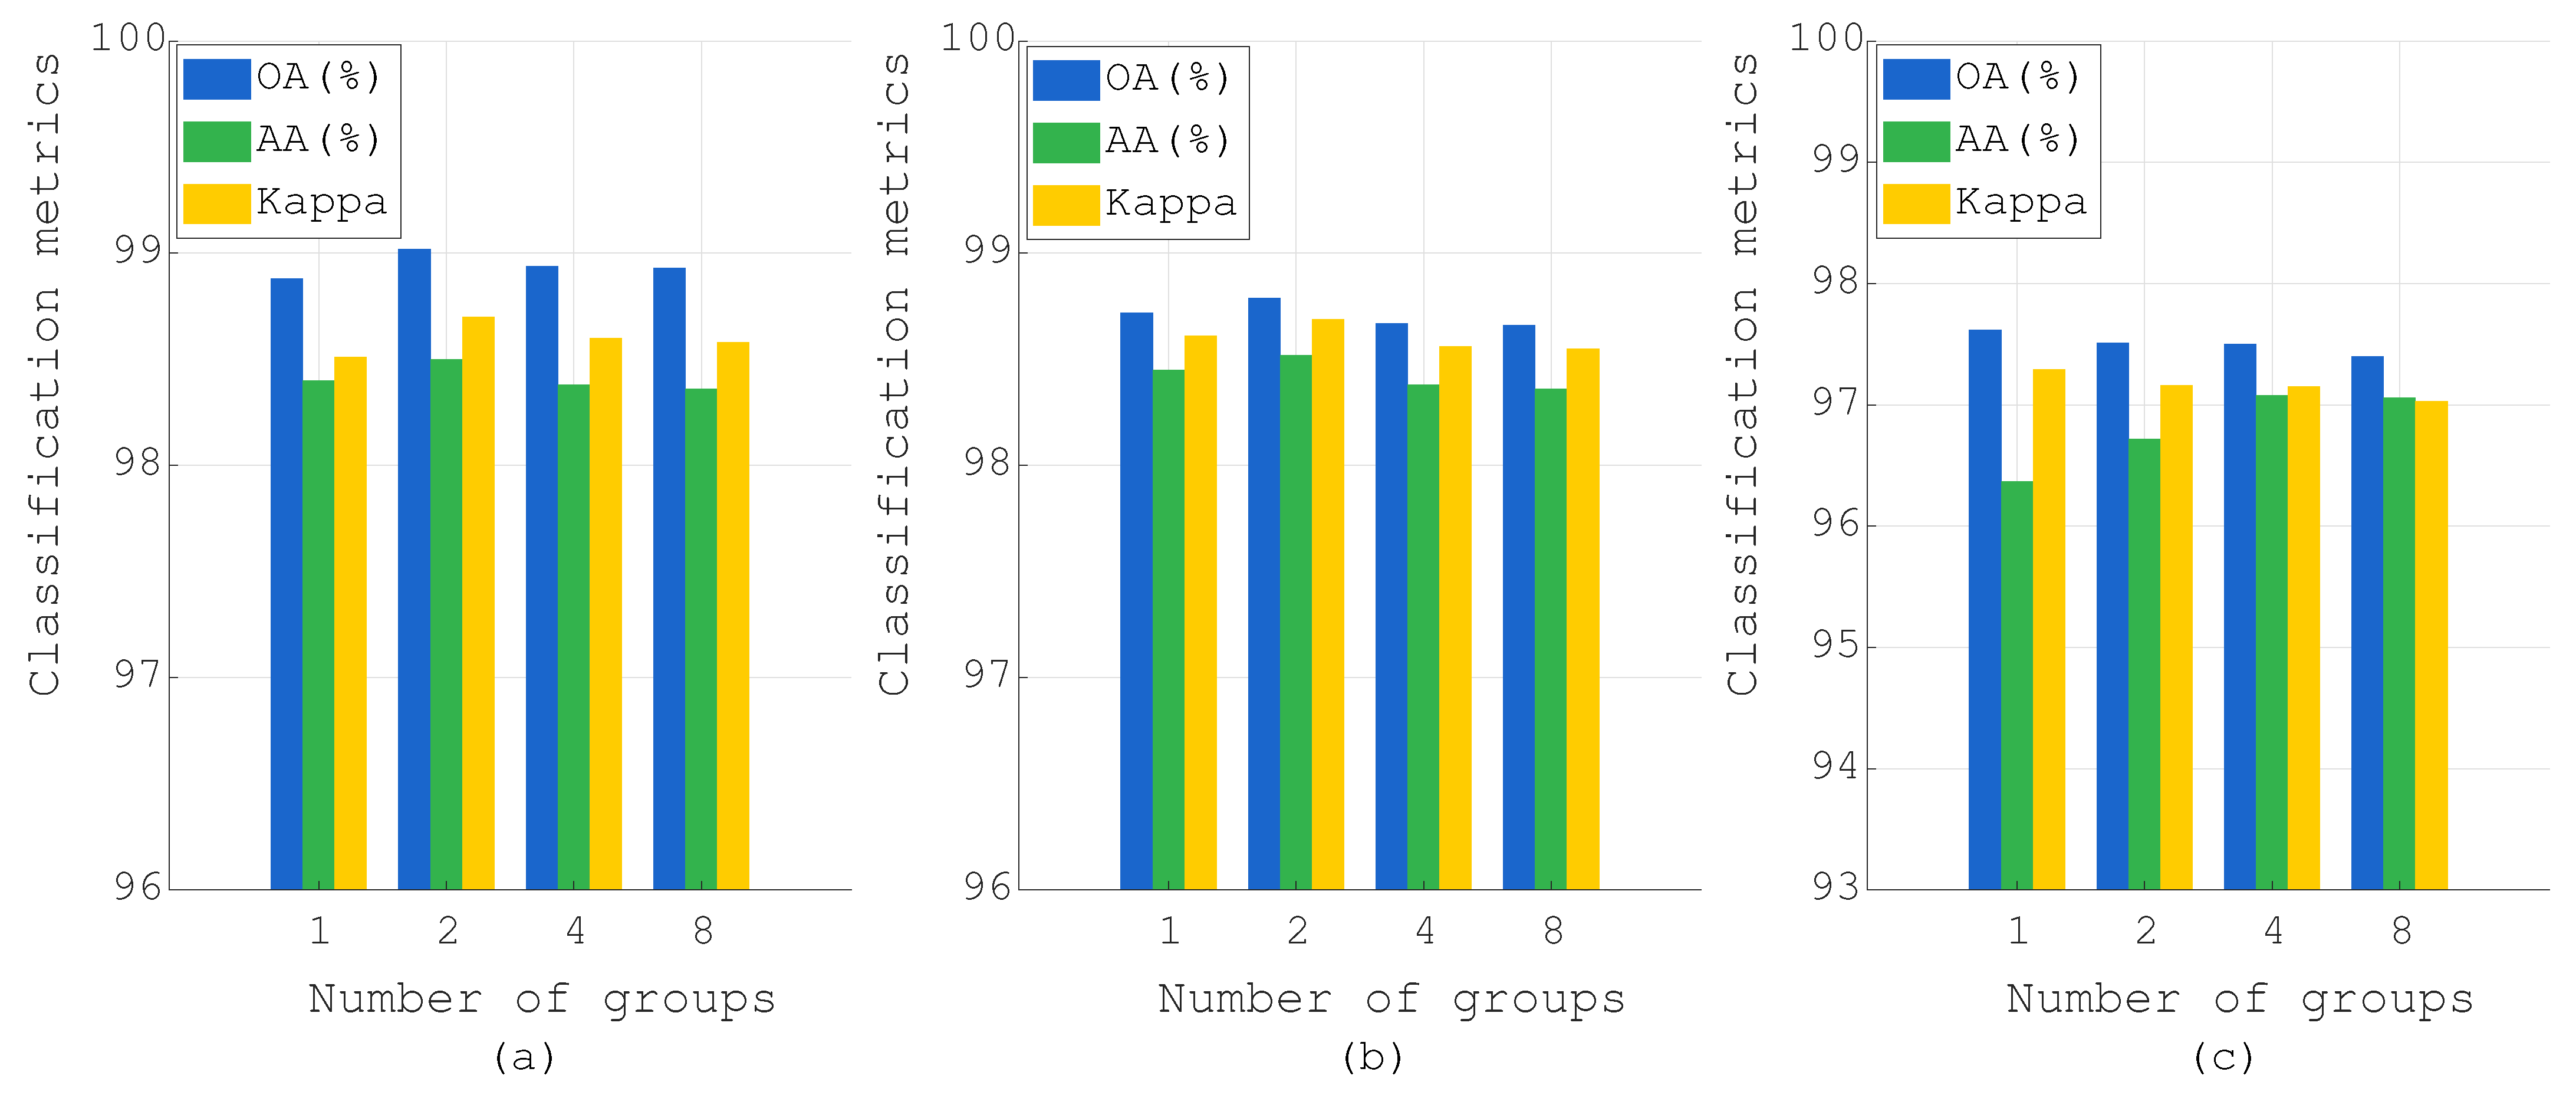
In the low-frequency Mamba module, the number of spectral groups affects the trade-off between classification accuracy and computational efficiency. We varied the groups as 1, 2, 4, and 8 to assess this effect. Figure 15 shows that the PU and Botswana datasets perform best at two groups, whereas the IP dataset performs best at four groups. Table 10 further indicates that increasing the number of groups improves efficiency. To balance accuracy and efficiency across datasets, we set the number of groups to four for the final configuration.

6. Conclusions

In this study, we propose WTCMC—a novel hyperspectral image classification network based on wavelet Transform combining Mamba and convolutional neural networks. The proposed WTCMC network is specifically designed to address the challenges of spectral similarity and redundancy between adjacent bands, while simultaneously enhancing the extraction of fine spatial details and contour edge features. Through its four core modules—the shallow feature extraction module, the low-frequency spectral Mamba module, the high-frequency multi-scale convolution module, and the spectral–spatial complementary fusion module—WTCMC substantially improves classification performance. Comparative experiments conducted on the Pavia University, Botswana, and Indian Pines datasets confirm that WTCMC delivers superior performance compared to the state-of-the-art methods. On the PU dataset, WTCMC achieves an overall accuracy (OA) of 98.94%, an average accuracy (AA) of 98.37%, and a Kappa coefficient of 98.60. For the Botswana dataset, OA, AA, and Kappa reach 98.67%, 98.38%, and 98.56, respectively. On the Indian Pines dataset, the network achieves 97.50% OA, 97.08% AA, and 97.15 Kappa.
In addition, the network proposed in this paper still has many worthwhile improvements; for example, the multi-layer wavelet transform is used to further capture the fine spatial details and reduce the impact of noise. This provides new ideas and insights for future research.

Author Contributions

Conceptualization, G.L. and Q.Z.; methodology, G.L. and X.S.; software, G.L. and Q.Z.; validation, Y.Z. and X.S.; formal analysis, X.S. and Y.Z., writing—original draft preparation, G.L. and Q.Z.; writing—review and editing, Q.Z. and X.S.; visualization, Y.Z. All authors have read and agreed to the published version of the manuscript.

Funding

This research received no external funding.

Institutional Review Board Statement

Not applicable.

Informed Consent Statement

Not applicable.

Data Availability Statement

All the datasets and code can be obtained: https://github.com/LiuGuanChen619/WTCMC (accessed on 29 July 2025).

Acknowledgments

The authors would like to thank the editor and reviewers for reviewing our paper and providing valuable comments.

Conflicts of Interest

The authors declare no conflicts of interest.

References

  1. Reddy, P.; Guthridge, K.M.; Panozzo, J.; Ludlow, E.J.; Spangenberg, G.C.; Rochfort, S.J. Near-Infrared Hyperspectral Imaging Pipelines for Pasture Seed Quality Evaluation: An Overview. Sensors 2022, 22, 1981. [Google Scholar] [CrossRef]
  2. Stuart, M.B.; Davies, M.; Hobbs, M.J.; Pering, T.D.; McGonigle, A.J.S.; Willmott, J.R. High-Resolution Hyperspectral Imaging Using Low-Cost Components: Application within Environmental Monitoring Scenarios. Sensors 2022, 22, 4652. [Google Scholar] [CrossRef]
  3. Lin, N.; Jiang, R.; Li, G.; Yang, Q.; Li, D.; Yang, X. Estimating the heavy metal contents in farmland soil from hyperspectral images based on Stacked AdaBoost ensemble learning. Ecol. Indic. 2022, 143, 109330. [Google Scholar] [CrossRef]
  4. Grambow, E.; Sandkühler, N.A.; Groß, J.; Thiem, D.G.E.; Dau, M.; Leuchter, M.; Weinrich, M. Evaluation of Hyperspectral Imaging for Follow-Up Assessment after Revascularization in Peripheral Artery Disease. J. Clin. Med. 2022, 11, 758. [Google Scholar] [CrossRef]
  5. Tsai, T.J.; Mukundan, A.; Chi, Y.S.; Tsao, Y.M.; Wang, Y.K.; Chen, T.H.; Wu, I.C.; Huang, C.W.; Wang, H.C. Intelligent Identification of Early Esophageal Cancer by Band-Selective Hyperspectral Imaging. Cancers 2022, 14, 4292. [Google Scholar] [CrossRef] [PubMed]
  6. Butt, M.H.F.; Ayaz, H.; Ahmad, M.; Li, J.P.; Kuleev, R. A Fast and Compact Hybrid CNN for Hyperspectral Imaging-based Bloodstain Classification. In Proceedings of the 2022 IEEE Congress on Evolutionary Computation (CEC), Padua, Italy, 18–23 July 2022; pp. 1–8. [Google Scholar] [CrossRef]
  7. Zulfiqar, M.; Ahmad, M.; Sohaib, A.; Mazzara, M.; Distefano, S. Hyperspectral Imaging for Bloodstain Identification. Sensors 2021, 21, 3045. [Google Scholar] [CrossRef]
  8. Zhao, J.; Zhou, B.; Wang, G.; Liu, J.; Ying, J. Camouflage Target Recognition Based on Dimension Reduction Analysis of Hyperspectral Image Regions. Photonics 2022, 9, 640. [Google Scholar] [CrossRef]
  9. Zhao, J.; Zhou, B.; Wang, G.; Ying, J.; Liu, J.; Chen, Q. Spectral Camouflage Characteristics and Recognition Ability of Targets Based on Visible/Near-Infrared Hyperspectral Images. Photonics 2022, 9, 957. [Google Scholar] [CrossRef]
  10. Mukundan, A.; Huang, C.-C.; Men, T.-C.; Lin, F.-C.; Wang, H.-C. Air Pollution Detection Using a Novel Snap-Shot Hyperspectral Imaging Technique. Sensors 2022, 22, 6231. [Google Scholar] [CrossRef] [PubMed]
  11. Ham, J.; Chen, Y.; Crawford, M.M.; Ghosh, J. Investigation of the random forest framework for classification of hyperspectral data. IEEE Trans. Geosci. Remote Sens. 2005, 43, 492–501. [Google Scholar] [CrossRef]
  12. Melgani, F.; Bruzzone, L. Classification of hyperspectral remote sensing images with support vector machines. IEEE Trans. Geosci. Remote Sens. 2004, 42, 1778–1790. [Google Scholar] [CrossRef]
  13. Bandos, T.V.; Bruzzone, L.; Camps-Valls, G. Classification of Hyperspectral Images With Regularized Linear Discriminant Analysis. IEEE Trans. Geosci. Remote Sens. 2009, 47, 862–873. [Google Scholar] [CrossRef]
  14. Tang, Y.Y.; Yuan, H.; Li, L. Manifold-Based Sparse Representation for Hyperspectral Image Classification. IEEE Trans. Geosci. Remote Sens. 2014, 52, 7606–7618. [Google Scholar] [CrossRef]
  15. Ma, L.; Crawford, M.M.; Tian, J. Local Manifold Learning-Based k-Nearest-Neighbor for Hyperspectral Image Classification. IEEE Trans. Geosci. Remote Sens. 2010, 48, 4099–4109. [Google Scholar] [CrossRef]
  16. Prasad, S.; Bruce, L.M. Limitations of Principal Components Analysis for Hyperspectral Target Recognition. IEEE Geosci. Remote Sens. Lett. 2008, 5, 625–629. [Google Scholar] [CrossRef]
  17. Cai, R.; Liu, C.; Li, J. Efficient phase-induced Gabor cube selection and weighted fusion for hyperspectral image classification. Sci. China Technol. Sci. 2022, 65, 778–792. [Google Scholar] [CrossRef]
  18. Hu, W.; Huang, Y.; Wei, L.; Zhang, F.; Li, H. Deep Convolutional Neural Networks for Hyperspectral Image Classification. J. Sens. 2015, 2015, 258619. [Google Scholar] [CrossRef]
  19. Lee, H.; Kwon, H. Contextual deep CNN based hyperspectral classification. In Proceedings of the 2016 IEEE International Geoscience and Remote Sensing Symposium (IGARSS), Beijing, China, 10–15 July 2016; pp. 3322–3325. [Google Scholar] [CrossRef]
  20. Hamida, A.B.; Benoit, A.; Lambert, P.; Amar, C.B. 3-D Deep Learning Approach for Remote Sensing Image Classification. IEEE Trans. Geosci. Remote Sens. 2018, 56, 4420–4434. [Google Scholar] [CrossRef]
  21. Ahmad, M.; Butt, M.H.F.; Mazzara, M.; Distefano, S.; Mehmood, A.; Khan, A.M.; Altuwaijri, H.A. Pyramid Hierarchical Spatial-Spectral Transformer for Hyperspectral Image Classification. IEEE J. Sel. Top. Appl. Earth Obs. Remote Sens. 2024, 17, 17681–17689. [Google Scholar] [CrossRef]
  22. Roy, S.K.; Deria, A.; Hong, D.; Rasti, B.; Plaza, A.; Chanussot, J. Multimodal Fusion Transformer for Remote Sensing Image Classification. IEEE Trans. Geosci. Remote Sens. 2023, 61, 5515620. [Google Scholar] [CrossRef]
  23. Yang, X.; Li, L.; Xue, S.; Li, S.; Yang, W.; Tang, H.; Huang, X. MRFP-Mamba: Multi-Receptive Field Parallel Mamba for Hyperspectral Image Classification. Remote Sens. 2025, 17, 2208. [Google Scholar] [CrossRef]
  24. Wang, G.; Zhang, X.; Peng, Z.; Zhang, T.; Jiao, L. S2Mamba: A Spatial–Spectral State Space Model for Hyperspectral Image Classification. IEEE Trans. Geosci. Remote Sens. 2025, 63, 5511413. [Google Scholar] [CrossRef]
  25. Liu, Q.; Yue, J.; Fang, Y.; Xia, S.; Fang, L. HyperMamba: A Spectral–Spatial Adaptive Mamba for Hyperspectral Image Classification. IEEE Trans. Geosci. Remote Sens. 2024, 62, 5536514. [Google Scholar] [CrossRef]
  26. Sun, L.; Zhang, H.; Zheng, Y.; Wu, Z.; Ye, Z.; Zhao, H. MASSFormer: Memory-Augmented Spectral-Spatial Transformer for Hyperspectral Image Classification. IEEE Trans. Geosci. Remote Sens. 2024, 62, 5516415. [Google Scholar] [CrossRef]
  27. Zhang, B.; Chen, Y.; Xiong, S.; Lu, X. Hyperspectral Image Classification via Cascaded Spatial Cross-Attention Network. IEEE Trans. Image Process. 2025, 34, 899–913. [Google Scholar] [CrossRef] [PubMed]
  28. Ahmad, M.; Ghous, U.; Usama, M.; Mazzara, M. WaveFormer: Spectral–Spatial Wavelet Transformer for Hyperspectral Image Classification. IEEE Geosci. Remote Sens. Lett. 2024, 21, 5502405. [Google Scholar] [CrossRef]
  29. Seydi, S.T.; Bozorgasl, Z.; Chen, H. Unveiling the Power of Wavelets: A Wavelet-based Kolmogorov–Arnold Network for Hyperspectral Image Classification. arXiv 2024, arXiv:2406.07869. [Google Scholar]
  30. Ahmad, M.; Usama, M.; Mazzara, M.; Distefano, S. WaveMamba: Spatial-Spectral Wavelet Mamba for Hyperspectral Image Classification. IEEE Geosci. Remote Sens. Lett. 2024, 22, 5500505. [Google Scholar] [CrossRef]
  31. Jiang, G.; Sun, Y.; Liu, B. A fully convolutional network with channel and spatial attention for hyperspectral image classification. Remote Sens. Lett. 2021, 12, 1238–1249. [Google Scholar] [CrossRef]
  32. Zhao, C.; Zhu, W.; Feng, S. Superpixel Guided Deformable Convolution Network for Hyperspectral Image Classification. IEEE Trans. Image Process. 2022, 31, 3838–3851. [Google Scholar] [CrossRef] [PubMed]
  33. Wu, Q.; He, M.; Chen, Q.; Sun, L.; Ma, C. Integrating Multiscale Spatial–Spectral Shuffling Convolution with 3-D Lightweight Transformer for Hyperspectral Image Classification. IEEE J. Sel. Top. Appl. Earth Obs. Remote Sens. 2025, 18, 5378–5394. [Google Scholar] [CrossRef]
  34. He, Y.; Tu, B.; Liu, B.; Li, J.; Plaza, A. 3DSS-Mamba: 3D-Spectral-Spatial Mamba for Hyperspectral Image Classification. IEEE Trans. Geosci. Remote Sens. 2024, 62, 5534216. [Google Scholar] [CrossRef]
  35. Zhuang, P.; Zhang, X.; Wang, H.; Zhang, T.; Liu, L.; Li, J. FAHM: Frequency-Aware Hierarchical Mamba for Hyperspectral Image Classification. IEEE J. Sel. Top. Appl. Earth Obs. Remote Sens. 2025, 18, 6299–6313. [Google Scholar] [CrossRef]
  36. Huang, L.; Chen, Y.; He, X. Spectral-Spatial Mamba for Hyperspectral Image Classification. arXiv 2024, arXiv:2404.18401. [Google Scholar]
  37. Bai, Y.; Wu, H.; Zhang, L.; Guo, H. Lightweight Mamba Model Based on Spiral Scanning Mechanism for Hyperspectral Image Classification. IEEE Geosci. Remote Sens. Lett. 2025, 22, 5502305. [Google Scholar] [CrossRef]
  38. Li, Y.; Luo, Y.; Zhang, L.; Wang, Z.; Du, B. MambaHSI: Spatial–Spectral Mamba for Hyperspectral Image Classification. IEEE Trans. Geosci. Remote Sens. 2024, 62, 5524216. [Google Scholar] [CrossRef]
  39. Yao, J.; Hong, D.; Li, C.; Chanussot, J. SpectralMamba: Efficient Mamba for Hyperspectral Image Classification. arXiv 2024, arXiv:2404.08489. [Google Scholar]
  40. Maveganzones. Hyperspectral Remote Sensing Scenes. Available online: https://www.ehu.eus/ccwintco/index.php?title=Hyperspectral_Remote_Sensing_Scenes (accessed on 20 May 2011).
  41. Hong, D.; Han, Z.; Yao, J.; Gao, L.; Zhang, B.; Plaza, A. SpectralFormer: Rethinking Hyperspectral Image Classification with Transformers. IEEE Trans. Geosci. Remote Sens. 2021, 60, 5518615. [Google Scholar] [CrossRef]
  42. Sun, L.; Zhao, G.; Zheng, Y.; Wu, Z. Spectral–Spatial Feature Tokenization Transformer for Hyperspectral Image Classification. IEEE Trans. Geosci. Remote Sens. 2022, 60, 5522214. [Google Scholar] [CrossRef]
  43. Zhao, Z.; Xu, X.; Li, S.; Plaza, A. Hyperspectral Image Classification Using Groupwise Separable Convolutional Vision Transformer Network. IEEE Trans. Geosci. Remote Sens. 2024, 62, 5511817. [Google Scholar] [CrossRef]
Figure 1. Structural diagram of the WTCMC network: (a) data preprocessing, (b) SFE, (c) wavelet processing, (d) LFSM and HFMC, (e) SCF, and (f) classification head. The workflow involves initially reducing the dimensionality of the raw input image using principal component analysis (PCA), followed by partitioning the resultant image into multiple patches. These image patches first pass through the shallow feature extraction module and are subsequently upsampled via bilinear interpolation. Next, a wavelet transform is applied to decompose the upsampled patches into low-frequency and high-frequency subbands. The low-frequency subbands are processed by the low-frequency spectral Mamba module, while the high-frequency subbands are handled by the high-frequency multi-scale convolution module. Finally, features extracted from both modules are integrated through the spectral–spatial complementary fusion module. The resulting fused features are then classified by the classification head, which consists of average pooling and a normalized linear layer.
Electronics 14 03301 g001
Figure 2. Schematic diagram of a band of the PU dataset before and after wavelet transform: (a) original image, (b) low-frequency subband L L , (c) high-frequency subband L H , (d) high-frequency subband H L , and (e) high-frequency subband H H .
Electronics 14 03301 g002
Figure 3. Structural diagram of the shallow feature extraction module.
Electronics 14 03301 g003
Figure 4. Structural diagram of the low-frequency spectral Mamba module.
Electronics 14 03301 g004
Figure 5. Structural diagram of the high-frequency multi-scale convolution module.
Electronics 14 03301 g005
Figure 6. Structural diagram of the spectral–spatial complementary fusion module.
Electronics 14 03301 g006
Figure 7. Pavia University dataset: (a) false color map and (b) ground truth.
Electronics 14 03301 g007
Figure 8. Botswana dataset: (a) false color map and (b) ground truth.
Electronics 14 03301 g008
Figure 9. Indian Pines dataset: (a) false color map and (b) ground truth.
Electronics 14 03301 g009
Figure 10. Classification effect diagram of all methods on the PU dataset: (a) 2DCNN, (b) 3DCNN, (c) SpectralFormer, (d) SSFTT, (e) MassFormer, (f) GSCVIT, (g) MambaHSI, and (h) WTCMC.
Electronics 14 03301 g010
Figure 11. Classification effect diagram of all methods on the Botswana dataset: (a) 2DCNN, (b) 3DCNN, (c) SpectralFormer, (d) SSFTT, (e) MassFormer, (f) GSCVIT, (g) MambaHSI, and (h) WTCMC.
Electronics 14 03301 g011
Figure 12. Classification effect diagram of all methods on the Indian Pines dataset: (a) 2DCNN, (b) 3DCNN, (c) SpectralFormer, (d) SSFTT, (e) MassFormer, (f) GSCVIT, (g) MambaHSI, and (h) WTCMC.
Electronics 14 03301 g012aElectronics 14 03301 g012b
Figure 13. Effect of the image patch size on PU, Botswana, and IP datasets: (a) PU, (b) Botswana, and (c) IP.
Electronics 14 03301 g013
Figure 14. Effect of the number of bands after PCA on PU, Botswana, and IP datasets: (a) PU, (b) Botswana, and (c) IP.
Electronics 14 03301 g014
Figure 15. Effect of the number of groups in LFSM on PU, Botswana, and IP datasets: (a) PU, (b) Botswana, and (c) IP.
Electronics 14 03301 g015
Table 1. Concise comparison of CNN-, transformer-, Mamba-, and wavelet-based methods versus WTCMC.
MethodsStructureFrequency DomainMulti-Scale StrategyAttention Mechanism
 [31,32,33]CNN-basedNot supportedPartially supportedPartially supported
 [21,22]Transformer-basedNot supportedPartially supportedSupported
 [34,35,36,37,38,39]Mamba-basedPartially supportedPartially supportedPartially supported
 [28,29,30]Wavelet-basedSupportedsupportedPartially supported
\WTCMCSupportedSupportedSupported
Table 2. The number of samples in the training set, validation set, and test set of the Pavia University dataset.
No.Class NameTrainValTestTotal
1Asphalt666664996631
2Meadows18618618,27718,649
3Gravel212120572099
4Trees313130023064
5Painted Metal Sheets131313191345
6Bare Soil505049295029
7Bitumen131313041330
8Self-Blocking Bricks373736083682
9Shadows1010927947
Total42742741,92242,776
Table 3. The number of samples in the training set, validation set, and test set of the Botswana dataset.
No.Class NameTrainValTestTotal
1Water88254270
2Hippo Grass3395101
3Floodplain Grasses 188235251
4Floodplain Grasses 276202215
5Reeds88253269
6Riparian88253269
7Firescar88243259
8Island Interior66191203
9Acacia Woodlands99296314
10Acacia Shrub Lands78233248
11Acacia Grasslands99287305
12Short Mopane55171181
13Mixed Mopane88252268
14Exposed Soils338995
Total979730543248
Table 4. The number of samples in the training set, validation set, and test set of the Indian Pines dataset (partial class name abbreviation).
No.Class NameTrainValTestTotal
1Alfalfa224246
2Corn-notill717112861428
3Corn-mintill4142747830
4Corn1212213237
5Grass-pasture2424435483
6Grass-trees3736657730
7Pasture-mowed112628
8Hay-windrowed2424430478
9Oats111820
10Soybean-notill4949874972
11Soybean-mintill12312322092455
12Soybean-clean3030533593
13Wheat1010185205
14Woods636311391265
15Building-grass1919348386
16Stone-steel-towers558393
Total512512922510,249
Table 5. Classification results of different methods on Pavia University dataset (SpectralFormer is abbreviated as SpeFormer).
Class2DCNN3DCNNSpeFormerSSFTTMassFormerGSCVITMambaHSIWTCMC
191.0594.5391.3696.7398.9797.8297.9298.82
297.0798.7698.7399.7099.7999.3499.5299.85
368.5873.9475.9994.3293.9391.3475.9695.44
497.1698.0093.2497.6991.9796.6287.2397.59
599.6199.2399.8798.9598.2699.3498.2299.86
692.8187.8992.1299.1099.5597.3898.9899.87
764.2174.9570.6894.4799.8594.1986.9799.84
879.6690.2587.0296.0594.9594.9999.4395.92
997.6297.2293.0696.6195.3598.4196.5298.26
OA (%)91.82 ± 3.0494.06 ± 0.6293.33 ± 0.5898.19 ± 0.4798.23 ± 0.2097.78 ± 0.3796.26 ± 0.6898.94 ± 0.15
AA (%)87.53 ± 5.4090.53 ± 1.0689.12 ± 1.3797.07 ± 0.7996.96 ± 0.2996.65 ± 0.7592.75 ± 1.2598.38 ± 0.22
Kappa89.17 ± 4.0292.09 ± 0.8591.13 ± 0.7897.60 ± 0.6297.65 ± 0.2697.06 ± 0.4995.26 ± 1.2698.60 ± 0.20
Table 6. Classification results of different methods on Botswana dataset (SpectralFormer is abbreviated as SpeFormer).
Class2DCNN3DCNNSpeFormerSSFTTMassFormerGSCVITMambaHSIWTCMC
199.0910010097.4010098.0798.9499.45
288.0094.7497.1698.2199.4999.8999.63100
387.0397.7587.3796.4486.8398.6996.24100
489.7599.5064.5592.9791.7399.9510099.80
581.2686.6028.0691.3893.7294.9082.6994.70
674.9479.4573.2490.3694.1093.4894.3596.96
794.0299.8497.9599.22100100100100
872.8890.8968.1290.5210095.2494.3597.80
982.8894.2074.7898.3799.9797.4997.3399.93
1096.2298.2495.8896.6110099.6698.16100
1197.8097.7497.9889.5898.5898.3699.2099.72
1295.2497.8297.0698.0678.8199.5399.9499.47
1396.7996.9096.8798.9789.0099.9299.8898.69
1484.9487.3082.3689.8983.0492.8183.4490.79
OA (%)88.95 ± 1.3694.58 ± 1.6082.38 ± 2.3194.94 ± 2.3394.69 ± 0.8797.81 ± 1.3396.35 ± 0.8898.67 ± 0.79
AA (%)88.63 ± 1.5394.36 ± 1.5282.96 ± 2.2994.86 ± 2.3493.95 ± 0.8797.71 ± 1.1995.94 ± 0.8698.38 ± 1.11
Kappa88.03 ± 1.4794.13 ± 1.7380.90 ± 2.5194.51 ± 2.5294.24 ± 0.9597.62 ± 1.4496.74 ± 2.0198.56 ± 0.86
Table 7. Classification results of different methods on Indian Pines dataset (SpectralFormer is abbreviated as SpeFormer).
Class2DCNN3DCNNSpeFormerSSFTTMassFormerGSCVITMambaHSIWTCMC
169.7648.5414.3986.5955.2359.7692.2098.10
283.7779.8473.8594.7995.0793.0091.0896.56
386.9976.2076.4595.1397.4097.3491.5895.80
486.9572.5465.4093.1591.4790.5685.3596.15
591.7989.7284.3294.1198.0495.3894.1496.41
697.9897.9196.8397.6496.8099.3597.3799.38
789.6072.4025.6091.6098.5293.2097.5093.85
898.4299.3098.4499.9599.7199.9899.6399.84
971.6748.3317.7868.8963.6878.3395.6391.67
1088.7079.4975.1293.4397.7993.6893.3095.72
1193.5490.0985.4597.8198.7797.0797.8897.50
1280.8675.6756.1892.7793.7693.0986.8495.93
1310099.4696.4399.8498.6299.5198.3299.78
1496.5896.2494.2599.2899.1198.3298.4999.68
1587.7587.2974.4197.0391.8894.8494.4899.45
1697.5093.9392.7493.4573.9892.5090.2497.47
OA (%)90.93 ± 0.7886.82 ± 1.3881.68 ± 0.6596.30 ± 0.5096.75 ± 0.7795.91 ± 0.5594.78 ± 0.3697.50 ± 0.30
AA (%)88.86 ± 2.1681.69 ± 2.8770.48 ± 2.1293.47 ± 1.8590.62 ± 1.6992.24 ± 1.4294.00 ± 1.0097.08 ± 0.93
Kappa89.65 ± 0.8984.93 ± 1.5879.11 ± 0.7495.78 ± 0.5796.29 ± 0.8795.33 ± 0.6293.39 ± 0.7597.15 ± 0.34
Table 8. Ablation study results (SFE, LFSM, HFMC, and SCF) on three datasets (× indicates removed, ✓ indicates included).
Pavia University
No.SFELFSMHFMCSCFOA (%)AA (%)Kappa
1×88.48 ± 1.9484.09 ± 2.0784.81 ± 2.50
2×××98.74 ± 0.1798.11 ± 0.3198.34 ± 0.22
3××98.79 ± 0.1698.26 ± 0.3298.40 ± 0.21
4×98.68 ± 0.2598.10 ± 0.3798.25 ± 0.33
598.94 ± 0.1598.38 ± 0.2298.60 ± 0.20
Botswana
No.SFELFSMHFMCSCFOA (%)AA (%)Kappa
1×89.76 ± 2.3189.84 ± 2.2288.92 ± 2.49
2×××98.55 ± 0.5798.37 ± 0.7598.43 ± 0.62
3××98.56 ± 0.5098.16 ± 1.0998.44 ± 0.54
4×98.58 ± 0.7498.19 ± 1.0298.46 ± 0.81
598.67 ± 0.7998.38 ± 1.1198.56 ± 0.86
Indian Pines
No.SFELFSMHFMCSCFOA (%)AA (%)Kappa
1×92.48 ± 1.3389.77 ± 1.7691.45 ± 1.51
2×××97.32 ± 0.3196.51 ± 1.1596.95 ± 0.35
3××97.26 ± 0.4496.72 ± 1.3196.88 ± 0.50
4×97.21 ± 0.5596.88 ± 1.2796.82 ± 0.63
597.50 ± 0.3097.08 ± 0.9397.15 ± 0.34
Table 9. Ablation study results (wavelet transform) on three datasets (× indicates removed, ✓ indicates included).
Wavelet TransformMetricsPUBotswanaIP
×OA (%)98.89 ± 0.1998.51 ± 0.5797.58 ± 0.30
AA (%)98.33 ± 0.3198.38 ± 0.7696.71 ± 1.30
Kappa98.52 ± 0.2698.39 ± 0.6297.25 ± 0.35
OA (%)98.94 ± 0.1598.67 ± 0.7997.50 ± 0.30
AA (%)98.38 ± 0.2298.38 ± 1.1197.08 ± 0.93
Kappa98.60 ± 0.2098.56 ± 0.8697.15 ± 0.34
Table 10. Comparison of running times among different groups.
DatasetTime (s)Group = 1Group = 2Group = 4Group = 8
Pavia UniversityTrain35211614
Test6.675.222.782.23
BotswanaTrain21131110
Test0.490.310.220.18
Indian PinesTrain51352825
Test1.931.120.760.67
Disclaimer/Publisher’s Note: The statements, opinions and data contained in all publications are solely those of the individual author(s) and contributor(s) and not of MDPI and/or the editor(s). MDPI and/or the editor(s) disclaim responsibility for any injury to people or property resulting from any ideas, methods, instructions or products referred to in the content.