1. Introduction
Smart cities provide seamless integration of digital technologies to ensure quality of life and sustainability and enable real-time decision-making [
1]. They rely on a continuous flow of data gathered from sensors, monitoring systems, user devices, and other digital platforms [
2]. The elimination of fake or malicious data obtained in the network is a challenging task in smart cities, which are compromised by sensors, hostile attacks, or incorrect human input [
3]. False data misleads automated systems responsible for traffic control, energy distribution, healthcare services, and emergency response, leading to catastrophic consequences. Thus, identifying such data ensures the reliability and accuracy of data in smart cities, maintaining the trust and functionality of smart city ecosystems [
4]. The diversity and energetic nature of data sources in smart cities enable the effective detection of complex fake data [
5]. This task involves the use of an extensive communication protocol, data formats, and device capabilities that overcome the challenges of conventional data validation algorithms [
6]. Furthermore, fake data generate original patterns and make effective anomaly detection methods ineffective.
Data integrity refers to the accuracy, consistency, and trustworthiness of data throughout its lifecycle, from generation to processing and storage. For instance, incorrect traffic data can mislead automated control systems, while false health sensor data may endanger lives. Ensuring high data integrity is essential for maintaining the reliability of real-time decision-making systems [
7]. This enables accurate analytics and upholds public trust in smart infrastructure. In smart city ecosystems, data is continuously collected from a vast array of sources. Any compromises in data integrity, whether due to malicious tampering, sensor failure, or transmission errors, have severe consequences. Therefore, detecting and limiting fake or anomalous data at an early stage have become a critical cybersecurity requirement in modern urban environments.
Thus, advanced approaches capable of identifying complex patterns and subtle anomalies are required [
8]. Numerous existing models investigate fake data detection using statistical and cognitive approaches. However, traditional models suffer from high computational complexity, poor scalability, an inability to handle imbalanced datasets, or a lack of adaptability [
9]. In many cases, they fail to generalize the processed data in real-world situations and detect fake data. Thus, an effective fake data detection model that is scalable, adaptive, and robust against emerging attack strategies has been developed [
10]. It distinguishes real and fake data inputs accurately in smart city applications concerning the validation of the efficiency of user behavior, data distribution, and contextual features [
11].
This work focuses primarily on the detection of anomalous and fake data packets above the network layer (i.e., the network, transport, and application layers of a smart city). It is necessary to acknowledge that significant security concerns exist in the lower layers of the communication stack. Meanwhile, the nature of threats and the methods used to address them differ fundamentally from the anomaly and data integrity issues. Hence, this work distinguishes itself by focusing on high-level data integrity, fake data injection, and anomalous behaviors in IoT systems. By employing a hybrid model that integrates optimized feature selection (ET-PBO) and a robust ensemble classification framework (SE-RAQD), this study offers a technically efficient and scalable solution for data anomaly detection in smart city and cyber–physical infrastructures.
1.1. Motivation
Traditional machine learning frameworks struggle to maintain accuracy and robustness in the presence of noise and class imbalance data in real-world applications. Furthermore, traditional models tend to overestimate and include irrelevant or redundant features. It is essential to obtain an intelligent algorithm that diminishes dimensionality by ensuring data integrity. These limitations are addressed by a hybrid model that merges the Elite Tuning-based Polar Bear Optimization (ET-PBO) algorithm, which performs superior feature selection, with a Stacking Ensemble-based Random AdaBoost Quadratic Discriminant (SE-RAQD) model for robust classification. The ET-PBO model mimics polar bear behavior, balancing the exploration and exploitation phase results in selecting relevant features. Furthermore, SE-RAQD incorporates the complementary strengths of AdaBoost, QDA, and Random Forest with a stacking ensemble framework that enhances detection performance by diminishing noise and imbalanced and high-dimensional systems. This combined model can achieve accurate, understandable, and resilient fake data detection that secures data environments.
1.2. Novelty
The Introduction of Elite-Tuning-based Polar Bear Optimization (ET-PBO) for Feature Selection: The proposed method integrates a novel Polar Bear Optimization algorithm called Elite-Tuning-based PBO (ET-PBO) that prioritizes top-performing solutions in the process of improving convergence speed and avoids falling into the local optimal solution. Thus, the overall performance is improved, with highly effective feature subset selection, by using a hybrid strategy that minimizes the dimensionality of high-dimensional data.
Stacking-Based Ensemble Framework for Improved Generalization: The classification stage incorporates an effective ensemble model named Stacking-Ensemble-Based Random AdaBoost Quadratic Discriminant (SE-RAQD), which integrates three base learners: AdaBoost, Quadratic Discriminant Analysis (QDA), and Random Forest (RF). These models capture different decision boundaries: AdaBoost learns from difficult samples, QDA models class distributions probabilistically, and RF ensures robustness through bagging. The predictions of all three models are integrated through the stacking method, where a meta-learner learns to optimally weight their outputs. This model significantly enhances effectiveness and generalization capability, especially in complex, noisy, and imbalanced environments.
End-to-end Integration to Detect Fake Data: The proposed model presents a fully integrated end-to-end pipeline that starts with data collection and ends with fake data classification. Feature selection and classification are not treated as disjoint tasks; instead, the ET-PBO module optimizes feature subsets specifically tailored to enhance SE-RAQD’s classification accuracy.
Applicability to Real-World Noisy and Imbalanced Scenarios: The model is explicitly designed to handle imbalanced and noisy data, a common challenge in cybersecurity, IoT, and smart city infrastructures. The integration of ensemble diversity and adaptive optimization renders the model highly applicable to real-time fake data detection systems that require rapidly produced, accurate, and interpretable results.
1.3. Contributions
The significant contributions of this work are as follows.
Novel Feature Selection Algorithm: Elite-Tuning-Based Polar Bear Optimization (ET-PBO). In this study, ET-PBO was developed to effectively balance exploration and exploitation while searching for optimal feature subsets, reducing dimensionality while preserving crucial data. Overall, the classification performance is enhanced, and computational complexity is reduced.
Introducing Robust Stacking Ensemble Classifier: SE-RAQD. In this paper, a Stacking Ensemble-Based Random AdaBoost Quadratic Discriminant (SE-RAQD) model is introduced, leveraging the merits of three different base learners: Adaptive Boosting (AdaBoost), Quadratic Discriminant Analysis (QDA), and Random Forest (RF). Overall, the SE-RAQD model enhances resilience against noise, overfitting, and class imbalance.
Integration of Feature Selection and Ensemble Classification for Fake Data Detection: The proposed framework integrates ET-PBO for feature selection with the SE-RAQD ensemble classifier to develop a highly effective and scalable fake data detection system. Before classification, this integration optimizes feature relevance, thereby improving the predictive accuracy and generalization in real-world noisy and high-dimensional data scenarios.
Comprehensive Evaluation of Benchmark Datasets: During fake data detection, multiple benchmark datasets were evaluated using the proposed model. The simulation findings demonstrate significant improvements over state-of-the-art methods, highlighting the model’s practical applicability.
The remaining sections are organized as follows.
Section 2 reviews past studies related to fake data detection in smart cities.
Section 3 and
Section 4 present the proposed methodology.
Section 5 and
Section 6 analyze the experimental results, and
Section 6 concludes the paper, outlining the scope of future studies.
2. Literature Review
Asavisanu et al. (2025) [
12] developed the Cooperative Autonomy Trust and Security (CATS) model to enhance security in Vehicle-to-Everything (V2X) communications. The CATS model’s performance was validated using real-time traffic data, and the results highlighted superior performance in detecting misbehaving vehicles. Sani et al. (2024) [
13] presented a blockchain-enabled intrusion detection system (BIDS) to improve security and reliability within the Internet of Vehicles (IoV). The mobility patterns were generated in BIDS and used to enhance the model, with effective performance in terms of detecting malicious vehicles accurately.
He et al. (2023) [
14] generated an unsupervised reward learning approach using Long Short-Term Memory (LSTM) with a Q-learning algorithm (LSTM-Q) to enhance robustness in anomaly detection with minimum traffic issues. In real-time data validation, the city of Brisbane was used to analyze the efficiency of the LSTM-Q model. Nayak et al. (2023) [
15] introduced a Machine Learning-Based Misbehavior Detection System (ML-MDS) for Cognitive-Software-Defined Multimedia Vehicular (CSDMV) networks in smart cities. The UNSW_NB-15 dataset was used for analysis, and it was found that the ML-MDS model achieved superior detection performance in the detection of malicious vehicles.
Ji et al. (2024) [
16] presented a hybrid approach that merges the Cyber-Physical Digital Twin with a deep learning-based Intrusion Detection System (IDS). The response strategies were developed by the Digital Twin, and the response was effectively carried out with a real-time monitoring process. Saleem et al. (2022) [
17] discussed enhancing traffic flow in smart cities using a Fusion-Based Intelligent Traffic Congestion Control System for VNs (FITCCS-VN). The advanced model offered better decisions with respect to avoiding traffic jams. The experimental results revealed that the developed FITCCS-VN model achieved superior performance in terms of enhanced traffic flow.
AlJamal et al. (2024) [
18] addressed fake clients by developing a simulated smart city model using the program Netsim. Wireshark was used to capture data flow and store files in CSV format. The findings from experiments demonstrated that the smart city model attained better performance in terms of detecting fake customers. Ajao et al. (2023) [
19] utilized Petri Net and Genetic-Algorithm-Based Reinforcement Learning (GARL) to enhance a robust security framework for smart cities. The simulation results revealed that this model achieved superior performance in terms of security. Ragab et al. (2025) [
20] implemented Advanced Artificial Intelligence with a Federated Learning Framework for Privacy-Preserving Cyberthreat Detection (AAIFLF-PPCD), which enhanced the privacy of IoT users in smart cities.
Mishra et al. (2024) [
21] developed the Hybrid Deep Learning Long Short-Term Memory–Support Vector Machine (LSTM-SVM) algorithm to safeguard various transactions in smart cities. The reptile search algorithm was used to select the crucial features, which were then allowed into the blockchain-based distributed network using the industrial gateway. The results highlighted that the developed LSTM-SVM attained more effective performance in securing transactions.
To authenticate transactions carried out by businesses, Kumar and Kumar (2024) [
22] developed a modified deep neural network (M-DN) classifier. The data was stored in a private blockchain using the Elliptic Curve Integrated Encryption Scheme (ECIES) after being authenticated as normal. Otherwise, the data was passed to the hybrid LSTM-XGBoost classifier for the detection of attack type. The evaluations showed that the developed model exhibited better performance in terms of accuracy and encryption time.
Arif et al. (2023) [
23] developed a model based on a Generative Adversarial Network (GAN) and Deep Reinforcement Learning (DRL) to generate fully functional adversarial malware samples that can evade detection by machine learning-based malware detectors while preserving their malicious behavior. The unfiltered feature set of the malware dataset was fed into the GAN. The findings revealed that the developed GAN-DRL model attained more effective performance.
Research Gaps and Limitations
Although various models have been developed to improve security, traffic management, and anomaly detection in smart city and vehicular networks, several limitations persist. Many of the existing models lack scalability and generalization in heterogeneous environments with diverse data sources. Real-time responsiveness is another important concern, as some methods are computationally intensive, making them less suitable for dynamic environments. Furthermore, the limited integration of feature optimization and adaptive learning strategies reduces detection efficiency, rendering existing algorithms ineffective against emerging threats and fake data patterns. Privacy-preserving approaches face difficulty in balancing detection accuracy with user data confidentiality. These gaps highlight the need for a robust and intelligent framework that can achieve accurate, real-time fake data detection while being efficient, adaptive, and privacy-aware across various smart city infrastructures.
3. Intelligent Urban Infrastructure Framework—A System Design
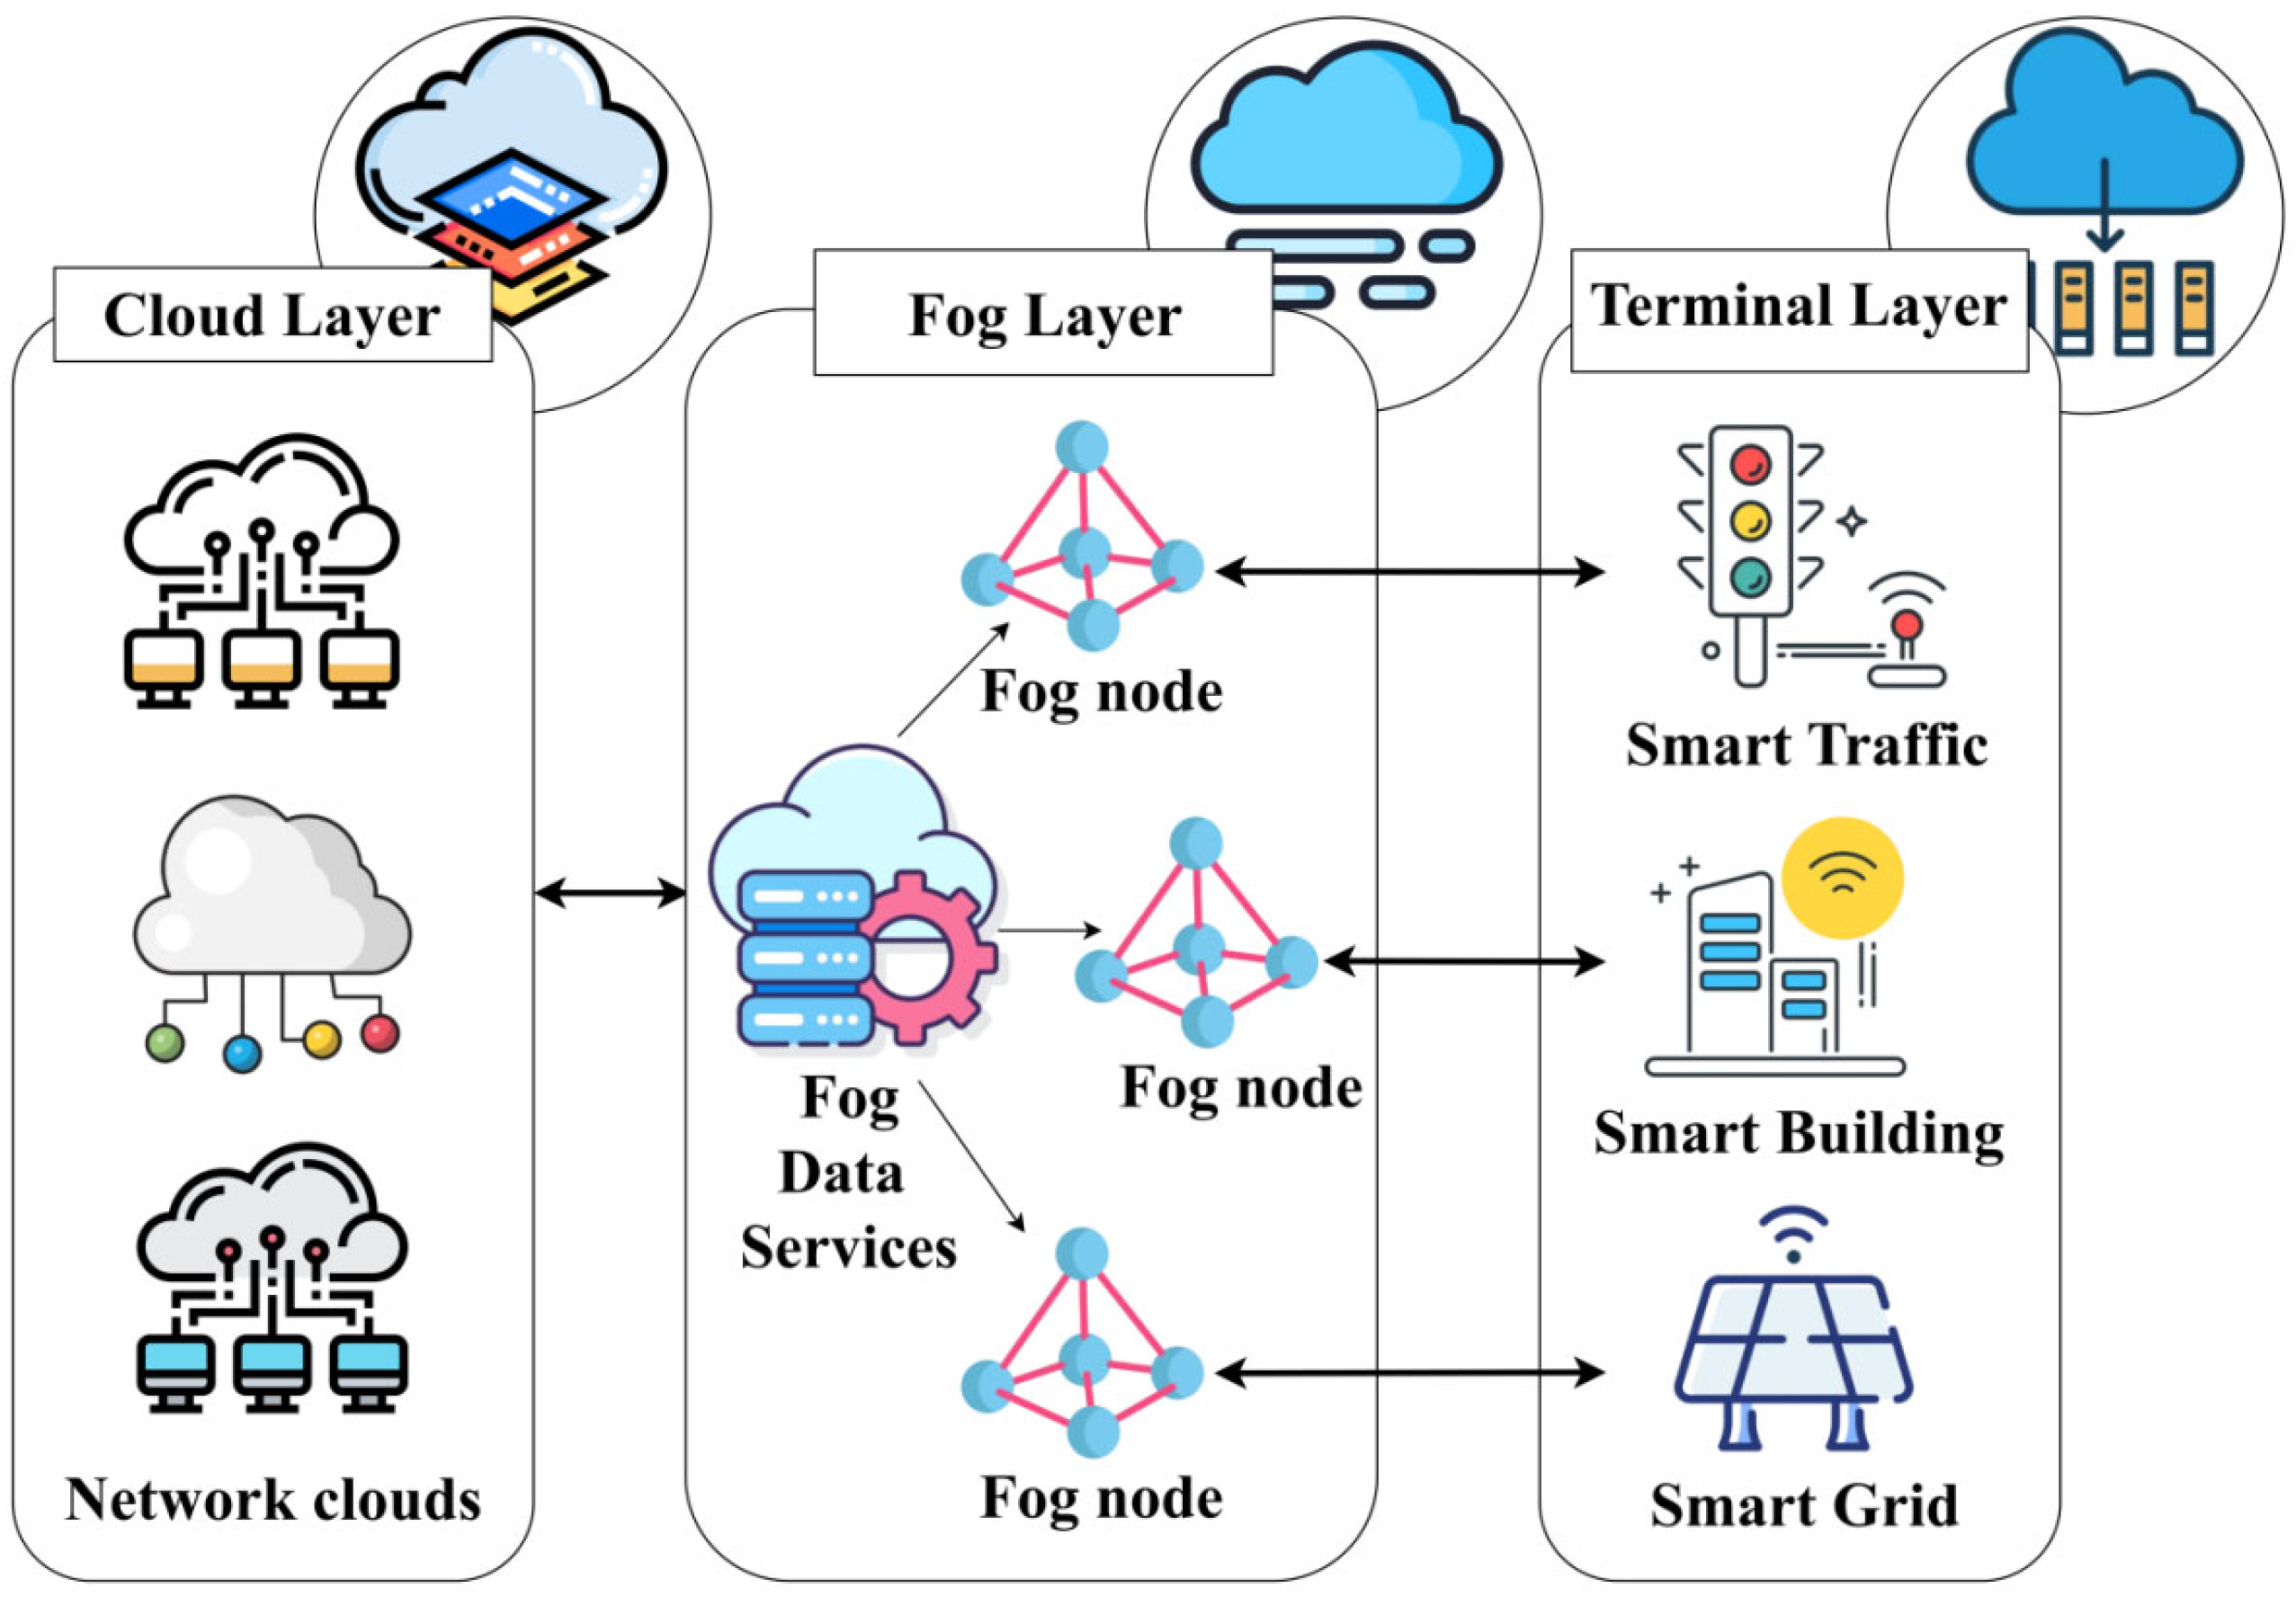
The smart city architecture includes three interconnected layers, as depicted in
Figure 1.
Cloud Layer: Centralized Intelligence and Storage Backbone
The cloud layer functions as the centralized core of the smart city infrastructure. It is responsible for the long-term storage, advanced analytics, decision support, and global coordination of data collected from across the urban environment. The cloud hosts high-performance computing resources, databases, machine learning models, and visualization tools that facilitate macro-level planning and policy execution.
In the cloud layer of the proposed smart city architecture (
Figure 1), integrating a Verifiable Query Layer (VQL) significantly enhances the efficiency, transparency, and security of data access and management.
VQL enables verifiable cloud query services, allowing users or smart applications to query large volumes of sensor data stored in the cloud while receiving cryptographic proof of the correctness and completeness of query results.
This capacity is especially critical in blockchain-integrated systems, where VQL can act as a trusted interface between off-chain storage and on-chain smart contracts or decentralized applications.
By deploying VQL within the cloud layer, smart city stakeholders can make auditable, efficient, and privacy-preserving queries.
This framework also aligns with federated environments, where multiple data contributors require proof of query fairness and consistency.
Fog Layer: Localized Processing and Real-Time Response
The fog layer, also referred to as the edge-computing interface, acts as an intermediary between the terminal layer and the cloud. It consists of distributed micro-data centers or edge nodes strategically positioned across different zones of the city. These nodes handle time-sensitive computations, local decision making, and preliminary analytics before passing refined data to the cloud.
Terminal Layer: Perception and Data Acquisition
The terminal layer is composed of an extensive network of IoT devices deployed throughout urban infrastructure. These devices include sensors, actuators, RFID tags, smart meters, cameras, and wearable devices embedded in systems such as public transportation, utilities, street lighting, buildings, and personal environments.
4. Proposed Methodology
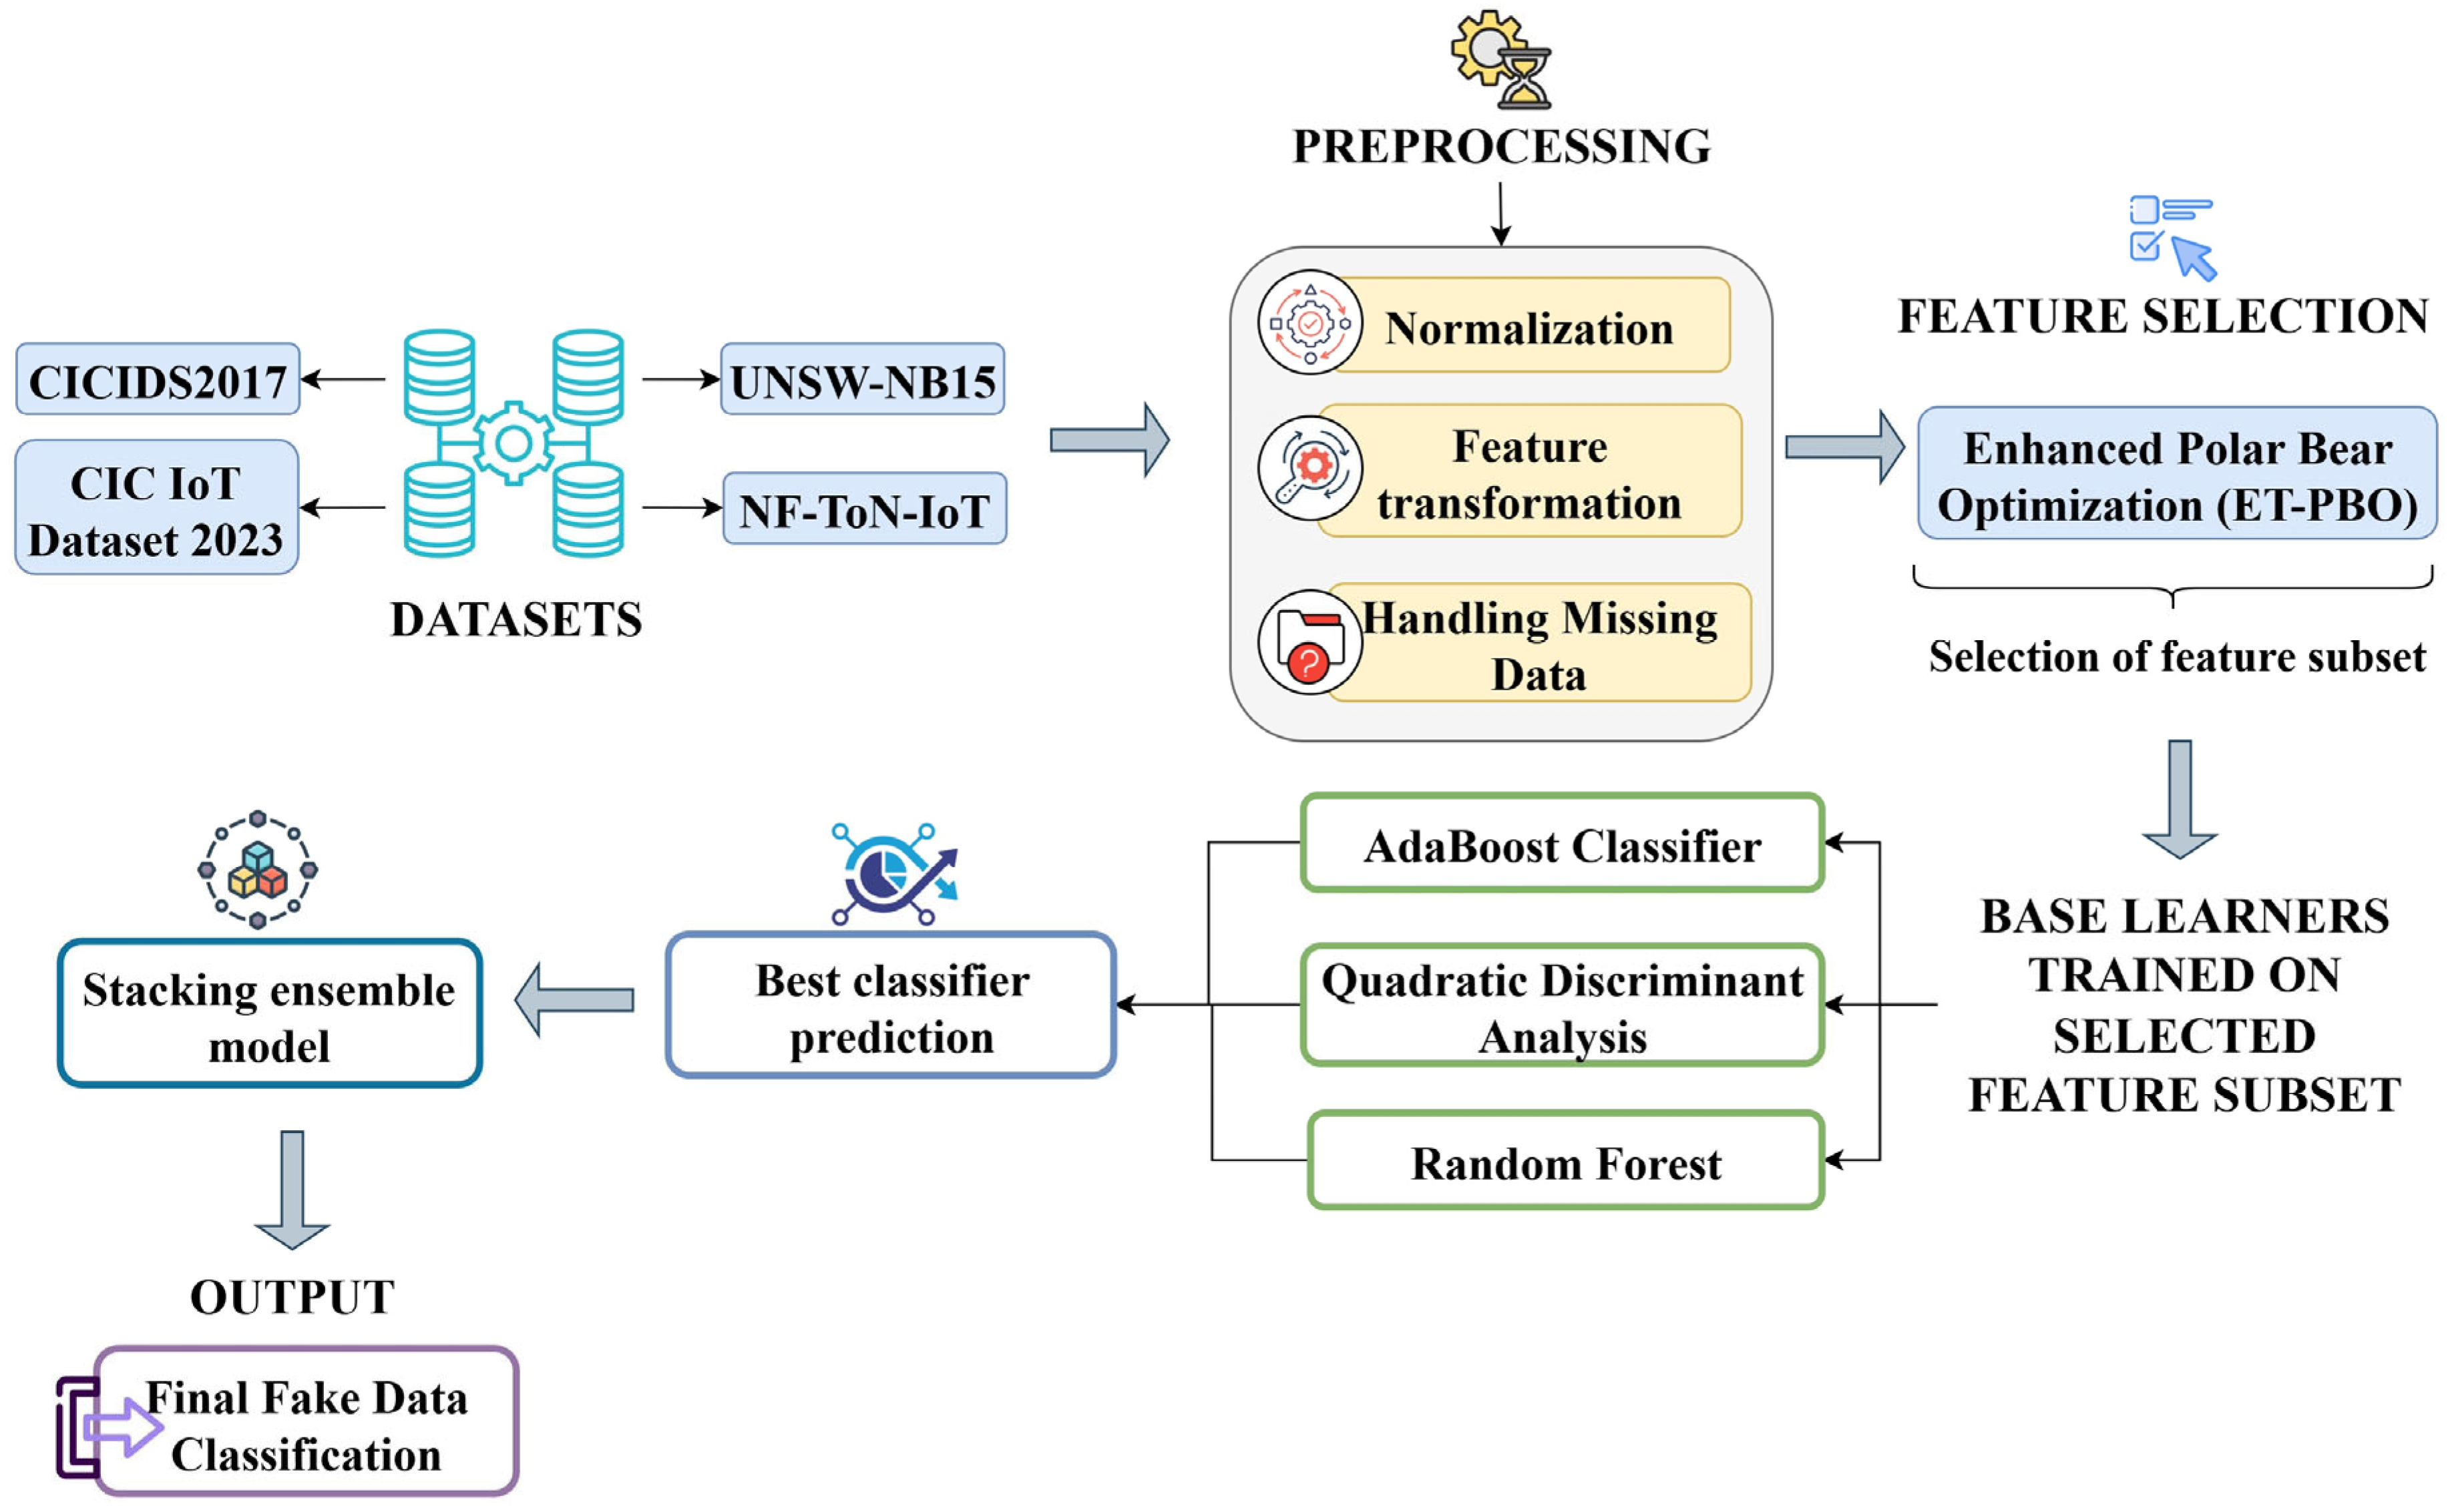
Figure 2 illustrates the conceptual framework of the proposed methodology designed to detect fake data accurately, particularly in noisy datasets common to smart city environments, IoT ecosystems, and cyber-physical systems. Five key stages, namely, Data Collection, Preprocessing, Feature Selection, Classification, and Prediction of Fake Data, are incorporated into this hybrid framework by applying a novel combination of Elite-Tuned Polar Bear Optimization (ET-PBO) for feature selection and the Stacking-Ensemble-based Random AdaBoost Quadratic Discriminant (SE-RAQD) model for classification.
4.1. Data Collection
In this study, the following four datasets were employed in detecting fake data.
Dataset Description
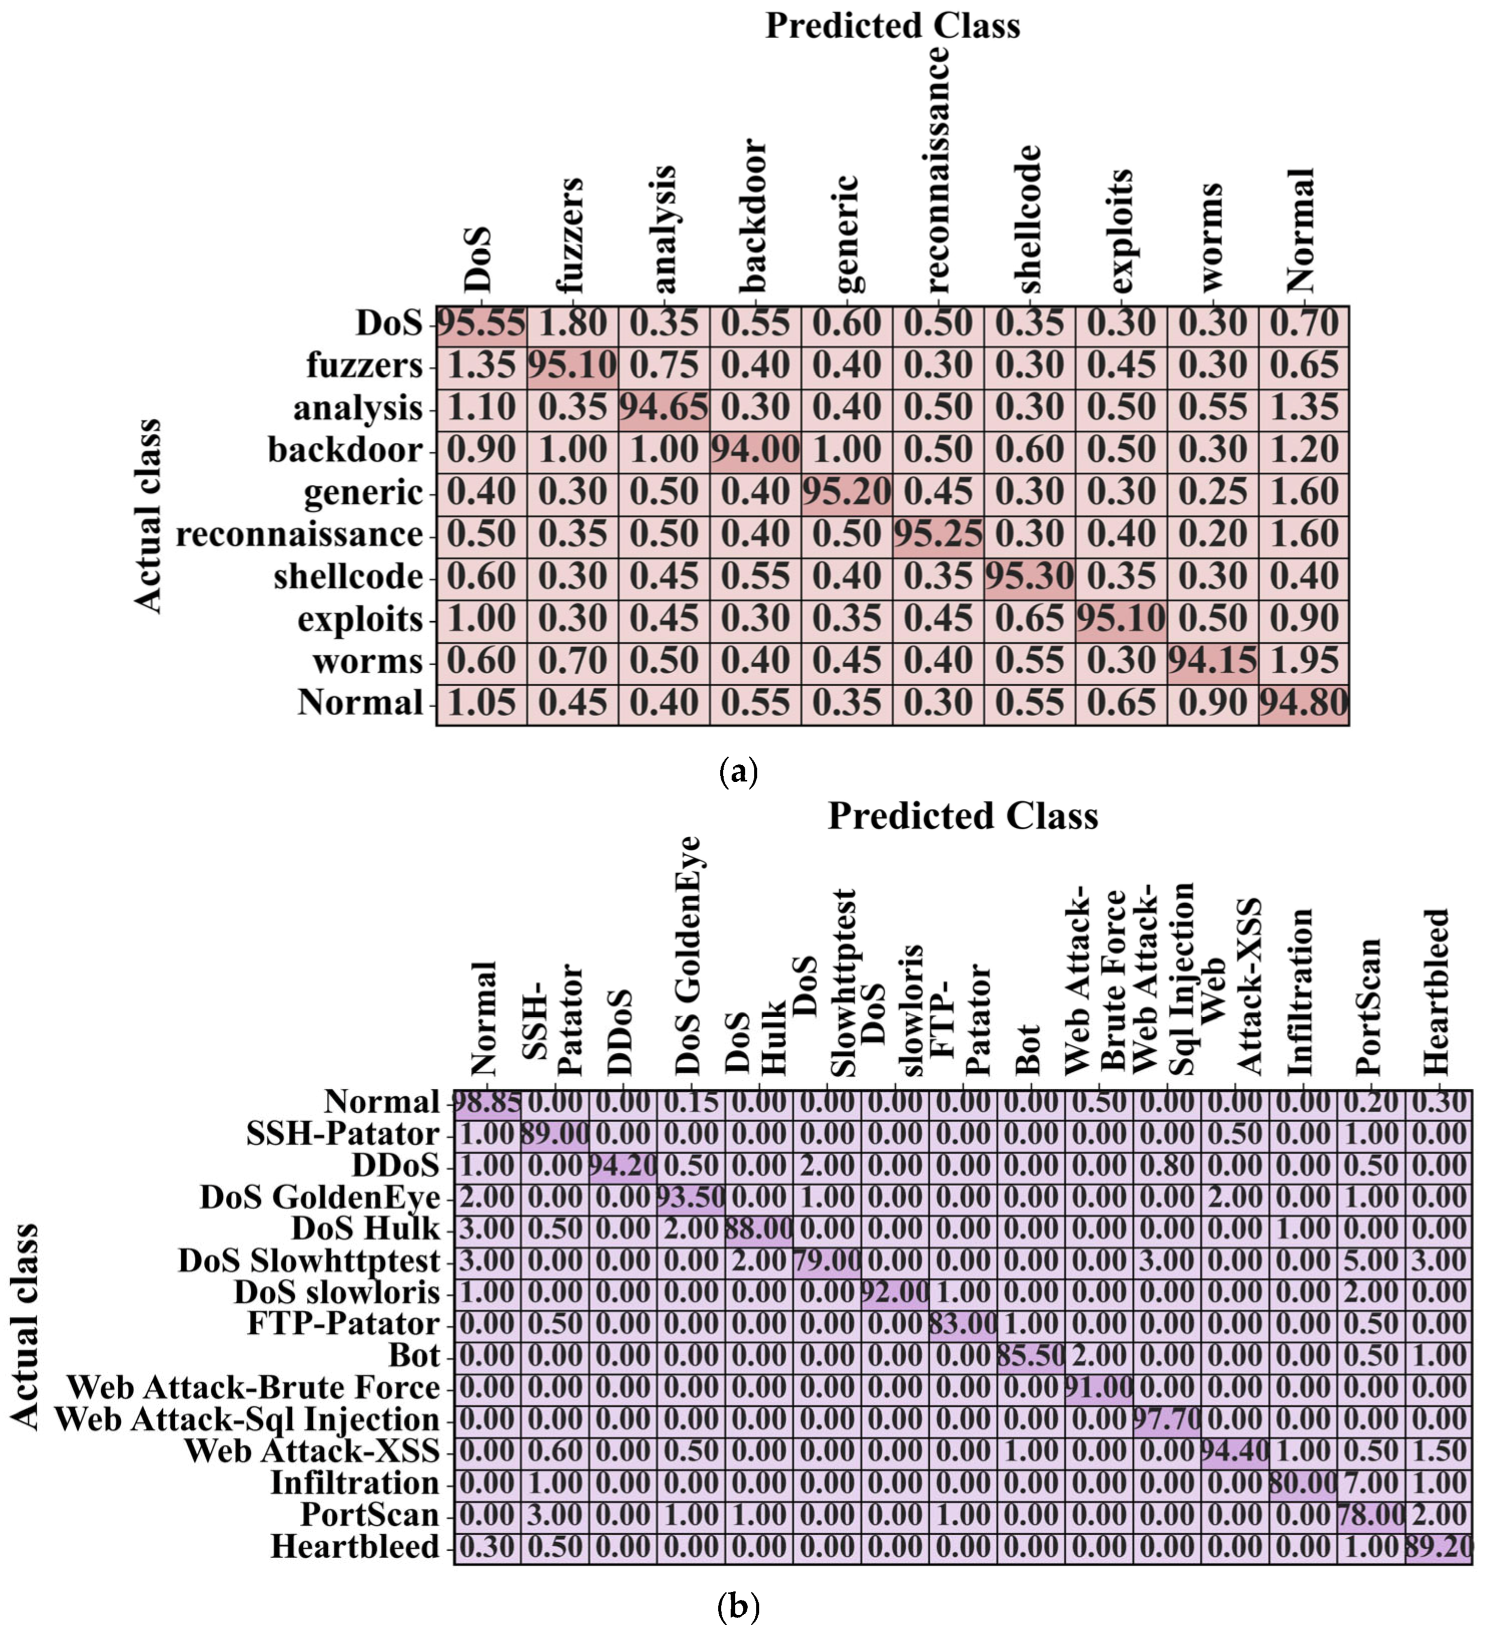
UNSW-NB15 dataset: This dataset (
https://www.kaggle.com/datasets/mrwellsdavid/unsw-nb15 (accessed on 7 August 2025)) was published by the Lab of the Australian Centre for Cyber Security, comprising 44 features that are numerical or nominal values. The dataset includes 257,673 records and 10 types of attacks.
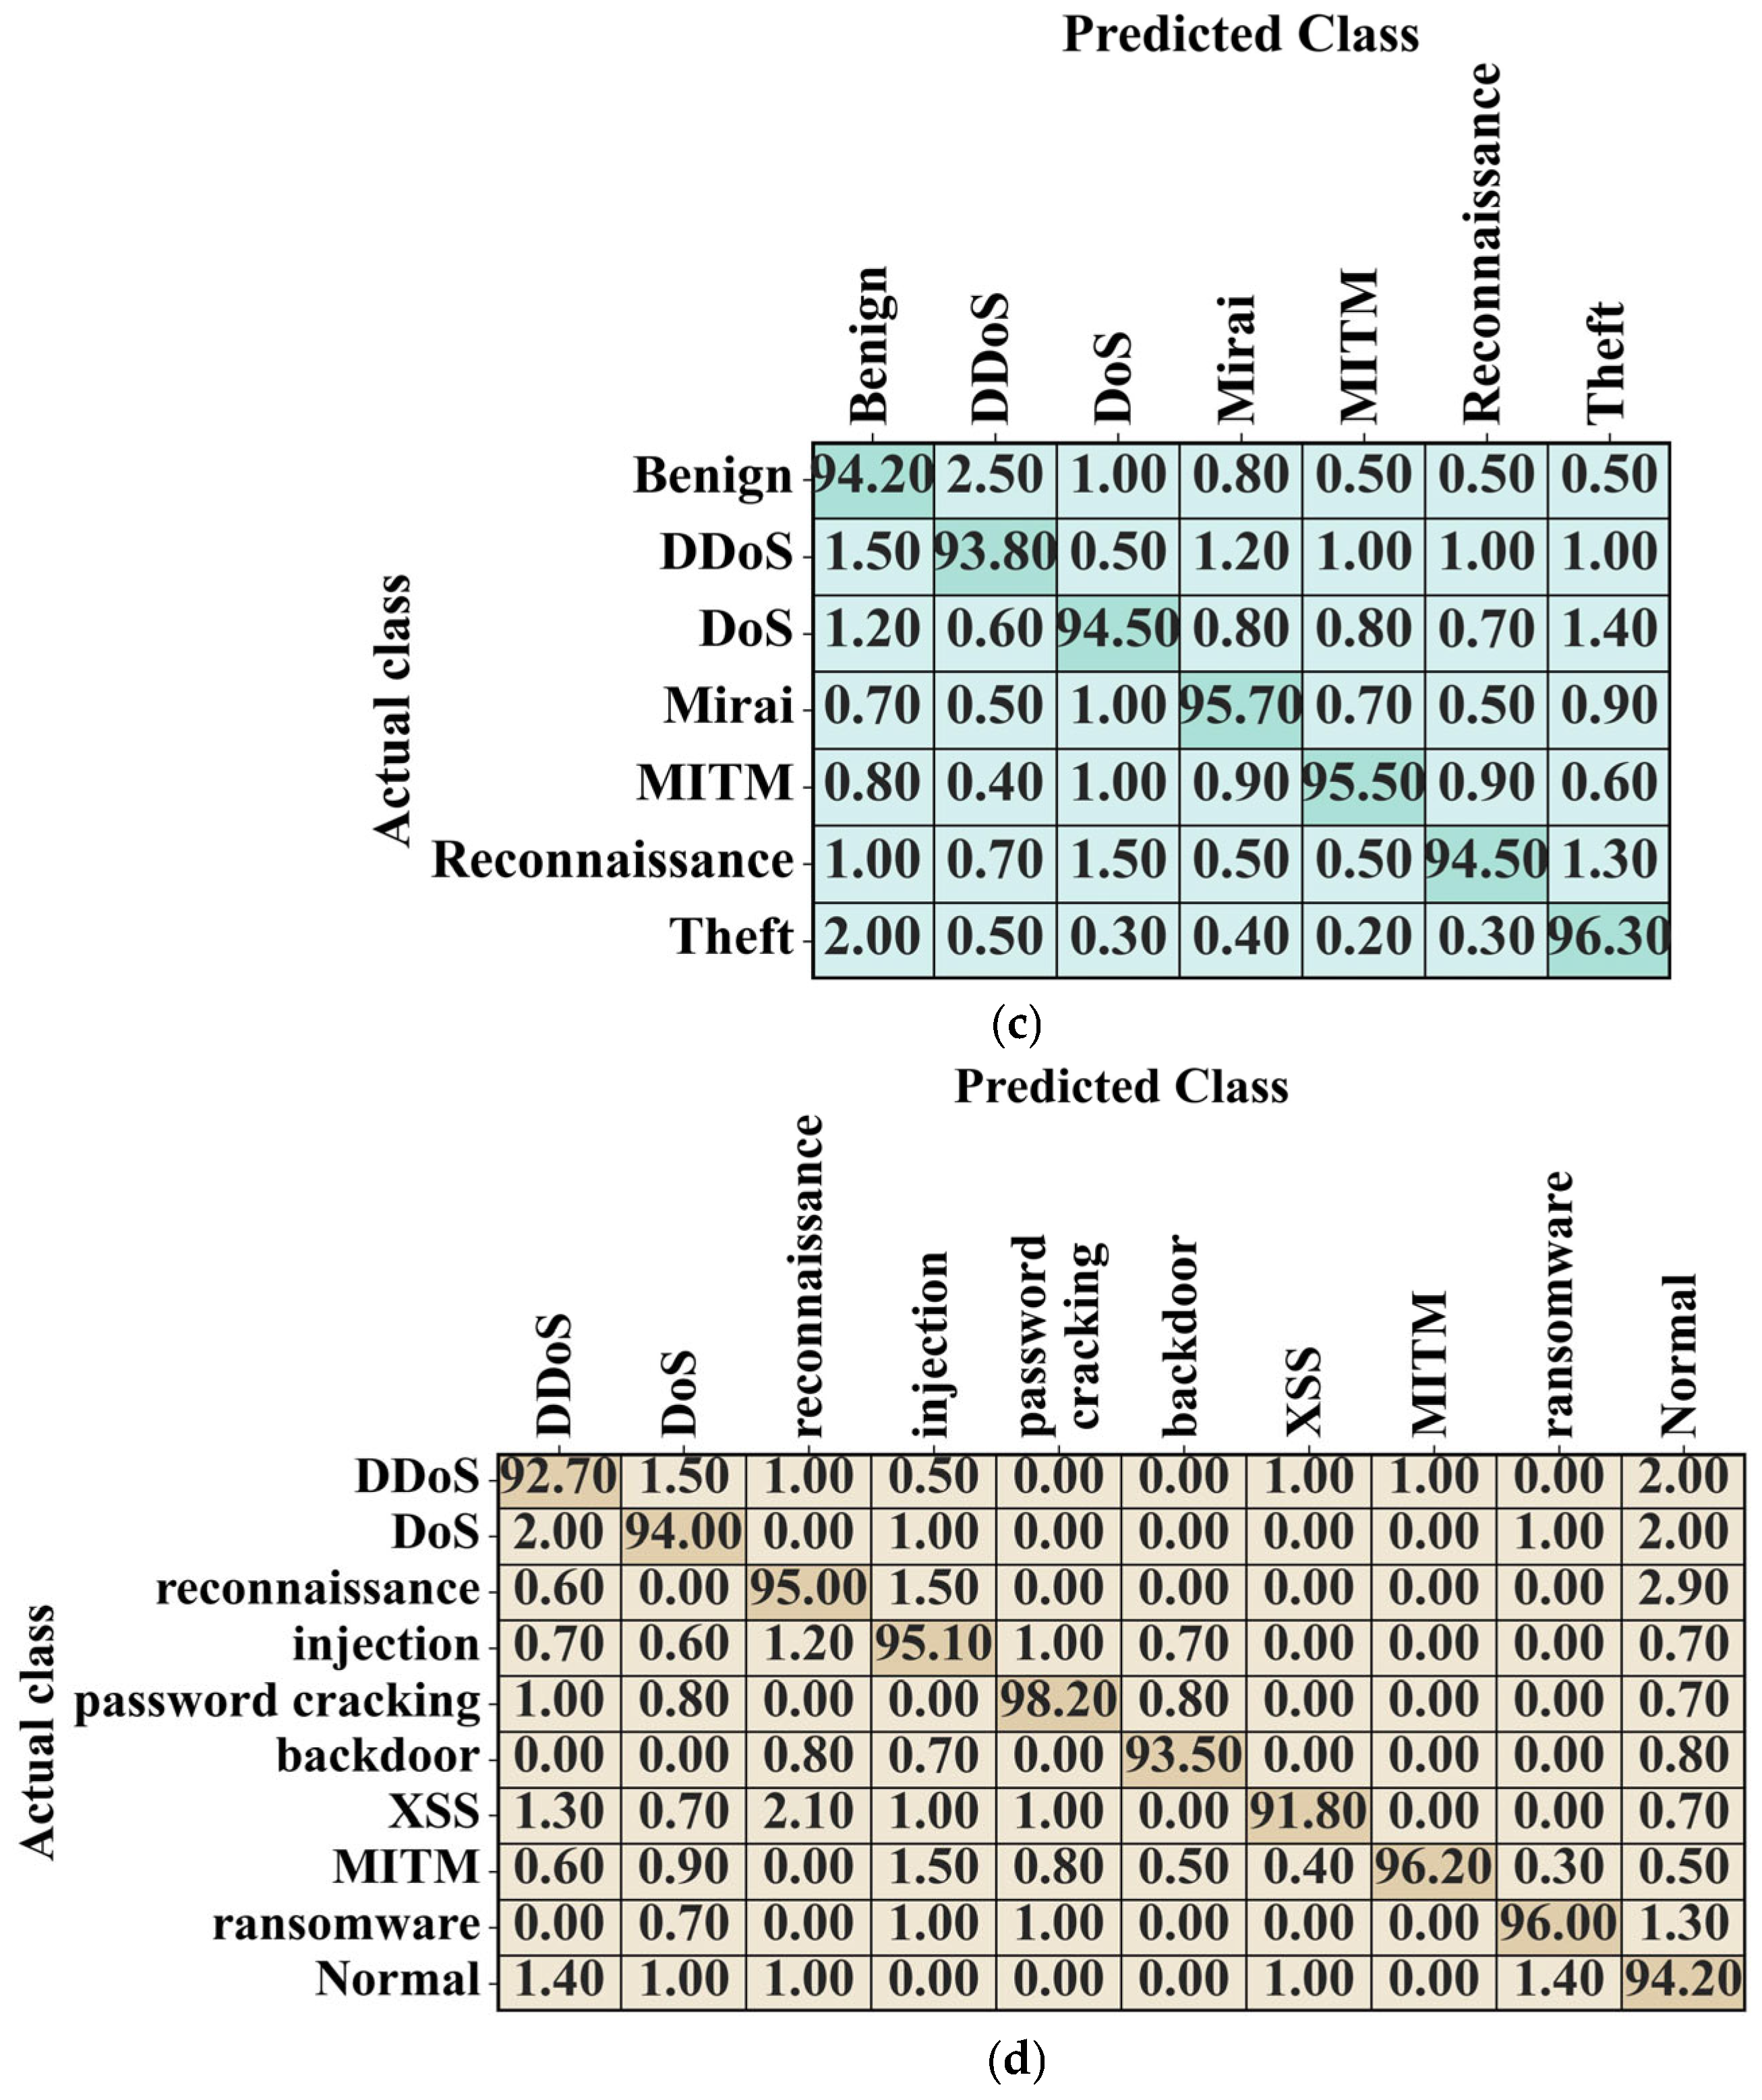
CIC IoT Dataset 2023: This dataset, which focuses on IoT network traffic, was primarily developed for intrusion detection (
https://www.kaggle.com/datasets/akashdogra/cic-iot-2023 (accessed on 7 August 2025)). It has seven different classes: Benign, DDoS, DoS, Mirai, MITM (Man-in-the-Middle), Reconnaissance, and Theft. The dataset, which is used to develop and evaluate security solutions for IoT environments, contains both normal and malicious traffic instances.
NF-ToN-IoT dataset: This dataset (
https://www.kaggle.com/datasets/dhoogla/nftoniot (accessed on 7 August 2025)) captures real-world traffic from various IoT devices, and it contains both normal traffic and various attacks, including DDoS, DoS, espionage, injection, password cracking, backdoor, XSS, MITM, ransomware, and normal. This dataset is helpful in research on smart cities and industrial IoT infrastructures, assisting in developing advanced security mechanisms through anomaly detection techniques.
4.2. Data Preprocessing
Data preprocessing ensures that raw data collected from various sources is converted into a format suitable for analysis and model training. This step typically involves several key approaches, which are described below.
Normalization: For processing, the data transformation of the min–max scaling method [
24] is used. It is expressed in the equation below.
where
,
,
, and
represent the minimum, maximum, normalized, and input values, respectively.
Handling Missing Data: In this process, the collected data is effectively handled, and information leakage is reduced [
25]. Furthermore, sufficient data—obtained using the averaging process—is found, and missing data is identified. This process yields an average value that can be used to calculate the average range of the data obtained from the specified factors. The mathematical expression is given as follows.
where the anticipated ranges obtained for gap filling are denoted by
, and the observed number of non-missing values is represented by
and
, respectively.
Feature transformation: This includes approaches such as one-hot encoding [
26] for categorical variables, converting categories into binary matrices, and other transformations that improve the representational power of the data. It also includes dimensionality reduction approaches to simplify the dataset while retaining essential information.
For a categorical feature
with
categories,
binary features are created.
4.3. Feature Selection Using Elite-Tuning-Enhanced Polar Bear Optimization (ET-PBO)
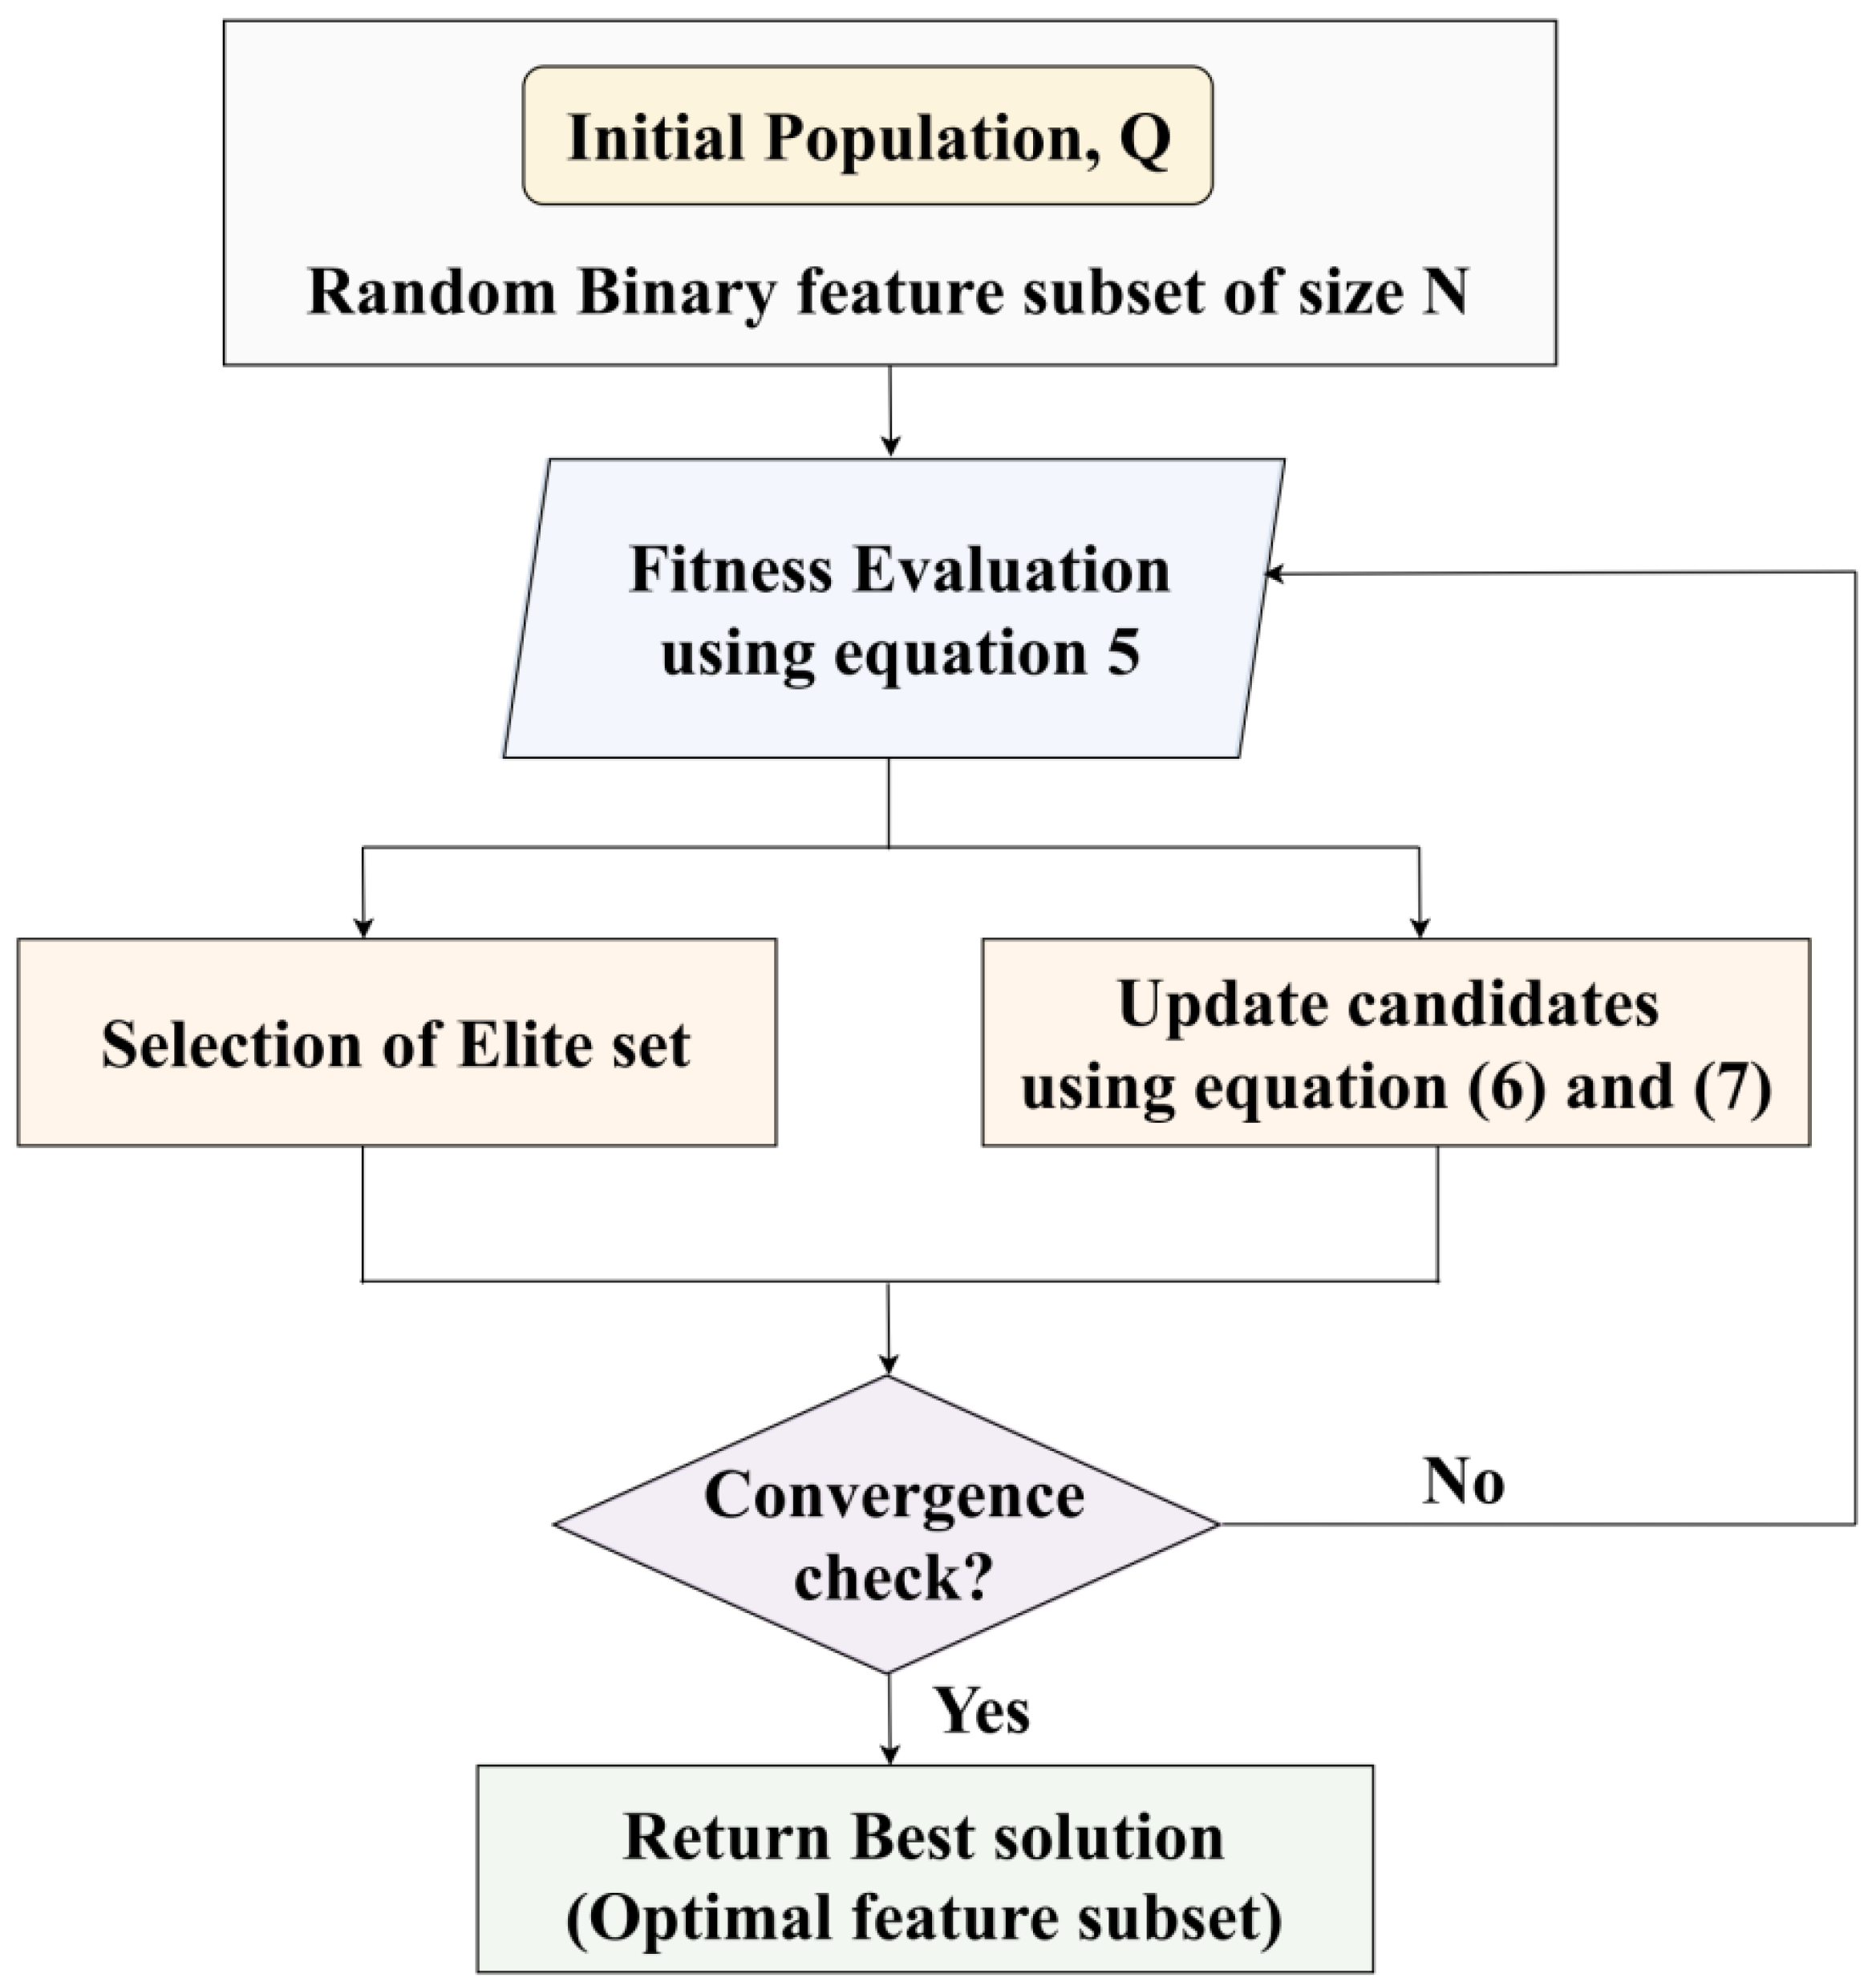
In smart city network analysis, high-dimensional datasets face a few major difficulties, including the presence of irrelevant or redundant features. This degrades the classification performance of a model because of overfitting and increased computational complexity. These difficulties are addressed by the proposed approach via integrating an Elite-Tuning-enhanced Polar Bear Optimization (ET-PBO) algorithm. Let us consider each solution (or candidate) as a “polar bear” searching for food in a large, icy region (i.e., the feature space). The current location of each bear represents a selected subset of features. The bear moves by adjusting its position based on two strategies: (1) exploration, which allows the investigation of new areas, and (2) exploitation, which focuses more on the areas already known to be good.
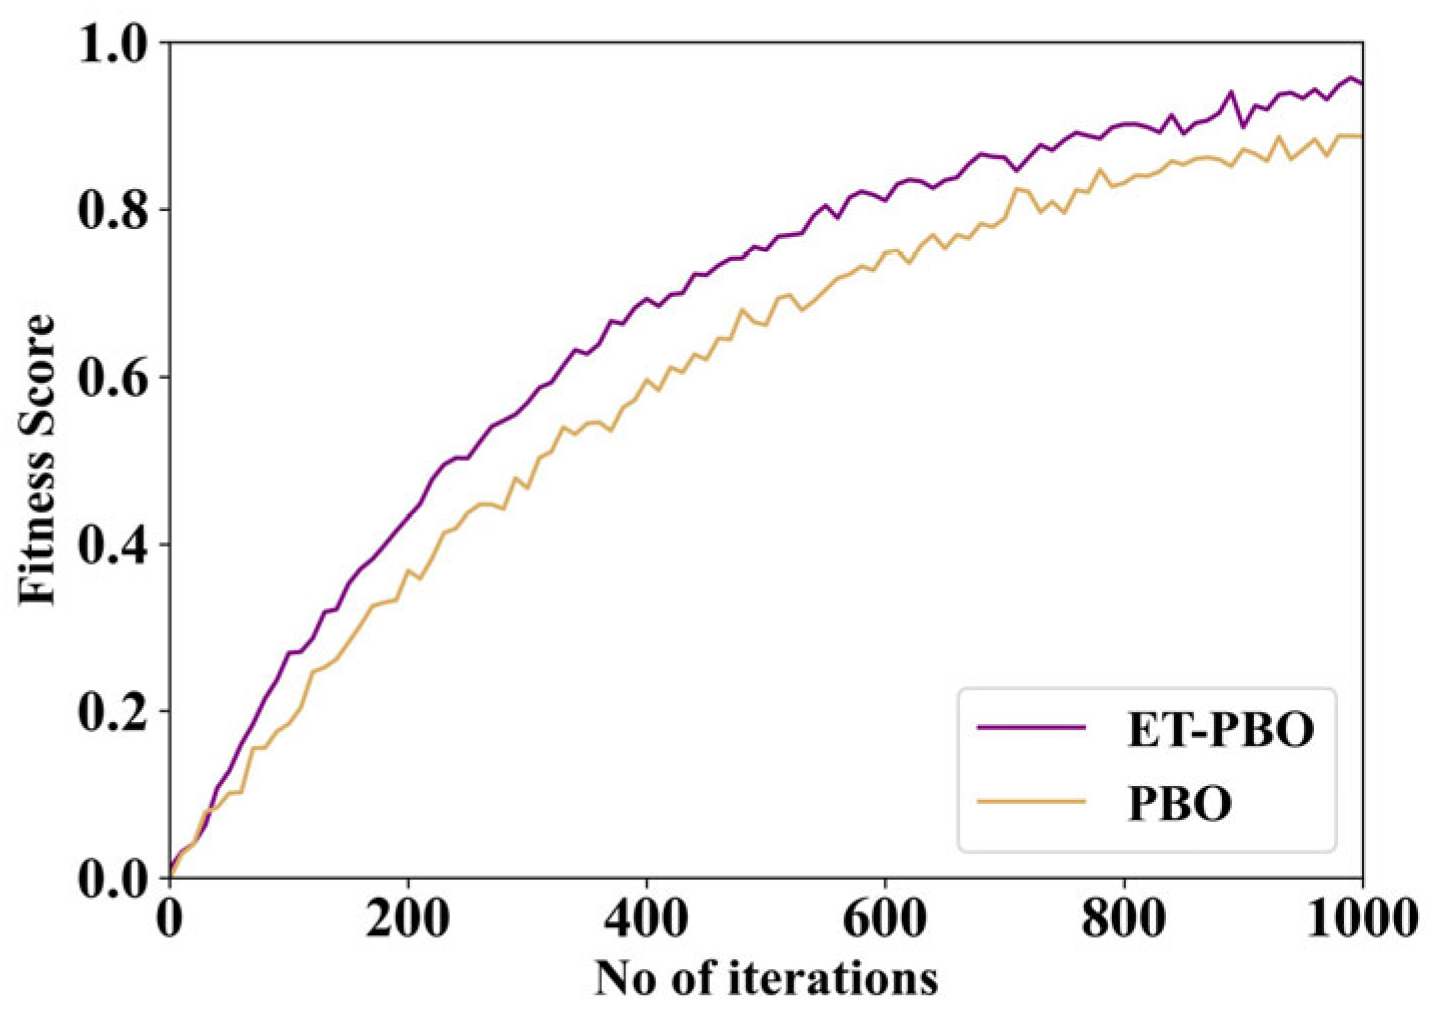
Let us consider that the dataset has a total of 10 features. One candidate solution might be a binary vector like 1010101010, where 1 means a feature is selected, and 0 means the features are not selected. ET-PBO evaluates this solution based on how well a classifier performs using these features. If better-performing candidates (bears) select different subsets like 1111000000, the current bear may move closer to that configuration using controlled randomness. Elite tuning ensures that only the top-performing bears guide the search, accelerating convergence and avoiding poor local optima. This process repeats iteratively until the best subset of features is found, minimizing redundancy while maximizing classification accuracy. The final selected features are then passed to the SE-RAQD classifier stage.
This algorithm can select the most significant and relevant feature subset by balancing the exploration and exploitation phases. Overall, the classification accuracy is enhanced while reducing dimensionality.
Consider a dataset with
features denoted by the set
[
27]. In the search space, each candidate solution is encoded as a binary vector.
where
represents the feature inclusion
, and
represents its exclusion. The fitness function
computes each candidate solution
, and it is expressed using the equation below.
where the classification accuracy attained by classifier training is represented by
. The number of selected features is denoted by
. The weighting factors are denoted by
and
.
The ET-PBO algorithm randomly initializes several candidate feature subsets
to simulate the distribution. Each candidate repeatedly updates its position by simulating polar bears’ hunting strategies, including path tracking and stealth movement, enabling efficient navigation through the feature subset space, and this process is improved by elite tuning, in which the convergence speed is increased. Elite tuning also assists in avoiding problems relating to local optima. The equation below expresses the position update of each candidate
in the population.
where the position of candidate
in the
iteration is denoted by
. The position vector from the elite set is denoted by
. The control parameters are represented by
and
. The random vector that introduces stochasticity is denoted by
. The difference operator modeling the movement towards elite solutions is denoted by
.
Since this problem is binary, after updating, the continuous position vector is mapped back to a binary solution using a sigmoid transfer function
, and this process is followed by thresholding.
where the continuous position for the feature
before binarization is
. The probability of the binary solution
for the
feature at iteration
is denoted by
. This algorithm iterates until a maximum number of iterations
is reached.
The ET-PBO approach minimizes dimensionality by removing unnecessary features, thereby improving generalization capacity. The binary vector is the final output of ET-PBO, denoting the optimal feature subset. This vector, when used as input to the downstream Stacking Ensemble-Based Random Adaboost Quadratic Discriminant (SE-RAQD) model, maximizes classification accuracy while also reducing redundancy, noise, and irrelevant features. Furthermore, learning efficiency is enhanced by the ET-PBO approach, and it assists in detecting fake data or cyber anomalies in smart city environments. The algorithm for ET-PBO Algorithm 1 is given below.
Figure 3 depicts a flowchart of the ET-PBO algorithm.
| Algorithm 1: ET-PBO Algorithm for optimal feature selection |
| Input: Dataset with feature set, population size , max iterations |
Initialize the population with random binary vectors
Evaluate fitness for each in
Initialize elite set with top solutions from
For in range :
For each candidate in :
Select elite solution from
# Update position towards the elite and add random exploration
continuous =
# Apply the sigmoid transfer function and binarize
for in range :
if
Evaluate fitness
Update the elite set with top solutions from the current population
Update if better solution found
Return |
| Output: Optimal feature subset |
4.4. A Novel SE-RAQD for Fake Data Detection in Smart Cities
The rapid expansion of smart cities facilitates intelligent automation across areas like traffic control, safety management, environmental tracking, and utility operations. Despite these advancements, the limited computational resources and diverse communication standards of IoT devices expose them to various cyber threats, including spoofing and denial-of-service (DoS) attacks, malicious data injection, and botnet-based intrusions. In this study, these complexities are addressed by introducing the Stacking Ensemble-Based Random AdaBoost Quadratic Discriminant (SE-RAQD) model that integrates the three base classifiers such as the ADA, QDA, and RF using the SEL strategy. This hybrid model enhances generalization and detection accuracy and effectiveness against adversary behaviors in IoT-based smart city networks.
4.4.1. AdaBoost Classifier
AdaBoost [
28] is a sequential ensemble method that constructs a strong classifier by integrating a series of weak learners, typically decision stumps. In every iteration, AdaBoost assigns greater importance to the incorrectly classified instances by boosting their weights, compelling the next weak learner to concentrate more on these challenging examples. The equation below expresses the final decision function of AdaBoost.
The prediction of the
weak learner is
, and its corresponding weight is represented by
. This weight is evaluated based on the classification accuracy.
where the classification error rate of
is denoted by
. The final binary class label is denoted by
. This mechanism ensures that the best-performing learners have a greater influence on the final outcome, making AdaBoost very effective in dealing with high-stakes situations.
4.4.2. Quadratic Discriminant Analysis (QDA)
QDA [
29] allows for a quadratic decision boundary because the covariance is handled separately for each class. The probability of observing a sample
given class
is
In the above equation, the mean vector and covariance matrix of class are denoted by and , respectively. The total number of features is denoted by . The Bayes theorem is used to evaluate the posterior probability . The class label is assigned to attain the final classification. The strength of QDA relies entirely on its ability to model class-specific distributional properties, making it very useful in a domain where class variances are heterogeneous.
4.4.3. Random Forest (RF)
RF [
30] is a bagging-based ensemble method where two levels of randomness are employed. The equation below expresses the prediction function for RF.
where the output of the
decision tree in an ensemble of
trees is denoted by
. This method minimizes the overfitting issues by averaging the multiple low biases in which the stable and accurate classifier is developed.
4.4.4. Stacking Ensemble Mechanism
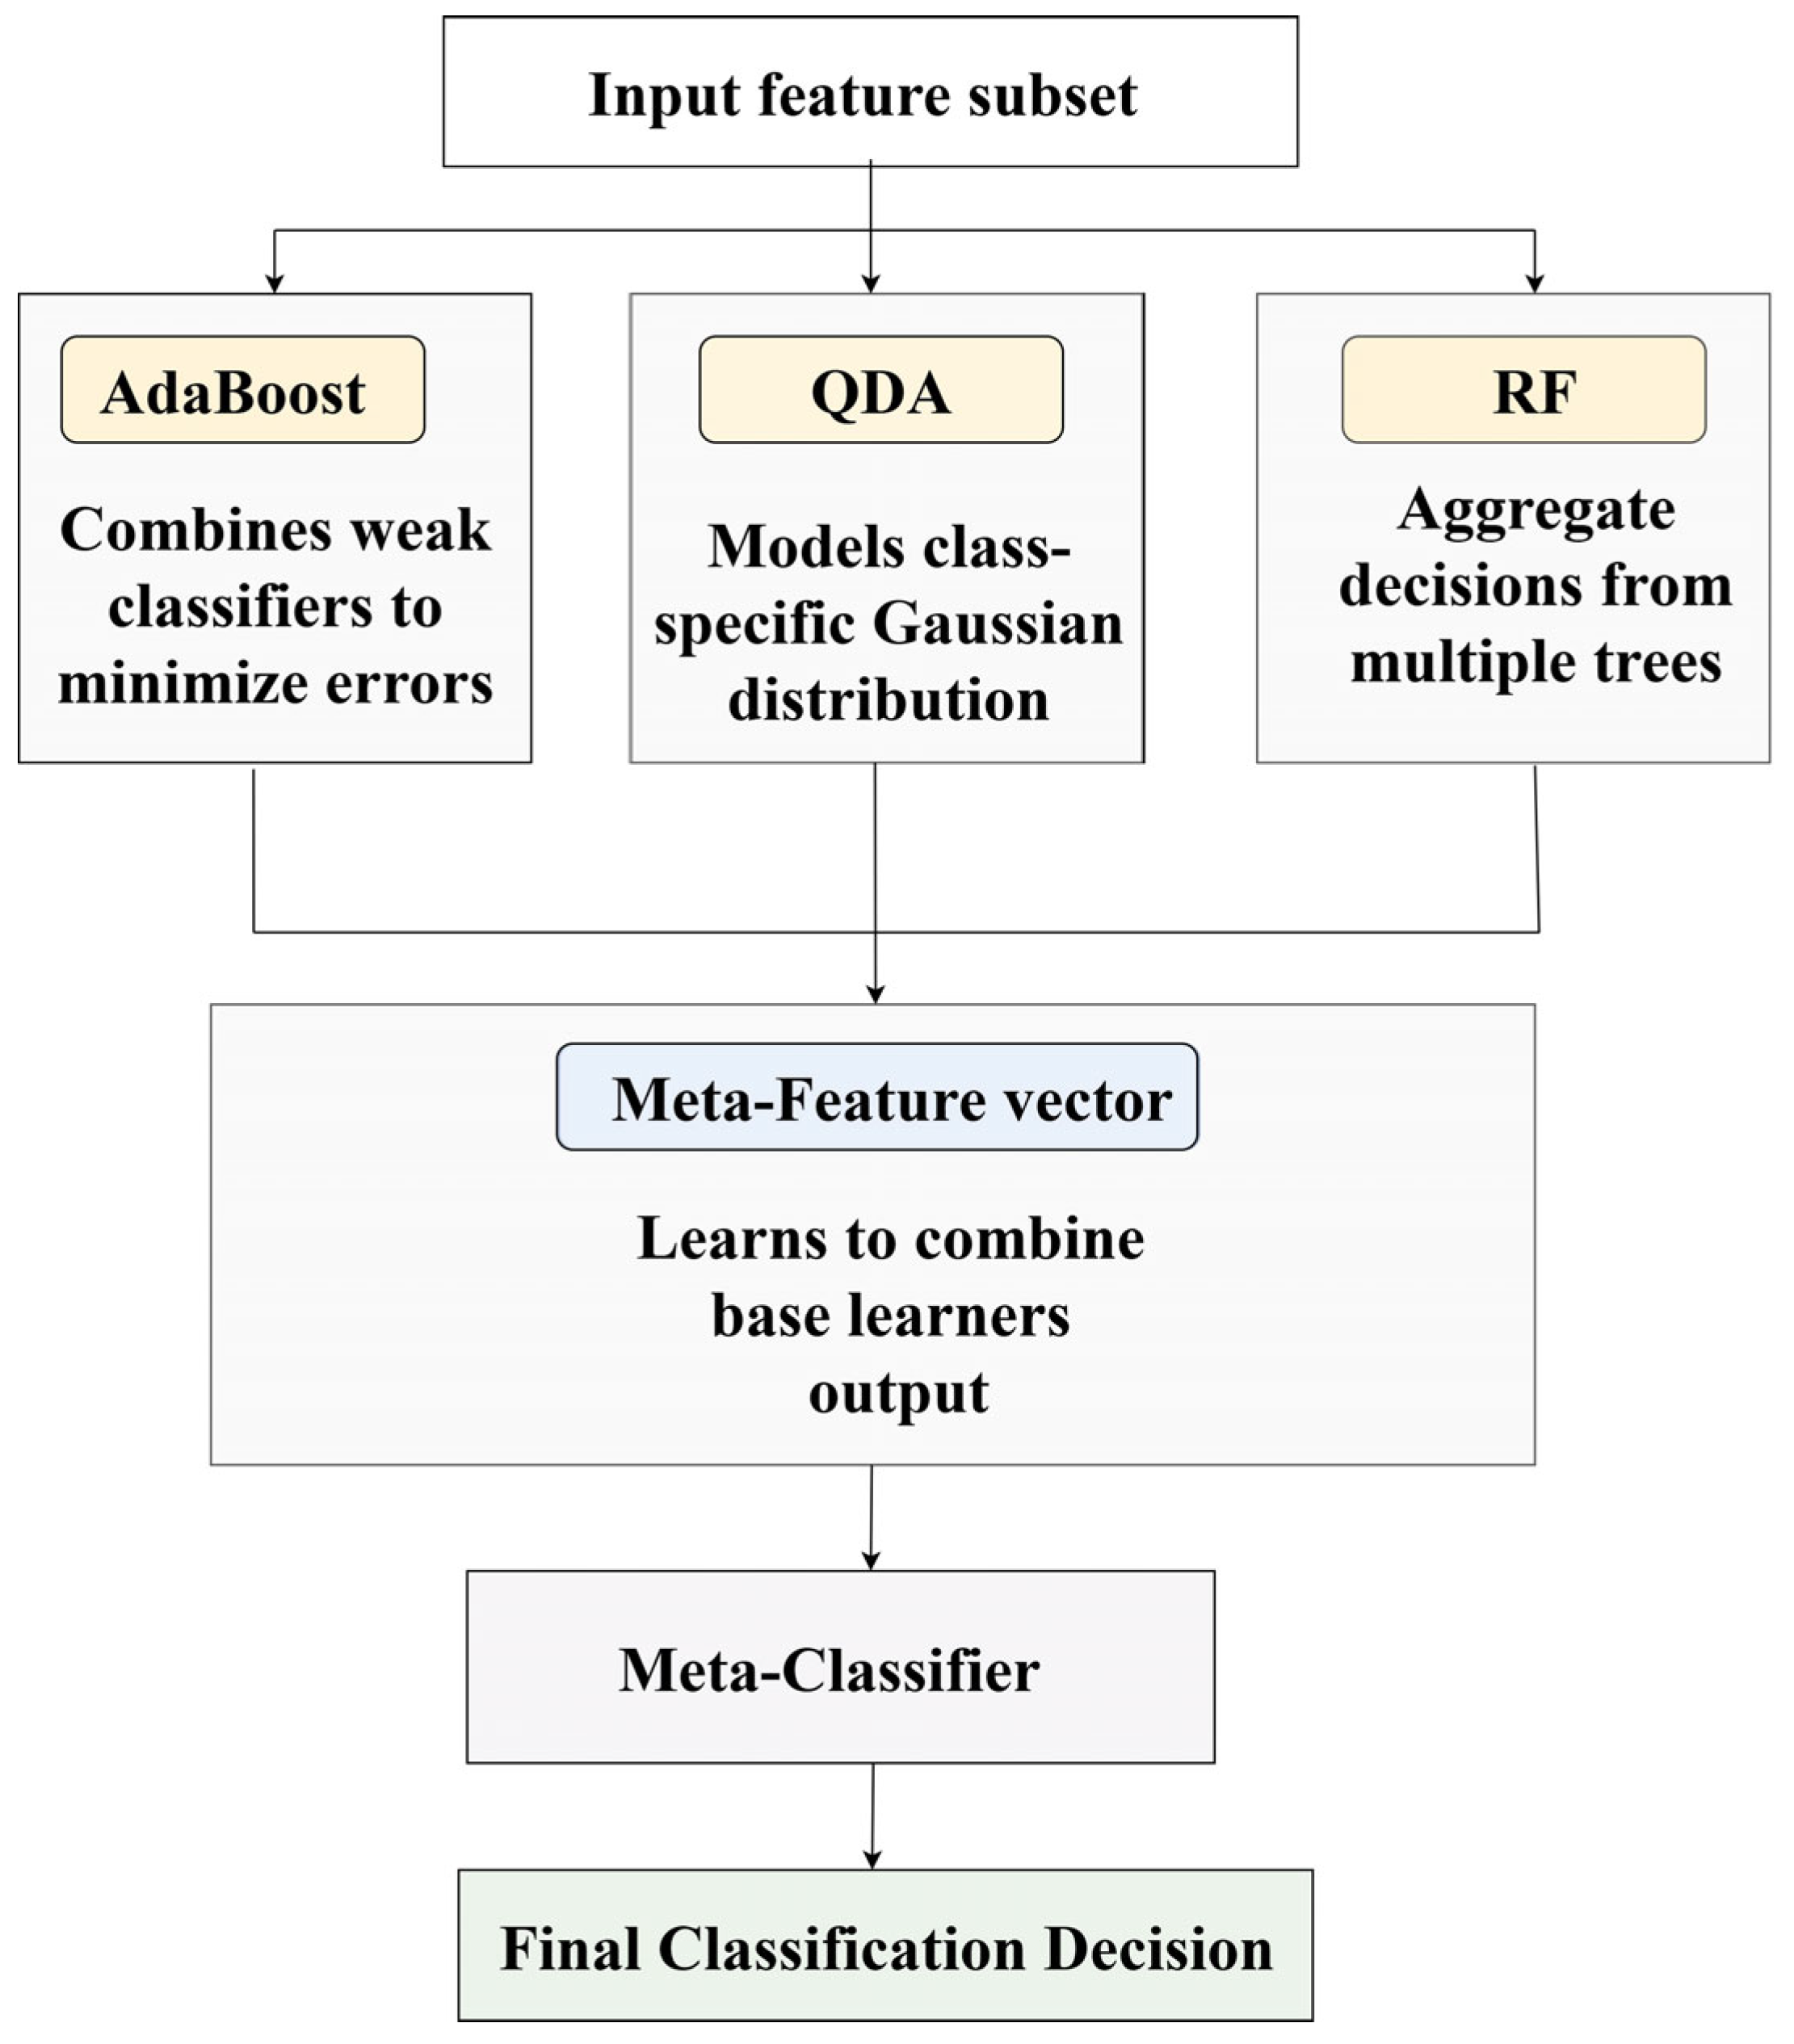
The SE-RAQD framework uses a stacking ensemble strategy to aggregate the predictions from the three base learners into a high-level result [
31]. After training AdaBoost, QDA, and Random Forest independently on the same input feature vector, their respective outputs form a meta-feature vector:
The immediate decisions are encoded by this meta-feature vector and act as the meta-learner input
, and it is trained to integrate all the outputs. The equation below expresses the final classification.
4.4.5. Ensemble Synergy and Robustness
The design of SE-RAQD takes advantage of the complementary strengths of its block learners. AdaBoost promotes adaptive learning by focusing on complex models; QDA models the probabilistic structure of each class with a designed covariance matrix; and RF ensures stability and generalization through bagging. When these models are stacked, their decision patterns are combined by the meta-learner, resulting in a unified classifier capable of handling class imbalance, noise, and complex decision boundaries. Logistic regression was selected as the meta-classifier for the SE-RAQD model due to its balance of simplicity, interpretability, and efficiency. It performs well when combining probabilistic outputs from diverse base learners such as AdaBoost, QDA, and Random Forest. Logistic regression yielded comparable accuracy with faster convergence and lower computational overhead, making it suitable for real-time smart city environments. Hence, it was chosen to preserve both high performance and low latency.
Algorithm 2 for fake data detection using ET-PBO + SE-RAQD is given below.
Figure 4 illustrates the flowchart for the SE-RAQD model.
| Algorithm 2: Fake Data Detection using ET-PBO + SE-RAQD |
Input: Raw dataset with features and labels
|
# Step 1: Data Preprocessing
Normalize features using Min-Max scaling (Equation (1))
Handling missing data (Equation (2))
Apply One-Hot Encoding to categorical features (Equation (3))
# Step 2: Feature Selection using ET-PBO
Initialize the population of feature subsets
for in range :
Evaluate fitness for each subset (Equation (4))
Select elite subsets based on fitness
Update population by polar bear-inspired moves (exploration + exploitation)
Select the best feature subset
# Step 3: Model Training with Selected Features
Train base classifiers:
ADA = AdaBoost trained on features in
QDA = Quadratic Discriminant Analysis on S_best
RF = Random Forest on S_best
# Step 4: Stacking Ensemble
For each instance x in the validation set:
Get predictions
Form meta-features
Train meta-classifier on and true labels
# Step 5: Prediction on Test Set
For each test instance :
Obtain base predictions
Form
Predict label
Return |
| Output: Predicted labels for test data |
6. Conclusions and Future Scope
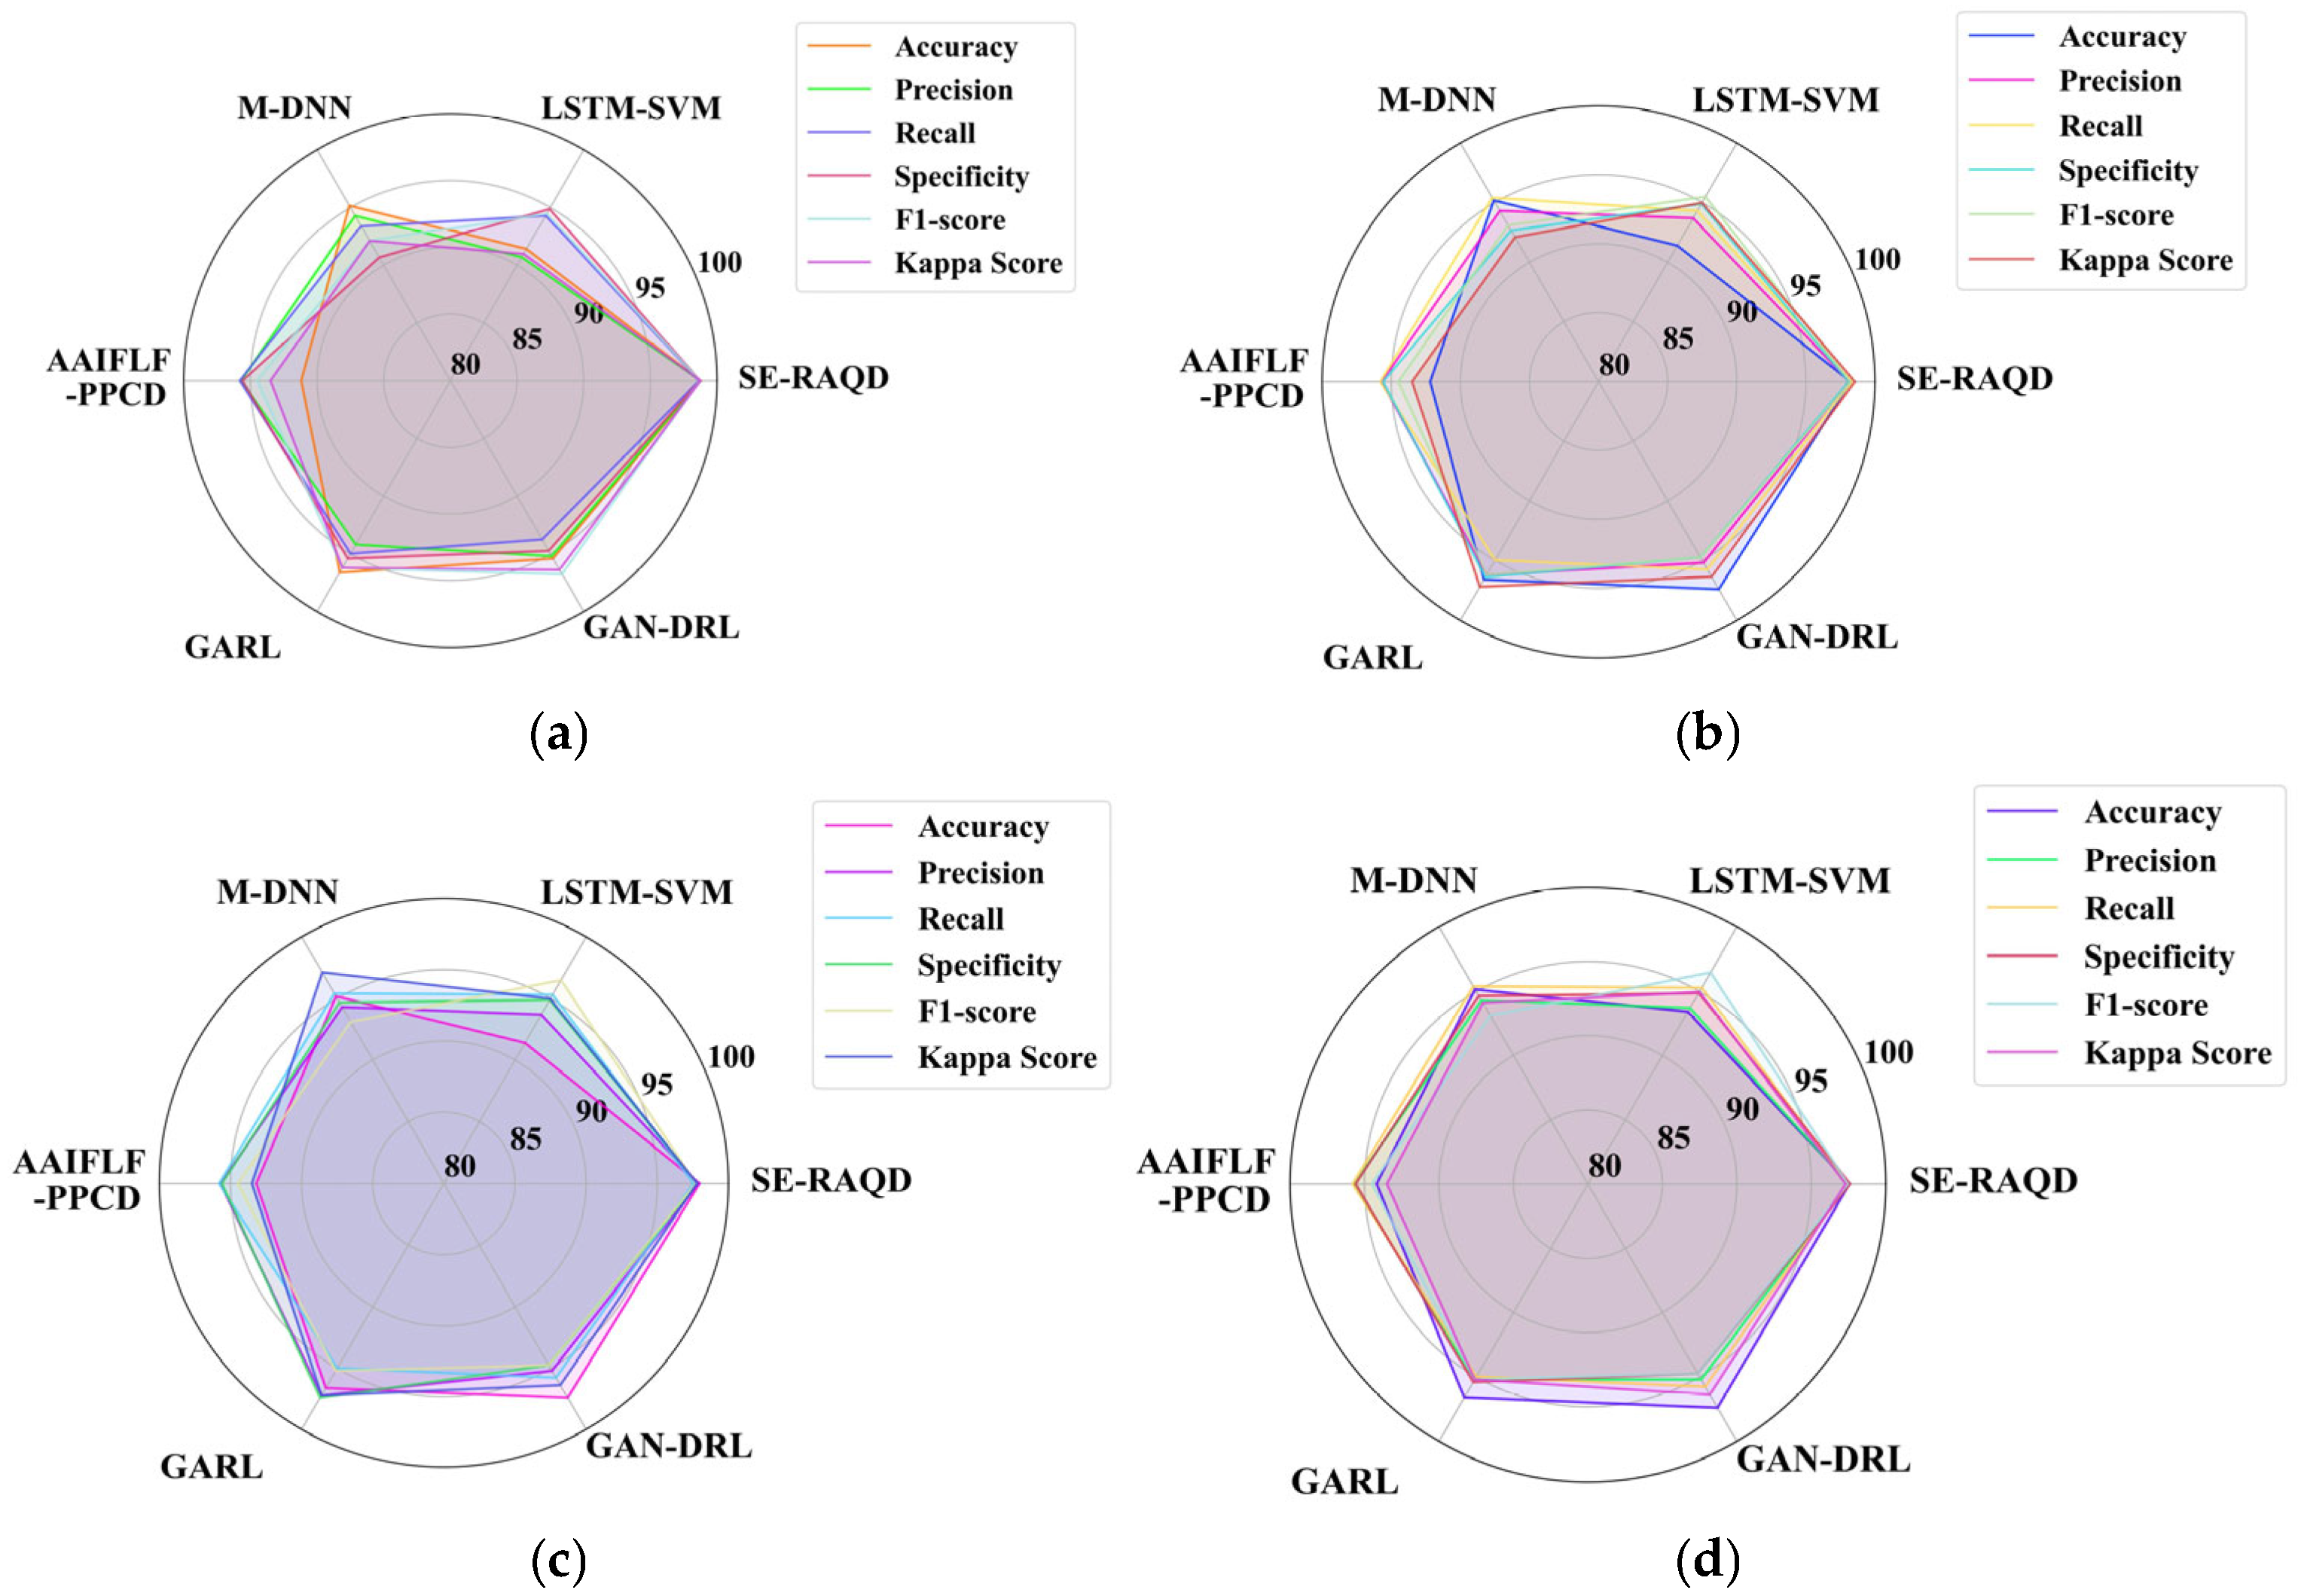
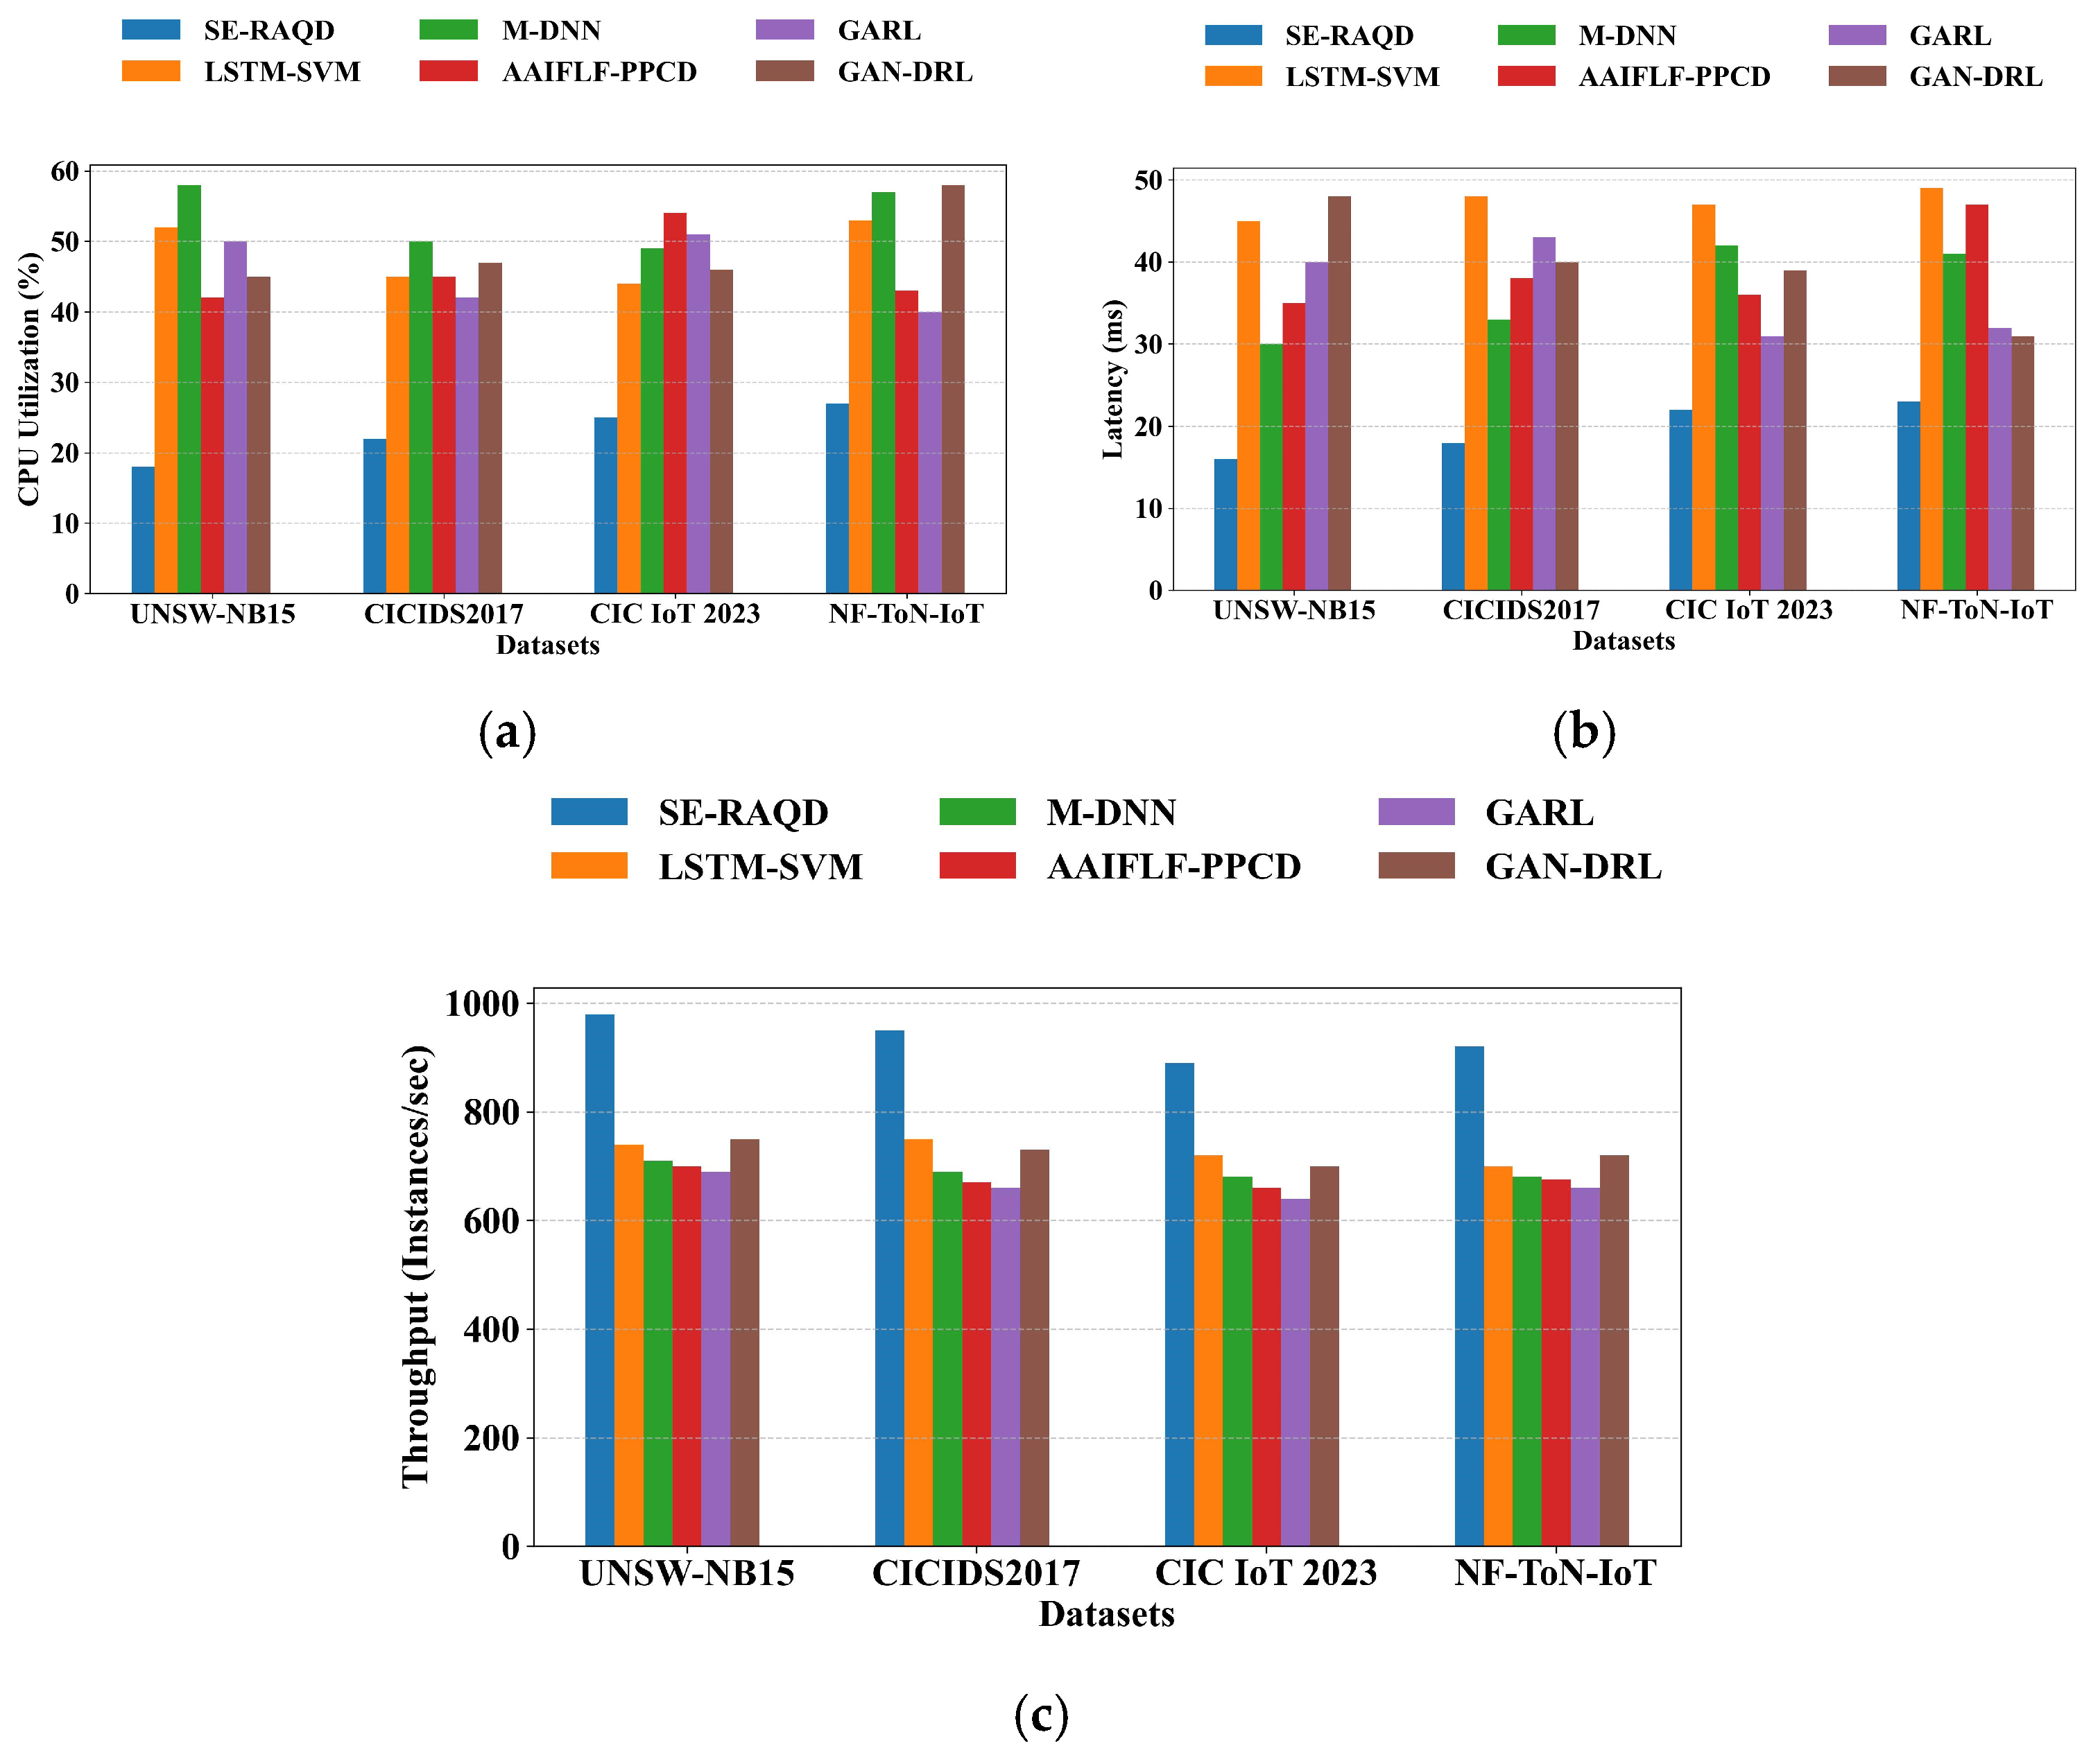
With the increasing digital transformation of smart city infrastructures and IoT-enabled environments, data reliability has become critical for effective service delivery, real-time monitoring, and intelligent decision making. To address the threat posed by fake data, a novel fake data detection model is introduced by integrating a robust feature selection method, ET-PBO, with ensemble learning approaches. The proposed SE-RAQD model enhances classification performance by applying the merits of diverse learners and a meta-classifier. The model demonstrates exceptional performance on benchmark datasets, achieving 98.78% accuracy, 98.75% precision, a recall of 98.66%, a specificity of 98.72%, and F1 score of 98.70%, a kappa score of 98.76%, a throughput of 980 (instances/s), 16 ms latency, and 18% CPU utilization on the UNSW-NB15 dataset, proving its effectiveness in high-volume, noise-prone environments. In the future, the proposed model can be integrated with edge and fog computing, which can help achieve decentralized detection and response. Furthermore, adapting the proposed model to multi-model and heterogeneous data can improve its applicability in various smart city domains. In future work, integrating blockchain systems such as Vfchain can further enhance the security and trustworthiness of the fake data detection framework. This is especially valuable in federated learning settings, where data and models are distributed across multiple devices or organizations. By leveraging blockchain, each data transaction or model contribution can be immutably recorded and verified, preventing tampering and enabling traceability. This creates a fully decentralized, privacy-preserving, and auditable system suitable for real-time deployment in smart city and IoT infrastructures.
