Article

Adversarial Training for Aerial Disaster Recognition: A Curriculum-Based Defense Against PGD Attacks

Department of Computer Science, Sam Houston State University, Huntsville, TX 77341, USA
*
Author to whom correspondence should be addressed.
Electronics 2025, 14(16), 3210; https://doi.org/10.3390/electronics14163210
Submission received: 24 July 2025 / Revised: 6 August 2025 / Accepted: 11 August 2025 / Published: 13 August 2025
(This article belongs to the Special Issue AI-Enhanced Security: Advancing Threat Detection and Defense)

Abstract

Unmanned aerial vehicles (UAVs) play an ever-increasing role in disaster response and remote sensing. However, the deep learning models they rely on remain highly vulnerable to adversarial attacks. This paper presents an evaluation and defense framework aimed at enhancing adversarial robustness in aerial disaster image classification using the AIDERV2 dataset. Our methodology is structured into the following four phases: (I) baseline training with clean data using ResNet-50, (II) vulnerability assessment under Projected Gradient Descent (PGD) attacks, (III) adversarial training with PGD to improve model resilience, and (IV) comprehensive post-defense evaluation under identical attack scenarios. The baseline model achieves 93.25% accuracy on clean data but drops to as low as 21.00% under strong adversarial perturbations. In contrast, the adversarially trained model maintains over 75.00% accuracy across all PGD configurations, reducing the attack success rate by more than 60%. We introduce metrics, such as Clean Accuracy, Adversarial Accuracy, Accuracy Drop, and Attack Success Rate, to evaluate defense performance. Our results show the practical importance of adversarial training for safety-critical UAV applications and provide a reference point for future research. This work contributes to making deep learning systems on aerial platforms more secure, robust, and reliable in mission-critical environments.

1. Introduction

Machine learning has become a powerful component in disaster response systems, enabling the rapid classification of aerial imagery captured by drones and satellites [1]. These systems assist first responders by identifying scenes of floods, wildfires, and earthquakes from large volumes of data, facilitating for timely and informed decision-making. However, as these models are deployed in increasingly demanding settings, their vulnerability to adversarial attacks has become a serious concern.
Adversarial attacks involve crafted input perturbations, usually invisible to humans, that can cause machine learning models to make incorrect predictions [2]. In disaster response scenarios, such misclassifications may lead to critical delays, misallocation of resources, or failure to detect hazardous situations. These risks are further amplified in UAV-based systems, where real-time decisions must be made under limited computational resources and changing conditions.
To address this issue, we propose an adversarial training framework to improve the performance of disaster scene classifiers used in UAV systems. Specially, we train a ResNet-50 model on the AIDERV2 dataset with adversarial examples generated using the Projected Gradient Descent (PGD) method. Our approach evaluates model performance across a arrange of attack intensities, comparing clean versus adversarial accuracy across multiple disaster types. While effective, PGD’s iterative nature introduces notable computational overhead. On resource-limited UAVs, the number of iterations (T) directly impacts inference time. Real-time disaster response applications necessitate careful consideration of this computational burden when implementing PGD-based defenses.
This work investigates the resilience of CNN-based disaster classifiers under adversarial threats, particularly focusing on PGD attacks and defenses. Our contributions are organized into the following stages:
  • Firstly, we train a ResNet-50 model on clean aerial imagery from the AIDERV2 dataset to establish a strong baseline. This baseline references all subsequent evaluations under clean and adversarial conditions.
  • Secondly, we evaluate the vulnerability of this baseline model by launching PGD attacks at varying perturbation levels. This phase quantitatively demonstrates how even small perturbations can significantly reduce classification accuracy, especially across different disaster categories.
  • Thirdly, we implement adversarial training using PGD-generated images combined with clean samples, specifically employing a 50% clean and 50% adversarial data ratio. It is designed to improve the model’s ability to recognize and resist adversarial patterns. We explore multiple ϵ values, step sizes, and iteration counts to identify the most effective training configurations.
  • Finally, we perform an analysis of both clean and adversarial classification results, including class-wise quality. This way, we can identify which disaster types (e.g., fire, flood, earthquake) benefit most from adversarial defense.
The remainder of this paper is organized as follows: Section 2 reviews related literature on adversarial attacks and defenses in UAV and remote sensing applications. Section 3 describes our experimental setup, including model training, attack generation, and defense strategies. Section 4 provides the evaluation results and analysis, and Section 5 concludes the paper with outcomes and future directions.

2. Related Works

Over the last few years, adversarial protection has become important when deploying deep learning models for disaster classification and remote sensing, particularly when deployed on UAV platforms. A key concern is the vulnerability of these models to gradient-based attacks such as PGD, which can dramatically decrease performance even under minor input perturbations. The purpose of this section is to review recent research that apply or defend against PGD attacks. Several studies have demonstrated the vulnerability of UAV-based deep learning models to adversarial attacks.

2.1. Ensemble-Based and Training Defenses

Lu et al. [2] proposed a hybrid reactive-proactive ensemble system to detect and reject adversarial aerial images before classification. Their approach improves reliability by fusing multiple scoring functions and employing diversified sub-models trained with PGD-based strategies. Similarly, their other study [3] further refined this defense framework by integrating deep ensembles and applying the method to multiple remote sensing benchmarks. Raja et al. [4] demonstrated how adversarial training can mitigate misclassification of risky areas by evaluating adversarial attacks on AI-assisted UAV bridge inspections.

2.2. Patch-Based Attacks and Detection

Adversarial patch attacks have also received a considerable amount of attention. Zhang et al. [5] focused on object detectors like YOLO under UAV settings. They showed that adversarial patches reduce performance, particularly when designed to adapt to multi-scale object detection. Pathak et al. [6] proposed a model-agnostic defense using autoencoders, which reduced the attack success rate (ASR) by 30% without requiring prior adversarial exposure.

2.3. Disaster-Specific Testing and Augmentation

Wildfire monitoring systems are also vulnerable to adversarial noise. For disaster-specific scenarios, Ide and Yang [7] introduced WARP, a model-agnostic framework that applies both local and global perturbations to test stability. Their augmentation-based defenses improved prediction accuracy in realistic wildfire detection scenarios. According to their results, transformer-based models are particularly sensitive, with a precision loss of over 70% under Gaussian noise.

2.4. Autoencoders and SVM-Based Detection

In scene classification, PGD and other gradient-based attacks have been widely evaluated. Chen et al. [8] tested eight deep models over 48 remote sensing settings and found over 98% false positive rates. To address such vulnerabilities, Da et al. [9] proposed a variant autoencoder-based defense, while Li et al. [10] applied FGSM and L-BFGS attacks and used SVMs for adversarial detection, achieving detection accuracy over 94%.

2.5. Data Augmentation and Diffusion Model-Based

Advancements in explainability and purification have introduced new defense strategies. Tasneem et al. [11] addressed adversarial performance via data augmentation and explainable AI, enhancing model resilience on datasets such as EuroSAT and AID. Yu et al. [12] proposed UAD-RS, a diffusion model-based purification method that adapts to unknown perturbations across multiple datasets.
Overall, these studies provide a wealth of perspectives on defending against adversarial attacks in UAV and remote sensing systems. However, many of them focus on specific attacks attacks types, such as adversarial patches, or use defense methods that are complex or difficult to deploy in real-time settings. Several approaches rely on ensemble models or additional processing steps that may not work well on UAVs with limited computational resources. Most importantly, few studies explore how PGD-based adversarial training can improve performance for multi-class disaster classification. Many focus only on small datasets or narrowly defined tasks. Our research addresses these limitations by testing different PGD settings on the AIDERV2 disaster dataset. We compare clean and adversarial accuracy across classes and provide practical findings for building stronger, attack-resistant models for real-world UAV disaster response applications.

3. Methodology

This study aims to evaluate the vulnerability of deep learning-based disaster classification models to adversarial attacks and investigate whether adversarial training can improve performance. The methodology is based on four key experimental setups, as outlined in Table 1. Each experiment is designed to analyze the effects of adversarial perturbations. Figure 1 provides a flowchart summarizing the overall methodology. It illustrates the sequential structure of the four phases, the reuse of models across experiments, and the decision points where PGD attacks and adversarial training are applied. The first experiment establishes baseline model performance under standard conditions, where a CNN model is trained on preprocessed aerial images from the AIDERV2 dataset. The second experiment tests the model’s vulnerability to adversarial perturbations using PGD. The third experiment includes adversarial training, where the model is retrained with both clean and adversarial images to improve resistance. Finally, the fourth experiment evaluates the adversarially trained model against PGD attacks to measure its stability improvements. PGD is used for both attack and defense as it creates imperceptible yet highly disruptive perturbations.

3.1. Dataset Description

This study utilizes the AIDERV2 dataset (Aerial Image Dataset for Emergency Response Applications), released in January 2025 [13]. The dataset is an extension of the original AIDER dataset to support machine learning research for emergency response, particularly in UAV-based disaster monitoring systems. The dataset lacks documented overlap or shared classes with other aerial imagery datasets used in adversarial studies, which limits direct comparisons and the generalizability of findings.
The dataset consists of 167,723 aerial images categorized into four disaster classes: earthquake (collapsed buildings), flood, wildfire (fire), and a normal category that represents non-disaster conditions. A variety of aerial platforms, including satellites and unmanned aerial vehicles (UAVs), provide different perspectives and conditions for disaster classification.
Each image is preprocessed by resizing it to 224 × 224 pixels to maintain consistency in the input dimensions of the convolutional neural network (CNN). Although the full dataset includes over sixteen thousand images, for the experiments conducted in this study, a balanced subset of 1000 images per class (totaling 4000 images) was created. This subset was split into 80% for training (800 images), 10% for validation (100 images), and 10% for testing (100 images), maintaining equal representation across all four classes. To illustrate the nature of the data, Figure 2 displays one representative image from each class. These examples illustrate the variability of aerial scenes and the visual characteristics that the model must learn to differentiate.

3.2. Model Architecture and Training Procedure

The classification model used in this study is based on the ResNet-50 architecture, a deep CNN with strong feature extraction capabilities and high performance in image classification tasks. The network is initialized with pre-trained weights from ImageNet and fine-tuned on the AIDERV2 dataset. Training is performed using the categorical cross-entropy loss function, given by:
L C E = i = 1 C y i log ( y ^ i )
where C = 4 represents the number of disaster categories, y i is the actual label for class i, and y ^ i is the predicted probability for class i.
The model is optimized using the Adam optimizer with a learning rate of 10 4 to ensure efficient weight updates and stable gradient flow. Training is performed for 20 epochs with a batch size of 32, ensuring consistency while maintaining computational feasibility. Training is conducted on Google Colab Pro, using an NVIDIA A100 GPU with 40GB VRAM to accelerate computations.

3.3. Adversarial Attack–PGD

To evaluate the vulnerability of the disaster classification model to adversarial perturbations, we applied thePGD attack. PGD is an iterative first-order attack that finds adversarial examples by maximizing classification loss while minimizing perturbation magnitude so that it remains invisible to the human eye. It has been identified as one of the most effective strategies for improving model reliability in adversarial settings [14]. The adversarial example at each iteration is generated using the following equation:
x a d v t + 1 = Proj x , ϵ x a d v t + α · sign ( x J ( θ , x a d v t , y ) )
where x a d v t + 1 is the adversarial example at iteration t + 1 , x a d v t is the adversarial input from the previous iteration, α is the step size, x J ( θ , x a d v t , y ) represents the gradient of the loss function with respect to the input image, where y is the true label and θ denotes the model parameters, and Proj x , ϵ projects the perturbed image back into the L norm bound, perturbations do not exceed the predefined threshold ϵ . Here, t refers to the current PGD iteration index. For this experiment, the PGD attack was configured with multiple hyperparameter settings to evaluate the model’s reliability under varying adversarial levels. The perturbation bound ϵ was set to values { 4 / 255 ,   8 / 255 ,   16 / 255 } , with corresponding step sizes α { 0.001 ,   0.004 ,   0.008 ,   0.010 ,   0.020 } , and iterations T { 10 ,   20 ,   30 } . These combinations generated adversarial examples for evaluating the model’s susceptibility to misclassification [15]. The choice of these hyperparameters balances attack strength and imperceptibility, allowing for consistent and controlled experimentation across different scenarios. Specifically, the perturbation bounds ϵ { 4 / 255 , 8 / 255 , 16 / 255 } were selected to span from subtle to moderately visible distortions. Step sizes α { 0.001 ,   0.004 ,   0.008 ,   0.010 ,   0.020 } and up to T = 30 iterations follow common PGD attack settings in the literature, enabling evaluation across a range of attack strengths. The upper bound α = 0.020 reflects a relatively strong step size, ensuring sufficient perturbation within a limited number of steps.

3.4. Adversarial Defense–PGD-Based Adversarial Training

PGD-based adversarial training is employed to improve the model’s resistance to adversarial attacks. Using adversarial examples in the training process strengthens the model’s ability to classify both clean and perturbed images correctly. To maintain a balance between adaptability and natural feature learning, 50% of the training data consists of clean images, while the remaining 50% consists of adversarially perturbed images. This split prevents the model from overfitting to adversarial distortions while preserving accuracy on clean inputs [16]. The training objective follows a min-max optimization framework, where the model learns to minimize classification loss under worst-case perturbations:
min θ E ( x , y ) D max δ ϵ J ( θ , x + δ , y )
where D represents the training dataset, x is the clean input image, y is its corresponding label, δ is the adversarial perturbation constrained by ϵ , and J ( θ , x + δ , y ) denotes the classification loss when evaluated on the adversarially perturbed input.

3.5. Evaluation Metrics

Multiple performance metrics are used to assess the effectiveness of adversarial training and evaluate model performance under both clean and adversarial conditions.
The standard Clean Accuracy (CA) is measured on unperturbed test images to establish baseline classification performance. It is defined as follows:
CA = Correct   Predictions   on   Clean   Images Total   Clean   Test   Images
To assess the model’s performance under adversarial conditions, Adversarial Accuracy (AA) is computed by evaluating the model on adversarially perturbed test images:
AA = Correct   Predictions   on   Adversarial   Images Total   Adversarial   Test   Images
The Attack Success Rate (ASR) quantifies the ability of the PGD attack to cause misclassification. The lower the ASR, the more resistant the model is to adversarial perturbations. It is defined as follows:
ASR = Misclassified   Adversarial   Examples Total   Adversarial   Examples
To measure the impact of adversarial attacks on model performance, the Accuracy Drop (AD) is calculated as the difference between clean accuracy (CA) and adversarial accuracy (AA), given by
A D = C A A A
A smaller AD value means that the model maintains its performance better under attack, indicating improved resilience.
Additionally, Precision (P) and Recall (R) are employed to evaluate the model’s ability to correctly classify disaster categories. Precision measures the proportion of correctly classified disaster instances among all predicted disaster instances:
P = T P T P + F P
where T P represents true positives, and F P denotes false positives.
Recall assesses the model’s ability to correctly identify disaster instances among all actual disaster cases:
R = T P T P + F N
where F N refers to false negatives.
Additionally, macro and weighted averages are computed to summarize performance across all classes. For each class, macro average calculates the unweighted mean of the metric:
Macro   Avg = 1 N i = 1 N M i
where N is the number of classes, and M i is the metric value for class i.
Weighted Average accounts for the support (number of true instances) of each class when averaging:
x ¯ w = i = 1 n w i x i i = 1 n w i
x ¯ w represents the weighted average, x i represents the value of each item (e.g., precision or recall for class i), w i represents the weight of each item (e.g., number of true instances in class i) and n represents the number of items or classes. Including these metrics in the evaluation enhances the understanding of standard and adversarial classification performance.

4. Results

Experimental results presented in this section include baseline model performance, synthetic anomaly injection, and adversarial resilience evaluation.

4.1. Phase I: Baseline Training and Evaluation

We first trained a baseline ResNet-50 model using clean aerial disaster images from the AIDERV2 dataset to establish a reference for adversarial strength. A balanced subset of the dataset was constructed with 1000 images per class (Flood, Earthquake, Fire, Normal), using an 80/10/10 split for training, validation, and testing, respectively.
The model was initialized with pretrained ImageNet weights and fine-tuned for 20 epochs using the Adam optimizer ( learning   rate = 10 4 ) and cross-entropy loss. The training process showed high efficiency, achieving over 99% training accuracy by the final epoch.
After training, the model achieved a clean test accuracy of 93.25%, supporting strong generalization to unseen disaster images. A detailed classification report (Table 2) shows high precision and recall across most categories. The model performed best on the Flood and Earthquake classes, while the Fire class showed slightly lower precision (0.84) due to visual similarity with smoke and urban structures in other classes. Representative predictions are shown in Table 2. These results confirm the suitability of the ResNet-50 backbone and demonstrate strong baseline performance under standard, non-adversarial conditions. This is the foundation for evaluating adversarial vulnerabilities and defenses in the following phases.

4.2. Phase II: Baseline Model Performance Under PGD Attack

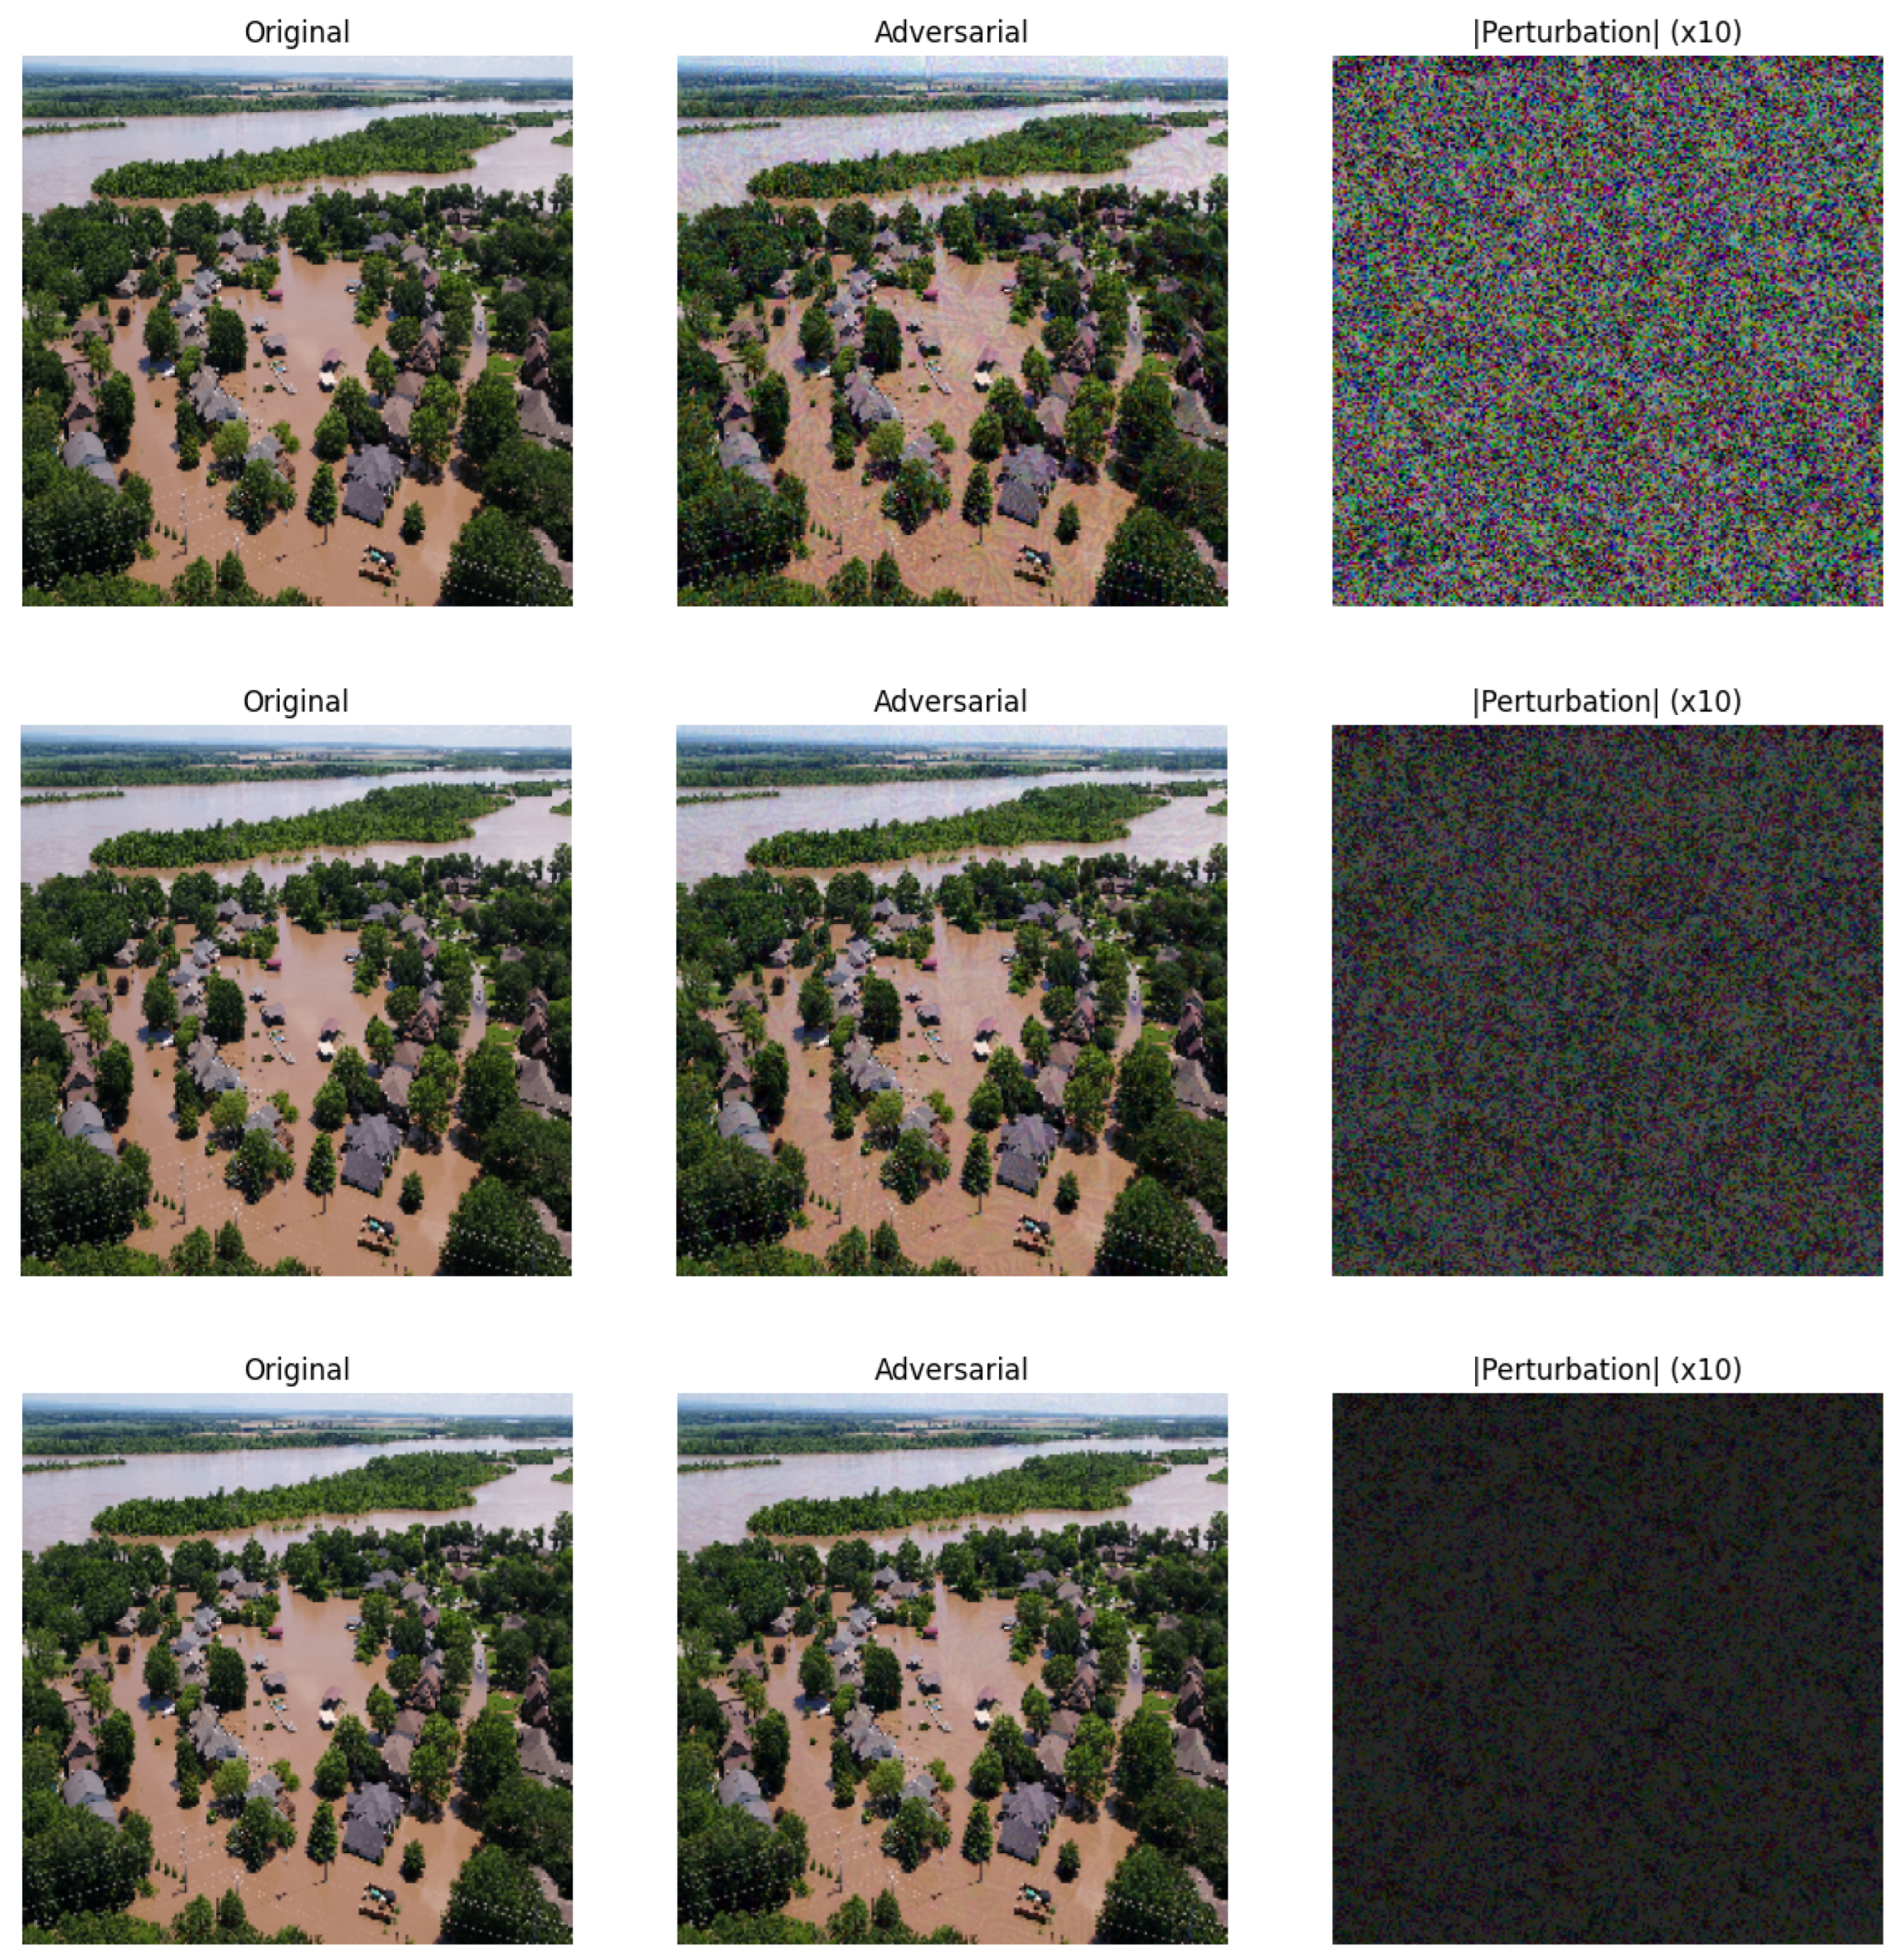
To better illustrate the impact of adversarial noise introduced by PGD, Figure 3 presents side-by-side comparisons of original, adversarial, and perturbation-only images for three increasing values of the perturbation bound ϵ : 4/255, 8/255, and 16/255, while keeping α = 0.020 and T = 10 constant. As shown in the Figure 3, for ϵ = 4 / 255 , the perturbation is nearly imperceptible to the human eye, and the adversarial image remains visually indistinguishable from the original. When ϵ increases to 8/255, the noise becomes moderately visible in the perturbation map and can begin to affect classifier performance. At ϵ = 16 / 255 , the perturbation becomes more intense and noticeable, with high-frequency pixel variations visible, despite the adversarial image appearing natural at a glance. As demonstrated by these examples, increasing ϵ results in more substantial perturbations that can more notably decrease the model’s prediction accuracy.
To evaluate the vulnerability of the baseline ResNet-50 model trained on clean data, we performed white-box adversarial attacks using thePGD method. PGD is a powerful iterative attack that perturbs input images in the direction of the loss gradient while keeping perturbations within a constrained -norm ball defined by the parameter ϵ . The goal of this phase is to observe how adversarial accuracy decreases as the perturbation strength and optimization steps are varied.
Various parameters in the PGD attack were varied to assess the model’s performance against adversarial perturbations: the perturbation bound ϵ , the step size α , and the number of iterations. The perturbation bounds tested were 4 / 255 , 8 / 255 , and 16 / 255 , which correspond approximately to 0.01569, 0.03137, and 0.06275, respectively. For the step size α , we considered five values: 0.001, 0.004, 0.008, 0.010, and 0.020. In addition, we applied each configuration using 10, 20, and 30 attack iterations to observe how iterative refinement affects adversarial effectiveness. This consistent variation enabled a thorough analysis of the model’s adversarial vulnerability under a range of threat levels and optimization intensities. Table 3 summarizes the adversarial attack configurations used to evaluate model performance under Phase 2.
Larger ϵ values allow greater image distortion, strengthening the attack. Similarly, higher iteration counts increase optimization precision, while α controls how aggressively each pixel is updated per step.
The results are summarized in Table 4. As expected, increasing ϵ generally leads to a greater drop in adversarial accuracy, while optimal combinations of α and iterations can produce minor performance differences. Lower α values sometimes preserved slightly higher adversarial accuracy due to slower gradient updates.
According to the results, the baseline model is highly vulnerable to adversarial perturbations. Accuracy drops sharply even for small perturbations, particularly when ϵ > 0.03 . For this reason, adversarial defense is required in Phase 3, which we will address through adversarial training.

4.3. Phase III: PGD-Based Adversarial Training

In this phase, we applied adversarial training using PGD to strengthen the performance of our ResNet-50 disaster classifier. The goal was to observe how training with different PGD configurations impacts model performance on clean (non-attacked) data. The same PGD configurations used in Phase 2 as attack parameters, as in Table 3, were now repurposed as adversarial training parameters. In this way, we could determine whether the model could be hardened against the specific types of attacks it was previously vulnerable to.
Each unique combination of these parameters resulted in a separate training experiment using the AIDERV2 dataset, producing 30 adversarially trained models. Each model was trained for 20 epochs, with balanced class distributions and a fixed 80%-10%-10% train-validation-test split.
We monitored clean training accuracy during training to assess general learning performance under each configuration. After training our ResNet-50 model using PGD-based adversarial training with varying values of ϵ , α , and iteration counts, we observed a clean training accuracy of 100%, which shows the model’s ability to fit the adversarially augmented training data fully. While such high training accuracy could raise concerns about overfitting, this was actively monitored throughout the training process by observing the validation loss evolution. The validation loss demonstrated a stable decrease without significant signs of overfitting, thus justifying the model’s capacity to generalize effectively to unseen clean and adversarial test images. We tested the model using clean (unperturbed) test images to assess generalization. The classification performance is summarized in Table 5. The overall test accuracy reached 91%. Although the clean test accuracy of the adversarial model was slightly lower (91%) than that of the baseline model (93%), this minor drop is an expected consequence of adversarial training. The primary goal of Phase 3 was not to improve clean accuracy, but to increase the model’s performance against adversarial perturbations.
As a result of this phase, we identified training configurations that provide clean accuracy and consistency, enabling adversarial testing and comparative analysis in the following phase.

4.4. Phase IV: Resistance of Adversarially Trained Model Under PGD Attack

In this phase, we evaluate the performance of the adversarially trained models when exposed to PGD-based adversarial inputs. As outlined in Table 6, the accuracy results demonstrate a consistent trend: while increasing the attack strength (via higher ϵ , α , or iteration counts) gradually reduces classification accuracy, the models remain remarkably more resilient compared to baseline models under attack.
This phase corresponds to the final row of Table 6, where both adversarial training and PGD attacks are applied. Under this experimental condition, a higher accuracy is expected than the baseline under attack conditions. Our results confirm this expectation, with adversarial accuracy staying above 75% across all evaluated configurations, even under high-intensity settings (e.g., ϵ = 16/255, α = 0.020, 30 iterations). This resilience results from the PGD-based adversarial training, which employs min-max optimization (Equation (3)) and a 50/50 mix of clean and adversarial samples to help the ResNet-50 model to learn to correctly classify both clean and perturbed inputs.

4.5. Overall Adversarial Evaluation and Comparative Metrics

To better compare model reliability, we computed and visualized adversarial evaluation metrics across all attack configurations tested in Phase II (baseline model) and Phase IV (adversarially trained model). These metrics include Clean Accuracy (CA), Adversarial Accuracy (AA), Accuracy Drop (AD), and Attack Success Rate (ASR).
  • Clean Accuracy Reference
  • Phase I Baseline Model: 93.25%
  • Phase III Adversarially Trained Model: 91.00%
  • Phase II vs. Phase IV Summary
As shown in Table 7, the adversarially trained model consistently outperformed the baseline model under adversarial conditions. It maintained AA above 75% across all attack configurations and limited ASR to below 25%, compared to over 75% for the baseline.
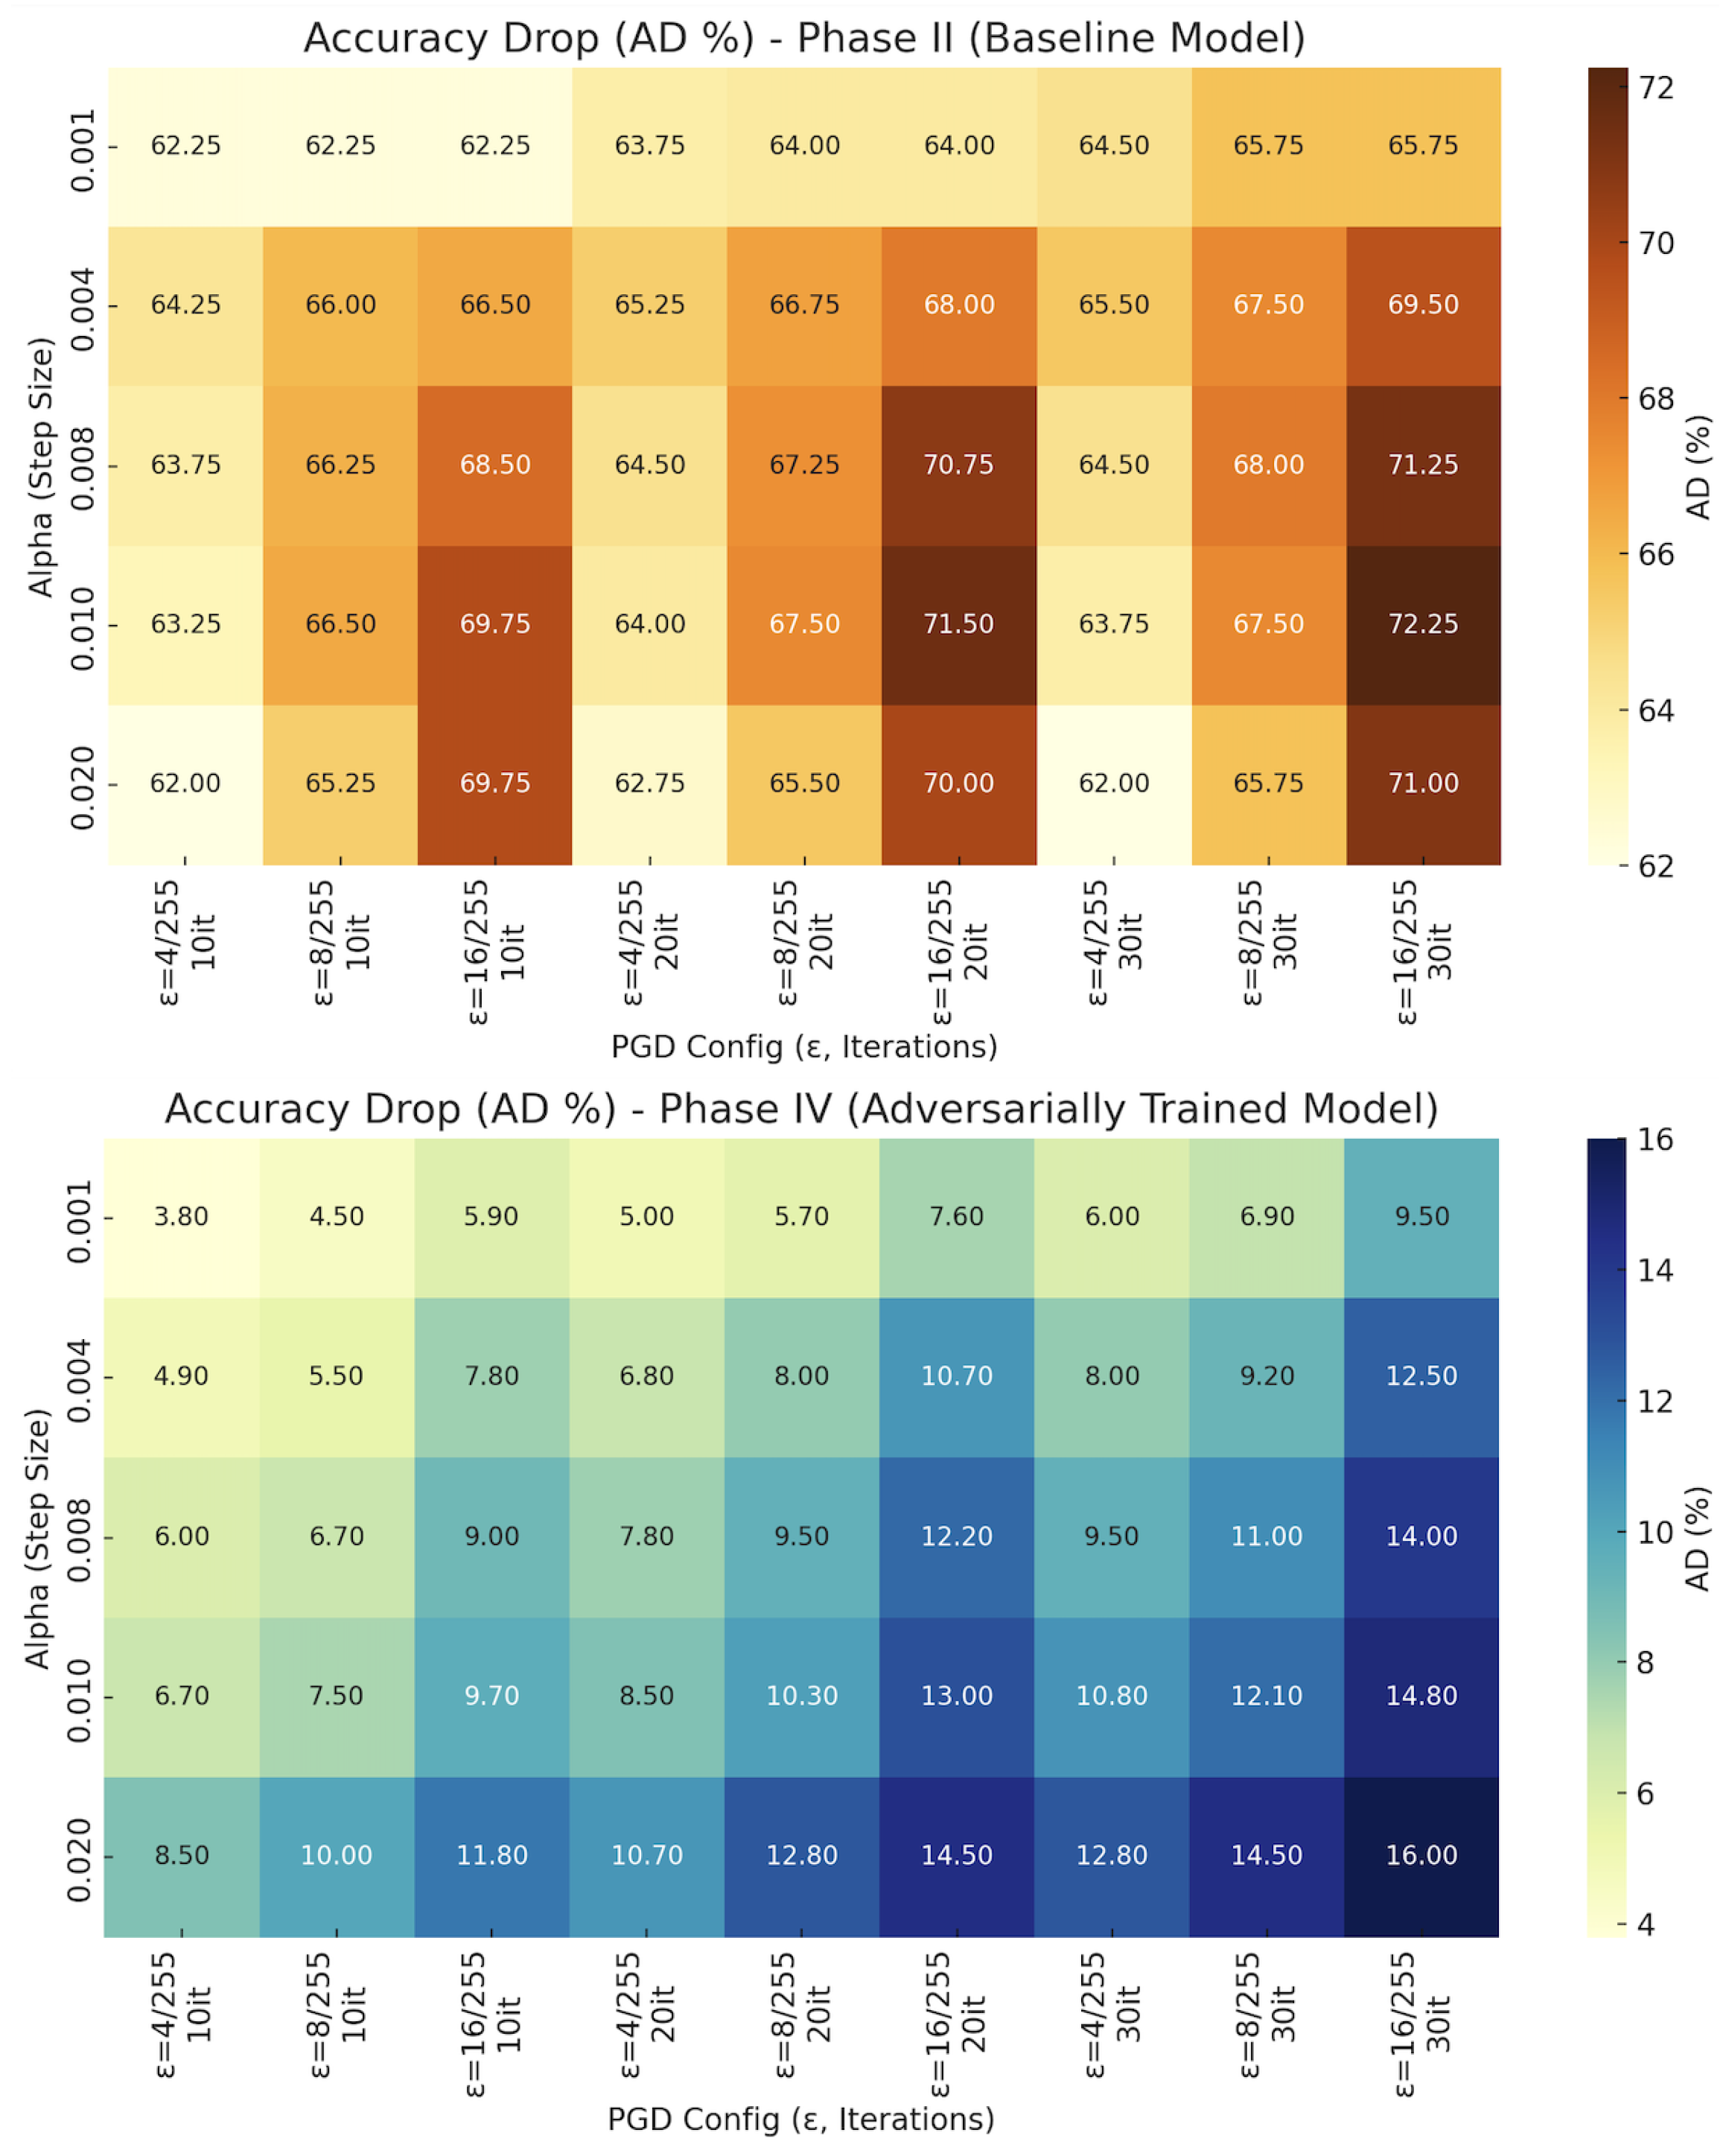
To further understand the drop in performance due to adversarial perturbations, we analyzed the Accuracy Drop (AD), which is defined as the difference between clean test accuracy and adversarial accuracy. The AD values for each PGD configuration are visualized in Figure 4.
The Accuracy Drop (AD) values, visualized in Figure 4, clearly illustrate the vulnerability of the baseline model and the enhanced resilience of the adversarially trained model. In Phase II, the baseline model suffered from high AD values ranging from 62% to 72%, supporting its vulnerability to adversarial noise. In contrast, Phase IV achieved substantially lower AD values between 4% and 16%, even under the strongest attacks ( ϵ = 16 / 255 , α = 0.020 , 30 iterations).
Figure 5 provides a visual comparison of the Attack Success Rate (ASR), computed as ASR = CA AA , with higher values showing more susceptibility. Phase IV consistently shows lighter (lower) ASR values, while Phase II shows darker (higher) values. This visual evidence further confirms that adversarial training profoundly reduces the attackers’ ability to succeed, leading to a more robust system.
Accordingly, adversarial training mitigates the impact of adversarial perturbations. The adversarially trained model preserves high accuracy and minimizes vulnerability across a broad range of attack parameters. As a result, it confirms its applicability for deployment in safety-critical applications, such as UAV-based disaster classification.

5. Conclusions and Future Work

This study evaluated the adversarial performance of a ResNet-50 model for aerial disaster classification using the AIDERV2 dataset. Through a four-phases framework, comprising clean baseline training, adversarial vulnerability testing, PGD-based adversarial training, and post-defense evaluation, we demonstrated the impact of adversarial perturbations on model performance and the effectiveness of adversarial training as a defense strategy. In Phase I, the baseline model achieved strong performance under clean conditions with a test accuracy of 93.25%. However, during Phase II, it exhibited substantial vulnerability to adversarial noise, with adversarial accuracy dropping as low as 21% under high-intensity PGD attacks. In contrast, the adversarially trained model (Phase IV) maintained robust performance, exceeding 75% accuracy across all tested PGD configurations. Visual analyses of accuracy drop (AD) and attack success rate (ASR) further revealed the benefits of adversarial training in improving model resilience.
In conclusion, PGD-based adversarial training substantially improves the performance of aerial image classifiers, making them more suitable for deployment in mission-critical systems such as disaster monitoring, emergency response, and UAV-based surveillance. These findings confirm the necessity of including adversarial defense mechanisms in safety-sensitive computer vision systems.
For future work, we plan to explore the performance of our models against transfer and black-box adversarial attacks to simulate more realistic adversarial threats. We also aim to investigate alternative defense mechanisms and compare their effectiveness compared to PGD-based training. Another direction involves designing lightweight, computationally efficient adversarial defenses that can be deployed on UAVs with limited hardware resources. While ResNet-50 was selected for its proven high performance, future work will explore the suitability of lighter backbones such as MobileNet or EfficientNet. Moreover, extending the framework to handle spatiotemporal data such as aerial video streams could improve the performance. These directions will help bridge the gap between experimental defense strategies and their deployment in real-world intelligent aerial systems.

Author Contributions

Conceptualization, K.K.; methodology, K.K.; software, K.K.; formal analysis, K.K.; investigation, K.K.; writing—original draft preparation, K.K.; writing—review and editing, B.Z.; visualization, K.K.; supervision, B.Z.; project administration, B.Z.; funding acquisition, B.Z. All authors have read and agreed to the published version of the manuscript.

Funding

This research received no external funding.

Data Availability Statement

The original contributions presented in this study are included in the article. Further inquiries can be directed to the corresponding author.

Conflicts of Interest

The authors declare no conflicts of interest.

References

  1. Cui, J.; Guo, W.; Huang, H.; Lv, X.; Cao, H.; Li, H. Adversarial Examples for Vehicle Detection with Projection Transformation. IEEE Trans. Geosci. Remote Sens. 2024, 62, 5632418. [Google Scholar] [CrossRef]
  2. Lu, Z.; Sun, H.; Xu, Y. Adversarial Robustness Enhancement of UAV-Oriented Automatic Image Recognition Based on Deep Ensemble Models. Remote Sens. 2023, 15, 3007. [Google Scholar] [CrossRef]
  3. Lu, Z.; Sun, H.; Ji, K.; Kuang, G. Adversarial Robust Aerial Image Recognition Based on Reactive-Proactive Defense Framework with Deep Ensembles. Remote Sens. 2023, 15, 4660. [Google Scholar] [CrossRef]
  4. Raja, A.; Njilla, L.; Yuan, J. Adversarial Attacks and Defenses Toward AI-Assisted UAV Infrastructure Inspection. IEEE Internet Things J. 2022, 9, 23379–23389. [Google Scholar] [CrossRef]
  5. Zhang, Y.; Zhang, Y.; Qi, J.; Bin, K.; Wen, H.; Tong, X.; Zhong, P. Adversarial Patch Attack on Multi-Scale Object Detection for UAV Remote Sensing Images. Remote Sens. 2022, 14, 5298. [Google Scholar] [CrossRef]
  6. Pathak, S.; Shrestha, S.; AlMahmoud, A. Model Agnostic Defense against Adversarial Patch Attacks on Object Detection in Unmanned Aerial Vehicles. In Proceedings of the 2024 IEEE/RSJ International Conference on Intelligent Robots and Systems (IROS), Abu Dhabi, United Arab Emirates, 14–18 October 2024; pp. 2586–2593. [Google Scholar] [CrossRef]
  7. Ide, R.; Yang, L. Adversarial Robustness for Deep Learning-Based Wildfire Prediction Models. Fire 2025, 8, 50. [Google Scholar] [CrossRef]
  8. Chen, L.; Xu, Z.; Li, Q.; Peng, J.; Wang, S.; Li, H. An Empirical Study of Adversarial Examples on Remote Sensing Image Scene Classification. IEEE Trans. Geosci. Remote Sens. 2021, 59, 7419–7433. [Google Scholar] [CrossRef]
  9. Da, Q.; Zhang, G.; Wang, W.; Zhao, Y.; Lu, D.; Li, S.; Lang, D. Adversarial Defense Method Based on Latent Representation Guidance for Remote Sensing Image Scene Classification. Entropy 2023, 25, 1306. [Google Scholar] [CrossRef] [PubMed]
  10. Li, W.; Li, Z.; Sun, J.; Wang, Y.; Liu, H.; Yang, J.; Gui, G. Spear and Shield: Attack and Detection for CNN-Based High Spatial Resolution Remote Sensing Images Identification. IEEE Access 2019, 7, 94583–94592. [Google Scholar] [CrossRef]
  11. Tasneem, S.; Islam, K.A. Improve Adversarial Robustness of AI Models in Remote Sensing via Data-Augmentation and Explainable-AI Methods. Remote Sens. 2024, 16, 3210. [Google Scholar] [CrossRef]
  12. Yu, W.; Xu, Y.; Ghamisi, P. Universal adversarial defense in remote sensing based on pre-trained denoising diffusion models. Int. J. Appl. Earth Obs. Geoinf. 2024, 133, 104131. [Google Scholar] [CrossRef]
  13. Shianios, D.; Kyrkou, C.; Kolios, P.S. A Benchmark and Investigation of Deep-Learning-Based Techniques for Detecting Natural Disasters in Aerial Images. In Computer Analysis of Images and Patterns, Proceedings of the 20th International Conference, CAIP 2023, Limassol, Cyprus, 25–28 September 2023; Proceedings, Part II; Springer: Berlin/Heidelberg, Germany, 2023; pp. 244–254. [Google Scholar] [CrossRef]
  14. Ren, K.; Zheng, T.; Qin, Z.; Liu, X. Adversarial Attacks and Defenses in Deep Learning. Engineering 2020, 6, 346–360. [Google Scholar] [CrossRef]
  15. Rahman, M.; Roy, P.; Frizell, S.S.; Qian, L. Evaluating Pretrained Deep Learning Models for Image Classification Against Individual and Ensemble Adversarial Attacks. IEEE Access 2025, 13, 35230–35242. [Google Scholar] [CrossRef]
  16. Madry, A.; Makelov, A.; Schmidt, L.; Tsipras, D.; Vladu, A. Towards Deep Learning Models Resistant to Adversarial Attacks. arXiv 2017, arXiv:1706.06083. [Google Scholar] [CrossRef]
Figure 1. Flowchart of the overall experimental methodology across four phases.
Electronics 14 03210 g001
Figure 2. Representative images from each disaster class in the AIDERV2 dataset.
Electronics 14 03210 g002
Figure 3. Visual examples of PGD perturbations applied to a flood image under three ϵ levels: 4 / 255 (bottom), 8 / 255 (middle), and 16 / 255 (top), all with a fixed α = 0.020 and T = 10 . Each row shows the original image, the adversarially perturbed image, and the magnified perturbation map (scaled ×10 for visibility). As ϵ increases, the magnitude of the perturbation becomes more visually pronounced.
Electronics 14 03210 g003
Figure 4. Accuracy Drop (AD) Heatmaps for Phase II (top) and Phase IV (bottom).
Electronics 14 03210 g004
Figure 5. Attack Success Rate (ASR) Heatmaps for Phase II (top) and Phase IV (bottom).
Electronics 14 03210 g005
Table 1. Experimental Design for Adversarial Attacks and Defenses with Expected Outcomes.
ExperimentTraining DataTesting DataAttack AppliedDefense Applied
Baseline ModelClean ImagesClean ImagesNoNo
Expected Outcome: High classification accuracy under normal conditions.
PGD Attack on BaselineClean ImagesAdversarial ImagesYes (PGD)No
Expected Outcome: Significant drop in accuracy due to adversarial perturbations.
Adversarially Trained ModelClean + Adversarial ImagesClean ImagesNoYes (PGD Training)
Expected Outcome: Similar accuracy but improved resilience against adversarial perturbations.
PGD Attack on Adversarially Trained ModelClean + Adversarial ImagesAdversarial ImagesYes (PGD)Yes (PGD Training)
Expected Outcome: Higher accuracy than baseline under attack conditions.
Table 2. Classification Report on Clean Test Set (Phase I).
ClassPrecisionRecallF1-ScoreSupport
Earthquake0.970.960.96100
Fire0.840.980.90100
Flood0.970.980.98100
Normal0.980.810.89100
Accuracy0.93
Macro Avg0.940.930.93400
Weighted Avg0.940.930.93400
Table 3. PGD Attack Parameters Used in Phase 2.
Perturbation Bound (ϵ)Step Size (α)Iterations
4/255, 8/255, 16/2550.001, 0.004, 0.008, 0.010, 0.02010, 20, 30
Table 4. Adversarial Accuracy (%) under PGD Attacks Across Varying ϵ , α , and Iteration Counts (Phase II).
α10 Iterations20 Iterations30 Iterations
ϵ = 4/255ϵ = 8/255ϵ = 16/255ϵ = 4/255ϵ = 8/255ϵ = 16/255ϵ = 4/255ϵ = 8/255ϵ = 16/255
0.00131.00%31.00%31.00%29.50%29.25%29.25%28.75%27.50%27.50%
0.00429.00%27.25%26.75%28.00%26.50%25.25%27.75%25.75%23.75%
0.00829.50%27.00%24.75%28.75%26.00%22.50%28.75%25.25%22.00%
0.01030.00%26.75%23.50%29.25%25.75%21.75%29.50%25.75%21.00%
0.02031.25%28.00%23.50%30.50%27.75%23.25%31.25%27.50%22.25%
Table 5. Classification Report on Clean Test Set (Phase III).
ClassPrecisionRecallF1-ScoreSupport
Earthquake0.920.940.93100
Fire0.900.920.91100
Flood0.930.910.92100
Normal0.910.870.89100
Accuracy0.91
Macro Avg0.920.910.91400
Weighted Avg0.920.910.91400
Table 6. Adversarial Accuracy (%) under PGD Attacks Across Varying ϵ , α , and Iteration Counts (Phase IV).
α10 Iterations20 Iterations30 Iterations
ϵ = 4/255ϵ = 8/255ϵ = 16/255ϵ = 4/255ϵ = 8/255ϵ = 16/255ϵ = 4/255ϵ = 8/255ϵ = 16/255
0.00187.2%86.5%85.1%86.0%85.3%83.4%85.0%84.1%81.5%
0.00486.1%85.5%83.2%84.2%83.0%80.3%83.0%81.8%78.5%
0.00885.0%84.3%82.0%83.2%81.5%78.8%81.5%80.0%77.0%
0.01084.3%83.5%81.3%82.5%80.7%78.0%80.2%78.9%76.2%
0.02082.5%81.0%79.2%80.3%78.2%76.5%78.2%76.5%75.0%
Table 7. Overall Comparison of Adversarial Resistance Metrics.
PhaseMin AAMax AAMin ASRMax ASR
Phase II (Baseline)21.00%31.25%68.75%79.00%
Phase IV (Adv. Trained)75.00%87.20%12.80%25.00%
Disclaimer/Publisher’s Note: The statements, opinions and data contained in all publications are solely those of the individual author(s) and contributor(s) and not of MDPI and/or the editor(s). MDPI and/or the editor(s) disclaim responsibility for any injury to people or property resulting from any ideas, methods, instructions or products referred to in the content.