Abstract
This study presents an algorithm for non-invasive blood pressure (BP) estimation in neonates using photoplethysmography (PPG), suitable for resource-constrained neonatal telecare platforms. Using the Windkessel model, the algorithm processes PPG signals from a MAX 30102 sensor, (Analog Devices (formerly Maxim Integrated), based in San Jose, CA, USA) filtering motion noise and extracting cardiac cycle time and systolic time (ST). These parameters inform a derived blood flow signal, the input for the Windkessel model. Calibration utilizes average parameters based on the newborn’s post-conceptional age, weight, and gestational age. Performance was validated against readings from a standard non-invasive BP cuff at SES Hospital Universitario de Caldas. Two parameter estimation methods were evaluated. The first yielded root mean square errors (RMSEs) of 24.14 mmHg for systolic and 19.13 mmHg for diastolic BP. The second method significantly improved accuracy, achieving RMSEs of 2.31 mmHg and 5.13 mmHg, respectively. The successful adaptation of the Windkessel model to single PPG signals allows for BP calculation alongside other physiological variables within the telecare program. A device analysis was conducted to determine the appropriate device based on computational capacity, availability of programming tools, and ease of integration within an Internet of Things environment. This study paves the way for future research that focuses on parameter variations due to cardiovascular changes in newborns during their first month of life.
1. Introduction
Neonates receiving long-term oxygen therapy at home represent a highly vulnerable population, requiring continuous and precise physiological monitoring to prevent complications and support healthy development. These infants, often diagnosed with bronchopulmonary dysplasia, congenital heart disease, or other chronic respiratory conditions, depend on long-term oxygen therapy after discharge from neonatal intensive care units [1]. In this context, accurate and non-invasive monitoring of physiological parameters, especially BP, is crucial for assessing cardiovascular health, oxygen delivery, and general stability. However, routine clinical assessments are logistically challenging and stressful for both infants and caregivers.
Telecare systems that integrate wearable sensors with advanced signal processing algorithms offer a promising alternative, enabling remote, real-time monitoring while reducing healthcare burdens. In particular, photoplethysmography (PPG) has emerged as a key technology due to its non-invasiveness and its ability to extract vital information such as oxygen saturation (SpO2), heart rate (HR), and more recently, BP [2].
Several previous studies have explored the use of photoplethysmographic signals to estimate blood pressure in adults, often leveraging machine learning models, hemodynamic approximations, or hybrid methods [3,4]. These approaches typically rely on the assumption of stable arterial compliance and well-characterized cardiovascular responses. Although PPG has been extensively studied for blood pressure estimation in adult populations [3,4], limited research exists that specifically addresses neonatal physiology in this context. This gap is particularly relevant given the unique hemodynamic characteristics of neonates, such as immature vascular compliance, high heart rate variability, and increased susceptibility to motion artifacts due to small peripheral vessels. These differences significantly affect the interpretation of PPG waveforms and challenge the direct adaptation of adult-based models.
Recent reviews and clinical studies confirm the scarcity of neonatal-specific approaches. For example, ref. [5] emphasizes the absence of validated continuous BP monitoring techniques for neonates, while [6] demonstrates the feasibility of a capacitive sensor-based system in preterm infants, although this is not based on PPG. Similarly, broader reviews of neonatal monitoring technologies [7] highlight the urgent need for portable, non-invasive, and real-time solutions tailored to neonatal physiology.
In response to this critical gap, this study proposes a PPG-based BP estimation framework specifically tailored for neonates integrated into an IoT telecare platform. Unlike previous models, our approach is calibrated using neonatal physiological parameters and tested under real-world homecare conditions.
Yet, most existing BP estimation methods from PPG signals are not optimized for neonates—whose unique hemodynamic profiles, including smaller vessel compliance and higher heart rates, require specific modeling approaches. Furthermore, the computational complexity of many PPG-based BP estimation algorithms limits their deployment on resource-constrained IoT platforms, which are essential for portable neonatal monitoring at home [8,9]. This study addresses these two critical limitations. First, it proposes a neonatal-specific approach to BP estimation using a simplified implementation of the Windkessel model, adapted to the unique cardiovascular physiology of neonates. Unlike previous studies focused on adult populations or offline analysis, our method leverages neonatal-appropriate features extracted from PPG signals and models the arterial system in a way that accounts for developmental differences. Second, the proposed algorithm is designed for real-time execution on embedded IoT platforms, overcoming typical constraints such as limited processing power, memory, and energy availability [10]. This adaptation is crucial for ensuring continuous BP monitoring in remote settings with limited connectivity and power sources.
In addition to presenting this novel algorithm, we validate its feasibility for integration into a neonatal telecare system, conducting a comparative analysis of IoT platforms suitable for deployment in home environments. The main contribution of this study lies in bridging the gap between physiological modeling and embedded implementation, enabling real-time, non-invasive BP estimation tailored to oxygen-dependent neonates—a population largely overlooked in existing wearable health-monitoring solutions. In this context, the present research aims to apply techniques for the acquisition and processing of PPG signals and physiological models to evaluate BP in oxygen-dependent neonates in Manizales, adding an important monitoring variable to the telecare platform.
Given the significance of BP in neonatal monitoring, it is essential to understand its role in assessing cardiovascular health. Blood pressure (BP) is the force exerted by circulating blood on the walls of the arteries and serves as a critical indicator of cardiovascular health. It is typically expressed in millimeters of mercury (mmHg) as systolic blood pressure (SBP) over diastolic blood pressure (DBP). In neonates, BP monitoring is particularly important due to their immature cardiovascular system, which makes them more susceptible to conditions such as hypotension (low BP) and hypertension (high BP). Accurate BP assessment in neonates is essential for detecting and managing complications such as neonatal sepsis, hypoxia, and congenital heart diseases [11].
In this regard, plethysmography is a non-invasive diagnostic technology that provides information about changes in venous volume and motion artifacts, such as respiration [12]. Photoplethysmography (PPG), a type of optical plethysmography, measures blood perfusion in tissues through a pulsatile waveform [13]. This is achieved using a PPG electrode, which consists of a pair of light-emitting diodes (LEDs)—one red and one infrared—and the corresponding photosensors. The LEDs transmit light into the skin, which is scattered and absorbed by tissues, particularly by blood, which attenuates the reflected light more than the surrounding tissue due to its opacity [3]. PPG sensors detect these pulsatile changes in light intensity, which correspond to variations in blood volume synchronized with heartbeats. These sensors are typically placed in areas with many arteriovenous anastomoses, such as fingers or earlobes, where light can penetrate the tissue [4]. There are two types of PPG probes related to the placement of the LEDs and photosensors:
- Reflection probe: In these probes, the light-emitting and receiving parts are on the same side. The photosensors detect light that is backscattered by the tissue.
- Transmission probe: In this type, the light-emitting and receiving parts are on opposite sides, with tissue in between. The photosensors detect light that has passed through the tissue.
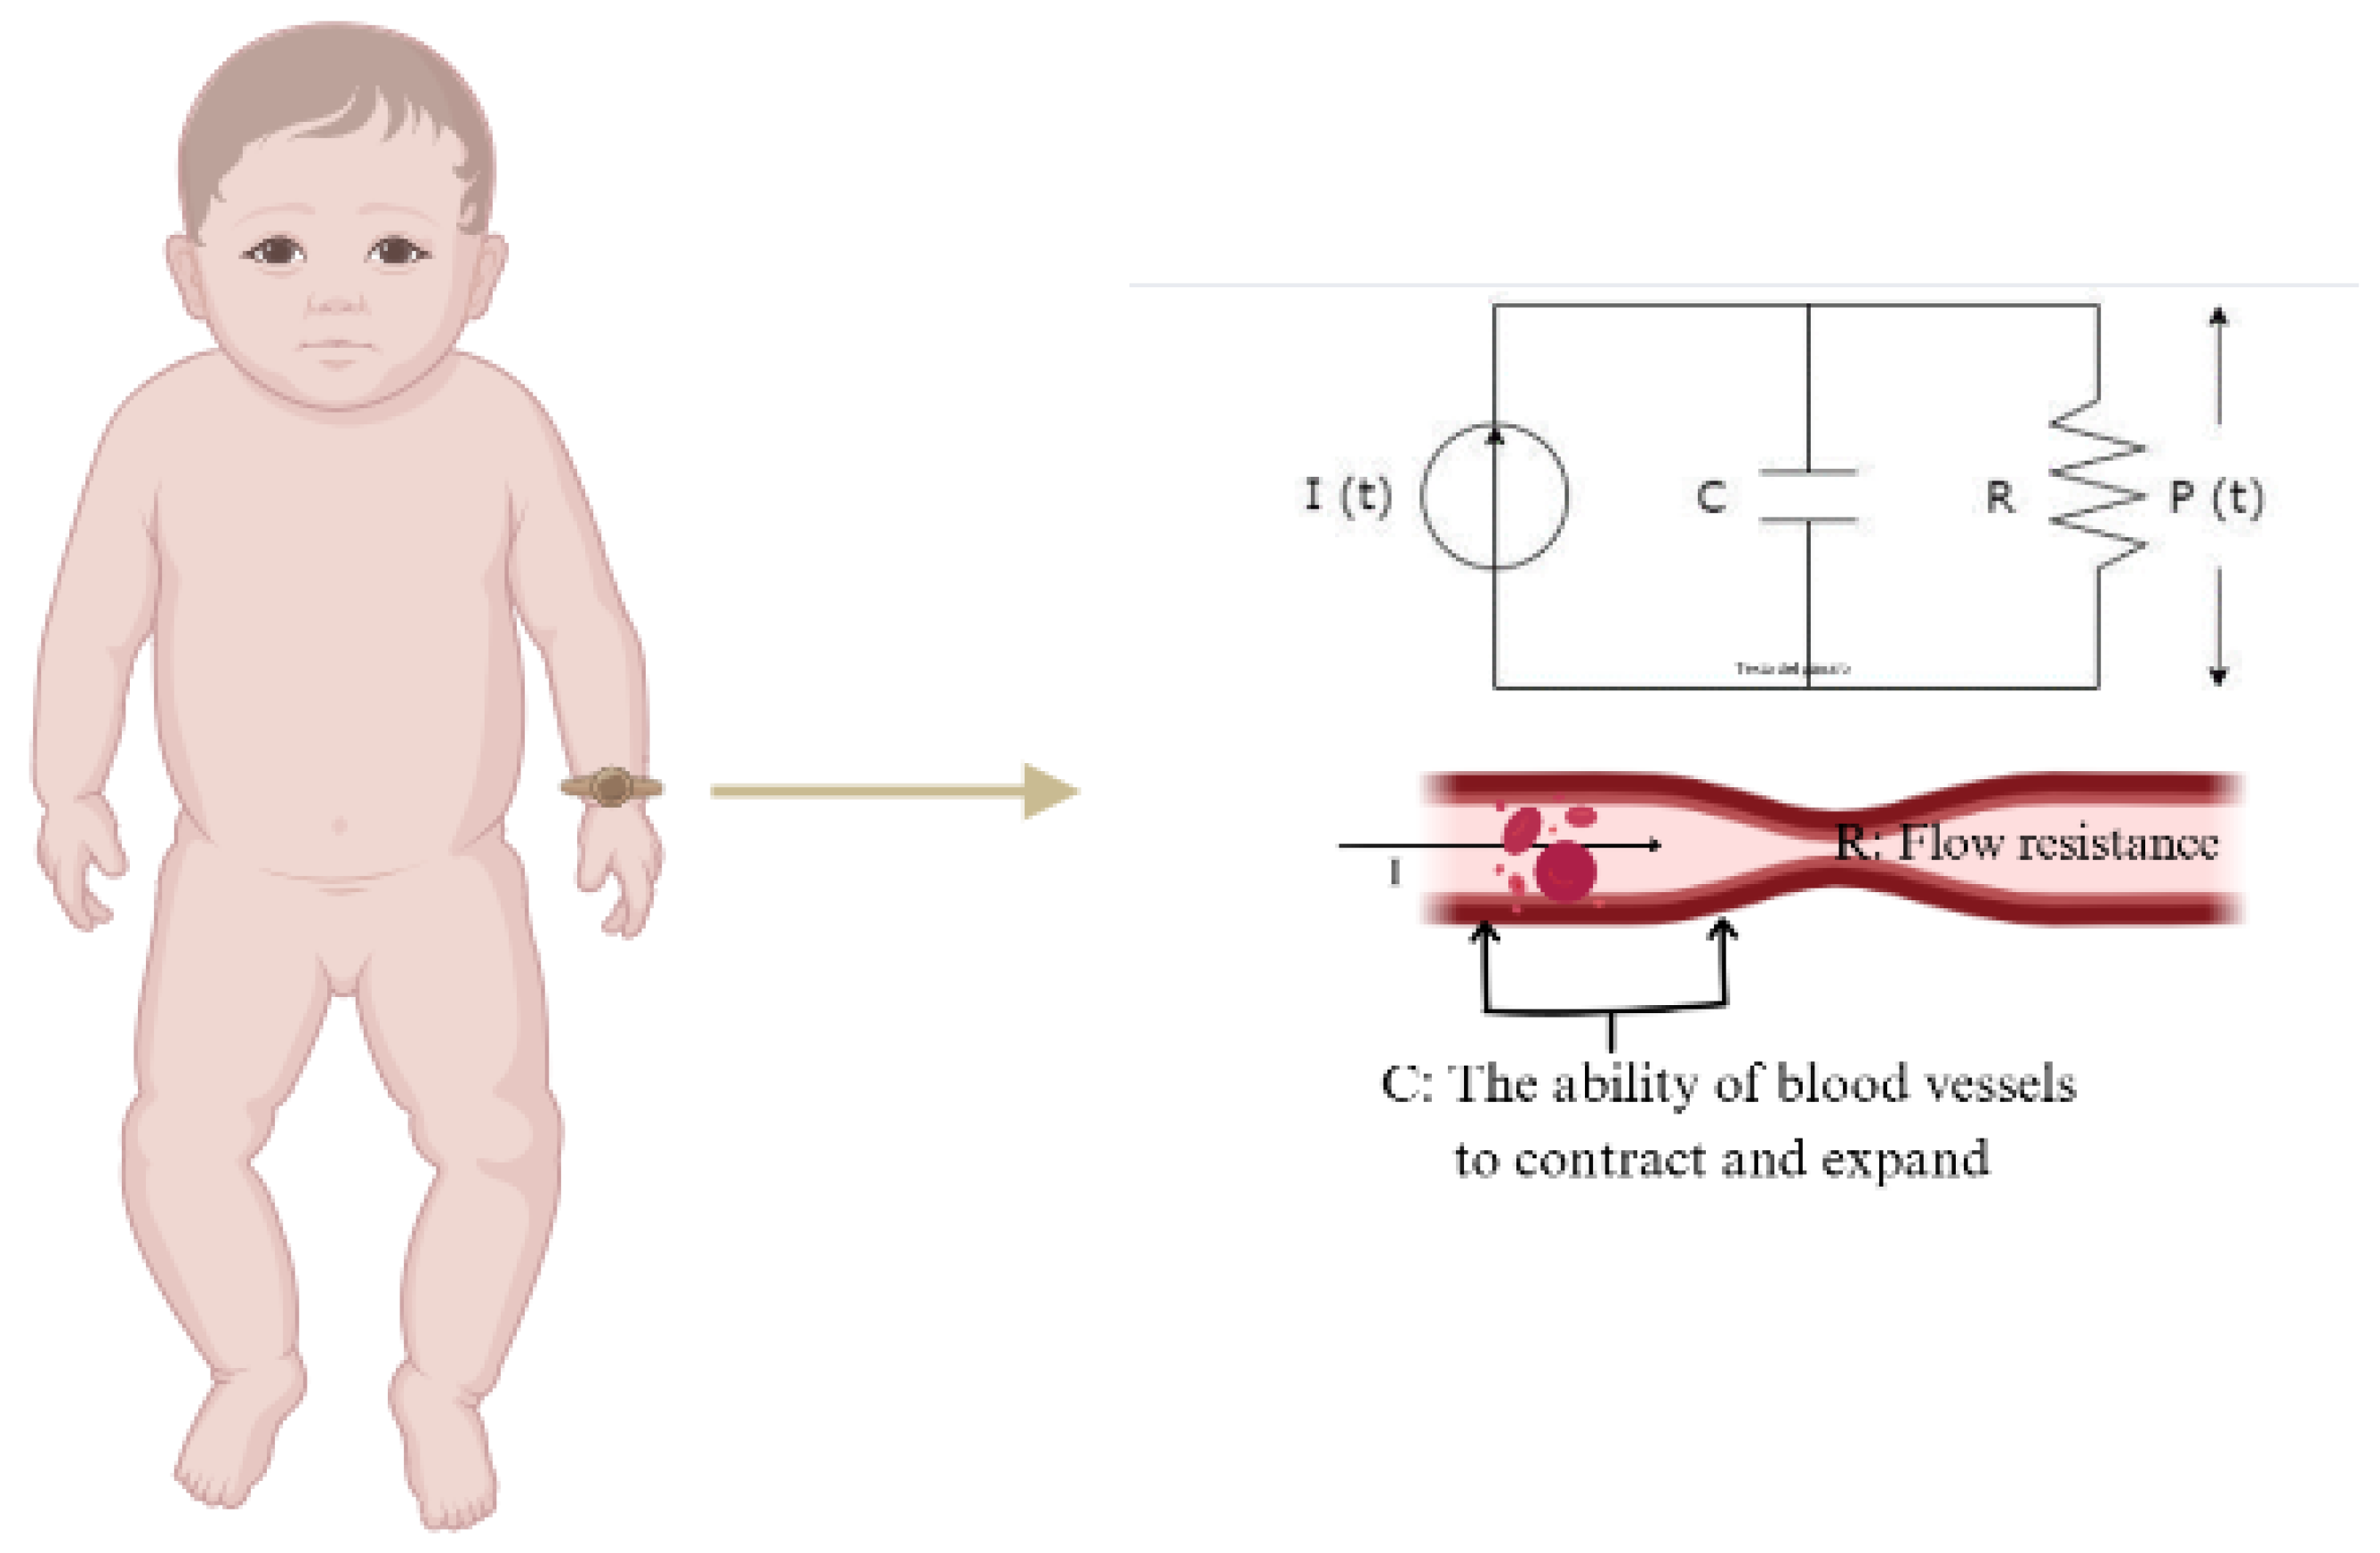
PPG technology has various applications in cardiovascular monitoring, including measurements of SpO2, HR, respiration, cardiac output, and BP. Among the different approaches to estimating BP from PPG signals, the Windkessel model provides a mathematical framework for understanding blood pressure dynamics through arterial compliance and peripheral resistance [14,15]. In its simplest form, it consists of two parallel elements a resistor and a capacitor. The resistor represents total peripheral resistance (R), which denotes the opposition to blood flow in the circulatory system, while the capacitor represents arterial compliance (C), indicating the ability of blood vessels to contract and expand in response to changes in volume and pressure (Figure 1). In neonates, the unique hemodynamic conditions, including smaller vessel compliance and higher heart rates, may influence the interpretation of PPG-derived blood pressure estimations.
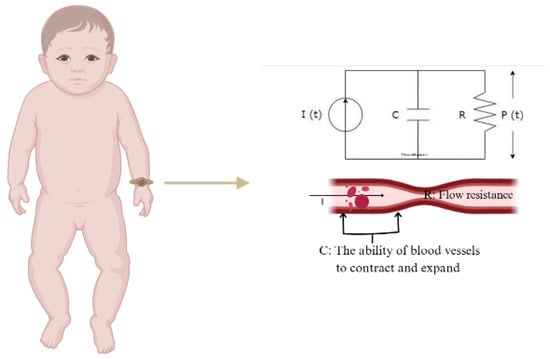
Figure 1.
Electrical analogy of the 2-element Windkessel model.
However, the implementation of this physiological model into an algorithm involves translating its differential equations into a discrete, computationally efficient form suitable for real-time applications. Implementing such algorithms on embedded systems presents significant challenges due to computational complexity and hardware constraints. Embedded devices, particularly those used in portable or wearable neonate monitoring, have limited processing power, memory, and energy efficiency. Balancing the accuracy and computational efficiency remains a crucial challenge in deploying the Windkessel model for continuous BP monitoring in embedded telecare systems.
In light of the inherent limitations associated with many Internet of Things (IoT) devices, these devices are often engineered to function under conditions of low connectivity and restricted energy availability, with computational capacities specifically tailored to such constraints [16]. Furthermore, they are occasionally deployed in remote environments. Consequently, in the context of the present study, which necessitates the utilization of an IoT device under these specific operational conditions, it is imperative that the algorithms employed for the extraction of physiological variables are meticulously adapted to align with the capabilities inherent to IoT-type devices. For this reason, the present work also presents an analysis of the various platforms considered to develop the final telehealth device.
Accordingly, this study aims to enhance neonatal telecare by developing a robust algorithm for BP estimation, addressing challenges related to limited data availability, and validating its integration into IoT devices for remote monitoring. The structure of this text is organized as follows: The Section 2 outlines the methods, including data acquisition, PPG signal processing, PPG signal characterization, and platform selection. The Section 3 presents the results, focusing on algorithm testing and platform selection considerations. Next, the Section 4 contextualizes the findings within the state of the art in BP estimation using PPG signals, aligning with the goal of operating in an IoT environment. Finally, the Section 5 and directions for future work are presented.
2. Methods
2.1. Signal Acquisition
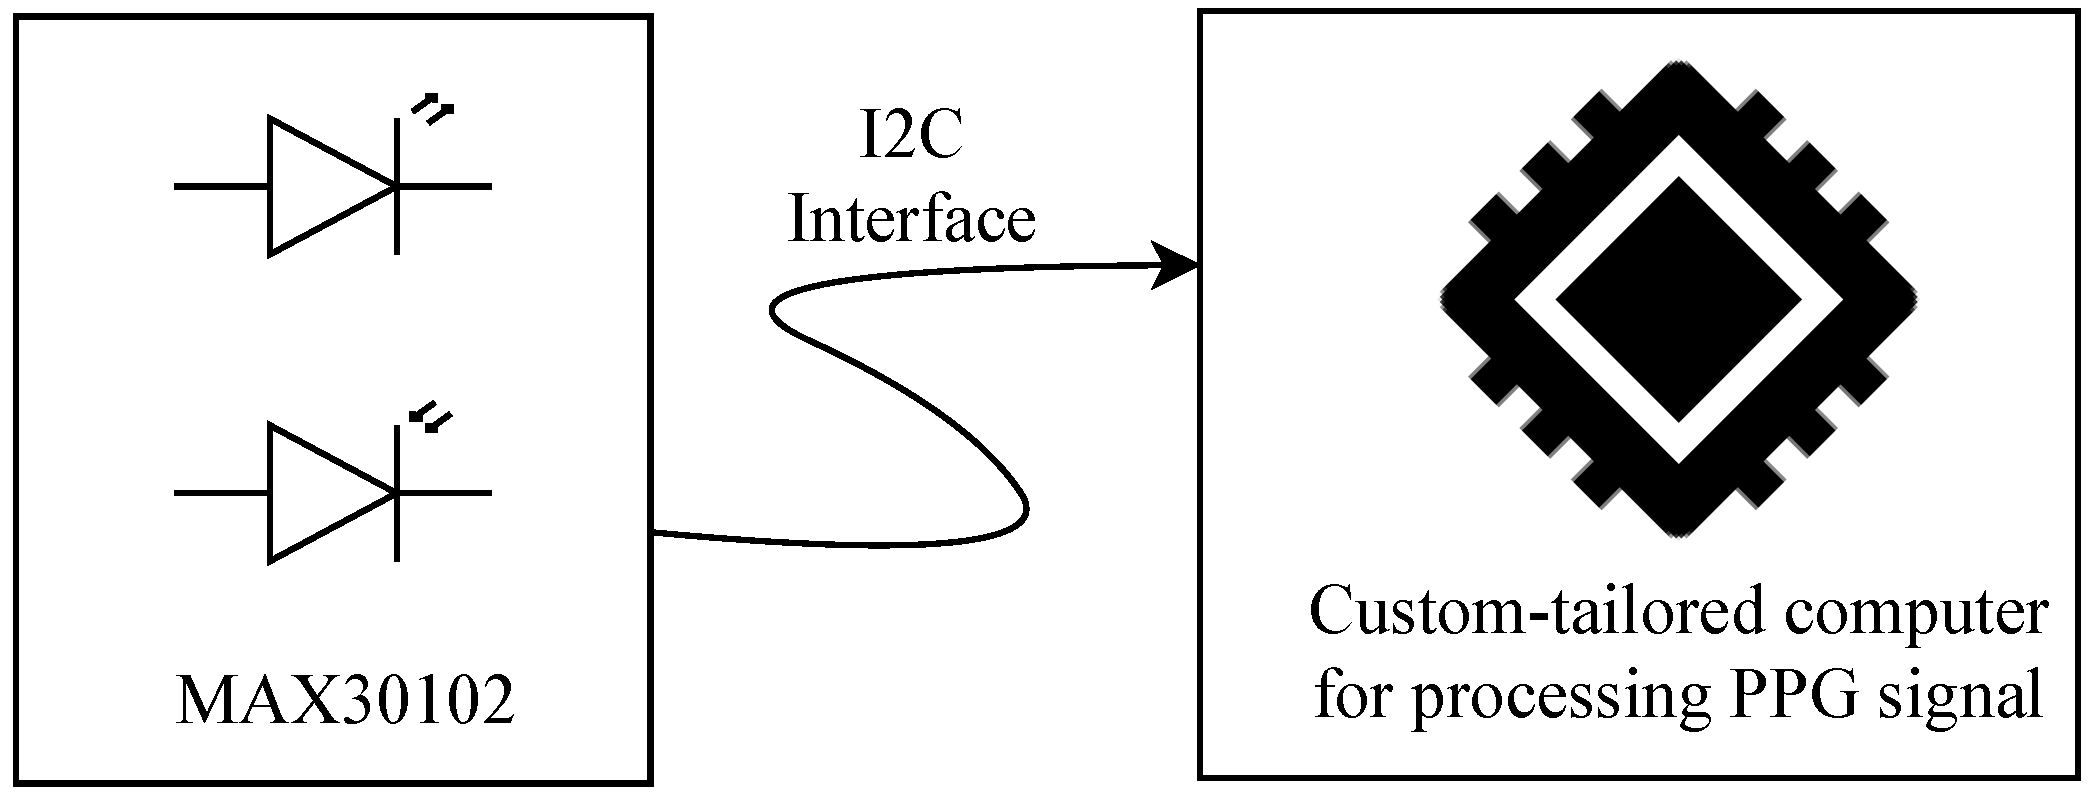
PPG signals were acquired using the MAX30102 pulse oximeter and heart rate (HR) sensor module, which includes light-emitting diodes (LEDs), photodetectors, optical elements, and low-noise electronics with ambient light rejection [17]. The MAX30102 operates as a reflection probe, transmitting the captured data via the I2C protocol to a custom-tailored computer system (see Figure 2). A Python 3.1-based algorithm was implemented on this computer using the Qwiic library [18] to continuously read the sensor and store values of the reflected red and infrared light for further processing and characterization. This processing aims to compute essential variables for the neonatal telecare program integrated into this study: HR, , and BP.
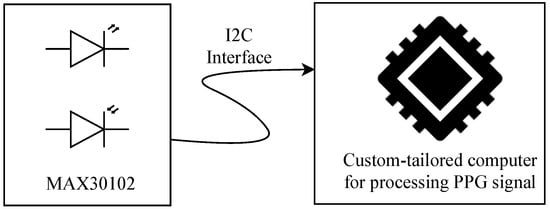
Figure 2.
Schematic of the neonatal PPG acquisition system. The MAX30102 sensor captures the signal using LEDs and photodetectors, transmitting it via I2C to a custom processing unit.
2.2. PPG Signal Processing
After acquisition, the PPG signals undergo processing to eliminate respiratory motion artifacts and smooth the waveform by removing low- and high-frequency noise. Respiratory motion is particularly prominent in neonatal PPG signals, as it obscures the perfusion-related waveform due to its relatively close frequency and high energy. Typically, neonatal respiratory rates range from 40 to 60 breaths per minute [19], while heart rates span from 100 to 160 bpm [20].
To isolate the cardiac component, Welch’s power spectral density analysis is applied to identify the dominant frequency. If this peak frequency is below 70 bpm, a notch filter is applied to suppress it. Currently, the notch filter operates at a fixed frequency rather than adapting in real time. Future iterations will implement adaptive filtering strategies.
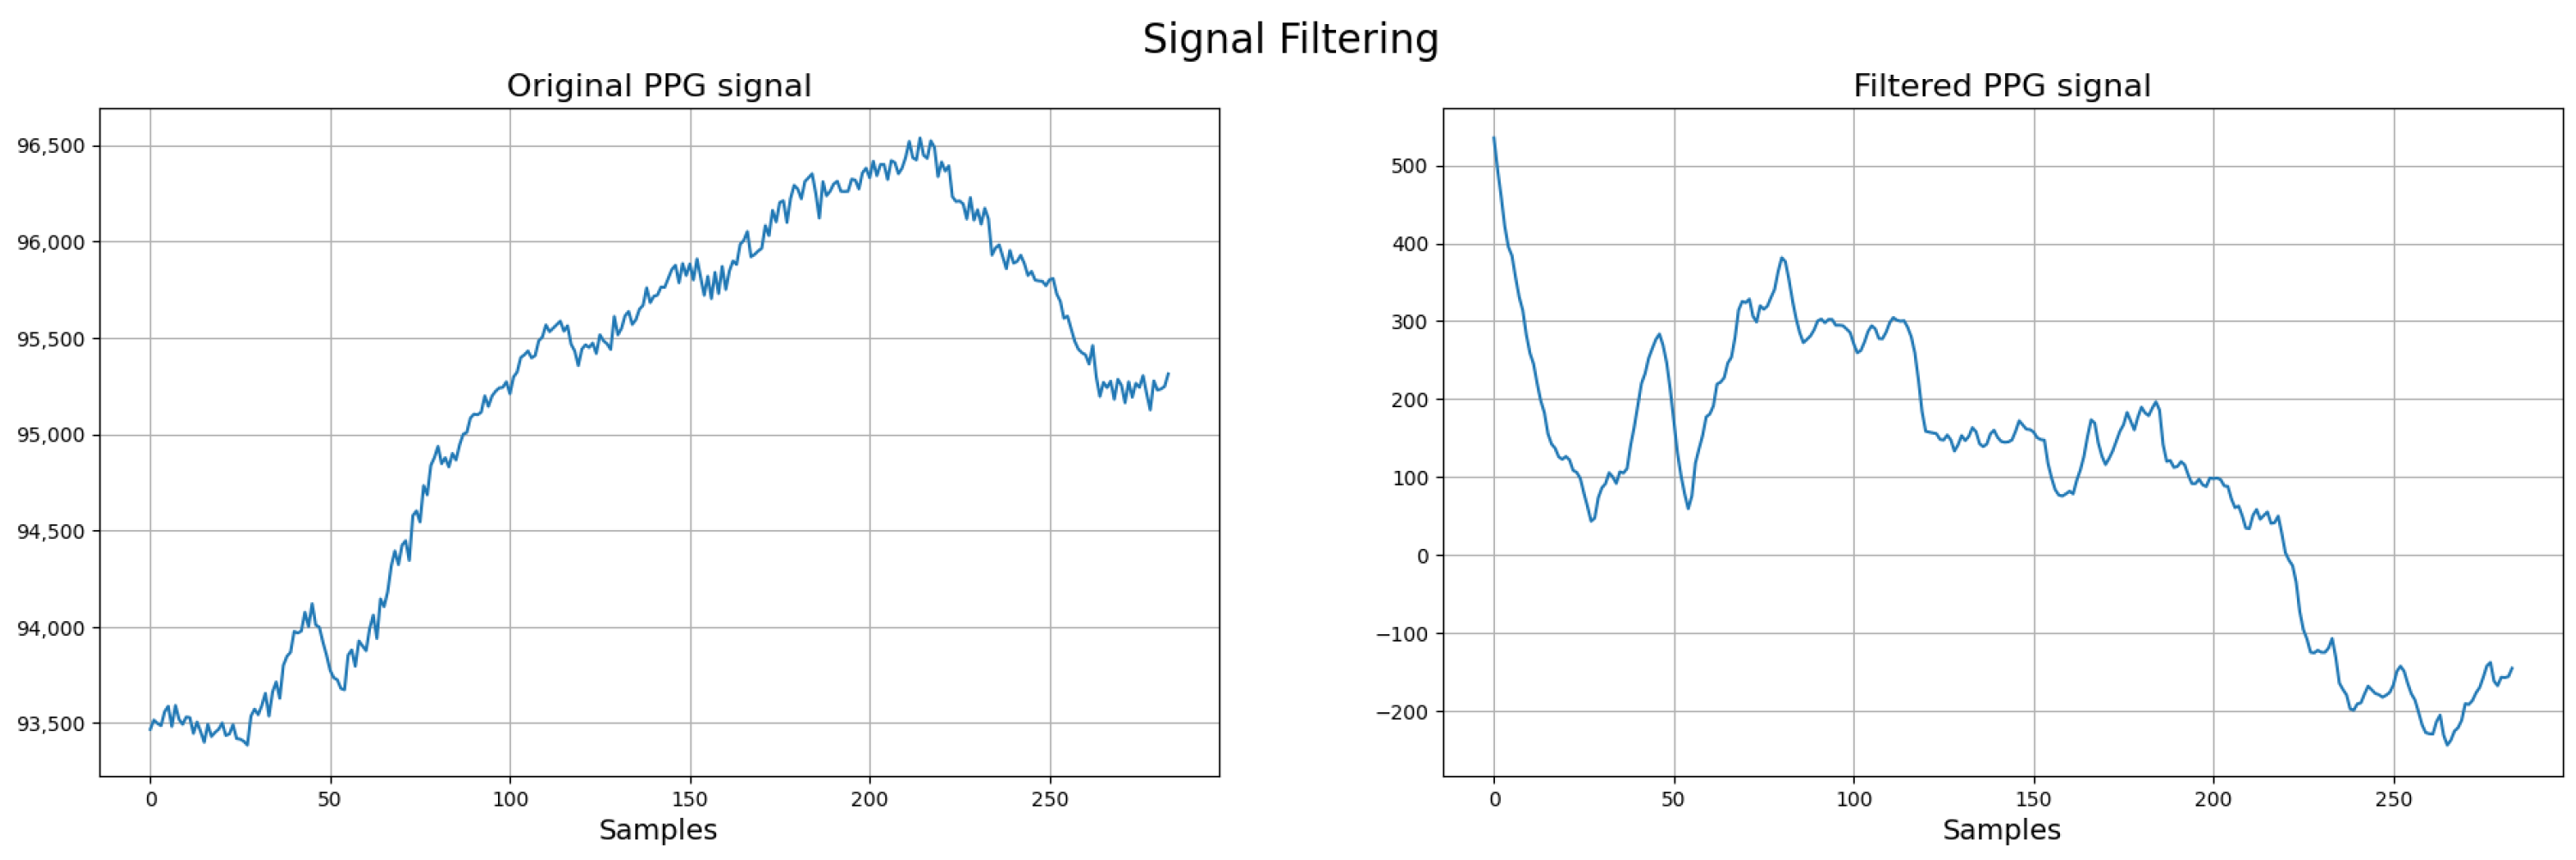
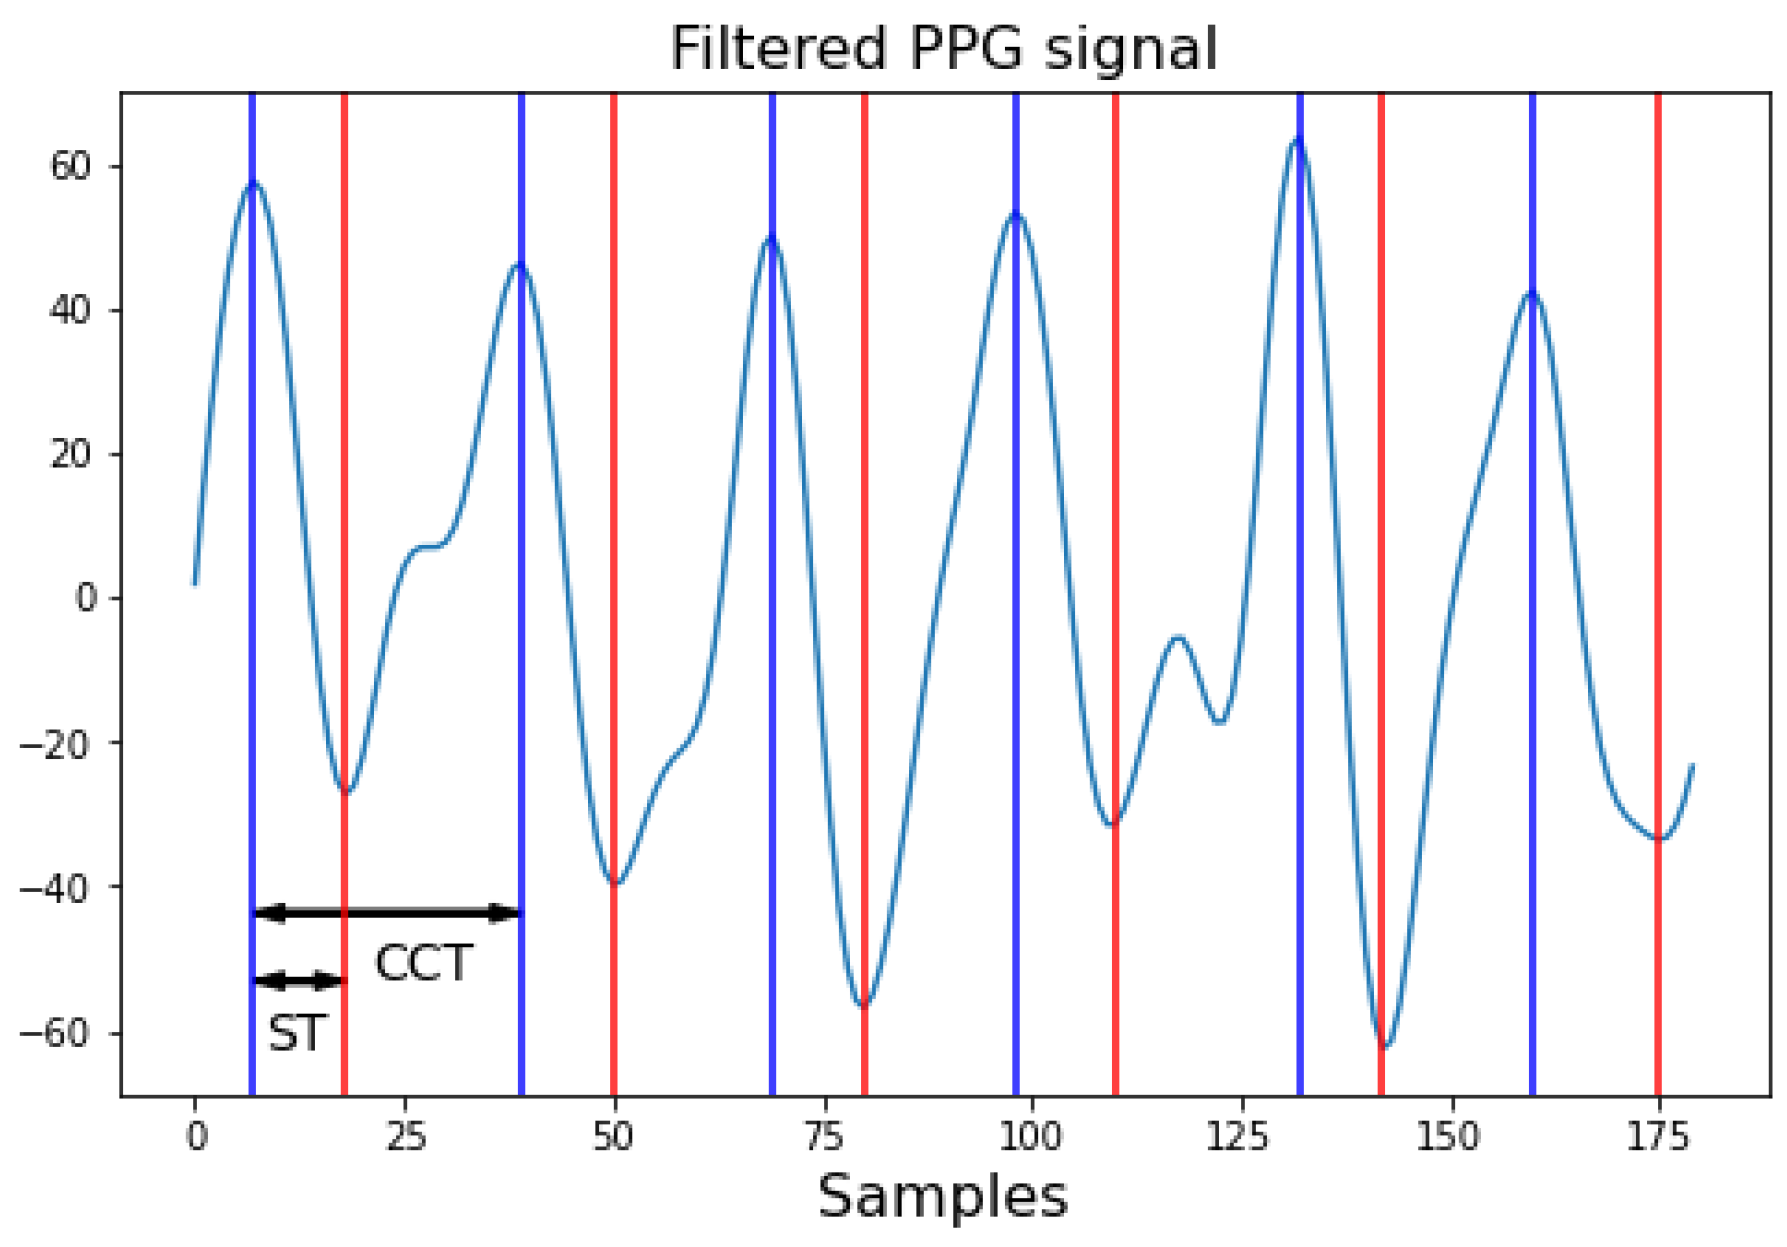
Next, a band-pass filter ranging from 0.8 to 3.5 Hz (48–210 bpm) is applied. The lower cutoff removes slow baseline drift and motion artifacts, while the upper cutoff attenuates high-frequency noise and harmonics (see Figure 3).

Figure 3.
Signal preprocessing workflow for neonatal PPG signals. In the final stage, red marks systolic time and blue marks cardiac cycle duration.
To illustrate the impact of preprocessing, Figure 4 presents the PPG signal before and after the application of filtering techniques. The left panel shows the raw PPG signal, where baseline drift, respiratory artifacts, and noise are clearly visible. This demonstrates the effectiveness of the preprocessing pipeline in isolating the relevant physiological components of the neonatal PPG signal.

Figure 4.
Comparison between raw and filtered neonatal PPG signals. Red: systolic time (ST); Blue: cardiac cycle (CCT) (filtered PPG signal).
2.3. Quantitative Assessment of PPG Signal Quality
To ensure that only PPG signals of acceptable quality are used for BP estimation, a quantitative signal quality assessment step is included prior to feature extraction. The Signal Quality Index (SQI) is computed based on metrics such as the following:
- Peak consistency: Each cardiac cycle is expected to contain a single dominant peak corresponding to the systolic phase. Cycles with multiple peaks or with inconsistent peak intervals (greater than 20% variation from the median) are flagged as low quality.
- Signal-to-noise ratio (SNR): The SNR is estimated by comparing the power within the expected HR band (0.8–3.5 Hz) to the total signal power. Signals with SNR dB are discarded.
- Baseline wander and artifact detection: The baseline is estimated using a moving average window of 2 s. Signals showing deviations exceeding 10% of the peak-to-peak amplitude are considered to contain motion artifacts and are excluded.
Additionally, only signal segments in which at least 90% of cardiac cycles meet all validation criteria are retained for further analysis. This ensures robust estimation of the systolic time (ST) and cardiac cycle time (CCT), which are critical for the BP estimation model.
Essentially, poor-quality signals are discarded. The proposed method operates in a continuous measurement setting, analyzing the incoming PPG signal within predefined time windows. If the signal is too distorted to allow for reliable heart rate estimation, peak detection, or if the systolic time (ST) exceeds 45% of the cardiac cycle time (CCT), it is deemed invalid. In such cases, the system triggers an error indicating incorrect sensor placement and proceeds to reacquire a new signal.
Regarding the use of a single PPG signal, although this limits the possibility of cross-referencing with other electrophysiological parameters, the decision was guided by the design requirement to develop a minimally invasive and patient-friendly prototype, suitable for use in neonatal care. Figure 5 illustrates an example of the invalid signals based on the described criteria.
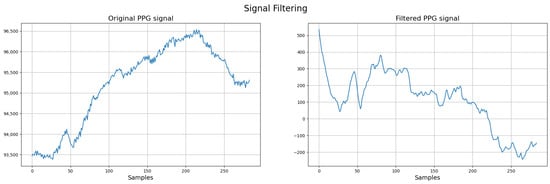
Figure 5.
Example of discarded signal.
2.4. Characterization of PPG Signal
Finally, characterization of the filtered PPG signals involves extracting the necessary information to define the blood flow signal, which determines the output of BP from the Windkessel model. These characteristics include the ST and cardiac cycle time (CCT) Figure 6. In the case of a reflection probe, the PPG signal is captured in an inverted manner, meaning the pulsatile wave recorded begins with diastole and ends with systole, needing the ST as the time from the peak maximum of the signal to the valley representing the start of the next cycle. Conversely, the cardiac cycle time can be obtained by measuring the time between peaks or valleys or by identifying the HR to calculate the duration of a beat.
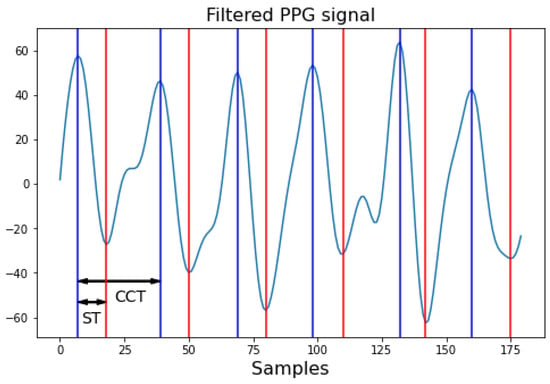
Figure 6.
Characteristics of the PPG signal. Red marks ST: systolic time; and blue marks CCT: cardiac cycle time. Each sample corresponds to 1/Fs seconds, where Fs is the sampling frequency.
2.5. Definition of Parameters for the Windkessel Model
One of the parameters to define is the input to the model, the blood flow signal. The total blood pumped by the heart during a cardiac cycle, or blood flow, can be expressed as a sinusoidal function during systole and remains constant at zero during diastole (1). This sinusoidal function depends on two crucial parameters: cardiac output , which defines its amplitude; and ST, which defines its period. The diastolic time, which defines the constant part of the blood flow signal, is obtained by subtracting the ST from the CCT.
The cardiac output is the heart’s pumping capacity, expressed as volume per unit time, and it correlates, on average, with both post-conception age and neonatal weight. From birth to one month of age, the index of this variable concerning weight decreases linearly from 450 mL/(kgmin) to 150 mL/(kgmin) [21]. This average is used, adjusting the value linearly week by week. This approach allows the blood flow signal definition to depend solely on PPG signal characteristics if the patient’s condition does not significantly affect the cardiac output, leading to BP values deviating from the average (see Table 1).

Table 1.
Normal BP values by post-conceptional week, adapted from [22,23]. Pressure values are given as follows: [minimum–maximum] [mean].
After defining the input, values must be assigned to the variables comprising the Windkessel model; R and C for the two-element case. This model is chosen because increasing the number of elements does not significantly change the generated BP signal amplitude, as demonstrated in [24]. Specifically, the values of systolic (SBP) and diastolic (DBP) pressures—the maximum and minimum of the signal, respectively—do not undergo significant changes with increased model complexity. Additionally, as shown in other studies [15,25,26], BP calculation based on PPG signals requires additional signals to increase measurement accuracy, such as electrocardiography (ECG) signals. For investigations involving the Windkessel model, databases are used to implement algorithms that relate PPG signals to R and C values [14]. This investigation explores the impact of implementing two different methodologies to obtain R and C on the results.
The first methodology involves assigning values to the resistance (R) and compliance (C) parameters based on Table 1. These values are determined according to the infant’s post-conceptional age, under the assumption of normal blood pressure values for that age group. Using these assumed pressures, R and C are calculated by solving an inverse problem.
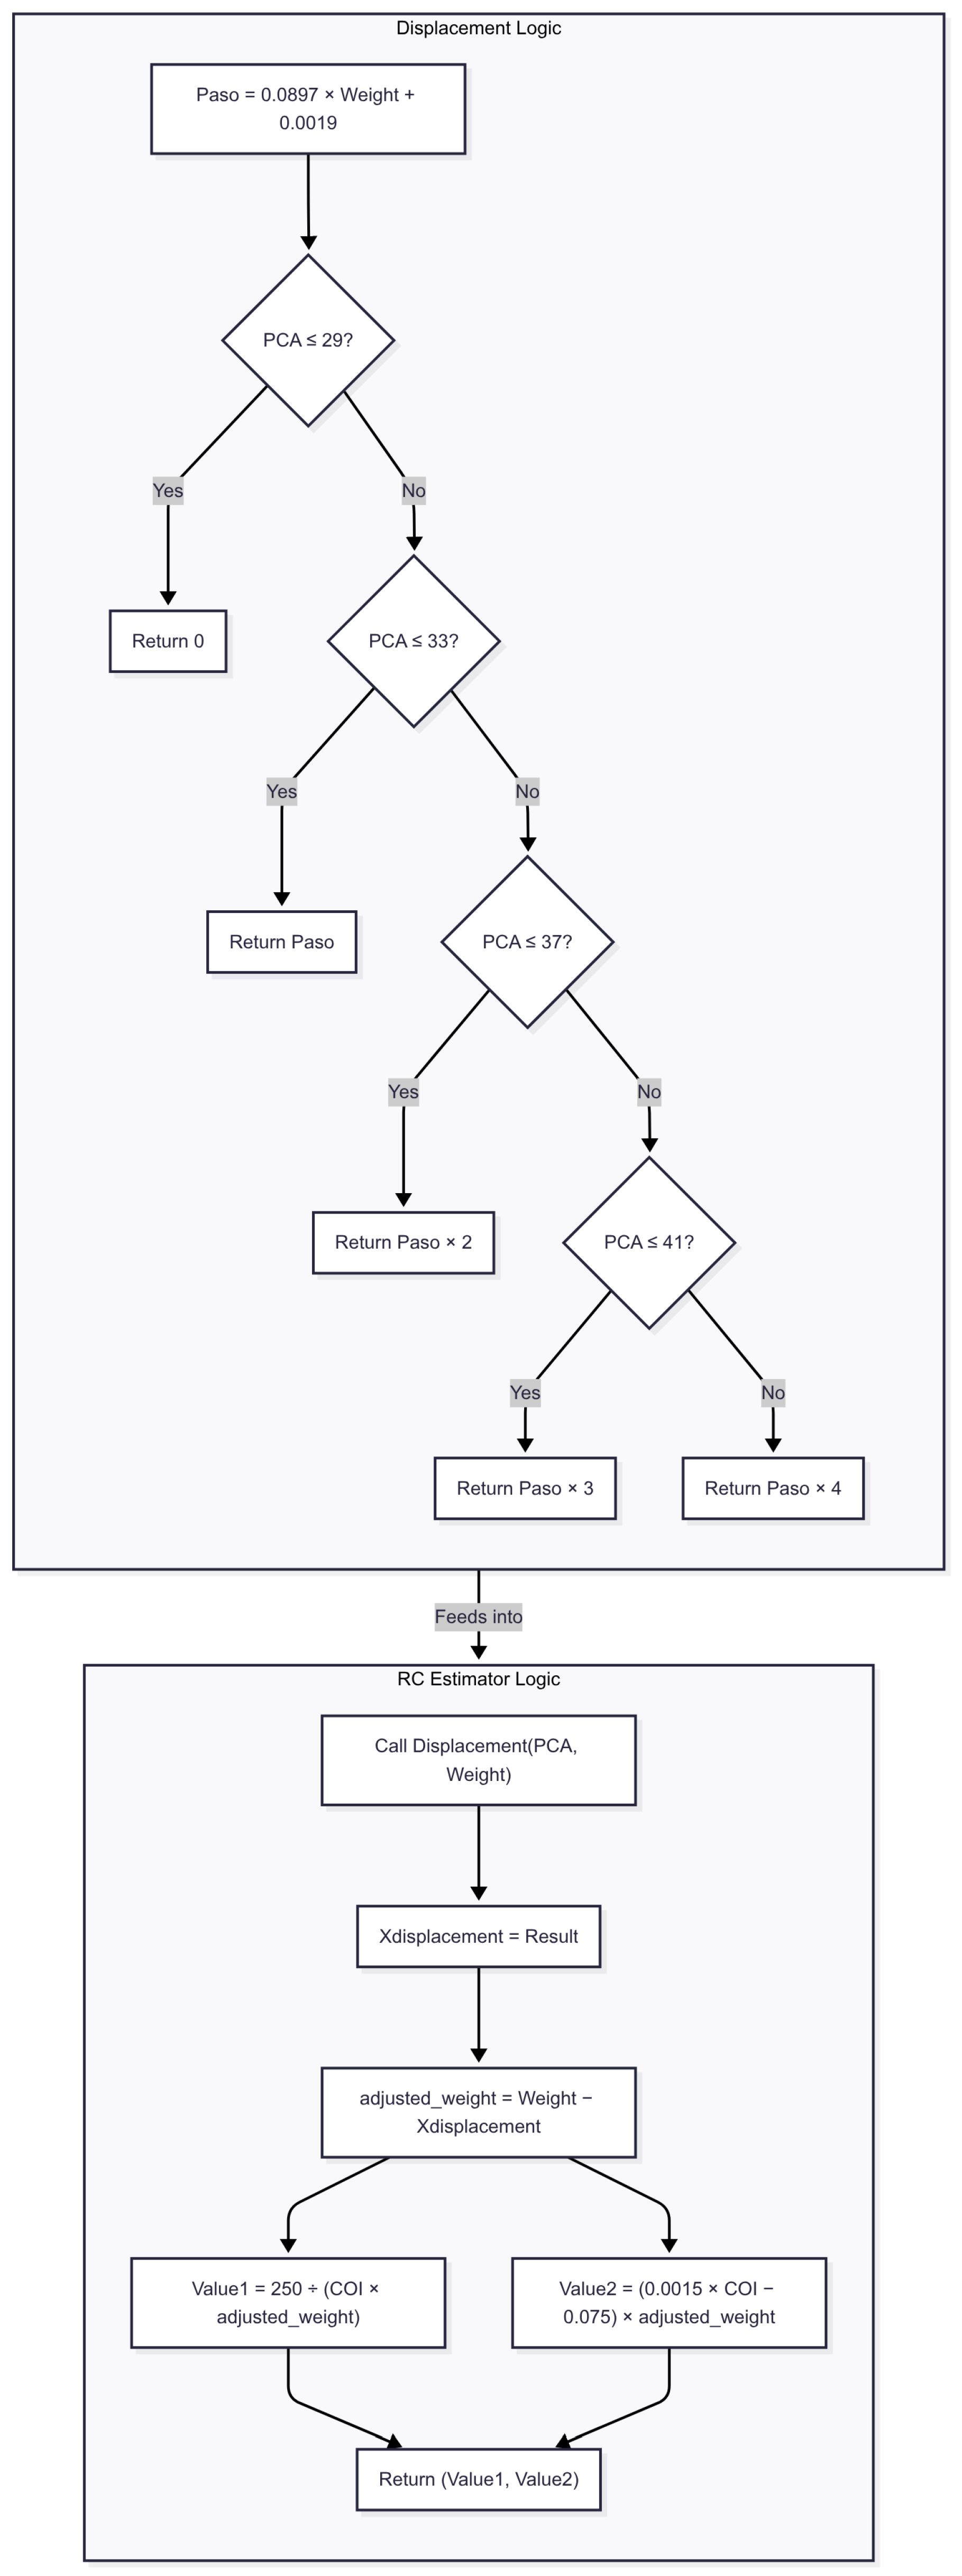
The second methodology introduces a calibration approach in which R and C are estimated through a two-stage, regression-based procedure designed to operate under conditions of limited data availability. In the first stage, a displacement index is computed using a lookup table that maps post-conceptional age to a scaling factor (2, 3, or 4), derived from a regression model based on five neonatal cases. This index determines the position along interpolation curves used to estimate the R and C values.
Next, the R value is computed using a rational function that relates neonatal weight to the estimated displacement. The C value is calculated by applying a linear equation that includes special coefficients, adjusted to reflect the relationship between weight and displacement. These approximations enable the model to produce age- and weight-adjusted BP estimations without requiring direct invasive measurements. While simplified, this approach provides a practical calibration mechanism under current dataset constraints. Figure 7 is provided to further illustrate and explain this approach. Future work will incorporate more granular parameter estimation methods as larger neonatal datasets become available. Considering the simplicity of the telecare platform, which has only one PPG sensor, the focus is on detecting BP changes rather than providing an exact estimation of this variable.
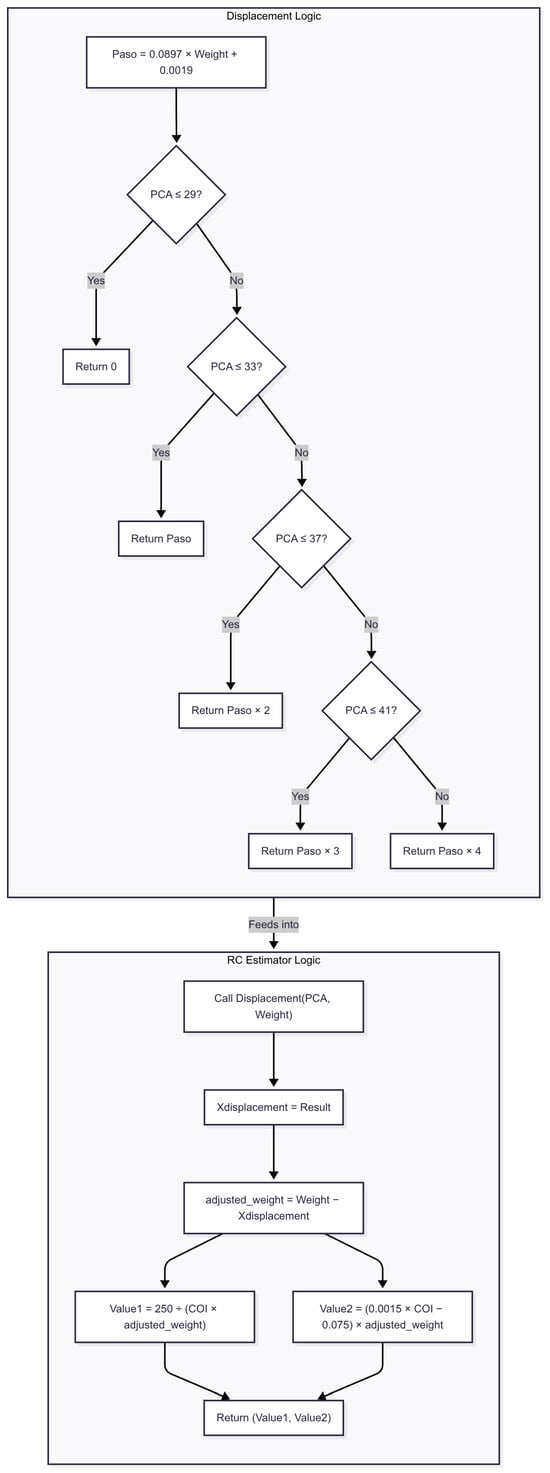
Figure 7.
Flowchart of method 2 for blood pressure estimation. The algorithm begins by computing a base displacement value (Paso) from the patient’s weight and adjusts it according to post-conceptional age (PCA). This displacement is then subtracted from the original weight to obtain an adjusted weight, which feeds into the final BP estimation formulas.
Since the normal neonatal HR ranges between 100 and 160 BPM, the selected average value is 140 BPM, corresponding to a cardiac cycle time of 0.4286 s. The chosen average ST, equivalent to the percentage in adults and based on tests conducted in this study, corresponds to 37% of the cardiac cycle time. These values, along with the week-by-week transition of the cardiac output index, allow for defining a constant average input to the Windkessel model. Finally, since cardiac output depends on weight, different values are taken to plot R and C curves that correspond to the average BP value per post-conceptional week. Defining weight- and age-dependent functions for R and C ensures that BP variations are solely due to changes in PPG signal characteristics, namely, ST and CCT.
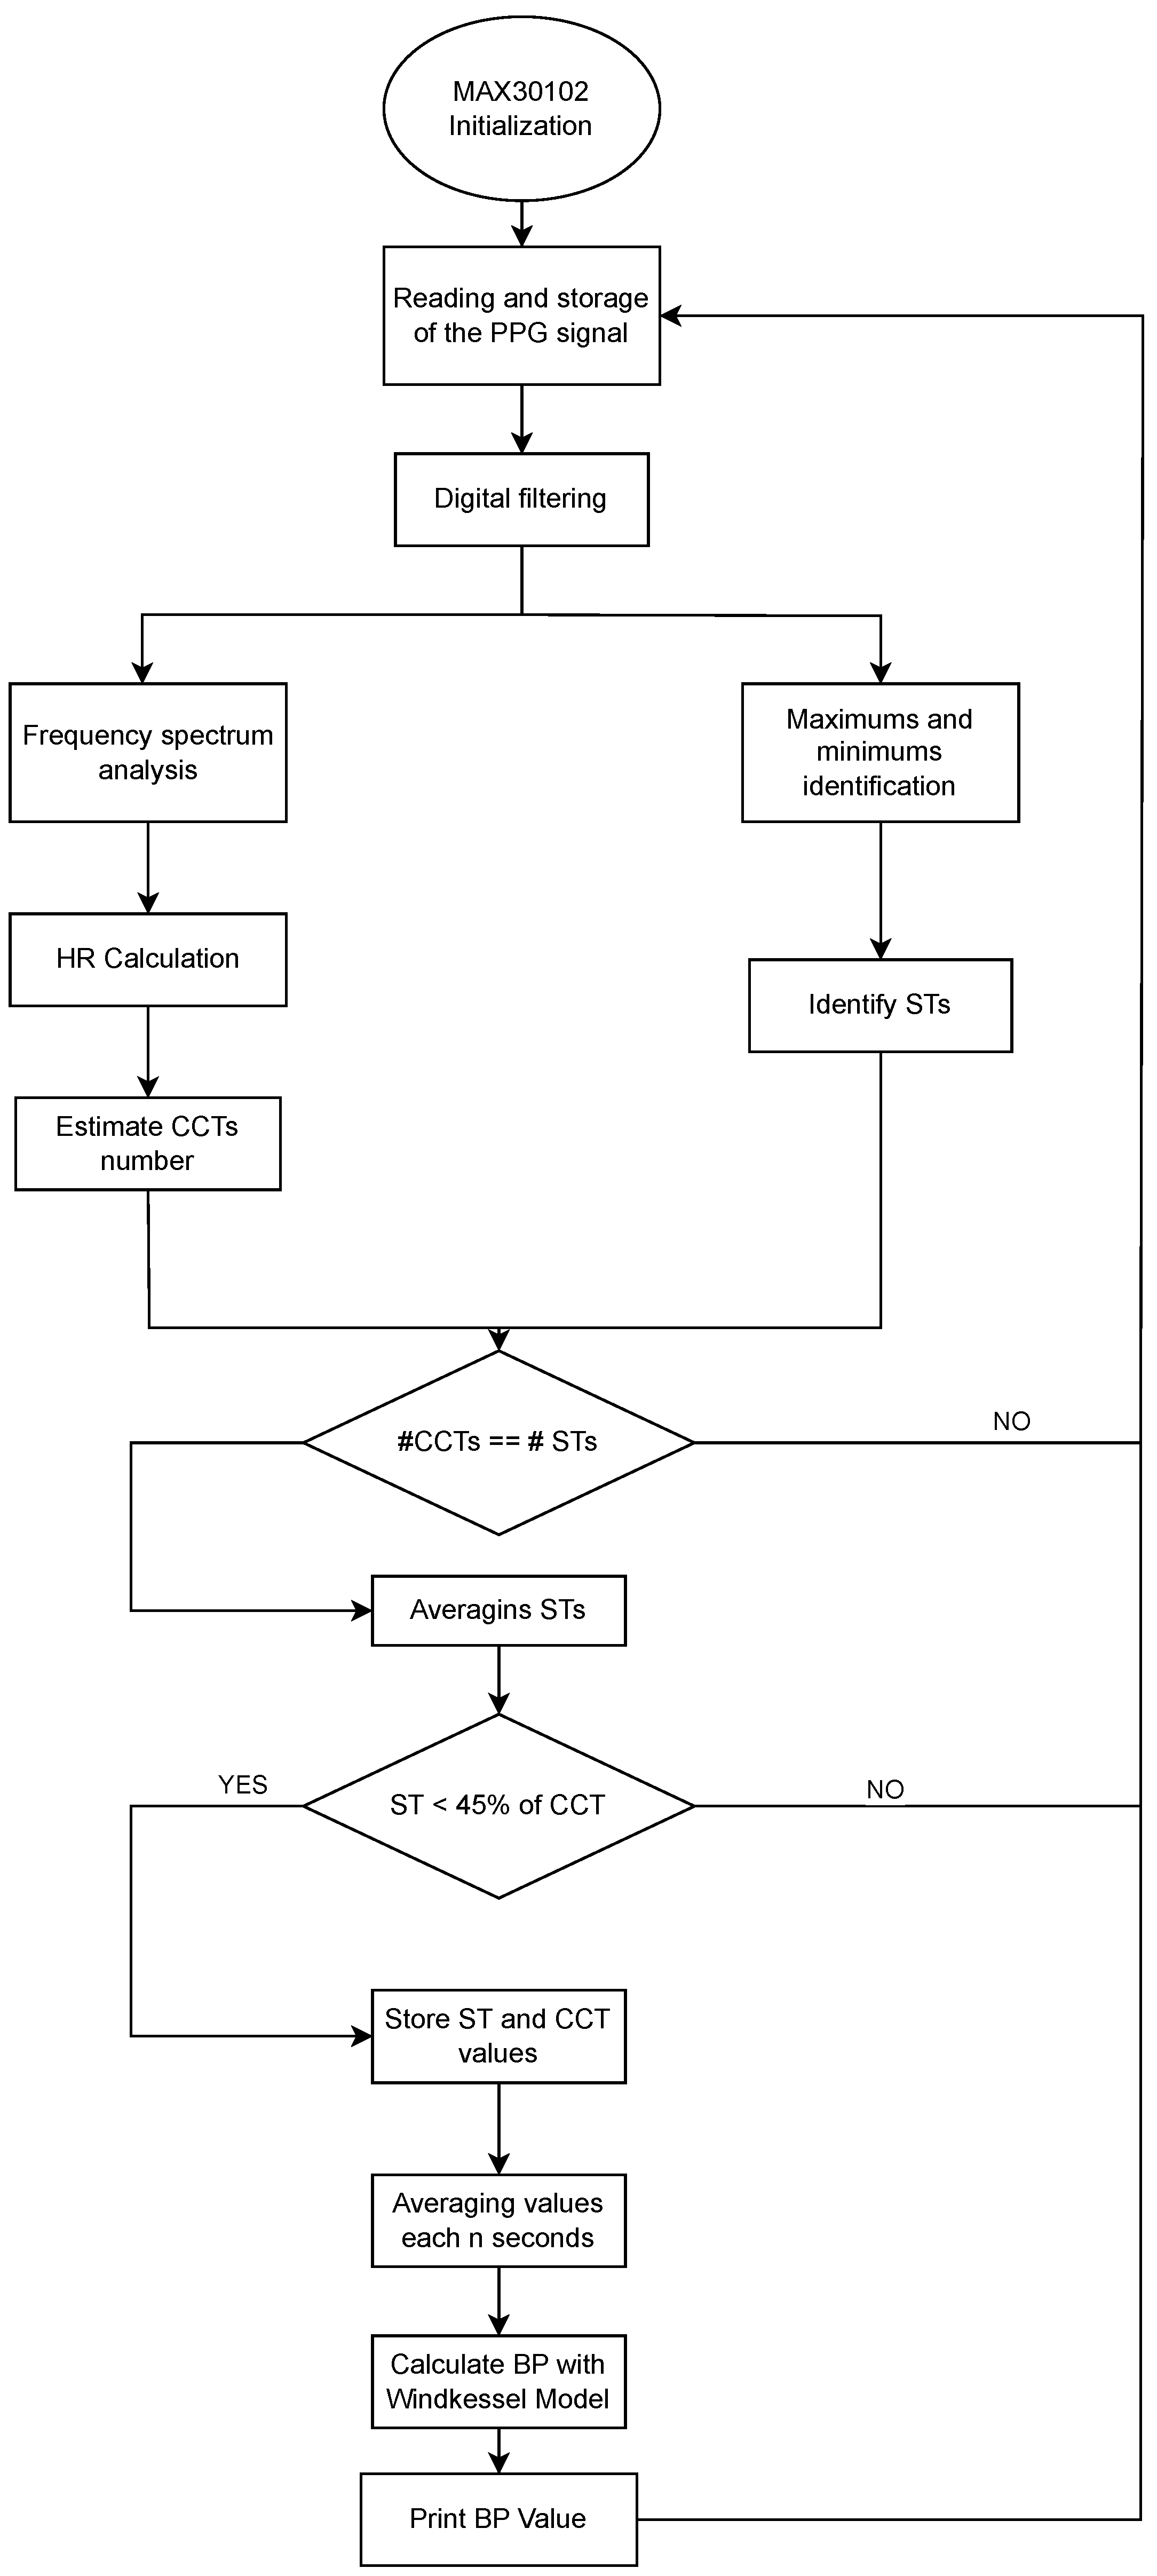
The definition of the input parameters for the Windkessel model based on a PPG signal is described in Figure 8. The process begins with the initialization of the MAX30102 sensor and acquisition of the raw PPG signal. After applying digital filters and conducting frequency spectrum analysis to isolate the physiological range, the algorithm detects local maxima and minima to identify the heart rate (HR), systolic time (ST), and cardiac cycle time (CCT). A consistency check ensures that the number of ST and CCT measurements aligns. Only those segments in which the ST is less than 45% of the CCT are retained to ensure signal quality. Validated ST and CCT values are averaged periodically, and these parameters are used to estimate blood pressure through the Windkessel model. The output is a real-time BP estimation, printed or transmitted via the telecare system. The selection of the 45% threshold was based on experimental analysis of approximately 20 PPG signals collected during the initial phase of the study. Threshold values near or above 50% often produced signals that resembled a sinusoidal waveform rather than a typical PPG pattern. From a biological perspective, and based on prior measurements in our neonatal study population, a systolic time (ST) value of 45% of the cardiac cycle time (CCT) is used as an indicator of myocardial contractility or left ventricular ejection performance. This aligns with pediatric echocardiography guidelines, which typically consider an ejection fraction of up to 45% as reflective of normal cardiac pumping efficiency in neonates [27].
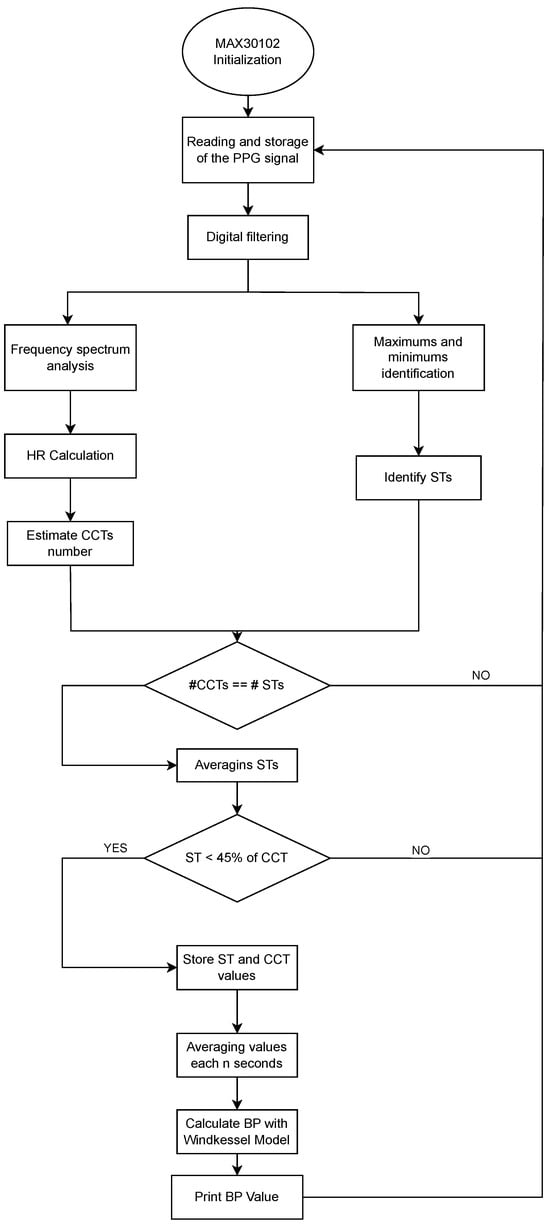
Figure 8.
Flowchart of the implemented algorithm for blood pressure estimation from neonatal photoplethysmographic signals.
It is important to distinguish this volume-based metric from the time-based measurement of systole as a percentage of the cardiac cycle, which may naturally exceed 45% in neonates due to their higher heart rates. However, in our dataset, signals with systolic times exceeding 45% were not observed in the candidate population and were typically associated with poor signal quality. Thus, the 45% threshold was adopted as a criterion for discarding low-quality signals during the filtering process.
The implemented algorithm validates the signal by considering the estimated cycles based on HR and identified systole times within a defined time frame. This process helps to discard signals distorted by sudden movements in the monitored limb, as such signals fail to accurately identify systole times, resulting in an incorrect number of cycles corresponding to the identified HR. Additionally, it ensures that the measured ST before calculating BP does not exceed 45% of the calculated CCT, as such cases are associated with poor PPG signal reconstruction by the digital filters, which convert it into a sinusoidal signal, exceeding the defined threshold.
2.6. Pseudocode for the Two-Element Windkessel Model
This pseudocode in Algorithm 1 describes the computational steps to simulate arterial pressure dynamics using a two-element Windkessel model, which represents the arterial system as a compliance (C) and a peripheral resistance (R).
| Algorithm 1 Simulation of arterial pressure using the two-element Windkessel model. |
|
2.7. Platform Selection
To implement the algorithm, it was necessary to evaluate different hardware platforms capable of supporting Python programming and meeting the computational requirements for processing photoplethysmographic signals. Three platforms were considered:
- Raspberry Pi 4 (8 GB RAM) (Raspberry Pi Foundation, Cambridge, UK) Selected for its compatibility with Python (Python Software Foundation, https://www.python.org, accessed on 28 June 2023) and its adequate computational capacity to handle the algorithm.
- ESP32 (Espressif Systems, Shanghai, China): Evaluated using MicroPython v1.20.0 (MicroPython Project, https://micropython.org, accessed on 15 January 2023): for its low power consumption and compact size, though computational limitations were anticipated.
- Arduino Mega 2560 board (based on ATmega2560 microcontroller, Arduino LLC, Somerville, MA, USA) Initially considered due to its wide availability and low power requirements; however, its lack of a Python compiler posed a challenge in translating the algorithm.
Each platform was evaluated based on its ability to execute the algorithm under practical conditions, including signal processing capacity, integration ease, and Python support. A comparative summary of these evaluations is presented in the Section 3.4.
2.8. Ethical Approval, Informed Consent, and Safety Protocols
This research was approved by the Bioethics Committee of the Universidad Autónoma de Manizales, as documented in Act No. 087 of 2019. The study was conducted in accordance with national and international guidelines for research involving human subjects, including the Declaration of Helsinki and Resolution 8430 of 1993 from the Colombian Ministry of Health. Written informed consent was obtained from all parents or legal guardians of participating neonates. The consent form outlined the study’s objectives, procedures, potential risks, expected benefits, and the confidentiality measures for handling collected data. Authorization for the use of clinical and monitoring data was also granted, ensuring both anonymity and data protection.
During system validation in the neonatal care unit, specific protocols were implemented to ensure the safety and comfort of the neonates. Sensor placement was performed under clinical supervision, following best practices to prevent skin injury, such as periodically changing the sensor’s placement on the body to avoid pressure-related lesions or irritation. Although the prototype included visual and auditory alert functionalities, these were used for experimental purposes only. In-clinic patient care continued to rely solely on the standard vital signs monitors used by the medical staff. These precautions ensured that the device testing adhered to hospital safety protocols and did not interfere with routine clinical monitoring.
3. Results
3.1. Monitoring Records of Neonates
In this study, BP values were calculated from PPG signal characteristics using the initial prototype of a neonatal telecare device that integrates the monitoring of this physiological variable. To assess the algorithm’s efficacy, measurements were compared with those from vital signs monitors in the neonatal unit of SES Hospital Universitario de Caldas. The oximetry sensor was placed on one limb, while the NIBP (non-invasive blood pressure) cuff was placed on the opposite limb. The measurements were performed postductally.
Table 2 presents the BP results obtained using the algorithm to process 10 records from two neonates, with five records from each neonate, each comprising 3000 samples at a sampling frequency (Fs) of 60 Hz. Neonate 1 was at 38 weeks post-conceptional age, and neonate 2 was at 40 weeks. BP measurements were initially taken with the vital signs monitor Nihon Kohden BSM-2301 (Nihon Kohden Corporation, Tokyo, Japan) at the beginning of each record. Subsequently, the algorithm estimated BP values every 5 s, and these were compared with the average monitor readings over each 50-s record duration. The first column enumerates the measurements and identifies the corresponding neonate. The second column shows the reference values measured by the vital signs monitor. The “Method 1” column presents results obtained using the proposed methodology for defining the R and C parameters based on neonatal post-conceptional age. In contrast, the last column shows the results from the second method, involving initial algorithm calibration, where the R and C values were assigned based on the post-conceptual week groups in Table 1 that best approximated the algorithm-derived values compared to the monitor measurements. Calibration with neonates aged 35 to 40 weeks post-conception aligned the R and C values with the first two groups of normal BP values.

Table 2.
BP results obtained for the records of two neonates, implementing the calculation of R and C based on post-conceptional week.
As shown in Table 2, method 2 yields blood pressure (BP) estimations that are consistently closer to the reference values obtained from the clinical monitor for both neonates. In neonate 1, the monitor reported systolic/diastolic values around 65.0–68.0/37.0–39.0 mmHg. Method 1 significantly overestimates both systolic and diastolic pressures (e.g., 91.0–56.5 mmHg), whereas method 2 provides estimations such as 70.0–43.5 mmHg and 67.3–41.3 mmHg, which are much closer to the reference. A similar trend is observed in neonate 2, where method 1 again shows systematic overestimation, while method 2 maintains better agreement with the monitor’s values. These results suggest that method 2 offers improved accuracy and lower deviation from clinical measurements, making it a more suitable approach for non-invasive neonatal BP estimation.
3.2. Statistical Analysis of Blood Pressure Measurements: Mean Error, RMSE, R2, and Pearson Correlation
The statistical evaluation reveals critical insights: Method 1 exhibits clinically unacceptable performance, with near-zero Pearson correlations (r = 0.00) and R2 values (0.00) for both systolic/diastolic measurements, confirming no linear relationship with reference values, compounded by severe mean errors (18.10–25.16 mmHg). In contrast, method 2 demonstrates strong correlations (systolic: r = 0.84–0.89, R2 = 0.71–0.79; diastolic: r = 0.81, R2 = 0.65–0.66), indicating robust linear associations with the reference monitor. Despite this, clinically relevant diastolic mean errors persist (3.36–5.14 mmHg), while systolic errors remain minimal (0.14–1.36 mmHg), highlighting the need for diastolic-specific calibration in method 2 despite its overall statistical validity. This result is shown in Table 3.

Table 3.
Blood pressure measurement method performance summary.
3.3. Correlation and Bland–Altman Agreement
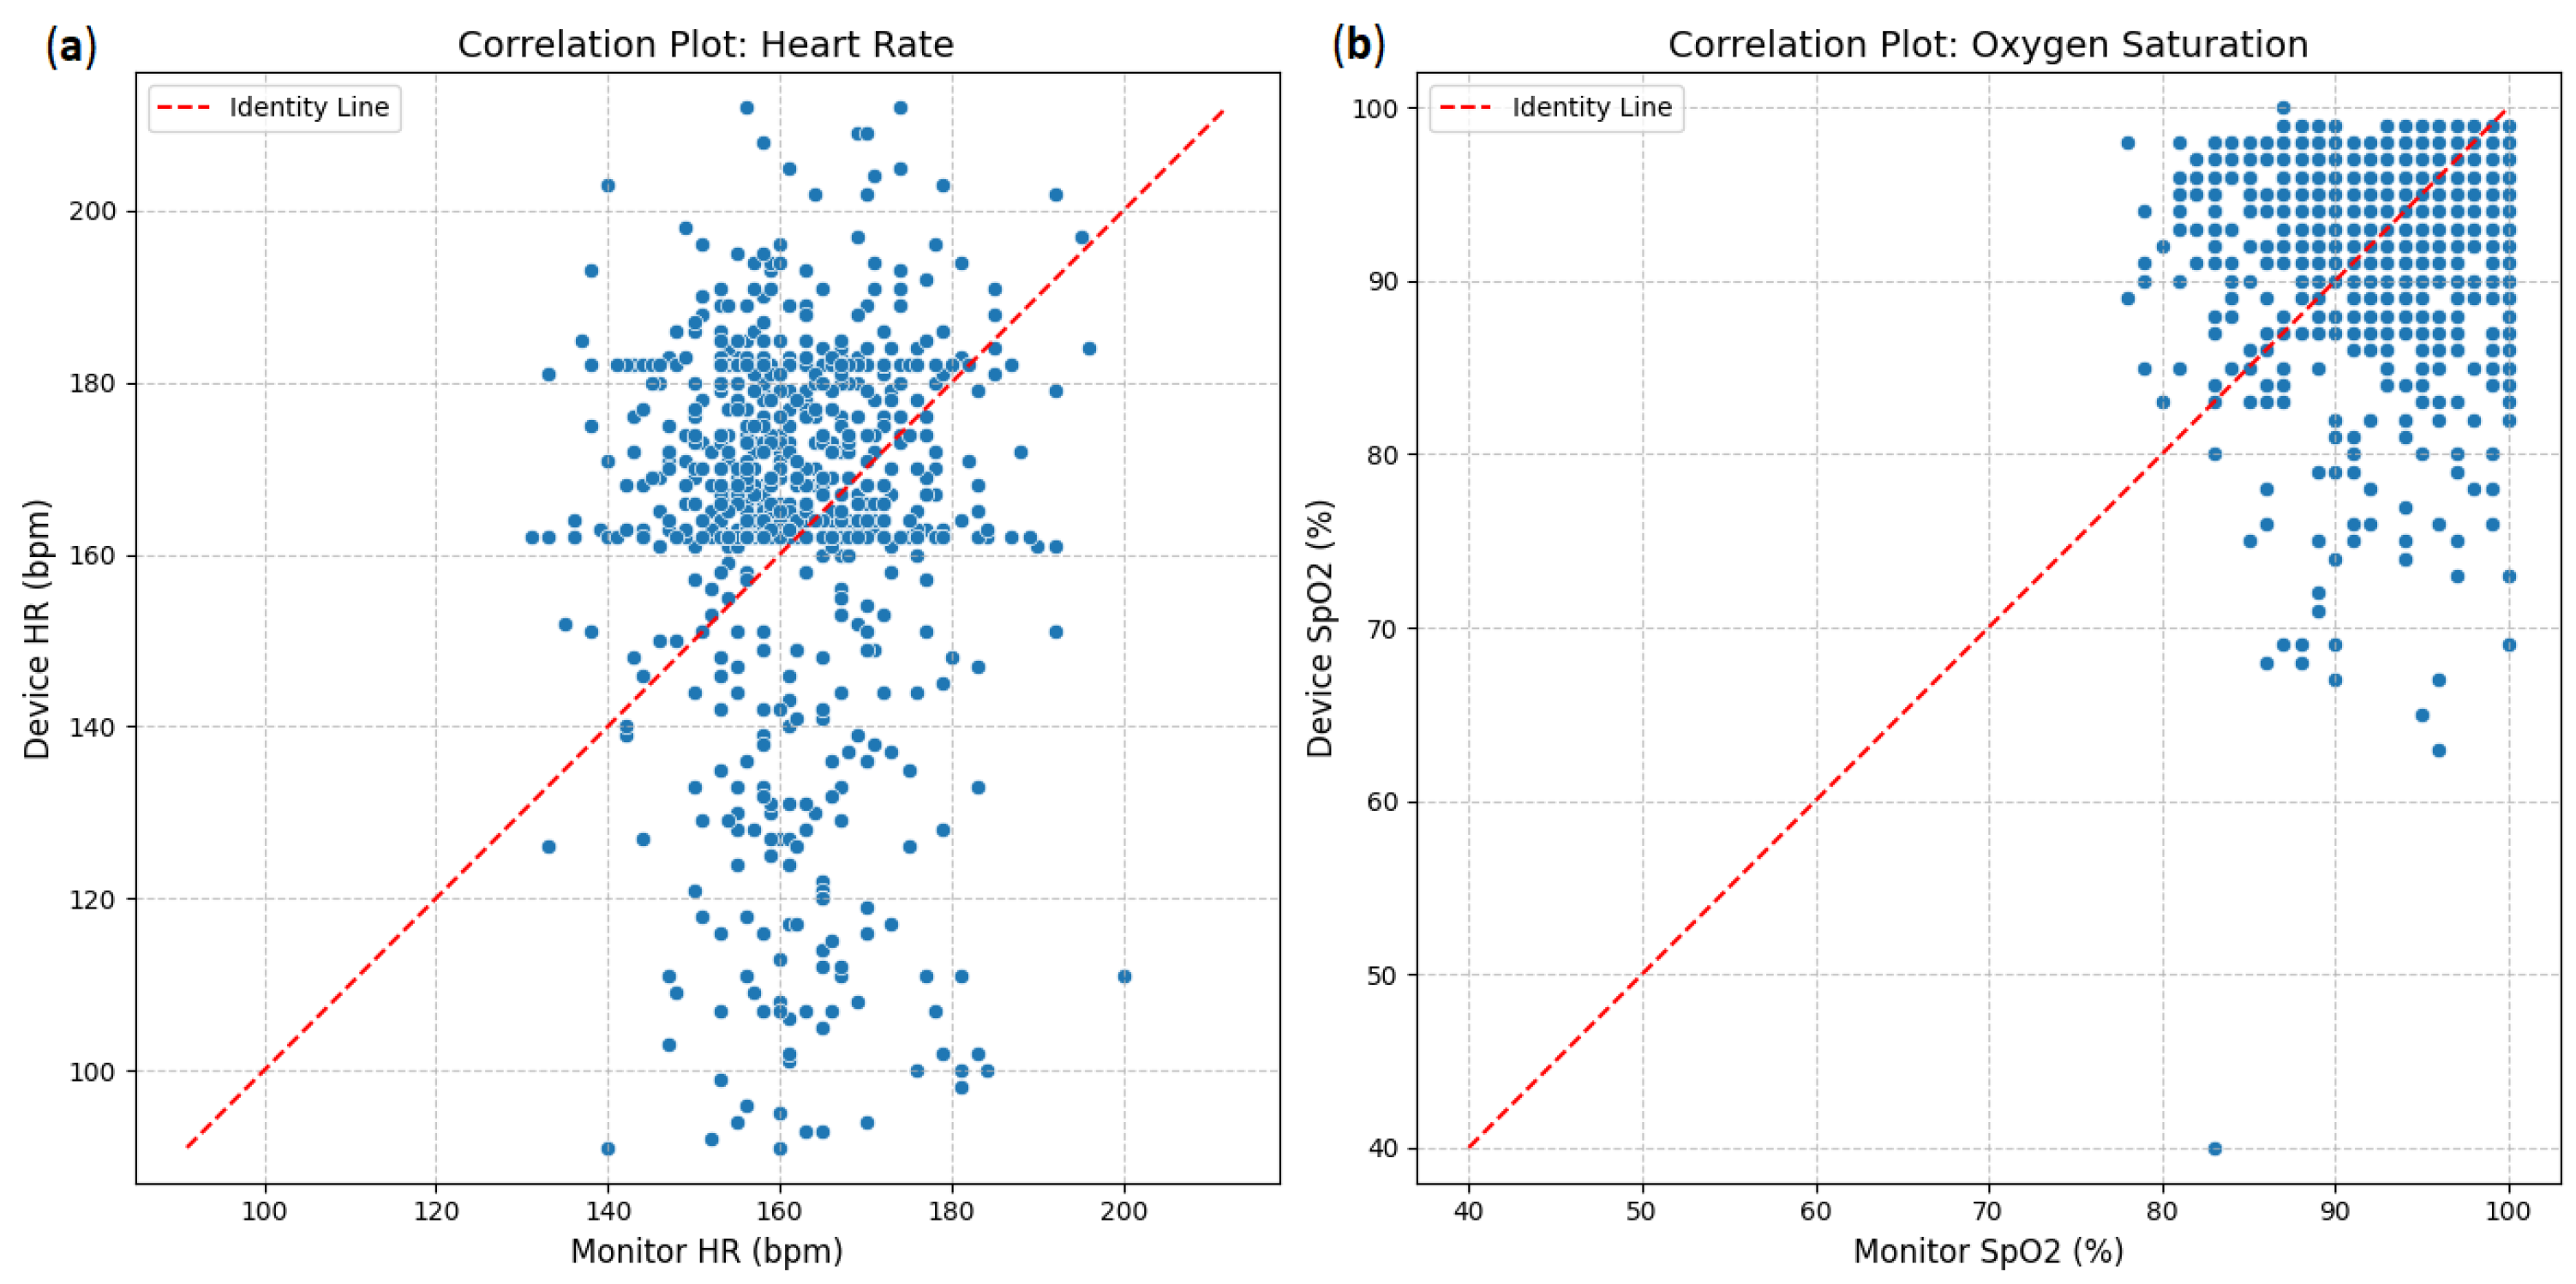
The agreement between the investigational device and the reference monitor was assessed using correlation plots (Figure 1). For heart rate (HR), the scatter plot (Figure 9a) shows a strong positive correlation between the device and monitor measurements. Most data points cluster closely around the red dashed line of identity (y = x), indicating that as heart rate measurements from the monitor increase, those from the device also tend to increase proportionally. Similarly, oxygen saturation (SpO2; Figure 9b)demonstrates a very strong positive correlation. The data points for SpO2 are tightly clustered around the identity line, especially at higher saturation levels, suggesting a high degree of concordance between the device and the monitor for this parameter.
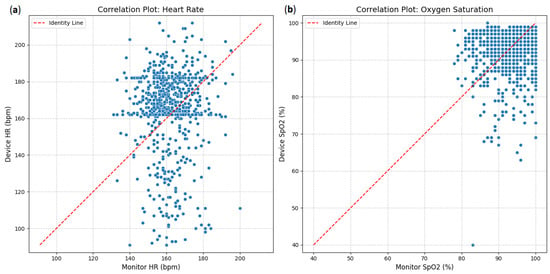
Figure 9.
Correlation plots: (a) heart rate between device and clinical monitor; (b) oxygen saturation between device and clinical monitor.
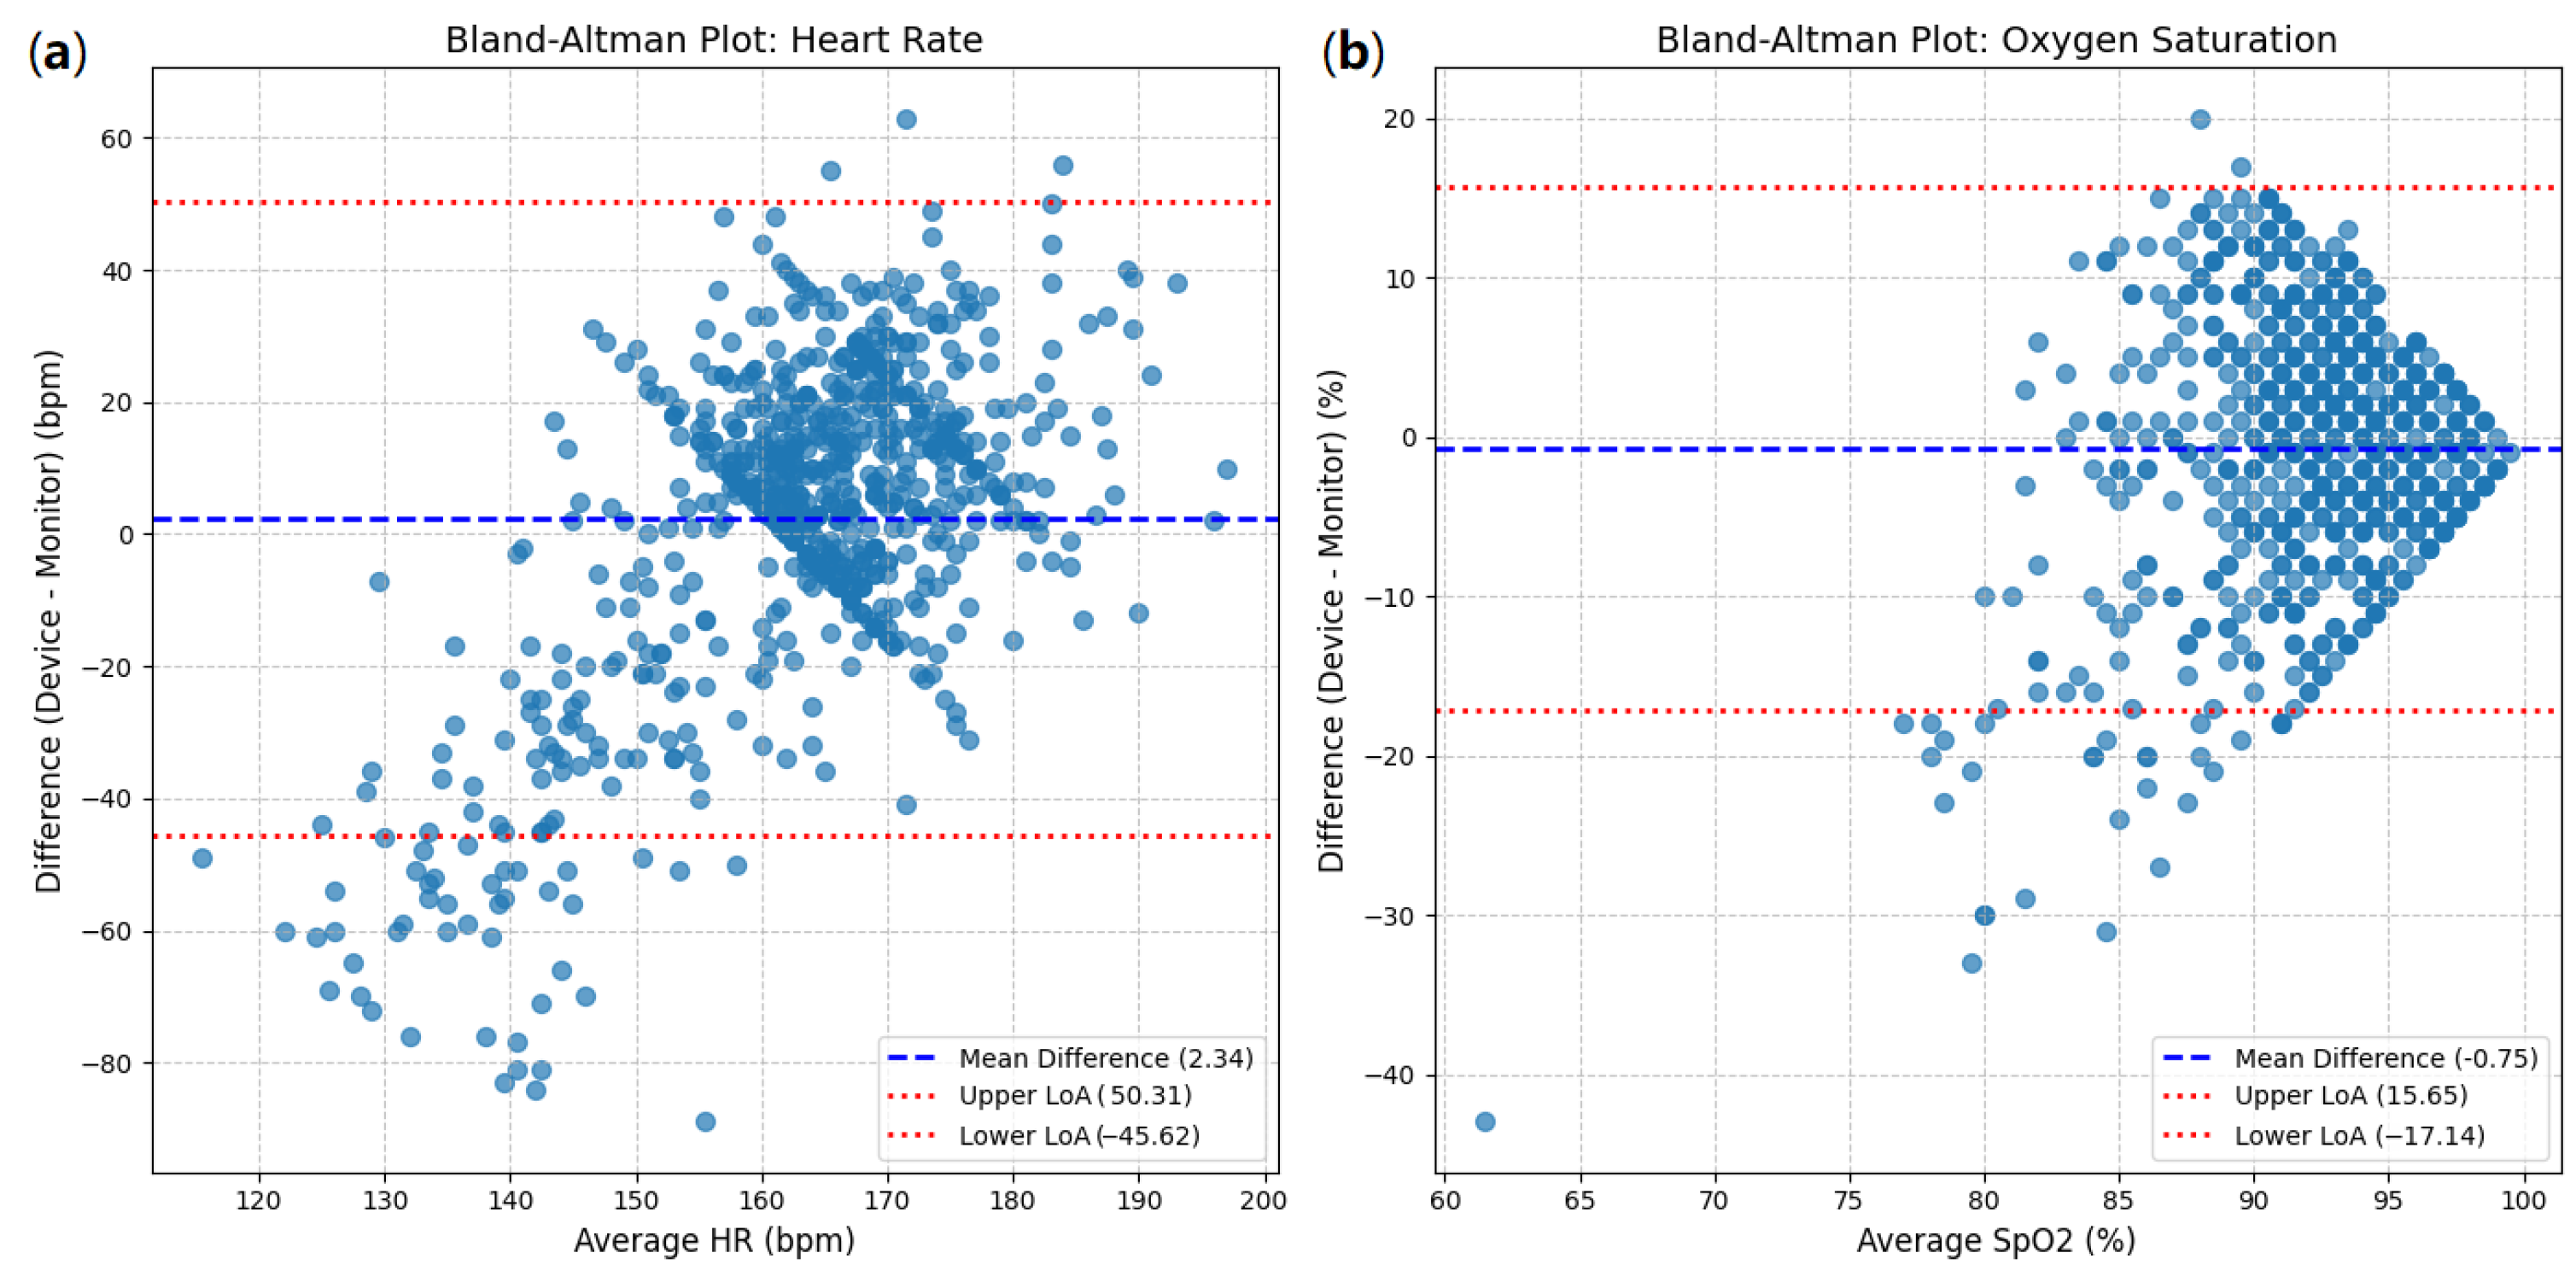
The Bland–Altman analysis for heart rate (HR) is presented in Figure 10a. The mean difference (bias) between the device and monitor measurements was 2.34 bpm (beats per minute). This indicates a slight tendency for the device to read an HR marginally higher than the reference monitor.
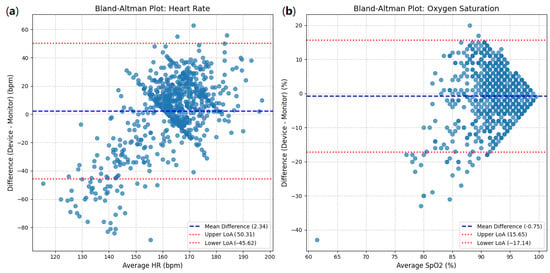
Figure 10.
Bland–Altman plots: (a) heart rate between device and clinical monitor; (b) oxygen saturation between device and clinical monitor.
The 95% limits of agreement (LoAs) were calculated as follows:
- Upper LoA: 50.31 bpm;
- Lower LoA: −45.62 bpm.
This implies that for 95% of the measurements, the difference between the device and the monitor is expected to fall between −45.62 bpm and 50.31 bpm. The width of these limits (50.31 − (−45.62) = 95.93 bpm) is notably large. The scatter of points in the plot demonstrates substantial variability in the differences, and while there is no clear proportional trend (the spread does not appear to widen or narrow significantly across different average HRs), the wide range of the LoAs is a significant finding.
For oxygen saturation (SpO2), the Bland–Altman plot (Figure 10b) shows a mean difference (bias) of −0.75%. This indicates a slight tendency for the device to read an SpO2 marginally lower than the reference monitor.
The 95% limits of agreement (LoAs) for SpO2 are as follows:
- Upper LoA: 15.65%;
- Lower LoA: −17.14%.
The width of these limits (15.65 − (−17.14) = 32.79%) is also quite substantial. Although most points cluster around the mean difference, especially in the higher saturation range (90–100%), there is a noticeable spread of differences, with some outliers demonstrating large discrepancies. The accumulation of points at the higher end of the SpO2 range might suggest a ’ceiling effect’, where differences are compressed as saturation approaches 100%, but the overall variability is significant.
3.4. Platform Selection
The selection of the platform is primarily based on its ability to facilitate effective signal post-processing, including the availability of a wide range of filters to reduce the noise that is characteristic of neonatal populations. Additionally, the platform should allow easy adjustment of parameters to accommodate the specific characteristics of each patient. To ensure scalability and cost efficiency, the prototype must incorporate commonly used processors. In this context, the three platforms mentioned fulfill these requirements. Specifically, the evaluation focuses on analyzing the output signal after filtering is implemented on each platform.
Based on the comparative analysis presented in Table 4, the Raspberry Pi 4 was identified as the most suitable platform for this study due to its compatibility with Python and its ability to handle the computational demands of the algorithm. The compatibility of each platform with the I2C protocol, essential for integrating the MAX30102 sensor, was a key consideration. The Raspberry Pi 4 demonstrated seamless compatibility with I2C, supported by robust libraries in Python. The ESP32 also supported I2C communication through MicroPython, though additional adaptation was required to optimize its use. In contrast, the ATmega2560 supported I2C communication but required more complex configurations, increasing the implementation effort. These differences further emphasized the suitability of the Raspberry Pi 4 for the proposed system.

Table 4.
Evaluation of platforms for PPG signal processing and IoT integration.
3.5. Clinical Relevance and Alert System
The system incorporates a clinical alert mechanism that aligns blood pressure (BP) outputs with predefined neonatal thresholds for hypotension and hypertension, based on gestational age and clinical guidelines. These thresholds are integrated into the telemonitoring device to trigger alerts when BP readings deviate from expected ranges. The alert system uses color-coded LEDs and an audible buzzer to notify caregivers in real time. For instance, sustained deviations in systolic or diastolic pressure beyond safe limits over multiple cycles prompt visual and acoustic warnings. Additionally, these events are logged and transmitted to healthcare providers through the telecare platform, enabling immediate medical follow-up. This functionality ensures that the estimated BP values are not only computational outputs but also actionable indicators for real-time clinical decision making. Table 5 summarizes the thresholds used by the telemonitoring device to trigger visual and acoustic alerts based on oxygen saturation and heart rate values.

Table 5.
Alert thresholds and corresponding LED indicators for physiological parameters.
It is important to clarify that, although the developed system is capable of generating real-time alerts based on predefined clinical thresholds, these alerts were not used for clinical decision making during the validation phase. Instead, neonatal monitoring and clinical responses were exclusively guided by the vital signs monitor in the neonatal care unit, under the supervision of healthcare personnel.
4. Discussion
Photoplethysmography (PPG)-based blood pressure (BP) estimation has garnered significant attention due to its potential for non-invasive, continuous monitoring. While studies focusing on neonatal populations are scarce, recent research in adult cohorts provides valuable insights that can inform neonatal applications.
A 2023 review by Chen. G et al. [28] critically examined the challenges associated with BP estimation via PPG pulse wave analysis. The authors highlighted issues such as data leakage and unrealistic constraints in prior studies, emphasizing the need for principled analyses to determine the predictive capability of PPG signals for BP estimation. Their findings suggest that PPG signals may have limited information content for accurate BP prediction, with a high multi-valued mapping factor of 33.2% and low mutual information of 9.8%. In contrast, a study by Mehta S, Kwatra N, Jain M, and McDuff D. introduced a novel algorithm for signal reconstruction using semi-classical signal analysis (SCSA) to enhance BP estimation accuracy from PPG signals. Their method achieved mean absolute errors of 5.37 mmHg for systolic BP and 2.96 mmHg for diastolic BP, meeting the standards set by the Advancement of Medical Instrumentation. This approach demonstrates the potential of advanced signal processing techniques for improving PPG-based BP estimation [26].
In the context of our study, these insights reinforce the importance of adopting rigorous methodologies when developing and validating BP estimation systems for neonates. While the physiological differences between neonates and adults require tailored approaches, ref. [29] findings underscore the need to carefully assess the information content of PPG signals in neonatal populations. Moreover, their work suggests that enhancing the robustness and interpretability of PPG-based systems will require advanced signal processing and principled analyses.
In contrast to the concerns raised by [29] our study directly addresses the issue of validation by comparing PPG-derived BP estimates with reference measurements obtained from a clinical-grade monitor in a neonatal intensive care unit. This ensures that our results are grounded in real-world clinical data, mitigating the risk of overfitting or data leakage. While challenges such as signal variability and neonatal-specific physiology remain, our approach demonstrates that PPG-based methods can be meaningfully applied in neonatal settings when robust validation frameworks are employed. These findings underscore the feasibility of integrating PPG-derived BP monitoring into telecare platforms for neonates, provided that rigorous methodological standards are upheld.
The BP values obtained using the proposed methodology underscore the need to combine PPG signal characteristics with those from other signals, as implemented in [15,25,26]. Although the application of the Windkessel model is well suited for a single PPG signal, it requires many assumptions to define its input from patient information, for example, the cardiac output magnitude, R, and C, are not always known.
Furthermore, performing an initial calibration by adjusting the Windkessel model parameters to match BP values with those from reference equipment validated the method’s capability to adequately track the variable of interest over a short period without significant variations. This calibration should be extended to longer monitoring periods to assess the identification of hypotension and hypertension cases based solely on ST and CCT magnitudes. Such an approach would help observe the impact of significant cardiovascular changes that neonates undergo during their first month of life.
One of the main limitations of this study is the small sample size, restricted to two neonates. Originally, a long-term data collection protocol was proposed, involving real-time extraction of vital sign data from clinical-grade monitors at two neonatal care units (SES and Clínica Ospedale). However, technical constraints prevented digital access to these monitors, as they lacked data export capabilities. As a workaround, synchronized photographs of the clinical monitors were taken simultaneously with recordings from the developed system. In practice, this solution proved difficult to maintain due to challenges in manually extracting numeric values from the images and aligning them precisely with the acquired signals. Ultimately, the study relied on a manual annotation protocol using readings from the clinical monitors and the developed prototype for two neonates. Despite the reduced dataset, this approach yielded sufficient correlation between the reference values and the system output, supporting the validity of the proposed method for proof-of-concept purposes. The validation process was directly supervised by the project’s neonatologist and physiotherapist, ensuring clinical accuracy and consistency. Future work will focus on expanding the dataset and integrating automated data synchronization pipelines in clinical environments. Beyond the operational difficulties associated with data acquisition, the limited number of subjects also has implications for the generalizability and robustness of the results. A small sample may not sufficiently capture inter-individual variability in cardiovascular dynamics or account for the presence of sensor-related noise, which can introduce calibration bias and affect the reproducibility of the model in more diverse clinical settings. Although the current results support the technical feasibility of the approach, further validation using a larger and more heterogeneous neonatal population will be essential to establish the method’s clinical applicability and external validity.
Although the proposed system yielded acceptable agreement with clinical monitor readings in two neonates, a formal evaluation against international standards, such as AAMI or BHS, was not conducted due to the limited sample size and lack of access to continuous reference data. Future studies will focus on collecting a larger dataset with synchronized reference measurements to enable standard-compliant validation. This validation will be important to carry out in future work in order to strengthen the clinical relevance and reliability of the proposed monitoring approach.
4.1. Integration of the Prototype in an Internet of Things (IoT) Environment
The proposed prototype was designed within a comprehensive IoT architecture, addressing the technical and clinical challenges of home-based monitoring for oxygen-dependent neonates. Multiple data transmission approaches were implemented and evaluated to ensure real-time physiological signal delivery while balancing network availability and energy efficiency.
Initially, LoRa communication was tested due to its low power consumption and long-range capabilities. However, extensive packet loss—particularly in dense urban environments—limited its use to experimental conditions. As a more reliable alternative, 4G LTE connectivity via commercial mobile networks (e.g., ClaroTM) was adopted, yielding improved coverage and transmission stability. Simultaneously, local data storage was enabled through 64 GB microSD cards, ensuring persistent storage during network outages.
The system performs real-time processing using a Raspberry Pi 4 (8 GB), which was selected after the Arduino Mega and ESP32 platforms proved inadequate for the signal processing and blood pressure estimation algorithms. Furthermore, a dedicated UPS system (3.7 V, 3500 mAh) was integrated to maintain operation during temporary power losses, supplementing the standard 5 V/2 A power supply.
The selection of the Raspberry Pi 4 as the computational platform highlights the trade-off between computational capacity and hardware simplicity in implementing neonatal monitoring systems [30,31,32]. Although more compact and energy-efficient options like the ESP32 and ATmega2560 were initially considered, their limitations in terms of computational power and compatibility with Python posed significant challenges. This finding suggests that future iterations of the system could benefit from advancements in microcontroller technology, bridging the gap between computational capacity and energy efficiency.
For interoperability, a custom information system was developed to receive data via both MQTT and RESTful APIs, using hexadecimal encoding to optimize transmission and conform to lightweight IoT protocols. The system currently supports 12 functional modules and includes a web-based dashboard for real-time visualization of alerts, signal trends, and patient management features [33].
This end-to-end IoT framework enables continuous data acquisition, redundant storage, remote access, and automated alerts in response to critical physiological changes—establishing a robust technological infrastructure for neonatal telemonitoring, as documented in detail in Appendix A.
4.2. Comparison with Existing PPG-Based BP Estimation Studies
To further contextualize the proposed method within the current state of research, Table 6 presents a comparative overview of selected studies on blood pressure estimation using PPG signals. The table highlights the population type, real-time feasibility, IoT integration, and calibration/validation strategies. Most existing works either target adult populations or are limited to offline analysis in clinical settings, without considering the constraints of real-world neonatal telemonitoring. In contrast, the present study uniquely combines a physiological model tailored for neonates with real-time signal processing and implementation on an IoT-enabled embedded platform.

Table 6.
Comparative overview of PPG-based BP estimation studies. ✓ Satisfied feature, × Unsatisfied feature.
The comparative analysis in Table 6 underscores the novelty of the present study in addressing a critical gap—developing a real-time, neonatal-specific BP estimation algorithm that operates on a constrained embedded platform within a telecare system. While prior studies offer important theoretical or clinical contributions, few have translated these approaches into practical IoT-ready solutions tailored for neonatal homecare environments.
Compared to previous studies such as those by Rao et al. [6] and Chen et al. [34], which focused either on clinical environments or offline machine learning models, our proposed approach addresses critical implementation gaps by enabling real-time blood pressure estimation on embedded IoT hardware under homecare conditions. Notably, while Rao et al. [6] demonstrated feasibility in NICU settings, their system was not integrated into a portable or autonomous telecare architecture. Similarly, Chen et al.’s model [34], although accurate for adult datasets, lacked adaptability to neonatal hemodynamics and required substantial computational resources. This work extends beyond existing frameworks by introducing a physiologically grounded model tailored to neonates and demonstrating its integration into a validated, low-cost telehealth ecosystem.
5. Conclusions
The estimation of BP values is integrated into the neonatal telecare platform through the Windkessel model, which adapts its parameter definition to the limited information provided by a single PPG signal. The implemented methodology for extracting the signal’s characteristics optimizes the calculation of other monitored variables in the telecare program, as ST is only identifiable when signal filtering and peak/minima localization are performed adequately, which is essential for HR and SpO2. These results represent a feasibility-level validation and highlight the potential of this approach for future clinical applications.
The main limitation of this study is the scarcity of neonatal PPG signals associated with BP values, as research using this technology primarily focuses on adults and complex methodologies not easily applicable in a home setting without professional intervention.
Although the model operates based on some acceptable assumptions, it presents a promising opportunity to investigate the use of a single PPG signal. Establishing a population-specific database of neonates in Manizales could enhance the coherence of the correlations and refine the algorithm further. This study bridges the gap in neonatal BP monitoring by integrating non-invasive PPG-based estimation into IoT devices, offering scalable solutions for telehealth.
It is important to highlight that neonatal monitoring involves unique challenges, particularly considering the delicate condition of newborns. For instance, preterm neonates often experience respiratory deficiencies, requiring supplemental oxygen until their lungs fully mature. Additionally, their smaller size compared to term neonates presents challenges in sensor placement, potentially affecting the accuracy and reliability of data acquisition. These factors highlight the need for further research to evaluate the performance of the proposed technology under such conditions. Ensuring its proper operation in scenarios involving preterm neonates is critical to its broader adoption in neonatal care.
This study directly addresses the lack of neonatal-specific models for blood pressure estimation using photoplethysmographic signals—a gap that remains despite the extensive use of such models in adult populations. By adapting the signal-processing pipeline and physiological modeling to reflect the unique hemodynamic characteristics of neonates, and by integrating the system into an IoT-enabled telecare framework, this work proposes a clinically relevant and technologically viable solution. To the best of our knowledge, this constitutes one of the first comprehensive implementations that validates a PPG-based BP estimation model in neonates under real-world domiciliary conditions.
Future research should also focus on long-term monitoring and the detection of cardiac events, which are critical for improving neonatal care. Additionally, implementing the Windkessel model for BP calculation from neonatal PPG signals requires further investigation into defining its input parameters, understanding how these parameters evolve during patient development, and determining the optimal frequency of calibration needed to ensure reliable BP estimation. Exploring these aspects will be essential for generating accurate alarms and maintaining performance within the normal range of this physiological variable.
The evaluation of three different hardware platforms underscores the importance of aligning algorithmic complexity with hardware capabilities. While the Raspberry Pi 4 proved suitable for the current implementation, further optimization of the algorithm could enable its integration into more resource-constrained platforms, such as the ESP32 or similar microcontrollers. Nonetheless, additional development and tests are needed to determine the appropriate performance.
In summary, this work presents a proof of concept for estimating blood pressure in neonates using photoplethysmography (PPG) and physiological modeling through an IoT-integrated telecare system. The results demonstrate technical feasibility and suggest potential clinical utility. However, it is important to emphasize that this is a feasibility-level study with a limited dataset, and further validation is required. Future work should involve larger and more diverse neonatal populations, as well as clinical trials to assess the reliability, generalizability, and clinical applicability of the proposed system in real-world scenarios.
Author Contributions
All authors contributed equally to this work. Contributions included conceptualization, methodology, data curation, formal analysis, writing—original draft preparation, and writing—review and editing. All authors have read and agreed to the published version of the manuscript.
Funding
This research was funded by MINCIENCIAS project No. 121984468173, “Teleasistencia para Monitoreo de Oxígeno Domiciliario en Neonatos”. Announcement: 844-2019 “Convocatoria pacto para la generación de nuevo conocimiento a través de proyectos de investigación”.
Institutional Review Board Statement
The study was conducted in accordance with the Declaration of Helsinki and approved by the Bioethics Committee of the Universidad Autónoma de Manizales (approval record No. 087 of 2019). The project was classified as involving more than minimal risk due to the inclusion of a vulnerable population, in accordance with Resolution 8430 of 1993 on research involving human subjects in Colombia.
Informed Consent Statement
Informed consent was obtained from parents and legal guardians during the first phase of the study to provide information regarding the administration of home oxygen therapy. In the third phase, informed assent was obtained to allow the monitoring of neonates through the teleassistance module.
Data Availability Statement
The original contributions presented in this study are included in the article. Further inquiries can be directed to the corresponding author.
Acknowledgments
The researchers would like to thank Universidad Nacional de Colombia sede Manizales, Universidad Autónoma de Manizales, S.E.S Hospital de Caldas, Clínica Ospedale, and the Ministerio de Ciencia, Tecnología e Innovación.
Conflicts of Interest
The authors declare no conflicts of interest.
Abbreviations
The following abbreviations are used in this manuscript:
| BP | Blood pressure |
| PPG | Photoplethysmography |
| SpO2 | Oxygen saturation |
| HR | Heart rate |
| NIBP | Non-invasive blood pressure |
| ST | Systolic time |
Appendix A. Technical Specifications of the Neonatal Monitoring Prototype
This appendix presents the detailed technical description of the prototype developed for continuous monitoring of neonates in home-based settings, as part of an IoT-enabled telehealth infrastructure.
Appendix A.1. System Overview
The monitoring prototype integrates physiological signal acquisition, edge computing, wireless communication, and secure data management. It was designed for deployment in domiciliary environments with limited infrastructure and intermittent connectivity.
Appendix A.2. Hardware Components
The core components of the system are listed in Table A1.

Table A1.
Main hardware components of the prototype.
Table A1.
Main hardware components of the prototype.
| Component | Specification |
|---|---|
| Sensor Module | MAX30102 (PPG, SpO2, HR) |
| Microcontroller Unit (MCU) | Raspberry Pi 4 (8 GB RAM) |
| Storage | 64 GB MicroSD |
| Communication | LoRa (experimental), 4G LTE (operational) |
| UPS | 3.7 V, 3500 mAh Lithium-ion battery |
| Power Input | 5 V/2 A regulated USB supply |
| Interface | I2C for sensor communication |
Appendix A.3. Physical Enclosure and Layout
The prototype includes a 3D-printed ABS housing designed to achieve the following:
- Prevent accidental disconnections.
- Secure the sensor in appropriate contact with neonatal skin.
- Allow adequate ventilation and cable routing.
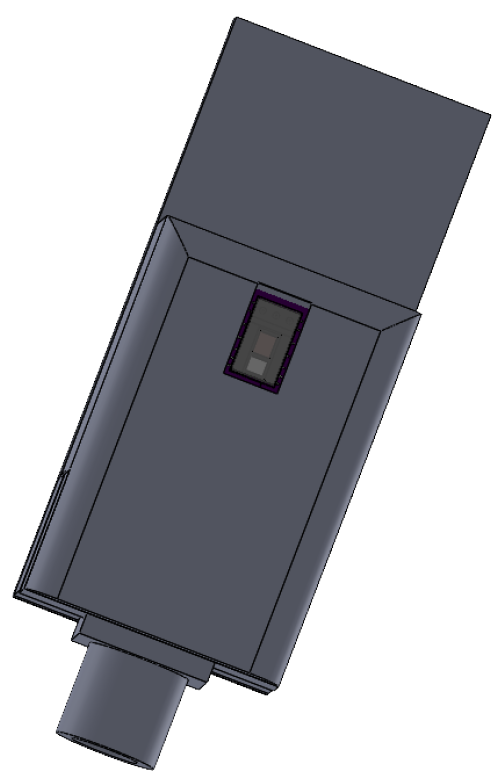
The sensor cable is routed through an insulated duct to avoid tension-related detachment. The power supply is isolated from the microcontroller to prevent voltage fluctuation during charging cycles. Figure A1, Figure A2, Figure A3 and Figure A4 show the enclosure for the components of the monitoring system.
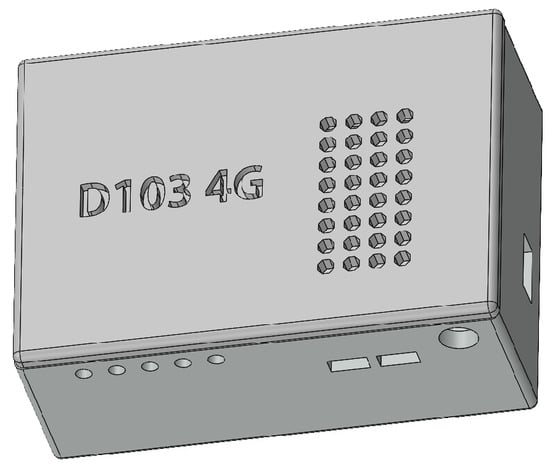
Figure A1.
Enclosure for base device.
Figure A1.
Enclosure for base device.
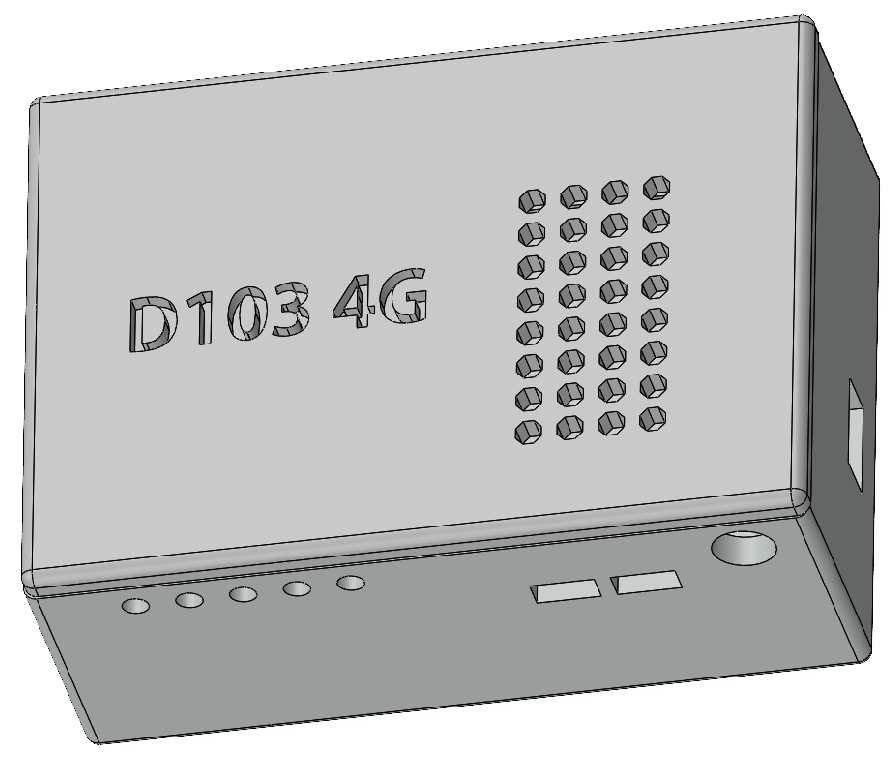
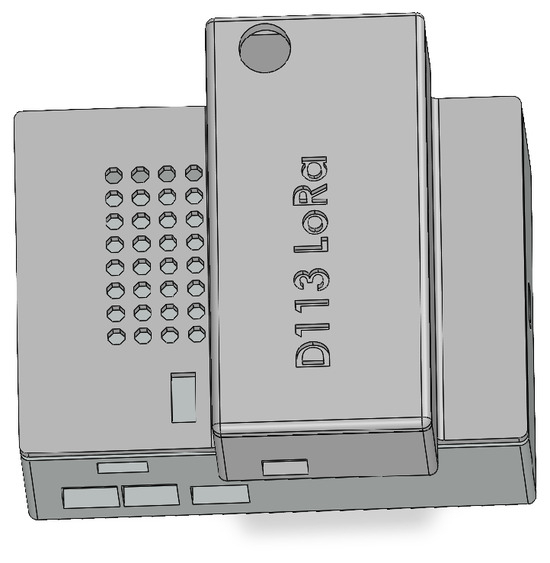
Figure A2.
Enclosure for device including LoRa communication.
Figure A2.
Enclosure for device including LoRa communication.
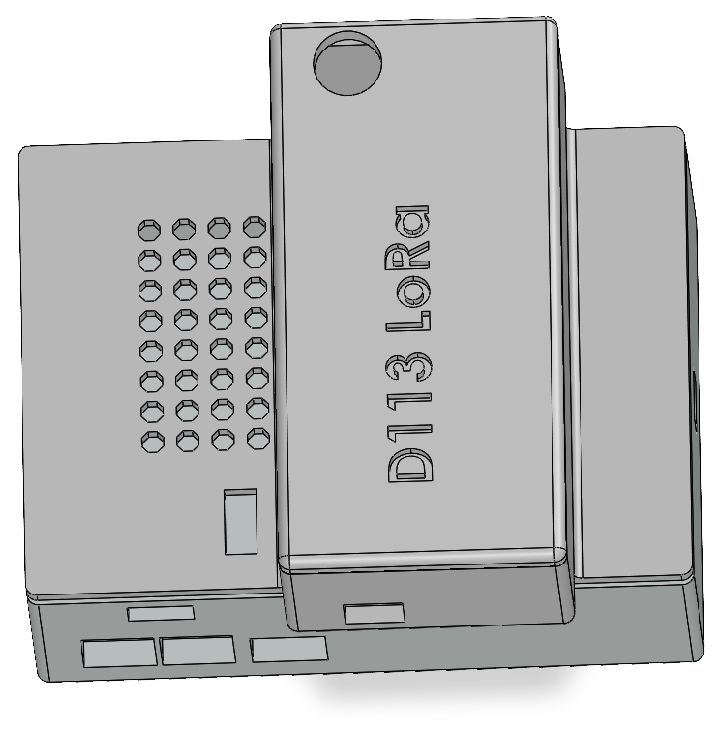
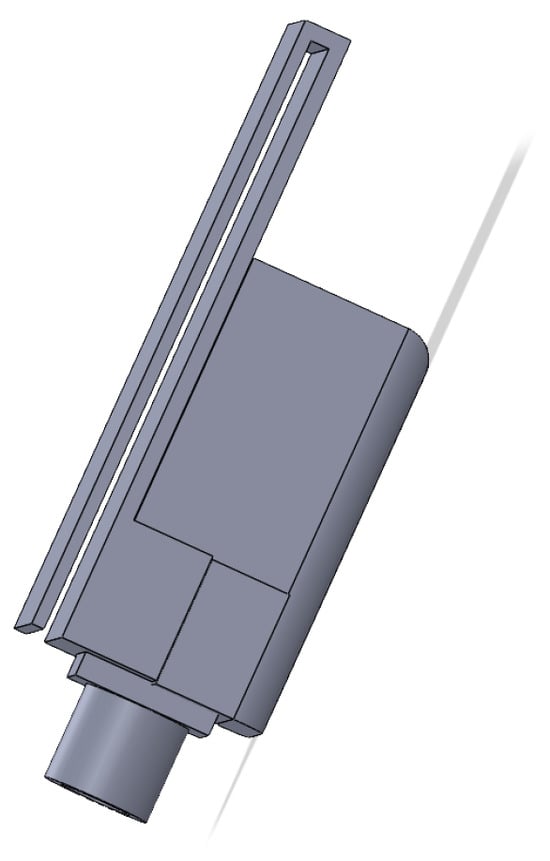
Figure A3.
Sensor case lateral view.
Figure A3.
Sensor case lateral view.
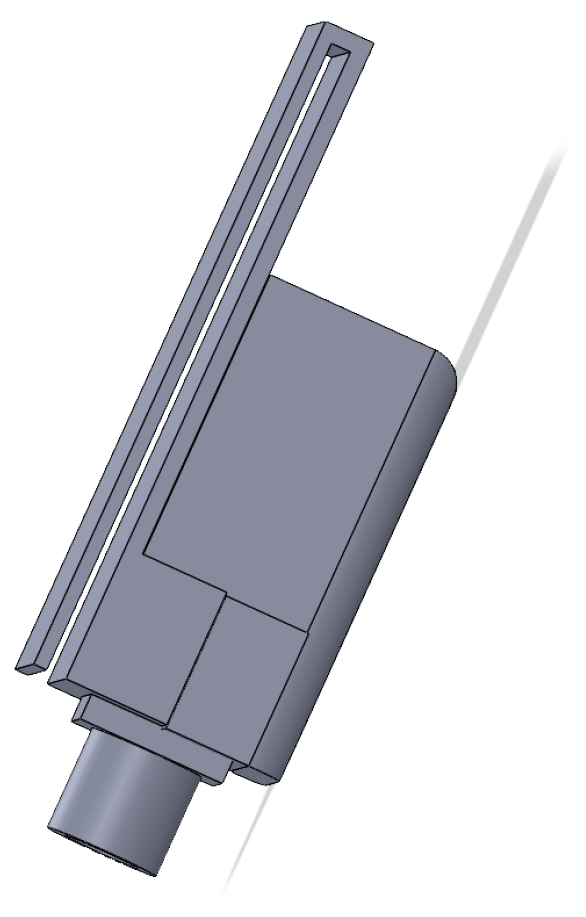
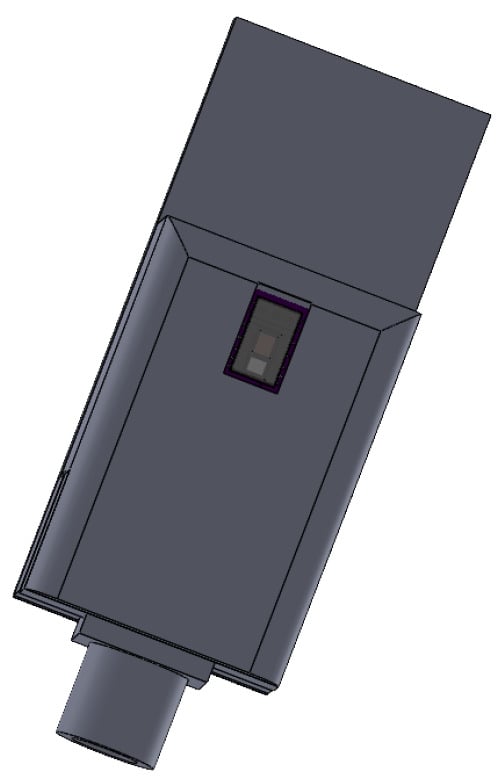
Figure A4.
Sensor case bottom view.
Figure A4.
Sensor case bottom view.
Appendix A.4. Energy Management and Autonomy
Power autonomy was a key constraint in the system design. Tests confirmed that the Raspberry Pi 4 operates reliably with a continuous 5 V/2 A power supply. Under typical operating conditions, the system consumes approximately 6.5 W, of which around 6.1 W corresponds to the Raspberry Pi itself. This translates to a current draw fluctuating between 1.1 A and 1.3 A.
Given the variability in usage scenarios and the need for uninterrupted operation during power outages, a backup power solution was required. To address this, an uninterruptible power supply (UPS) was implemented using a 3.7 V, 3500 mAh lithium battery. This configuration provides approximately 60 to 90 min of autonomous operation. The power flow is stabilized using a charge controller and a boost converter circuit.
Appendix A.5. Communication Strategies
Two communication modalities were tested:
- LoRa: Tested under urban conditions; high packet loss limited its usability to experimental logging.
- 4G LTE: Implemented via a USB modem and SIM-based data plan, enabling stable MQTT/REST transmission to a remote server.
Data is stored locally in the microSD card and transmitted when the network is available. Data is encoded in hexadecimal, minimizing payload size and allowing compatibility with low-bandwidth IoT protocols.
Appendix A.6. Information System Integration
Data transmission is integrated into a custom-developed information system, described in [33], featuring the following:
- A web-based dashboard with modular design (12 modules total).
- Real-time alert generation based on predefined thresholds.
- Storage in a structured clinical database.
- Dual ingestion via MQTT and RESTful APIs.
Appendix A.7. Scalability and Future Development
Initially, attempts were made to implement the system using Arduino Mega and ESP32. Limitations in available libraries and computational resources, particularly for signal filtering and model-based BP estimation, led to their exclusion. The Raspberry Pi 4 was identified as the minimal viable platform for real-time operation. Future iterations may explore porting the algorithm to more advanced microcontrollers (e.g., NVIDIA Jetson Nano) to balance performance and energy efficiency.
Appendix A.8. Electrical Schematics
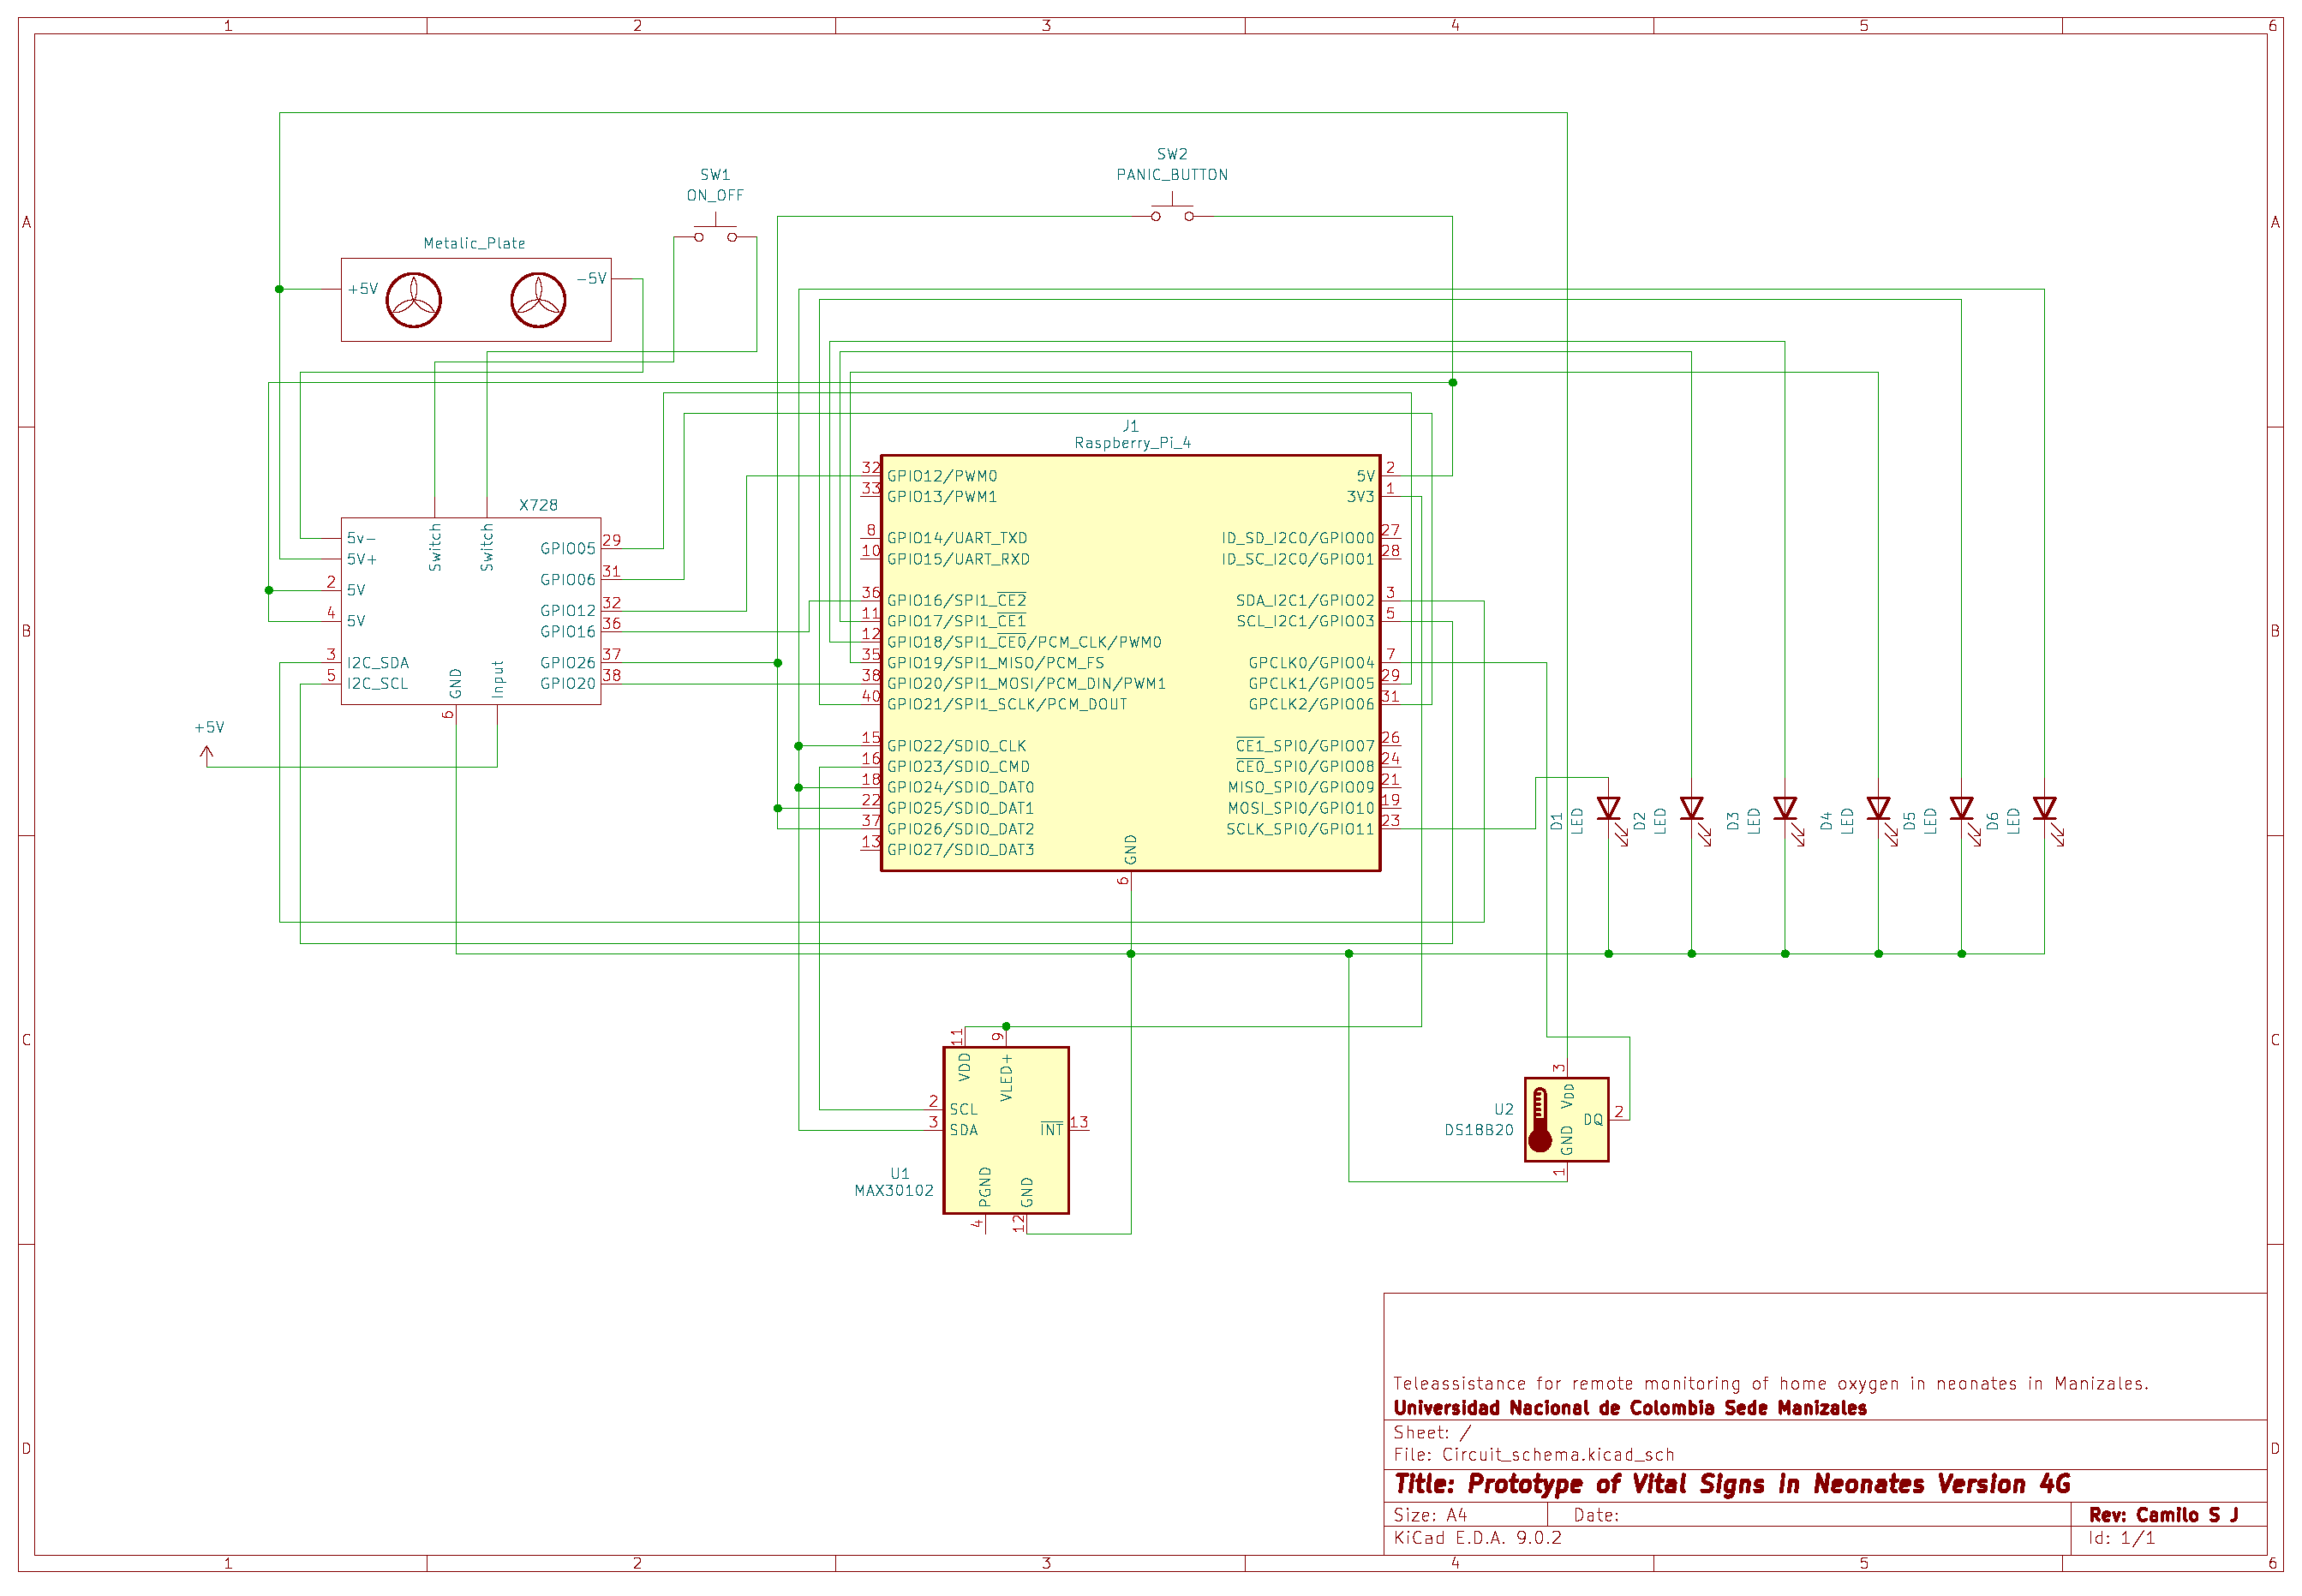
Figure A5 and Figure A6 present the two main circuit diagrams designed for different communication strategies. Figure A5 illustrates the LoRa-based prototype wiring, while Figure A6 corresponds to the current version using 4G LTE transmission.
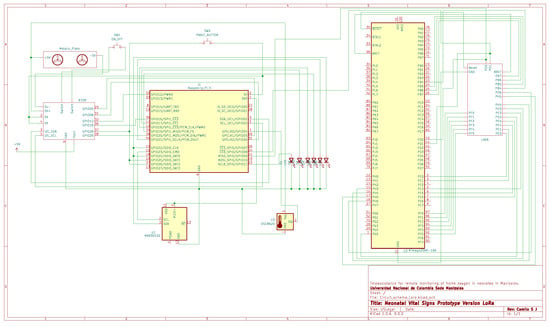
Figure A5.
Main electrical schematic of the LoRa-based prototype.
Figure A5.
Main electrical schematic of the LoRa-based prototype.
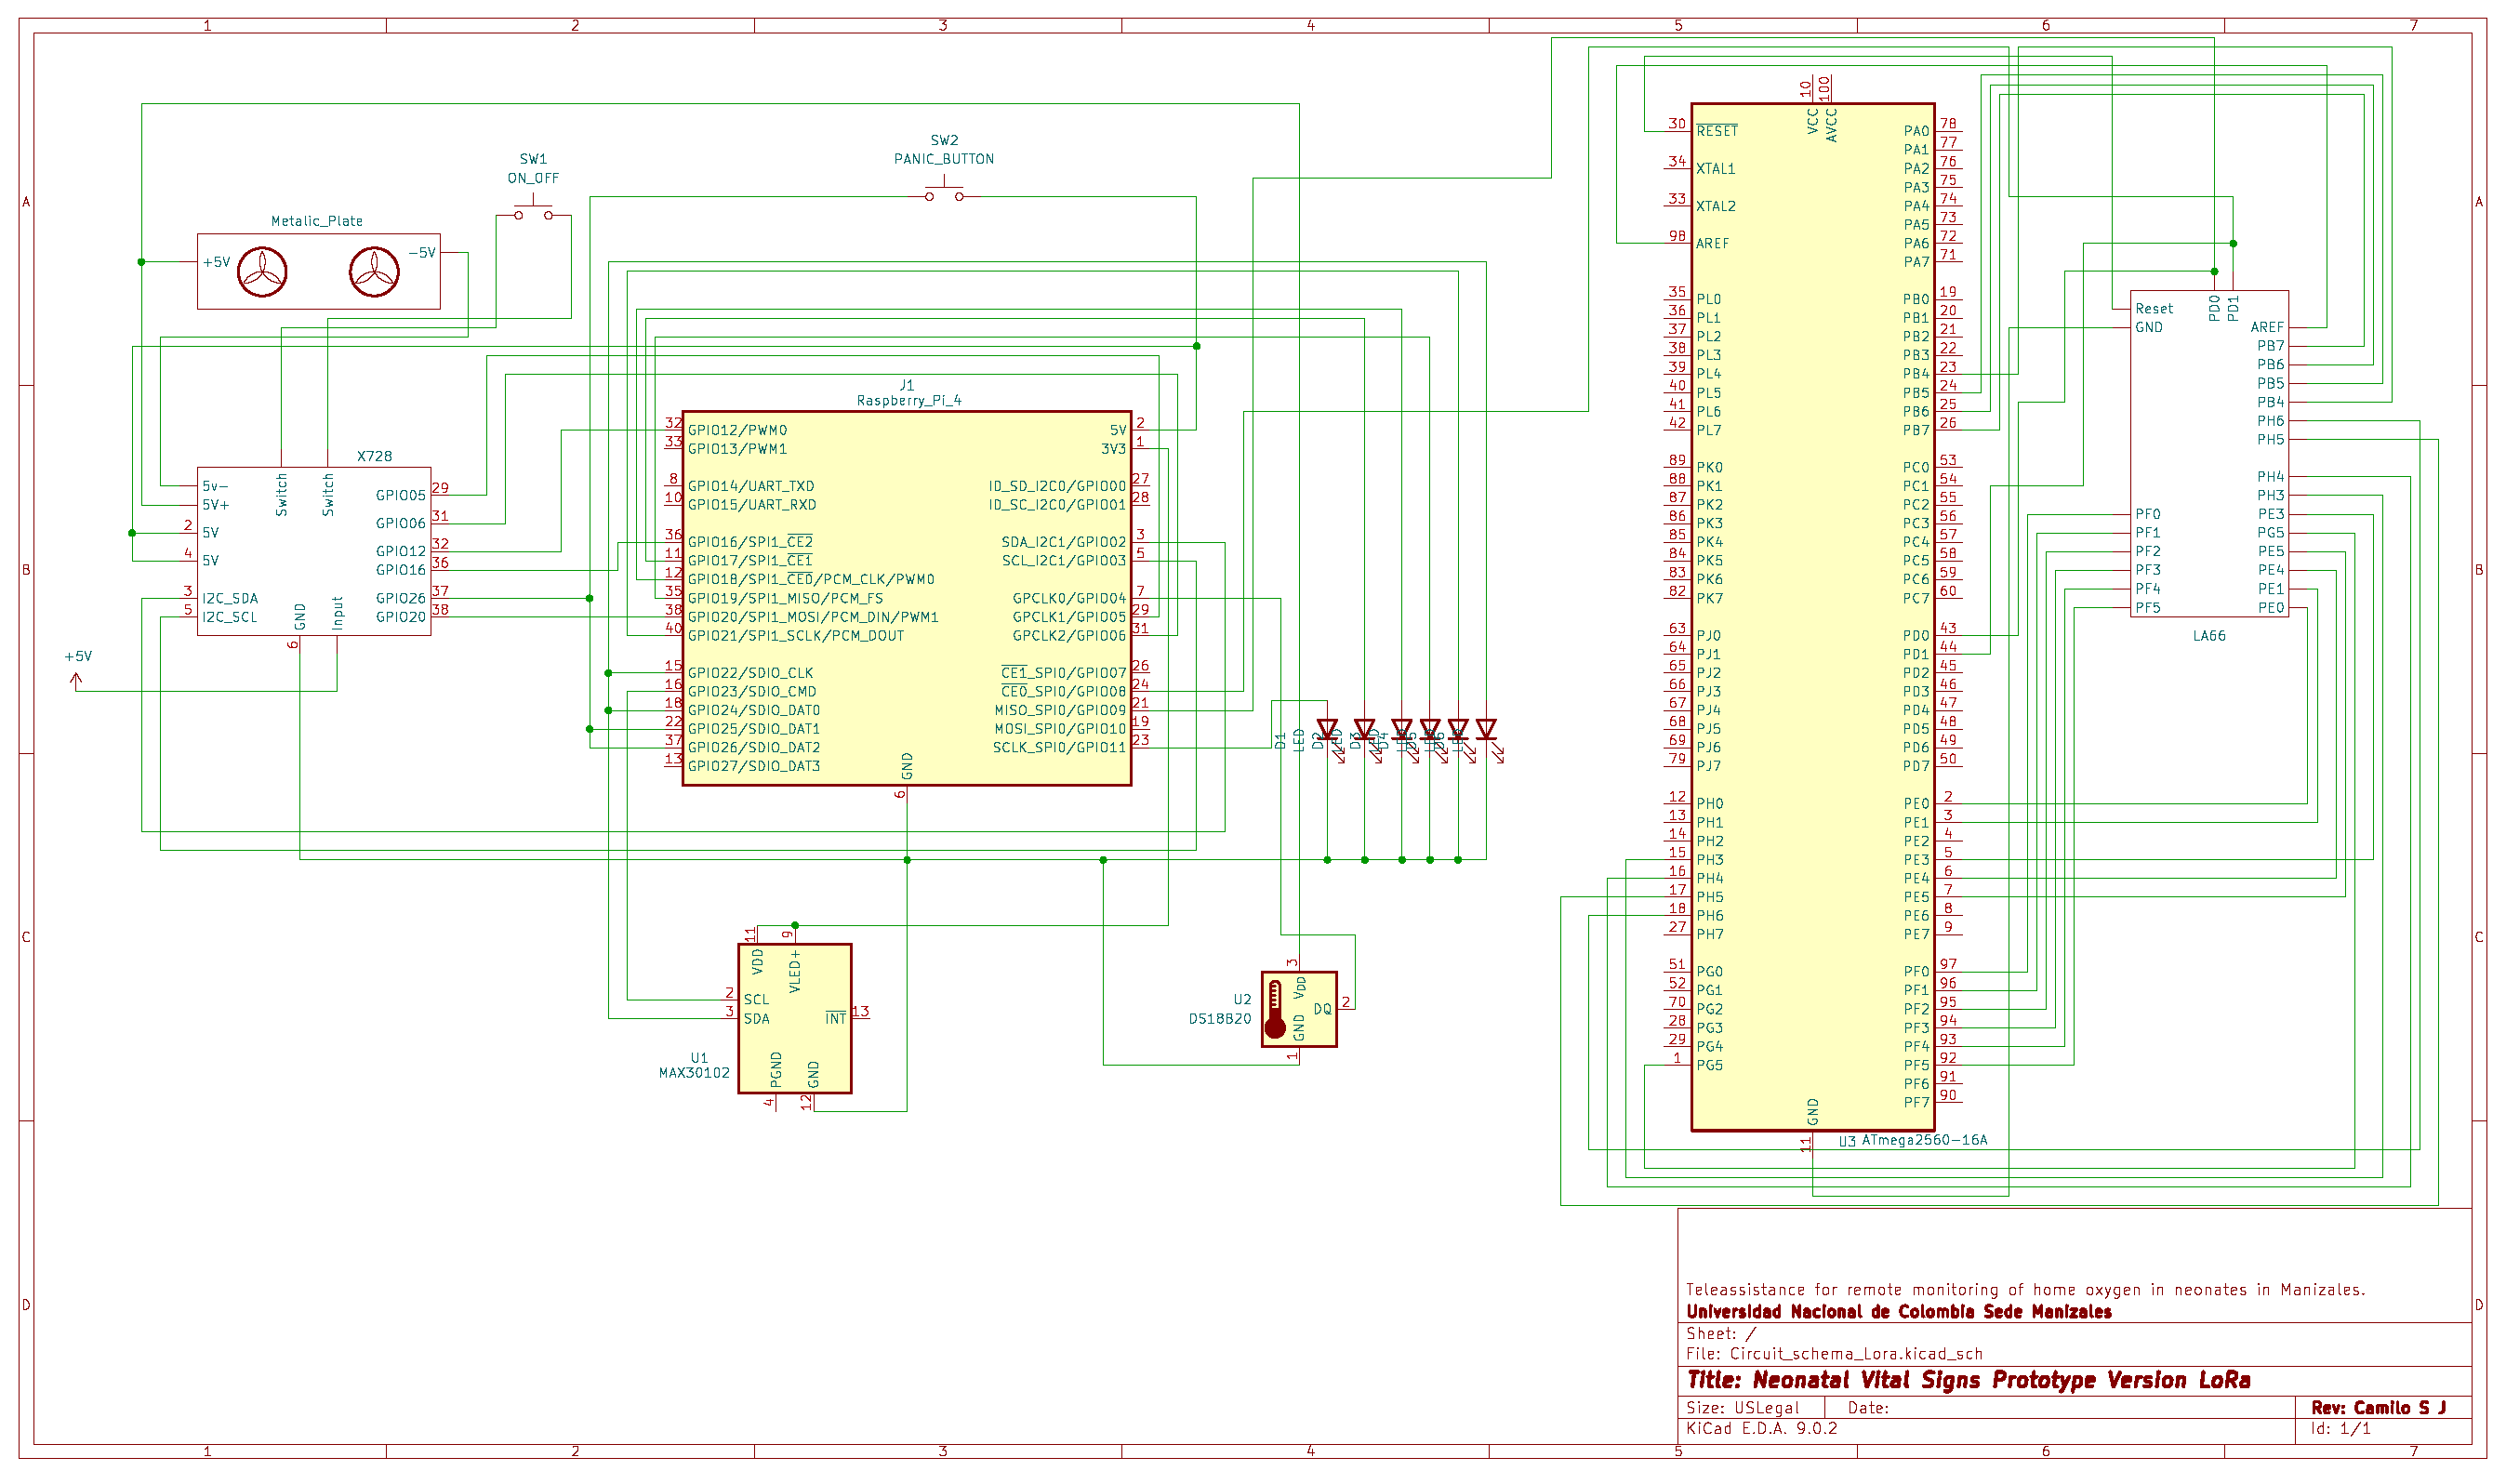
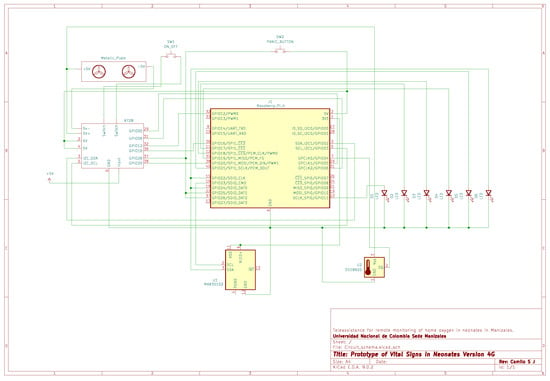
Figure A6.
Main electrical schematic of the 4G-based prototype.
Figure A6.
Main electrical schematic of the 4G-based prototype.
References
- Hayes, D.; Wilson, K.C.; Krivchenia, K.; Hawkins, S.M.M.; Balfour-Lynn, I.M.; Gozal, D.; Panitch, H.B.; Splaingard, M.L.; Rhein, L.M.; Kurland, G.; et al. Home oxygen therapy for children. An official American Thoracic Society clinical practice guideline. Am. J. Respir. Crit. Care Med. 2019, 199, e5–e23. [Google Scholar] [CrossRef] [PubMed]
- Sasangohar, F.; Davis, E.; A Kash, B.; Shah, S.R. Remote patient monitoring and telemedicine in neonatal and pediatric settings: Scoping literature review. J. Med. Internet Res. 2018, 20, e295. [Google Scholar] [CrossRef] [PubMed]
- Elgendi, M.; Fletcher, R.; Liang, Y.; Howard, N.; Lovell, N.H.; Abbott, D.; Lim, K.; Ward, R. The use of photoplethysmography for assessing hypertension. NPJ Digit. Med. 2019, 2, 60. [Google Scholar] [CrossRef] [PubMed]
- Allen, J.; Zheng, D.; Kyriacou, P.A.; Elgendi, M. Photoplethysmography (PPG): State-of-the-art methods and applications. Physiol. Meas. 2021, 42, 100301. [Google Scholar] [CrossRef] [PubMed]
- Baker, S.; Yogavijayan, T.; Kandasamy, Y. Towards Non-Invasive and Continuous Blood Pressure Monitoring in Neonatal Intensive Care Using Artificial Intelligence: A Narrative Review. Healthcare 2023, 11, 3107. [Google Scholar] [CrossRef] [PubMed]
- Rao, A.; Eskandar-Afshari, F.; Weiner, Y.; Billman, E.; McMillin, A.; Sella, N.; Roxlo, T.; Liu, J.; Leong, W.; Helfenbein, E.; et al. Clinical Study of Continuous Non-Invasive Blood Pressure Monitoring in Neonates. Sensors 2023, 23, 3690. [Google Scholar] [CrossRef] [PubMed]
- Krbec, B.A.; Zhang, X.; Chityat, I.; Brady-Mine, A.; Linton, E.; Copeland, D.; Anthony, B.W.; Edelman, E.R.; Davis, J.M. Emerging Innovations in Neonatal Monitoring: A Comprehensive Review of Progress and Potential for Non-Contact Technologies. Front. Pediatr. 2024, 12, 1442753. [Google Scholar] [CrossRef] [PubMed]
- Moreno, L.V.; Ruiz, M.L.M.; Hernández, J.M.; Duboy, M.Á.V.; Lindén, M. The role of smart homes in intelligent homecare and healthcare environments. In Ambient Assisted Living and Enhanced Living Environments; Dobre, C., Mavromoustakis, C., Garcia, N., Goleva, R., Mastorakis, G., Eds.; Elsevier: Amsterdam, The Netherlands, 2017; pp. 345–394. [Google Scholar]
- Cowan, D.; Rogers, J.; Najafi, L.; Panthi, F.; Wade, W.; Lievesley, R.; Adlam, T.; Long, D. Electronic Assistive Technology. In Clinical Engineering; Taktak, A., Ganney, P., Long, D., White, P., Eds.; Elsevier: Amsterdam, The Netherlands, 2014; pp. 359–388. [Google Scholar]
- Turner, K.J. The ecology of home sensor networks for telecare. In Ecological Design of Smart Home Networks; Saito, N., Menga, D., Eds.; Elsevier: Amsterdam, The Netherlands, 2015; pp. 51–66. [Google Scholar]
- Dempsey, E.M.; Barrington, K.J. Evaluation and Treatment of Hypotension in the Preterm Infant. Clin. Perinatol. 2009, 36, 75–85. [Google Scholar] [CrossRef] [PubMed]
- Madhavan, G. Plethysmography. Biomed. Instrum. Technol. 2005, 39, 367–371. Available online: https://meridian.allenpress.com/bit/article-pdf/39/5/367/1480135/0899-8205(2005)39%5B367_p%5D2_0_co_2.pdf (accessed on 2 May 2025). [CrossRef] [PubMed]
- Myint, C.Z.; Lim, K.H.; Wong, K.I.; Gopalai, A.A.; Oo, M.Z. Blood pressure measurement from photo-plethysmography to pulse transit time. In Proceedings of the 2014 IEEE Conference on Biomedical Engineering and Sciences (IECBES), Miri, Malaysia, 8–10 December 2014; pp. 496–501. [Google Scholar]
- Choudhury, A.D.; Banerjee, R.; Sinha, A.; Kundu, S. Estimating blood pressure using Windkessel model on Photoplethysmogram. In Proceedings of the Annual International Conference of the IEEE Engineering in Medicine and Biology Society, Chicago, IL, USA, 26–30 August 2014; pp. 4567–4570. [Google Scholar] [CrossRef]
- Banerjee, R.; Choudhury, A.D.; Sinha, A.; Visvanathan, A. HeartSense: Smart phones to estimate blood pressure from photoplethysmography. In Proceedings of the 12th ACM Conference on Embedded Network Sensor Systems, Memphis, TN, USA, 3–6 November 2014. [Google Scholar]
- Pereira, F.; Correia, R.; Pinho, P.; Lopes, S.I.; Carvalho, y.N.B. Challenges in Resource-Constrained IoT Devices: Energy and Communication as Critical Success Factors for Future IoT Deployment. Sensors 2020, 20, 6420. [Google Scholar] [CrossRef] [PubMed]
- Maxim Integrated. High-Sensitivity Pulse Oximeter and Heart-Rate Sensor for Wearable Health. Maximintegrated.com. 2018. Available online: https://datasheets.maximintegrated.com/en/ds/MAX30102.pdf (accessed on 29 November 2022).
- Qwiic_MAX3010x_Py: Python Module for the MAX3010x Particle Sensor. 2021. Available online: https://github.com/sparkfun/Qwiic_MAX3010x_Py (accessed on 29 November 2022).
- Reuter, S.; Moser, C.; Baack, M. Respiratory distress in the newborn. Pediatr. Rev. 2014, 35, 417–428, quiz 429. [Google Scholar] [CrossRef] [PubMed]
- Physical Exam of the Newborn. Nationwidechildrens.org. 2021. Available online: https://www.nationwidechildrens.org/conditions/health-library/physical-exam-of-the-newborn (accessed on 29 November 2022).
- Rodríguez, A. Análisis de la Función Hemodinámica del Recién Nacido. Ph.D. Thesis, Universidad Complutense de Madrid, Madrid, Spain, 2017. Available online: https://eprints.ucm.es/id/eprint/41370/1/T38445.pdf (accessed on 25 June 2025).
- Dilli, D.; Soylu, H.; Tekin, N. Neonatal Hemodynamics and Management of Hypotension in Newborns. Turk. Pediatri. Ars. 2018, 53 (Suppl. 1), S65–S75. [Google Scholar] [CrossRef] [PubMed]
- Giri, P.; Roth, P. Neonatal Hypertension. Stonybrookmedicine.edu. Available online: https://renaissance.stonybrookmedicine.edu/system/files/Neonatal%20hypertension.pdf (accessed on 29 November 2022).
- Stergiopulos, N.; Westerhof, B.E.; Westerhof, N. Total arterial inertance as the fourth element of the windkessel model. Am. J. Physiol. Heart Circ. Physiol. 1999, 276, H81–H88. [Google Scholar] [CrossRef] [PubMed]
- Huynh, T.H.; Jafari, R.; Chung, W.-Y. Noninvasive cuffless blood pressure estimation using pulse transit time and impedance plethysmography. IEEE Trans. Bio-Med. Eng. 2019, 66, 967–976. [Google Scholar] [CrossRef] [PubMed]
- Ding, X.-R.; Zhang, Y.-T.; Liu, J.; Dai, W.-X.; Tsang, H.K. Continuous cuffless blood pressure estimation using pulse transit time and photoplethysmogram intensity ratio. IEEE Trans. Bio-Med. Eng. 2016, 63, 964–972. [Google Scholar] [CrossRef] [PubMed]
- Hashmi, M.F.; Khalili, M.J.A. Left Ventricular Ejection Fraction. In StatPearls [Internet]; StatPearls Publishing: Treasure Island, FL, USA, 2024. Available online: https://www.ncbi.nlm.nih.gov/books/NBK459131/ (accessed on 24 June 2025).
- Chen, X.; Liu, M.; Zuo, L.; Wu, X.; Chen, M.; Li, X.; An, T.; Chen, L.; Xu, W.; Peng, S.; et al. Environmental noise exposure and health outcomes: An umbrella review of systematic reviews and meta-analysis. Eur. J. Public Health 2023, 33, 725–731. [Google Scholar] [CrossRef] [PubMed] [PubMed Central]
- Mehta, S.; Kwatra, N.; Jain, M.; McDuff, y.D. Examining the challenges of blood pressure estimation via photoplethysmogram. Sci. Rep. 2024, 14, 18318. [Google Scholar] [CrossRef] [PubMed]
- Shant, S.; Shreelekha, S.K.; Vennela, S.V.K.S.; Raj, T.; Dr, N.S. Intelligent Baby Monitoring System Using Raspberry Pi and Sensors. Int. J. Sci. Res. Eng. Trends 2024, 10, 3093–3099. [Google Scholar] [CrossRef]
- Rajagopal, S. Implementation of an Intelligent Neonatal Monitoring System using Rasperry PI. In Smart Green Connected Societies; SPAST Foundation: Hyderabad, India, 2021; Volume 1. [Google Scholar]
- Cheggou, R.; Mohand, S.S.H.; Annad, O.; Khoumeri, E.H. An intelligent baby monitoring system based on Raspberry Pi, IoT sensors, and convolutional neural network. In Proceedings of the 2020 IEEE 21st International Conference on Information Reuse and Integration for Data Science (IRI), Las Vegas, NV, USA, 11–13 August 2020; pp. 365–371. [Google Scholar] [CrossRef]
- Amaya-Carrascal, J.L.; Vera-Betancourt, C.A.; Marquez-Narvaez, C.; Murillo-Rendón, S.; Echeverri-Ocampo, I.; Henao-Díaz, D.; Segura-Giraldo, B.; Salgado-Jiménez, C. Development of an Information System for the Monitoring of Physiological Variables and Information Storage of Neonates on Domiciliary Oxygen. In Trends in Sustainable Smart Cities and Territories; Castillo Ossa, L.F., Isaza, G., Cardona, Ó., Castrillón, O.D., Corchado Rodriguez, J.M., De la Prieta Pintado, F., Eds.; Lecture Notes in Networks and Systems; Springer Nature: Cham, Switzerland, 2023; Volume 732, pp. 219–230. [Google Scholar] [CrossRef]
- Zhang, B.; Ren, J.; Cheng, Y.; Wang, B.; Wei, Z. Health Data Driven on Continuous Blood Pressure Prediction Based on Gradient Boosting Decision Tree Algorithm. IEEE Access 2019, 7, 32423–32433. [Google Scholar] [CrossRef]
- Wong, K.F.M.; Huang, W.; Ee, D.Y.H.; Ng, E.Y.K. Design and Validation of Dual-Point Time-Differentiated Photoplethysmogram (2PPG) Wearable for Cuffless Blood Pressure Estimation. Comput. Methods Programs Biomed. 2024, 253, 108251. [Google Scholar] [CrossRef] [PubMed]
Disclaimer/Publisher’s Note: The statements, opinions and data contained in all publications are solely those of the individual author(s) and contributor(s) and not of MDPI and/or the editor(s). MDPI and/or the editor(s) disclaim responsibility for any injury to people or property resulting from any ideas, methods, instructions or products referred to in the content. |
© 2025 by the authors. Licensee MDPI, Basel, Switzerland. This article is an open access article distributed under the terms and conditions of the Creative Commons Attribution (CC BY) license (https://creativecommons.org/licenses/by/4.0/).

