Article

Post Hoc Event-Related Potential Analysis of Kinesthetic Motor Imagery-Based Brain-Computer Interface Control of Anthropomorphic Robotic Arms

by
Miltiadis Spanos
1,
Theodora Gazea
2,3,
Vasileios Triantafyllidis
2,3,
Konstantinos Mitsopoulos
3,
Aristidis Vrahatis
1,4,
Maria Hadjinicolaou
1,
Panagiotis D. Bamidis
3 and
Alkinoos Athanasiou
1,2,3,*
1
Bioinformatics & Neuroinformatics, School of Science & Technology, Hellenic Open University, 26331 Patras, Greece
2
Center for Neurosciences & Biomedical Technology (CENEBIT), 54645 Thessaloniki, Greece
3
Medical Physics & Digital Innovation Laboratory, School of Medicine, Faculty of Health Sciences, Aristotle University of Thessaloniki (AUTH), 54124 Thessaloniki, Greece
4
Bioinformatics and Human Electrophysiology Laboratory, Department of Informatics, Ionian University, 49100 Corfu, Greece
*
Author to whom correspondence should be addressed.
Electronics 2025, 14(15), 3106; https://doi.org/10.3390/electronics14153106
Submission received: 13 June 2025 / Revised: 26 July 2025 / Accepted: 27 July 2025 / Published: 4 August 2025
(This article belongs to the Special Issue EEG Analysis and Brain–Computer Interface (BCI) Technology)

Abstract

Kinesthetic motor imagery (KMI), the mental rehearsal of a motor task without its actual performance, constitutes one of the most common techniques used for brain–computer interface (BCI) control for movement-related tasks. The effect of neural injury on motor cortical activity during execution and imagery remains under investigation in terms of activations, processing of motor onset, and BCI control. The current work aims to conduct a post hoc investigation of the event-related potential (ERP)-based processing of KMI during BCI control of anthropomorphic robotic arms by spinal cord injury (SCI) patients and healthy control participants in a completed clinical trial. For this purpose, we analyzed 14-channel electroencephalography (EEG) data from 10 patients with cervical SCI and 8 healthy individuals, recorded through Emotiv EPOC BCI, as the participants attempted to move anthropomorphic robotic arms using KMI. EEG data were pre-processed by band-pass filtering (8–30 Hz) and independent component analysis (ICA). ERPs were calculated at the sensor space, and analysis of variance (ANOVA) was used to determine potential differences between groups. Our results showed no statistically significant differences between SCI patients and healthy control groups regarding mean amplitude and latency (p < 0.05) across the recorded channels at various time points during stimulus presentation. Notably, no significant differences were observed in ERP components, except for the P200 component at the T8 channel. These findings suggest that brain circuits associated with motor planning and sensorimotor processes are not disrupted due to anatomical damage following SCI. The temporal dynamics of motor-related areas—particularly in channels like F3, FC5, and F7—indicate that essential motor imagery (MI) circuits remain functional. Limitations include the relatively small sample size that may hamper the generalization of our findings, the sensor-space analysis that restricts anatomical specificity and neurophysiological interpretations, and the use of a low-density EEG headset, lacking coverage over key motor regions. Non-invasive EEG-based BCI systems for motor rehabilitation in SCI patients could effectively leverage intact neural circuits to promote neuroplasticity and facilitate motor recovery. Future work should include validation against larger, longitudinal, high-density, source-space EEG datasets.

1. Introduction

Kinesthetic motor imagery (KMI), mentally rehearsing a motor task without its actual physical execution, is a commonly employed technique for BCI control in movement-related tasks [1]. Spinal cord injury (SCI) disrupts corticospinal integrity, necessitating better understanding of the temporal dynamics of motor cortical responses for use in BCIs [2]. Event-related potentials (ERPs), which are time-locked neural responses to specific stimuli or tasks, have emerged as a key method for examining the cortical temporal dynamics of motor control and consequently, as control features for BCI use. ERPs such as the P100, N200, and P300 provide valuable insights into sensory processing, motor planning, and execution, making them essential tools for studying the disruptions caused by SCI and evaluating recovery-oriented interventions. In healthy individuals, motor imagery (MI) elicits robust ERPs indicative of cortical motor planning and sensorimotor integration. The N100 component is associated with sensory attention and reflects pre-attentive processes, correlating with arousal induced by specific stimuli [3]. The P300 component, on the other hand, is linked to decision making during MI tasks [4]. However, in SCI patients, ERP amplitudes and latencies are often altered, reflecting cortical network reorganization possibly more significantly associated with the lack of sensory feedback than with the motor output, an effect demonstrated in animal models [5] and studied in motor neuron-driven complete paralysis [6].
The role of ERPs in SCI and MI remains somewhat elusive [7], with studies reporting variable and sometimes, seemingly contradictory, findings in terms of both amplitude and latency changes across ERP components. While some studies show attenuated P100 amplitudes following SCI [8], other research findings suggest that the nature or the level of deafferentation may play an important role, showing no statistically significant changes in P100 among amputee patients compared to controls [9]. Classic research on ERPs after SCI [10,11] identified that processing alterations in SCI patients demonstrated abnormalities during the early sensory stages of stimulus processing [10] and during complex cognitive function and stimulus evaluation [11]. Early sensory stage alterations were reflected by both reduced and delayed N100 and P200 components [10]. Studies including more cognitive stages, such as stimulus discrimination and evaluation, report attenuated and delayed N200 [12] in chronic SCI. Indeed, delayed or reduced early ERP components are also observable after brain injury and spatial neglect, demonstrating the importance of the sensory input pathway [13]. For late stimulus evaluation, specifically for the tactile P300 component, Cohen et al. stated that SCI patients exhibit reduced amplitudes but no significant differences in latency [11]. Lazzaro et al. corroborated these findings, noting diminished auditory P300 amplitudes in SCI patients [14], but also observed reduced latency in P200 components in contrast with the results of previous studies [10,12].
Despite significant interest in EEG-based BCIs for SCI, the literature reveals persistent inconsistencies regarding the reliability of ERP components in this population. These discrepancies stem from methodological heterogeneity, including variations in preprocessing techniques, task paradigms, and injury characteristics. Moreover, while several studies have explored ERP responses in SCI or applied BCIs in related contexts, few have attempted to systematically assess which ERP features remain robust across SCI patients and healthy controls. Despite promising advances, little systematic effort has been made to categorize and validate ERP signatures specifically for BCI use in SCI patients [15,16,17] or to clarify how these findings inform BCI design. This study aims to address this gap by applying an EEG preprocessing and analysis pipeline to ERP data collected during motor imagery tasks in SCI patients and controls. Through this method, we seek to evaluate the consistency, discriminability, and practical viability of ERP features as control signals for BCI applications tailored to rehabilitation.
The primary goal of this study was to conduct a post hoc analysis of the temporal dynamics and characteristics of the P100, N200, and P300 ERP components evoked during an MI–BCI experiment from a clinical trial evaluating the control of bimanual robotic arms by SCI patients and healthy control participants. We implemented a novel methodological pipeline to improve signal quality and component separation. In our data, this approach yielded consistent component identification. By doing so, we aim to uncover whether and how hand and arm action-related motor cortical responses are altered in SCI patients when compared to the results for healthy individuals. These findings provide critical insights into the preservation mechanisms of cortical evoked responses due to motor impairment, which would be used to inform and further the design of tailored BCI systems for robotic arm control, assistive applications, and possibly neural rehabilitation, based on ERP switches. The remainder of this manuscript is structured as follows: In the Materials and Methods section, we first provide the study design and the source of the data and briefly mention the experimental procedures followed during the collection of the data, while providing a resource for their more detailed overview. We then elaborately present signal-preprocessing steps and our ERP analysis. In the Section 3, we first collectively present the EEG wavelength amplitudes and comparisons before focusing on ERP component comparisons, amplitudes, and latencies. In the Section 4, we first comment on the key findings of our study and then provide the neurophysiological context for their exploitation in BCI research. We then discuss the limitations of our approach and future steps for our research. Finally, in the Section 5 we summarize our most important findings, key contributions, and limitations of our manuscript.

2. Materials and Methods

2.1. Study Design and Data

The current study was produced in the context of the development of a BCI module for the HEROES project (https://heroes.med.auth.gr/ (accessed on 26 July 2025)) (NCT06160453) [18], using EEG data previously collected and published through the concluded CSI:Brainwave project (https://medphys.med.auth.gr/project/csi-brainwave accessed on 26 July 2025) (NCT02443558) [19].

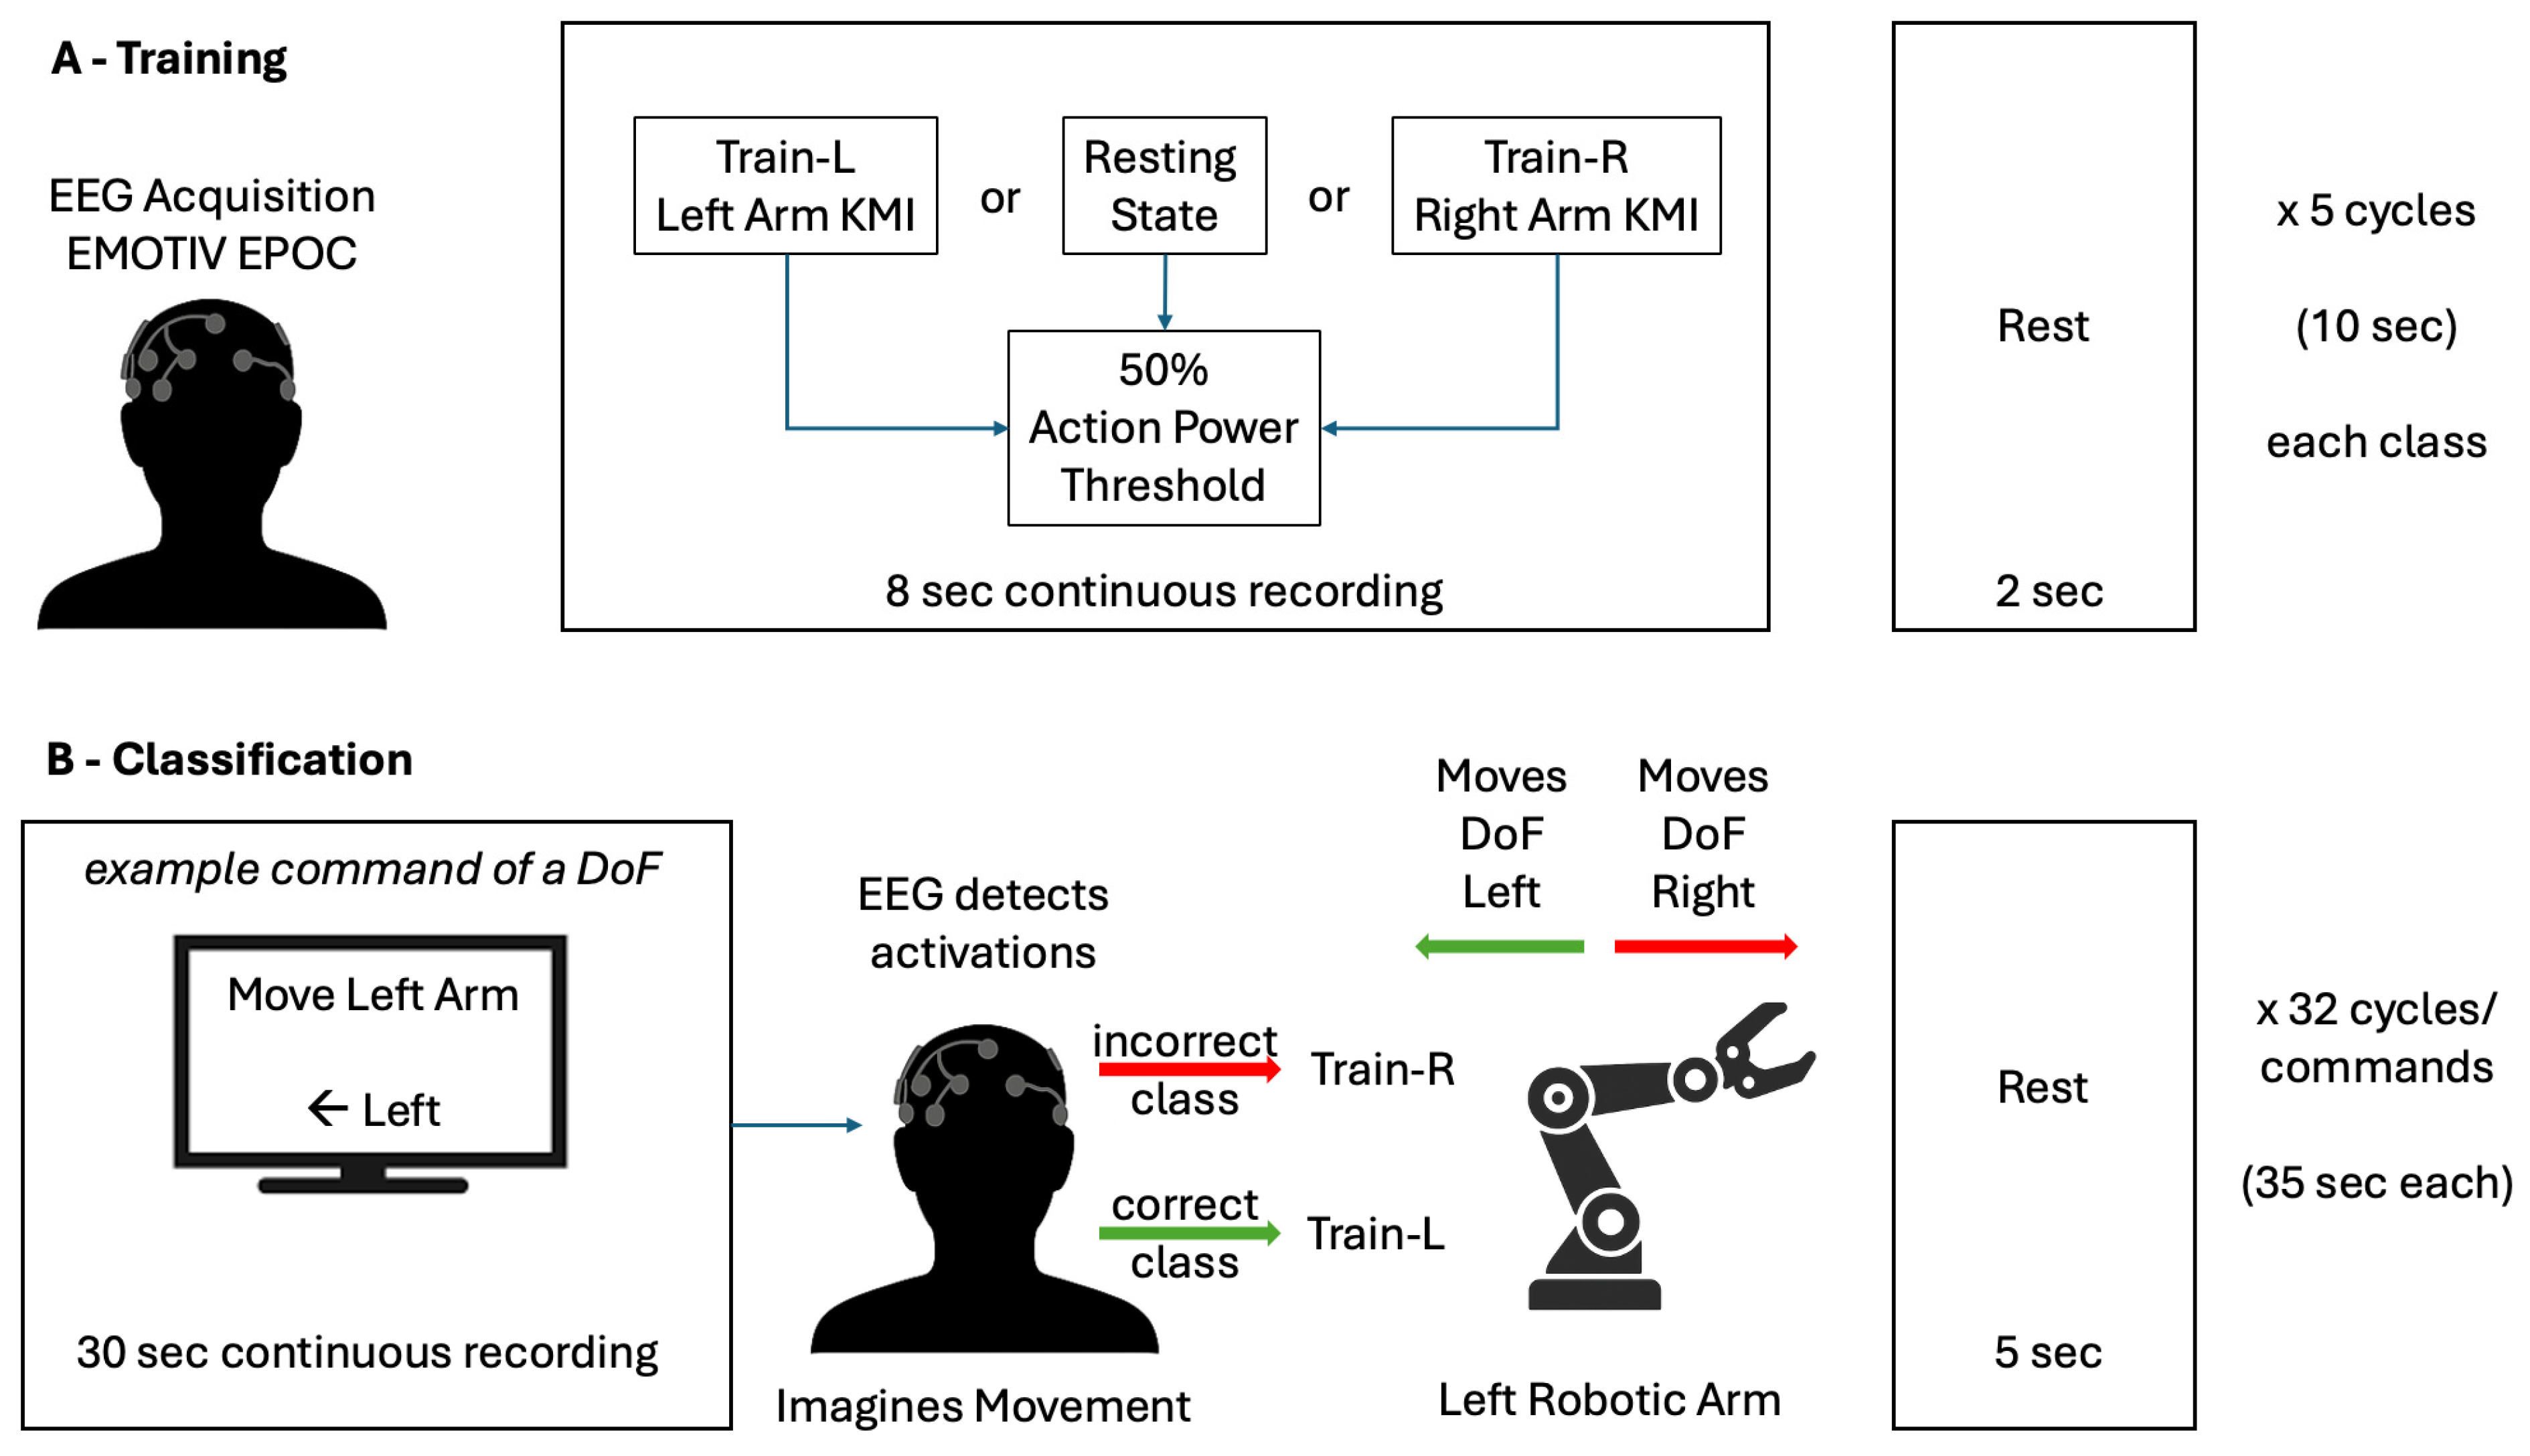
2.2. Experimental Procedures

The experimental procedures of the project, as well as the results of the BCI experiments, have been reviewed and published previously [20,21,22,23]. In this section, we include summarized details regarding the experimental procedures that are necessary to explain the context of the post hoc ERP analysis, performed on the raw EEG data collected during the BCI experiment, that we describe in the current manuscript. More information is also included in the Supplementary Materials titled “Detailed Experimental Procedures” (Figures S1 and S2). The data used were obtained after obtaining permission from the authors and consist of 14-channel wireless EEG data from our previously published study [22] employing 10 subjects with cervical SCI and 8 healthy control subjects. The data were recorded using the commercial 14-channel Emotiv EPOC EEG from channels AF3, F7, F3, FC5, T7, P7, O1, O2, P8, T8, FC6, F4, F8, AF4 as participants attempted to move the bimanual Mercury robotic arms [21,24] using KMI [22]. Participants were first trained in a three-class BCI (two active classes, i.e., left and right, and a resting state) using the Emotiv algorithm, with an action power threshold set at 50%, in blocks of five training cycles, each cycle consisting of 8 s of continuous recording and 2 s of rest (Figure 1). After the training, the participants attempted to produce the mental commands for left and right classes to move the robotic arm, and 32 different commands were given. Each command was projected for 30 s, during which period the subjects attempted to produce as many classifications of the desired direction as possible, followed by a 5 s rest period. Correct class detection resulted in the target arm moving as per the instruction. Incorrectly detected activations moved the arm in an opposite direction.

2.3. Signal Pre-Processing

The analysis presented herein was performed using EEGLAB (version 2024.2) [25] within the MATLAB environment, version R2024b (MathWorks, Natick, MA, USA). The pre-processing steps (Figure 2) included the following:
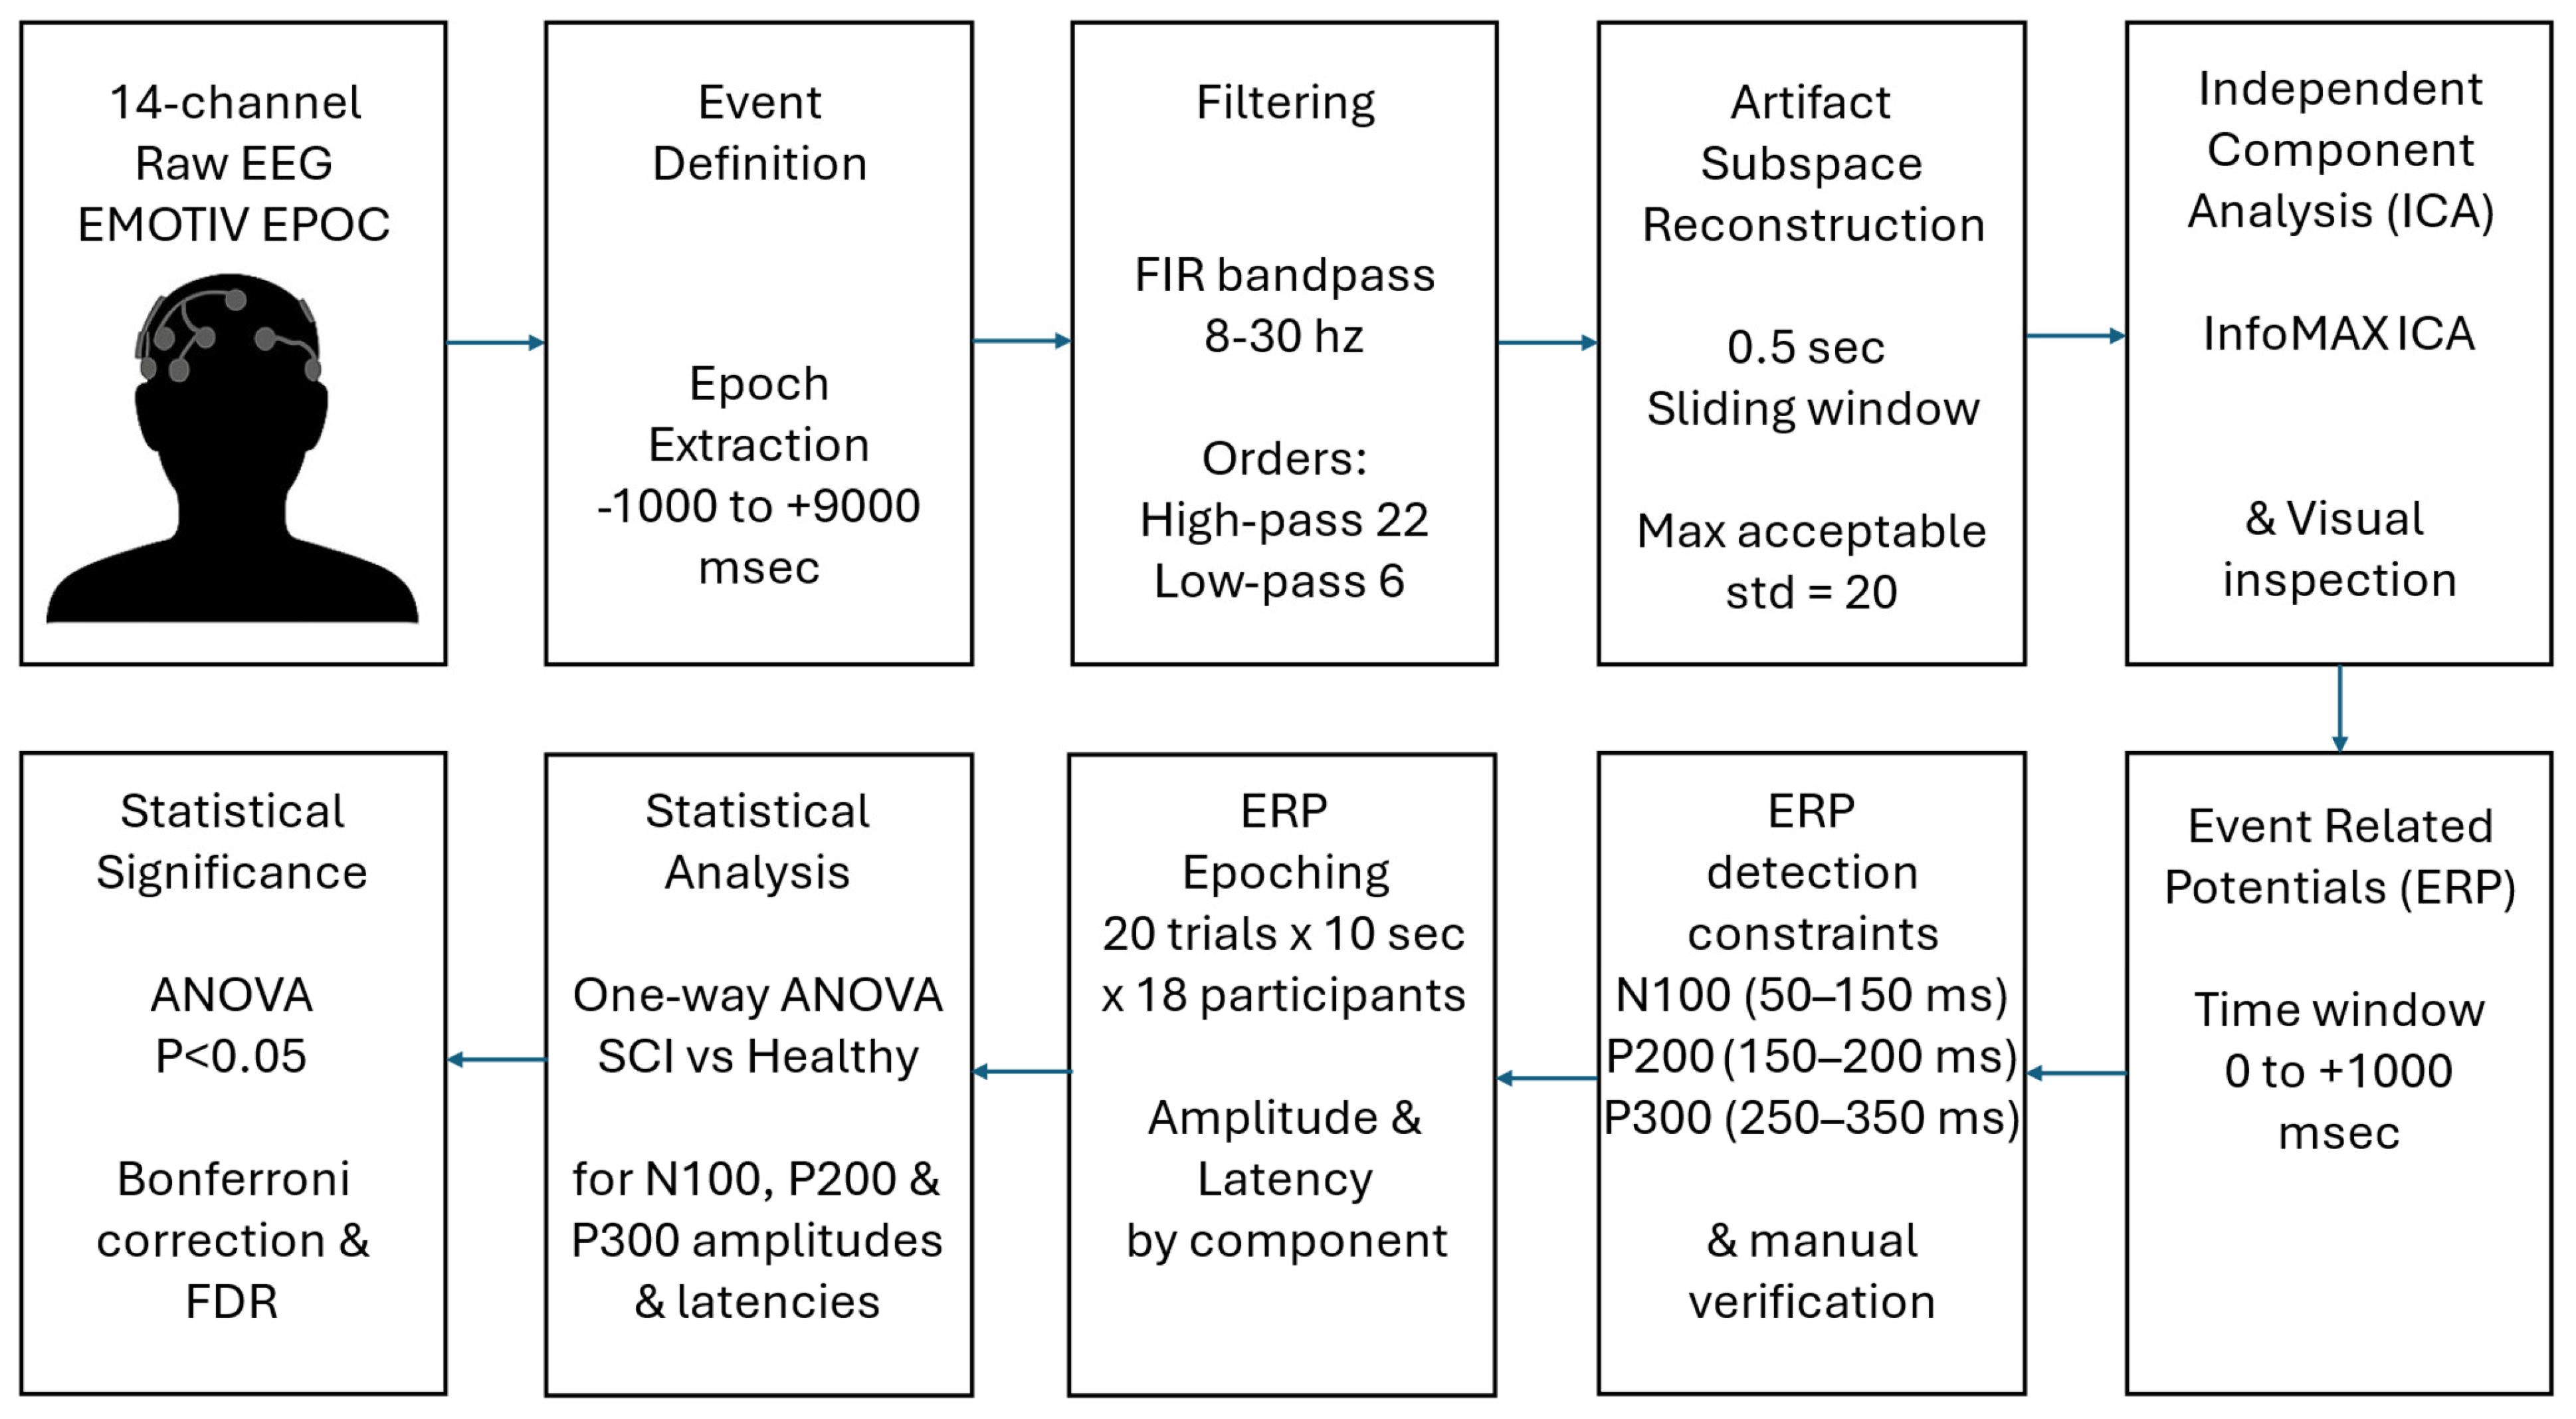
  • Event Definition and Epoch Extraction: The epochs of each subject, corresponding to 20 events of 10 s duration each (epochs from −1 to +9 s relative to event onset), were manually extracted to capture brain activity associated with the tasks.
  • Filtering: Filtering was performed using a finite impulse response (FIR) band-pass filter between 8 Hz and 30 Hz, with a high-pass filter order of 22 and a low-pass filter order of 6 [26,27,28].
  • Artifact Data Removal: The Clean Rawdata tool in EEGLAB, which utilizes artifact subspace reconstruction (ASR), was used to eliminate artifacts and bad data from the EEG recordings [29,30]. The ASR algorithm uses linear algebra methods, such as singular value decomposition (SVD) or principal component analysis (PCA), to decompose data into components (subspaces), isolating brain-related activity from artifact-related components. For burst artifact correction, the maximum acceptable standard deviation in a 0.5 s sliding window was set to 20. These settings enabled automated, data-driven denoising, improving the reliability of subsequent ERP component estimation.
  • Independent Component Analysis (ICA): ICA was used to identify and remove artifacts from the EEG signal, implemented via the runica.m function, utilizing InfoMax ICA [31]. However, no independent components were removed, as visual inspection did not reveal any components clearly attributable to artifacts (e.g., eye blinks, muscle activity).

2.4. ERP Analysis

The analysis of the ERPs (Figure 2) involved:
  • Time Window for ERP Component Analysis: The time window for ERP analysis was set from 0 to +1000 ms after event onset, allowing for capturing early sensory processing, as well as later cognitive components.
  • ERP Component Definition and Peak Detection: Specific ERP components (N100, P200, P300) were identified based on their amplitude and latency within defined time windows. Peaks were detected using a hybrid approach combining derivative-based extremum detection and temporal window constraints. For any voltage time series V(t), candidate peaks satisfied the following:
    a.
    First derivative zero-crossing V′(t) = 0.
    b.
    Second derivative test:
    i.
    V″(t) < 0 for positive peaks (P200, P300);
    ii.
    V″(t) > 0 for negative peaks (N100).
    c.
    Amplitude threshold: |V(t)| > 2.5 × baseline root mean square (RMS) (0–50 ms post-stimulus).
    d.
    Component-specific temporal windows constrained search ranges: N100: 50–150 ms (negative peak), P200: 150–250 ms (positive peak), and P300: 250–400 ms (positive peak).
    e.
    Manual (visual) verification of ERP peak detection, where V(t): voltage amplitude as a function of time t (measured in microvolts, μV); V′(t): first derivative of voltage with respect to time (μV/ms); V″(t): second derivative of voltage with respect to time (μV/ms2); t: time in milliseconds (ms) relative to stimulus onset; RMS_baseline: root mean square amplitude of the baseline period (μV).
3.
ERP Epoching: From the 18 participants analyzed, the total epochs included 20 trials × 10 s × 18 subjects = 3.600 s, defined as N_trials: number of experimental trials per participant; T_duration: duration of each trial (seconds); N_subjects: total number of study participants.
4.
Statistical Analysis: For each ERP component (N100, P200, P300), a separate one-way analysis of variance (ANOVA) [32] was conducted, comparing amplitude and latency measures between groups across 14 EEG channels. The ANOVA model for amplitude comparisons was specified as
F = M S b e t w e e n M S w i t h i n = i = 1 k n i x i ¯ x ¯ 2 / k 1 i = 1 k j = 1 n i ( x i j x i ¯ ) 2 / ( N k )   .
where F: F-statistic value for ANOVA test (dimensionless ratio); MSbetween: mean square between groups (μV2 for amplitude, ms2 for latency); MSwithin: mean square within groups (μV2 for amplitude, ms2 for latency); k: number of groups being compared (k = 2 in this study); ni: sample size of group i (n1 = 10 for SCI, n2 = 8 for controls); N: total sample size across all groups (N = 18); x i j : individual observation j in group i (μV for amplitude, ms for latency); x ¯ i : mean of group i (μV for amplitude, ms for latency); x ¯ : grand mean across all groups (μV for amplitude, ms for latency); i: group index (i = 1 for SCI, i = 2 for controls); j: individual observation index within each group (j = 1 to n_i).
The F-value for a = 0.05 with (1, 16) degrees of freedom was 4.49. Significant ANOVA results (p < 0.05) triggered post hoc comparisons using the Tukey–Kramer method to control family-wise error rate, through the formula
C I = ( x i ¯ x j ¯ ) ± q a , k , d f M S w i t h i n 2 ( 1 n i + 1 n j )
where CI: confidence interval for the difference between group means (μV or ms); q_(α,k,df): critical value from studentized range distribution; α: significance level (α = 0.05); df: degrees of freedom for error term (df = N − k = 16); p: probability value from statistical test (dimensionless, 0 ≤ p ≤ 1).
5.
Statistical Testing: A one-way analysis of variance (ANOVA) was performed at a significance level of 0.05 for the 3 ERP components of interest across time points for each channel to assess differences in ERP amplitudes between groups. Significant results prompted post hoc analyses to further explore specific group differences [32].
6.
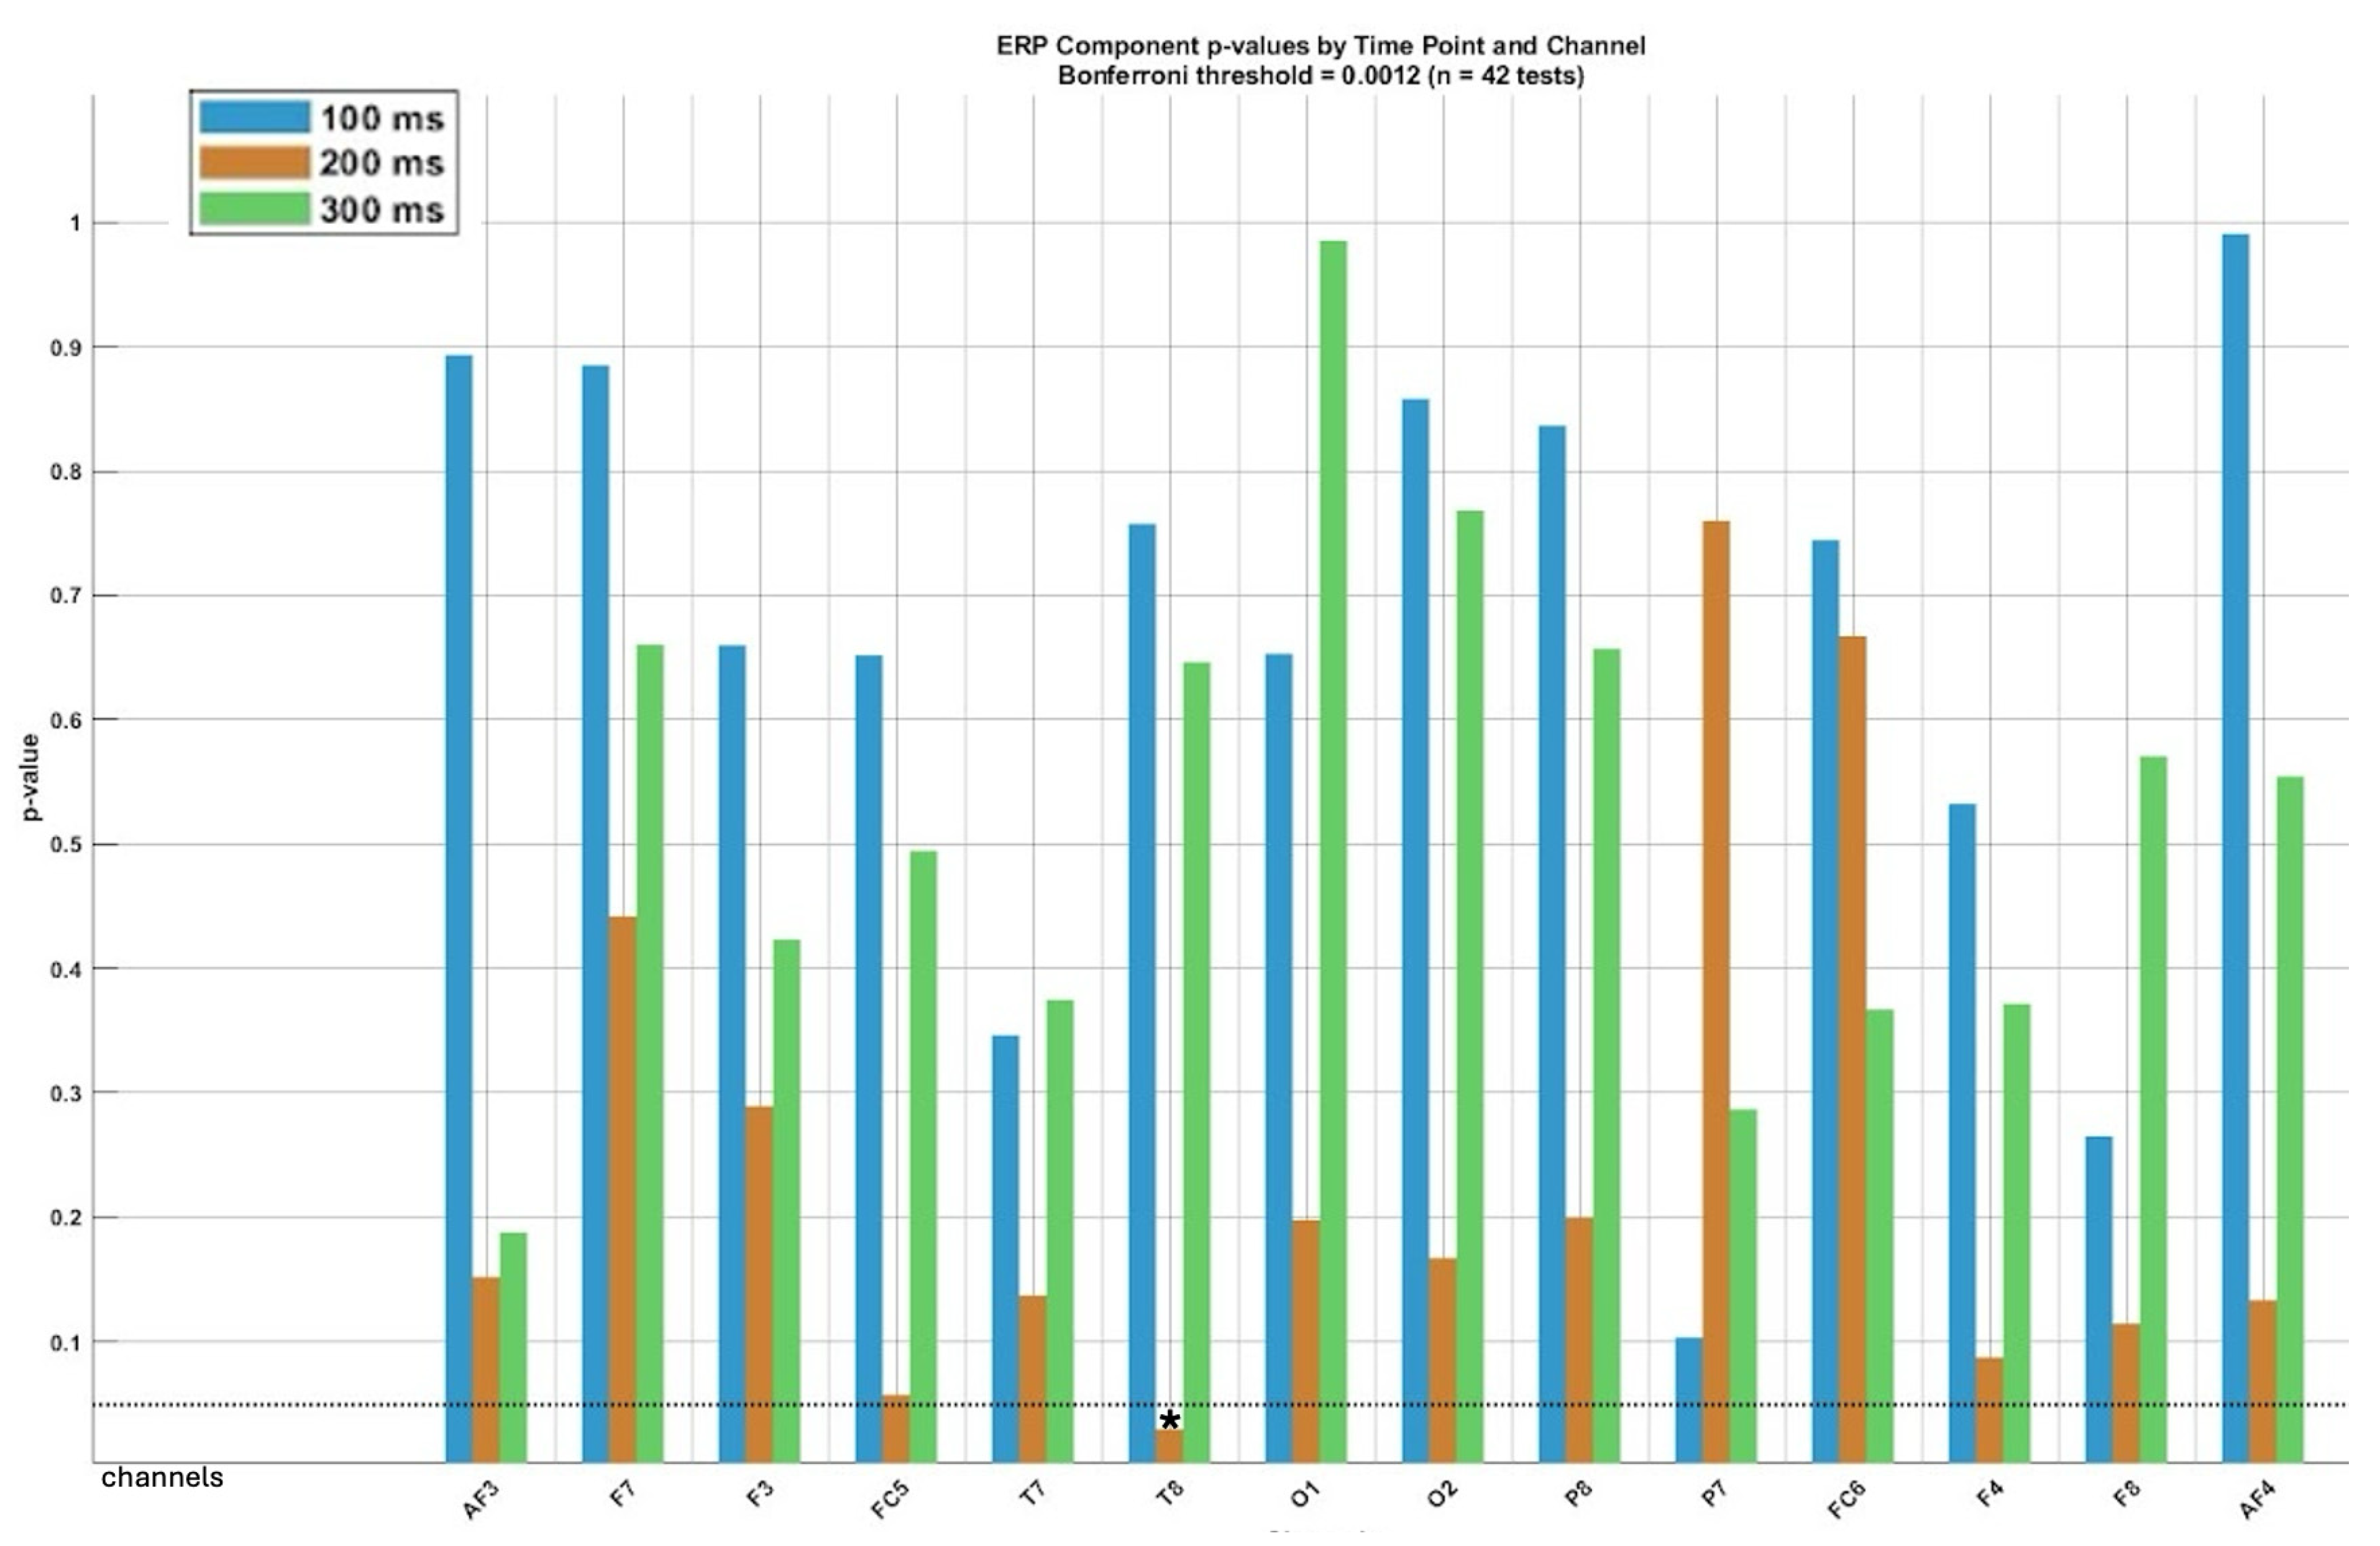
Correction for multiple comparisons: To control for the increased risk of false positives resulting from multiple comparisons across electrode channels and time points, we applied two widely accepted statistical correction methods: the Bonferroni correction and the false discovery rate (FDR) correction (Benjamini–Hochberg procedure). The Bonferroni correction is a conservative method that controls the family-wise error rate (FWER) by adjusting the significance threshold proportionally to the number of comparisons. Although effective in minimizing Type I errors, it increases the risk of Type II errors, particularly in high-dimensional datasets like EEG results. To balance this limitation, we also applied the FDR correction, which controls the expected false discovery proportion among significant findings. FDR is less conservative and more suitable for ERP studies involving multiple channels and temporal comparisons, as it allows for greater sensitivity while still controlling false positives. We used a p-value threshold of 0.05, indicating that at most, 5% of reported significant results are expected to be false discoveries. Results were reported as significant only when they passed both correction thresholds, thereby reinforcing the robustness of the statistical inferences.

3. Results

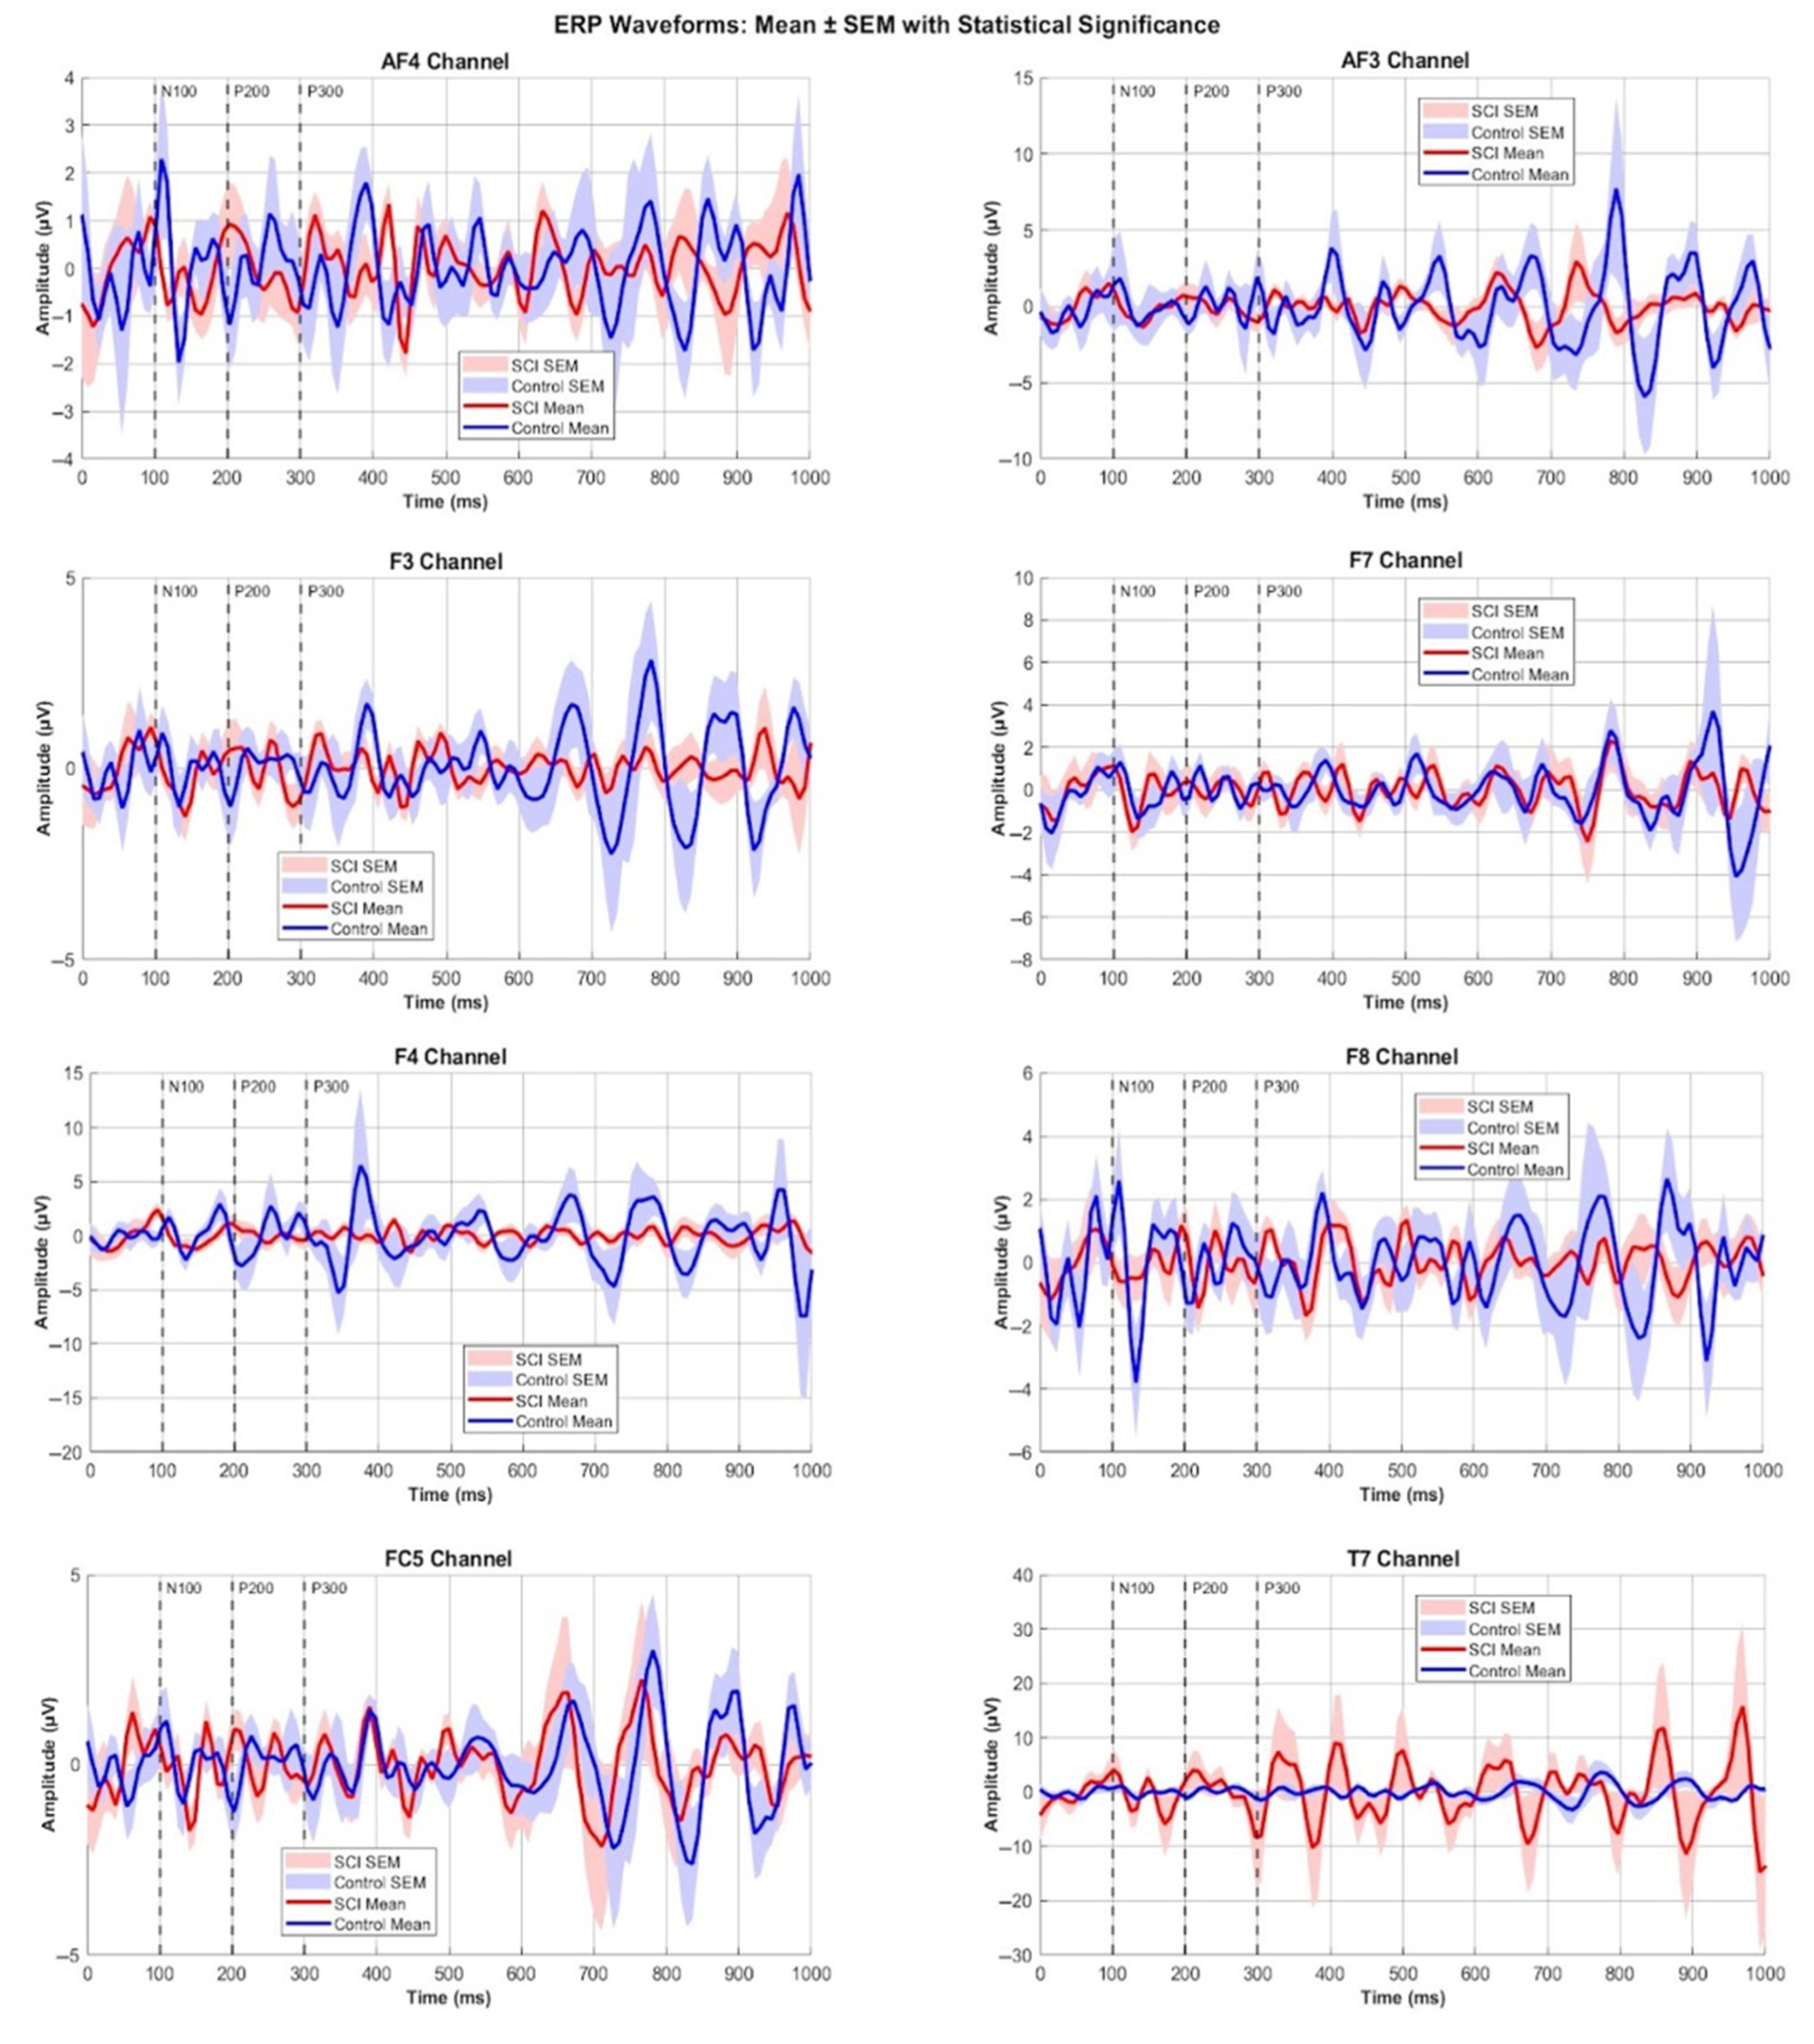
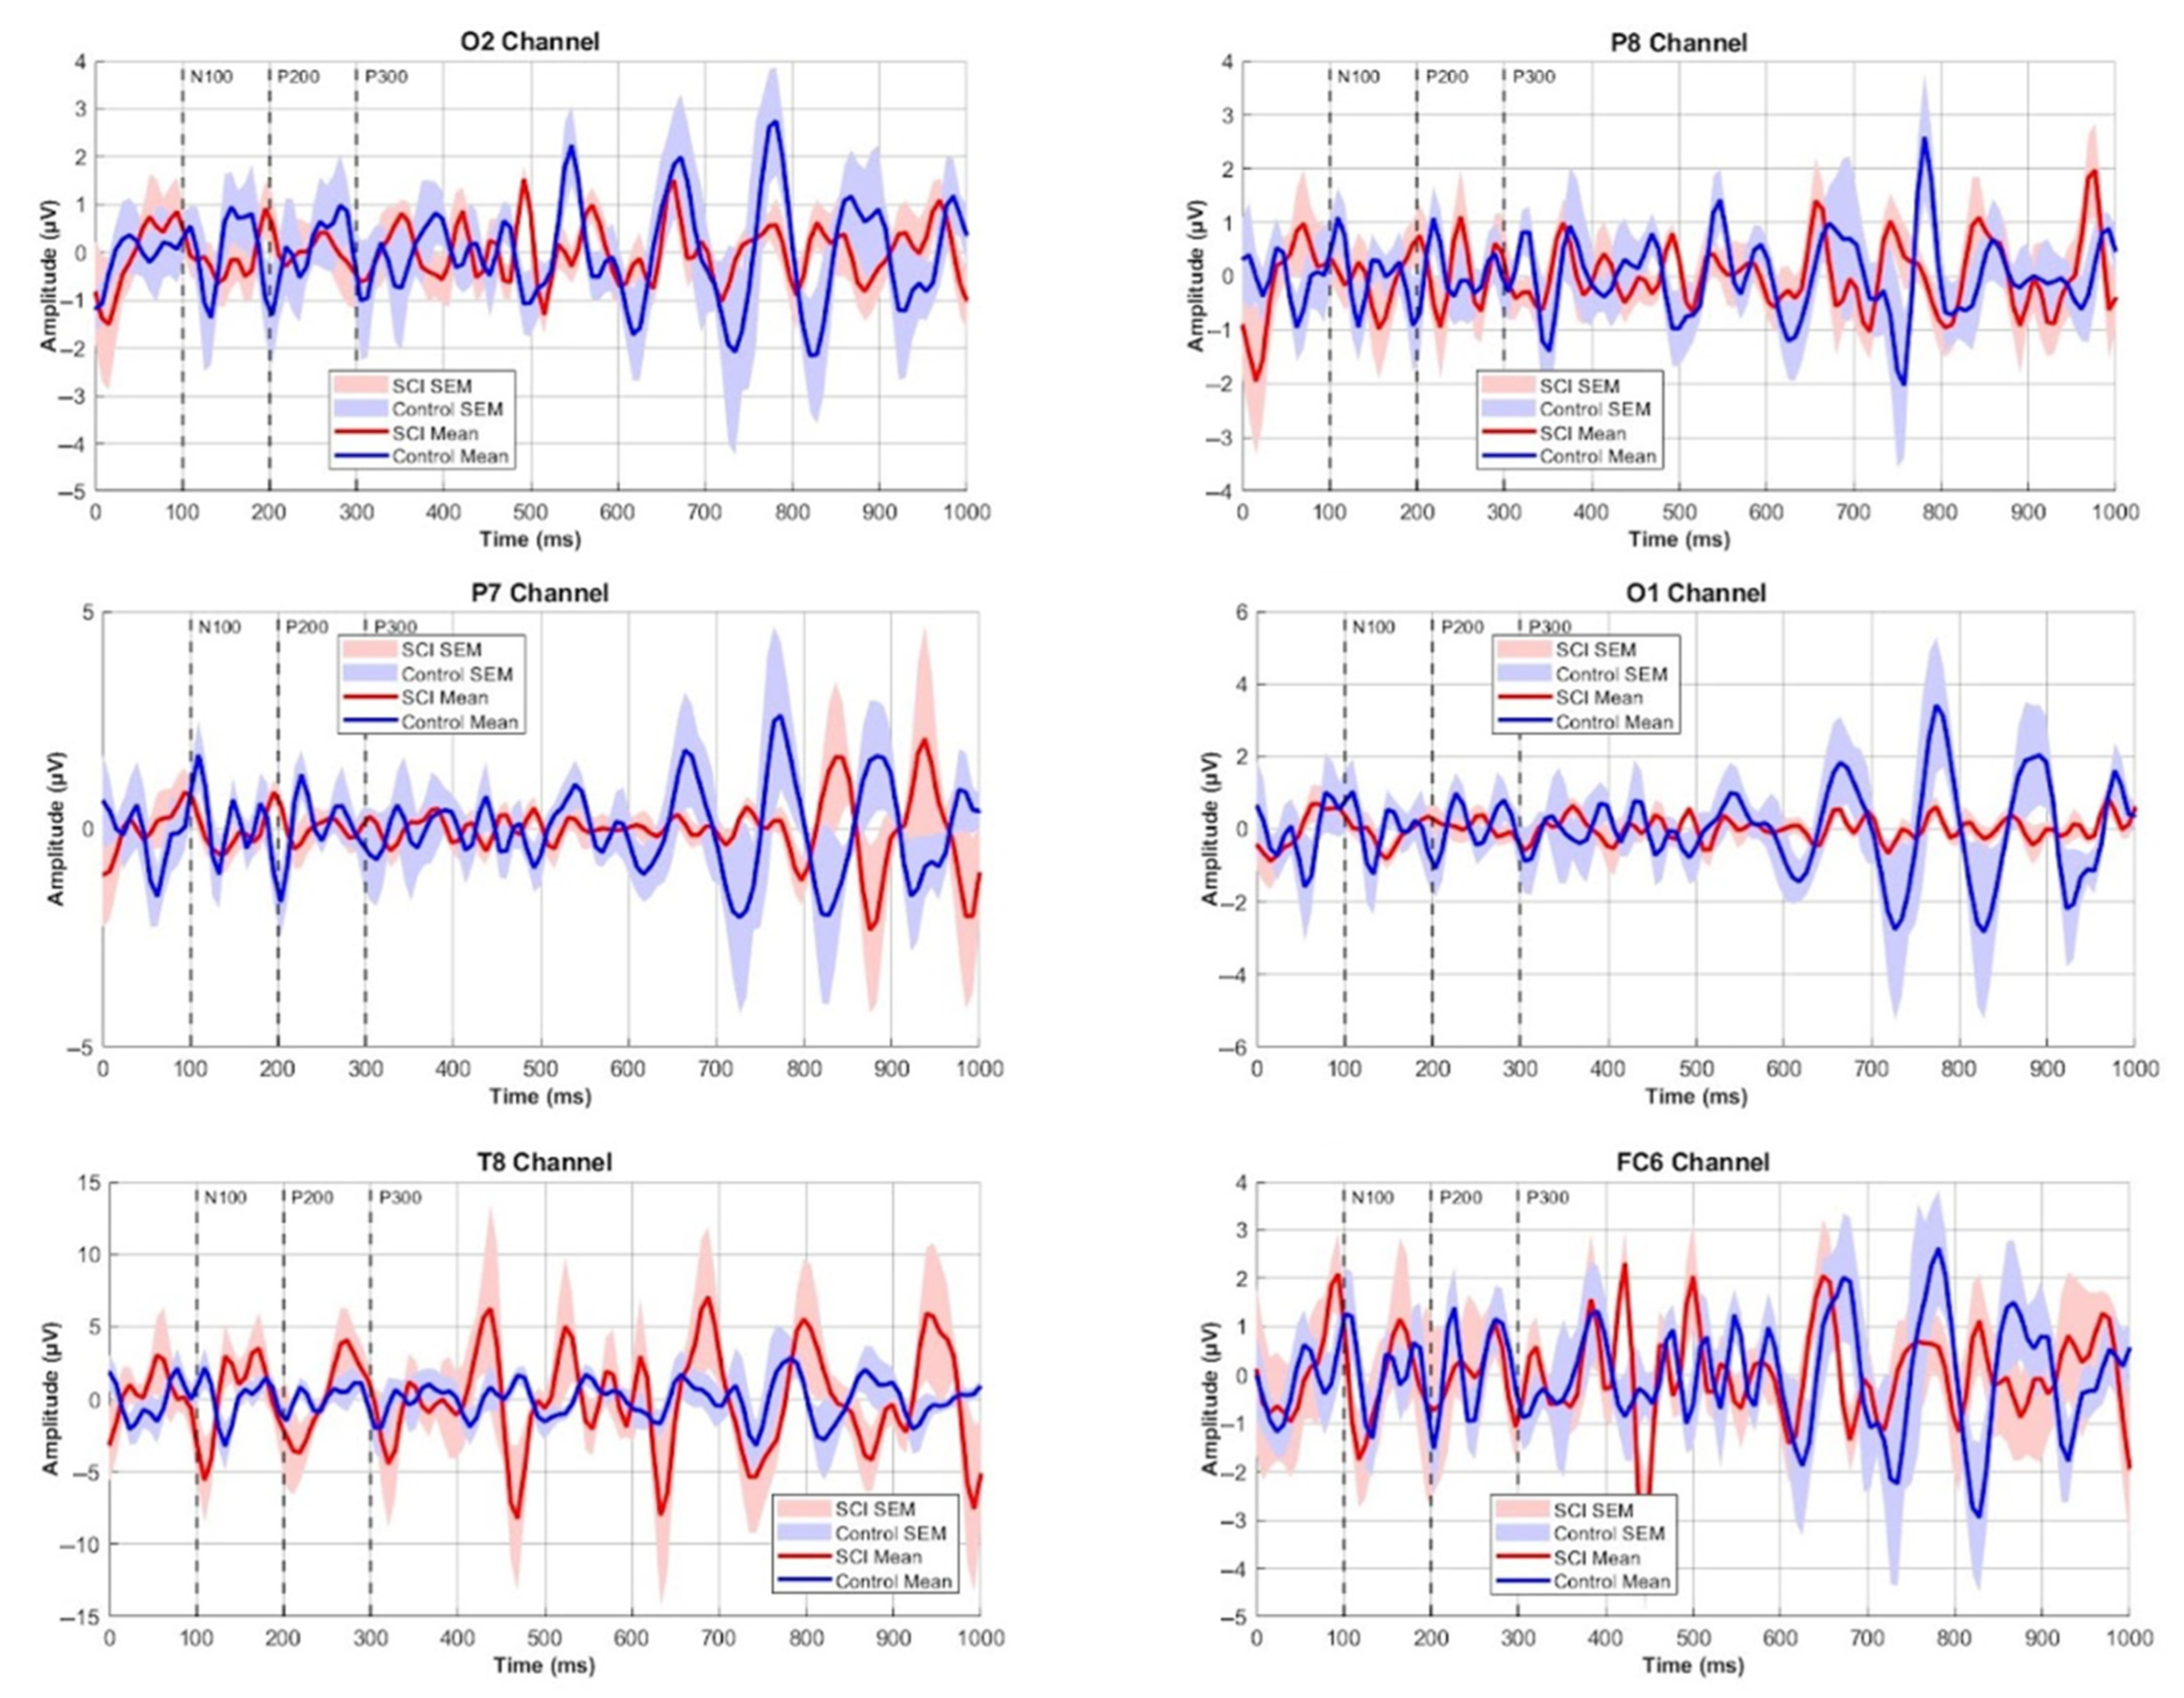
3.1. EEG Wavelength Amplitude Ranges and Comparisons

The results of our analysis regarding the amplitudes of EEG signals from each channel in each group are summarized in Table 1, providing insight into the neural response variability and intensity observed between the two populations. Similarly, the relevant analysis results regarding the latencies are summarized in Table 2. We compared the amplitudes and latencies of EEG wavelengths between the SCI and control groups across all channels, and we further focused on the components of interest (N100, P200, P300).
In the ERP wavelengths amplitude, following correction for multiple comparisons, no statistical differences between SCI patients and healthy control participants were observed across the range of time points and electrode sites, except for T8 channels at around P200. The EEG wavelengths are depicted in Figure 3. Summarily, non-significant trends in differences between SCI and healthy participants (Figure 1) were observed around the following:
  • 50 ms: channel FC6;
  • 100 ms: channels FC6, F4, and T8;
  • 150 ms: channels FC5 and T8;
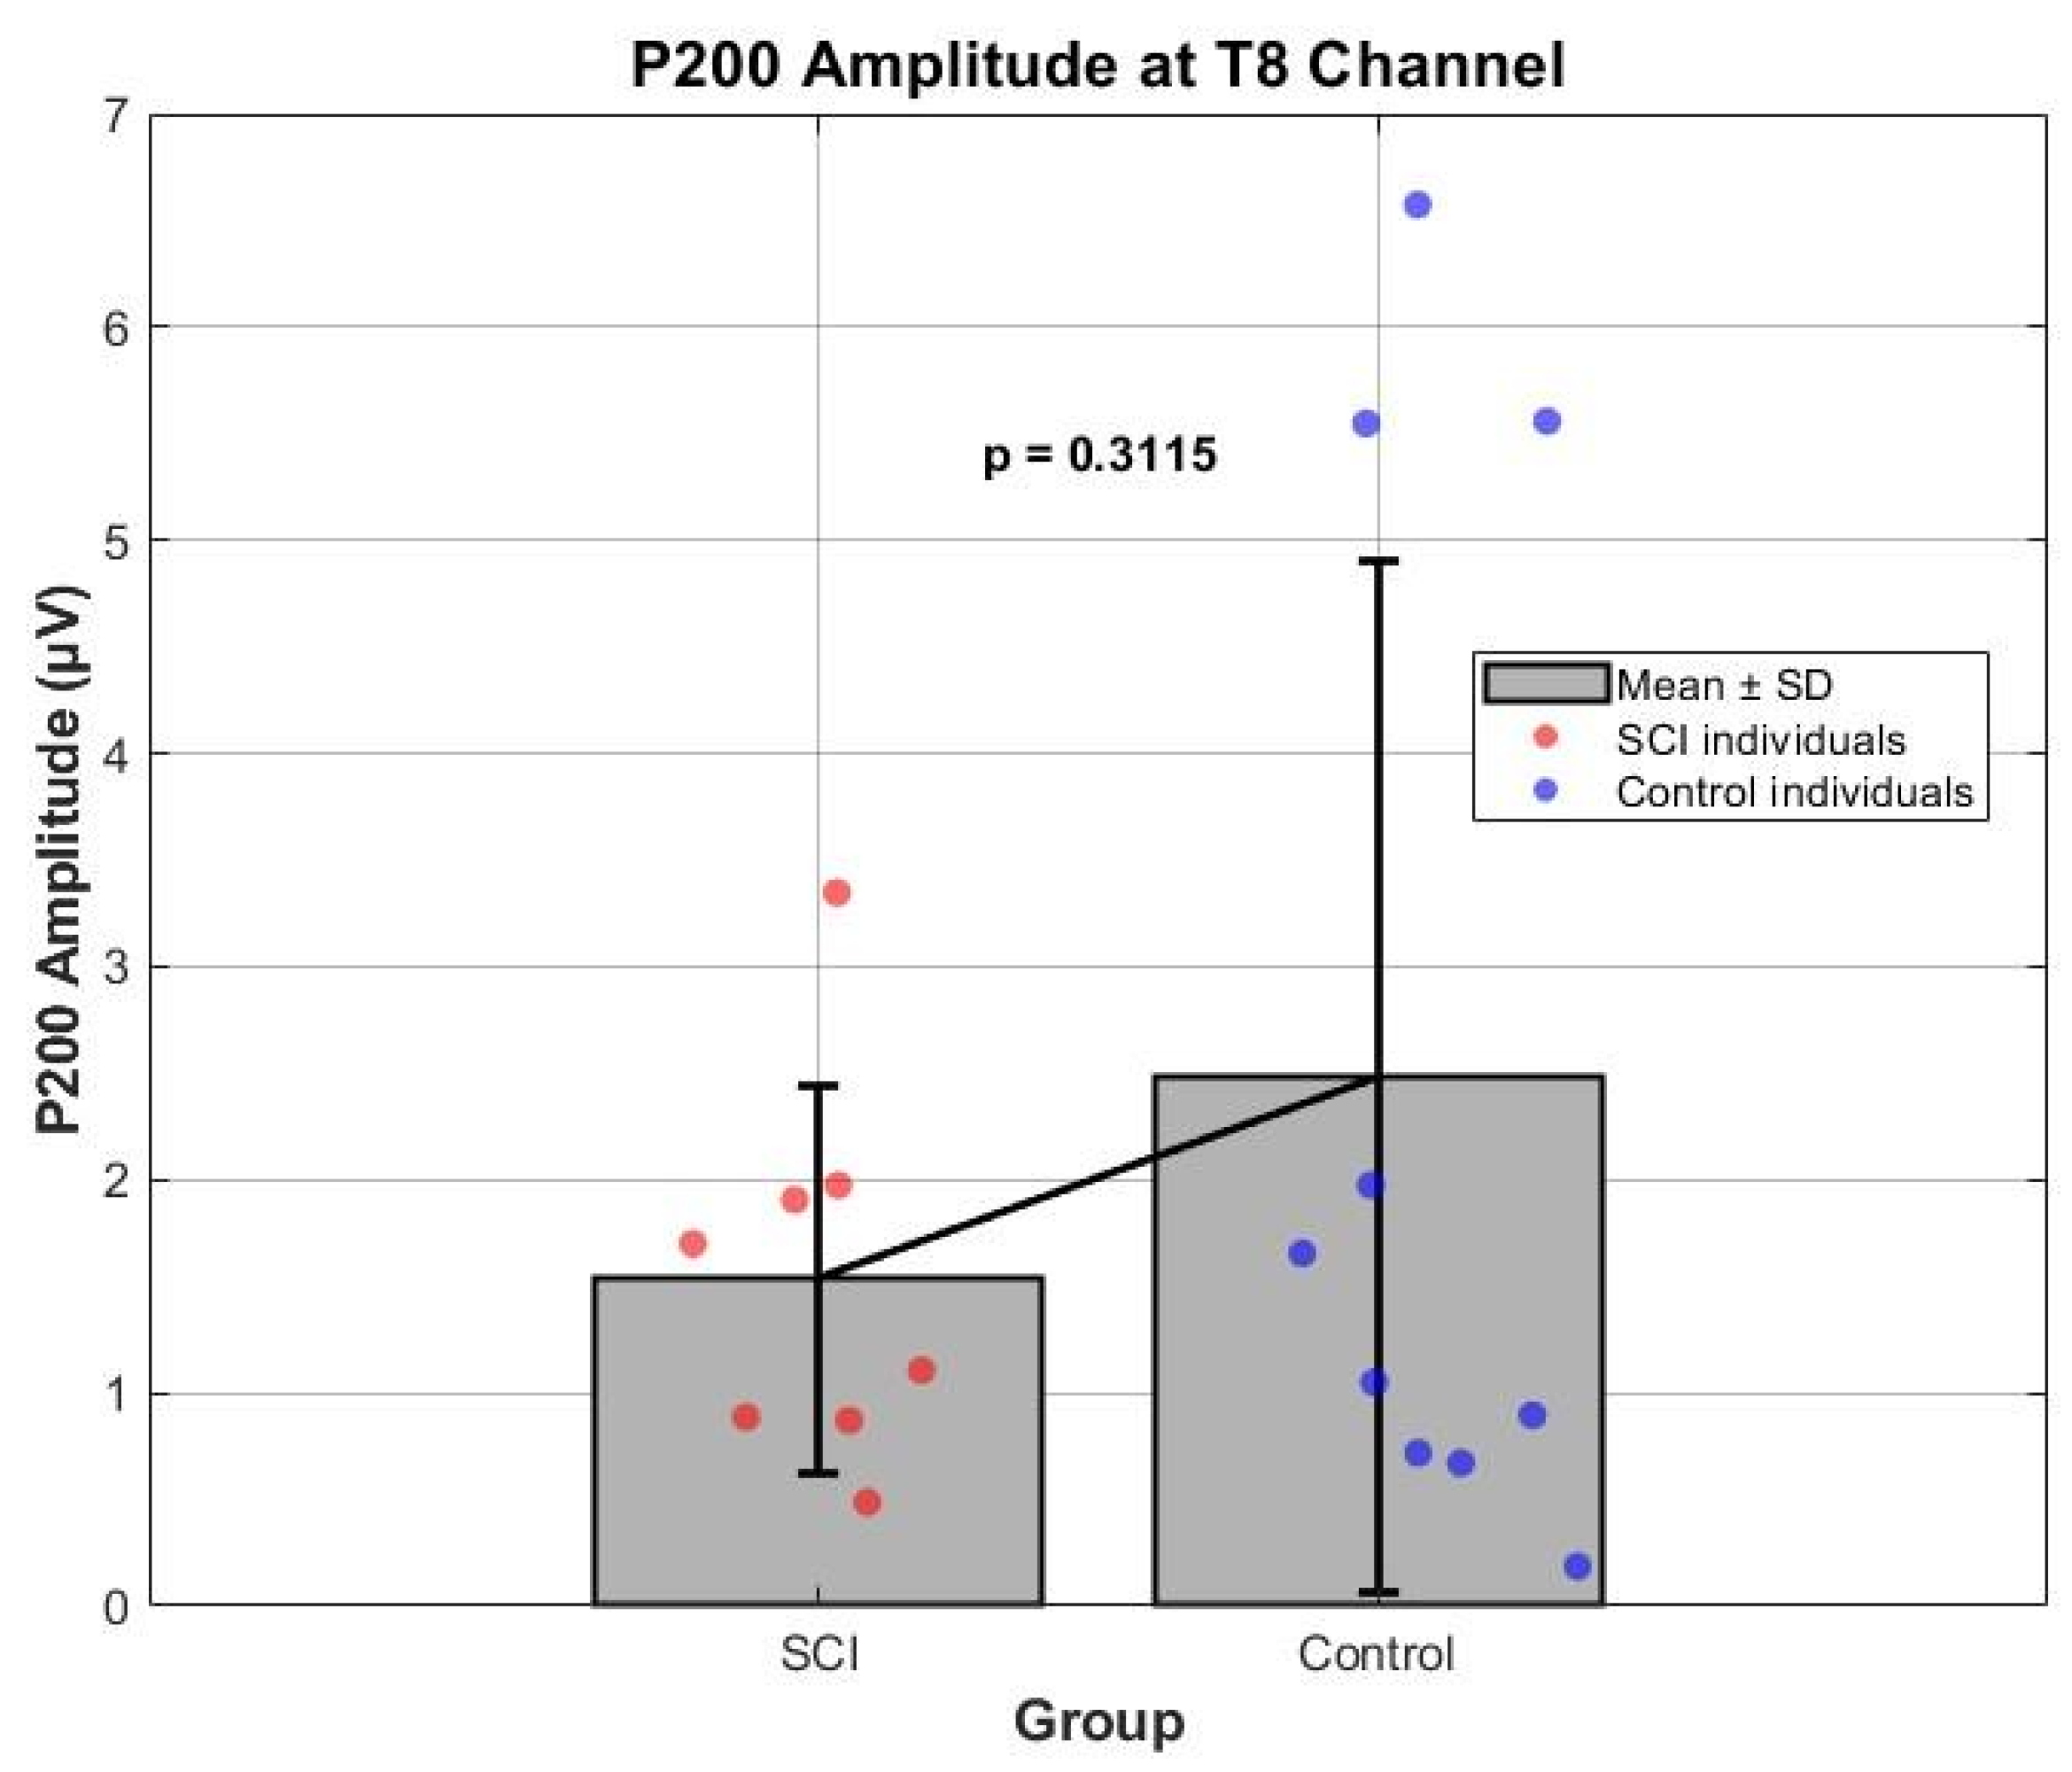
  • 200 ms: channels P7 and T8;
  • 300 ms: channels F3 and P8;
  • 400 ms: channels F3, F7, P8, FC6, and AF4;
  • 450–500 ms: channels F8, P8, T8, FC6, AF3, and O2;
  • 550 ms: channels F4, FC6, and O2;
  • 600 ms: channels FC4, F8, FC6, O1, and O2;
  • 700 ms: channel AF3;
  • 800 ms: channels FC5 and P7;
  • 850: channel P7.
At around 100 ms, these trends emerged at channels T8, FC6, and F4, while at around 150 ms, trends were seen at FC5 and T8, suggesting subclinical early cortical processing alterations. Furthermore, at around 200 ms, T8 and P7 showed differential amplitudes, extending the temporal window of early divergence. Around 300–400 ms, trends were identified at F3, F7, P8, FC6, and AF4, indicating altered mid-latency components potentially corresponding to sensory–motor integration. In the later stages of the ERP response, trends were observed between 450–500 ms at F8, P8, T8, FC6, AF3, and O2, followed by continued differences at 550 ms (F4, FC6, O2) and 600 ms (FC4, F8, FC6, O1, O2), indicating sustained cortical processing beyond ERP component latencies. Finally, late difference trends were seen at 700 ms (AF3), 800 ms (FC5 and P7), and 850 ms (P7), suggesting prolonged, widespread neurophysiological alterations in the SCI group. These findings could highlight both early and extended temporal ERP differences, albeit not statistically significant, across frontocentral, parietal, and occipital regions, indicating potential cortical reorganization and compensatory changes associated with spinal cord injury.
Figure 3 also reveals spatially distinct difference trends that were observed at the O2 channel, primarily between 500 and 600 ms, a timeframe not typically associated with the standard P100, N200, or P300 components. This may also reflect post-perceptual or cognitive processes, such as attentional reallocation or late evaluative mechanisms, which could be altered in SCI populations. Similarly, the FC6 channel exhibited no statistically significant ERP amplitude difference trends extending from 300 to 600 ms, again encompassing time windows beyond traditional ERP peaks.

3.2. ERP Components Comparisons

At the T8 channel, statistically significant differences in ERP amplitudes were observed at multiple time points. Similar differences were detected at the O2 channel between 500 and 600 ms and at the FC6 channel between 300 and 600 ms. Interestingly, most of these differences do not align with the ERP components of interest (P100, N200, P300), which are depicted in Figure 4, except for the P200 component, which showed significant difference only at the T8 channel (Figure 5). It is important to emphasize that, although several time intervals showed numerical amplitude differences, not all of these reached statistical significance, and many were not temporally aligned with the classical ERP components of interest (P100, N200, P300), as defined in Figure 4. This underlines the importance of interpreting previous findings with caution.

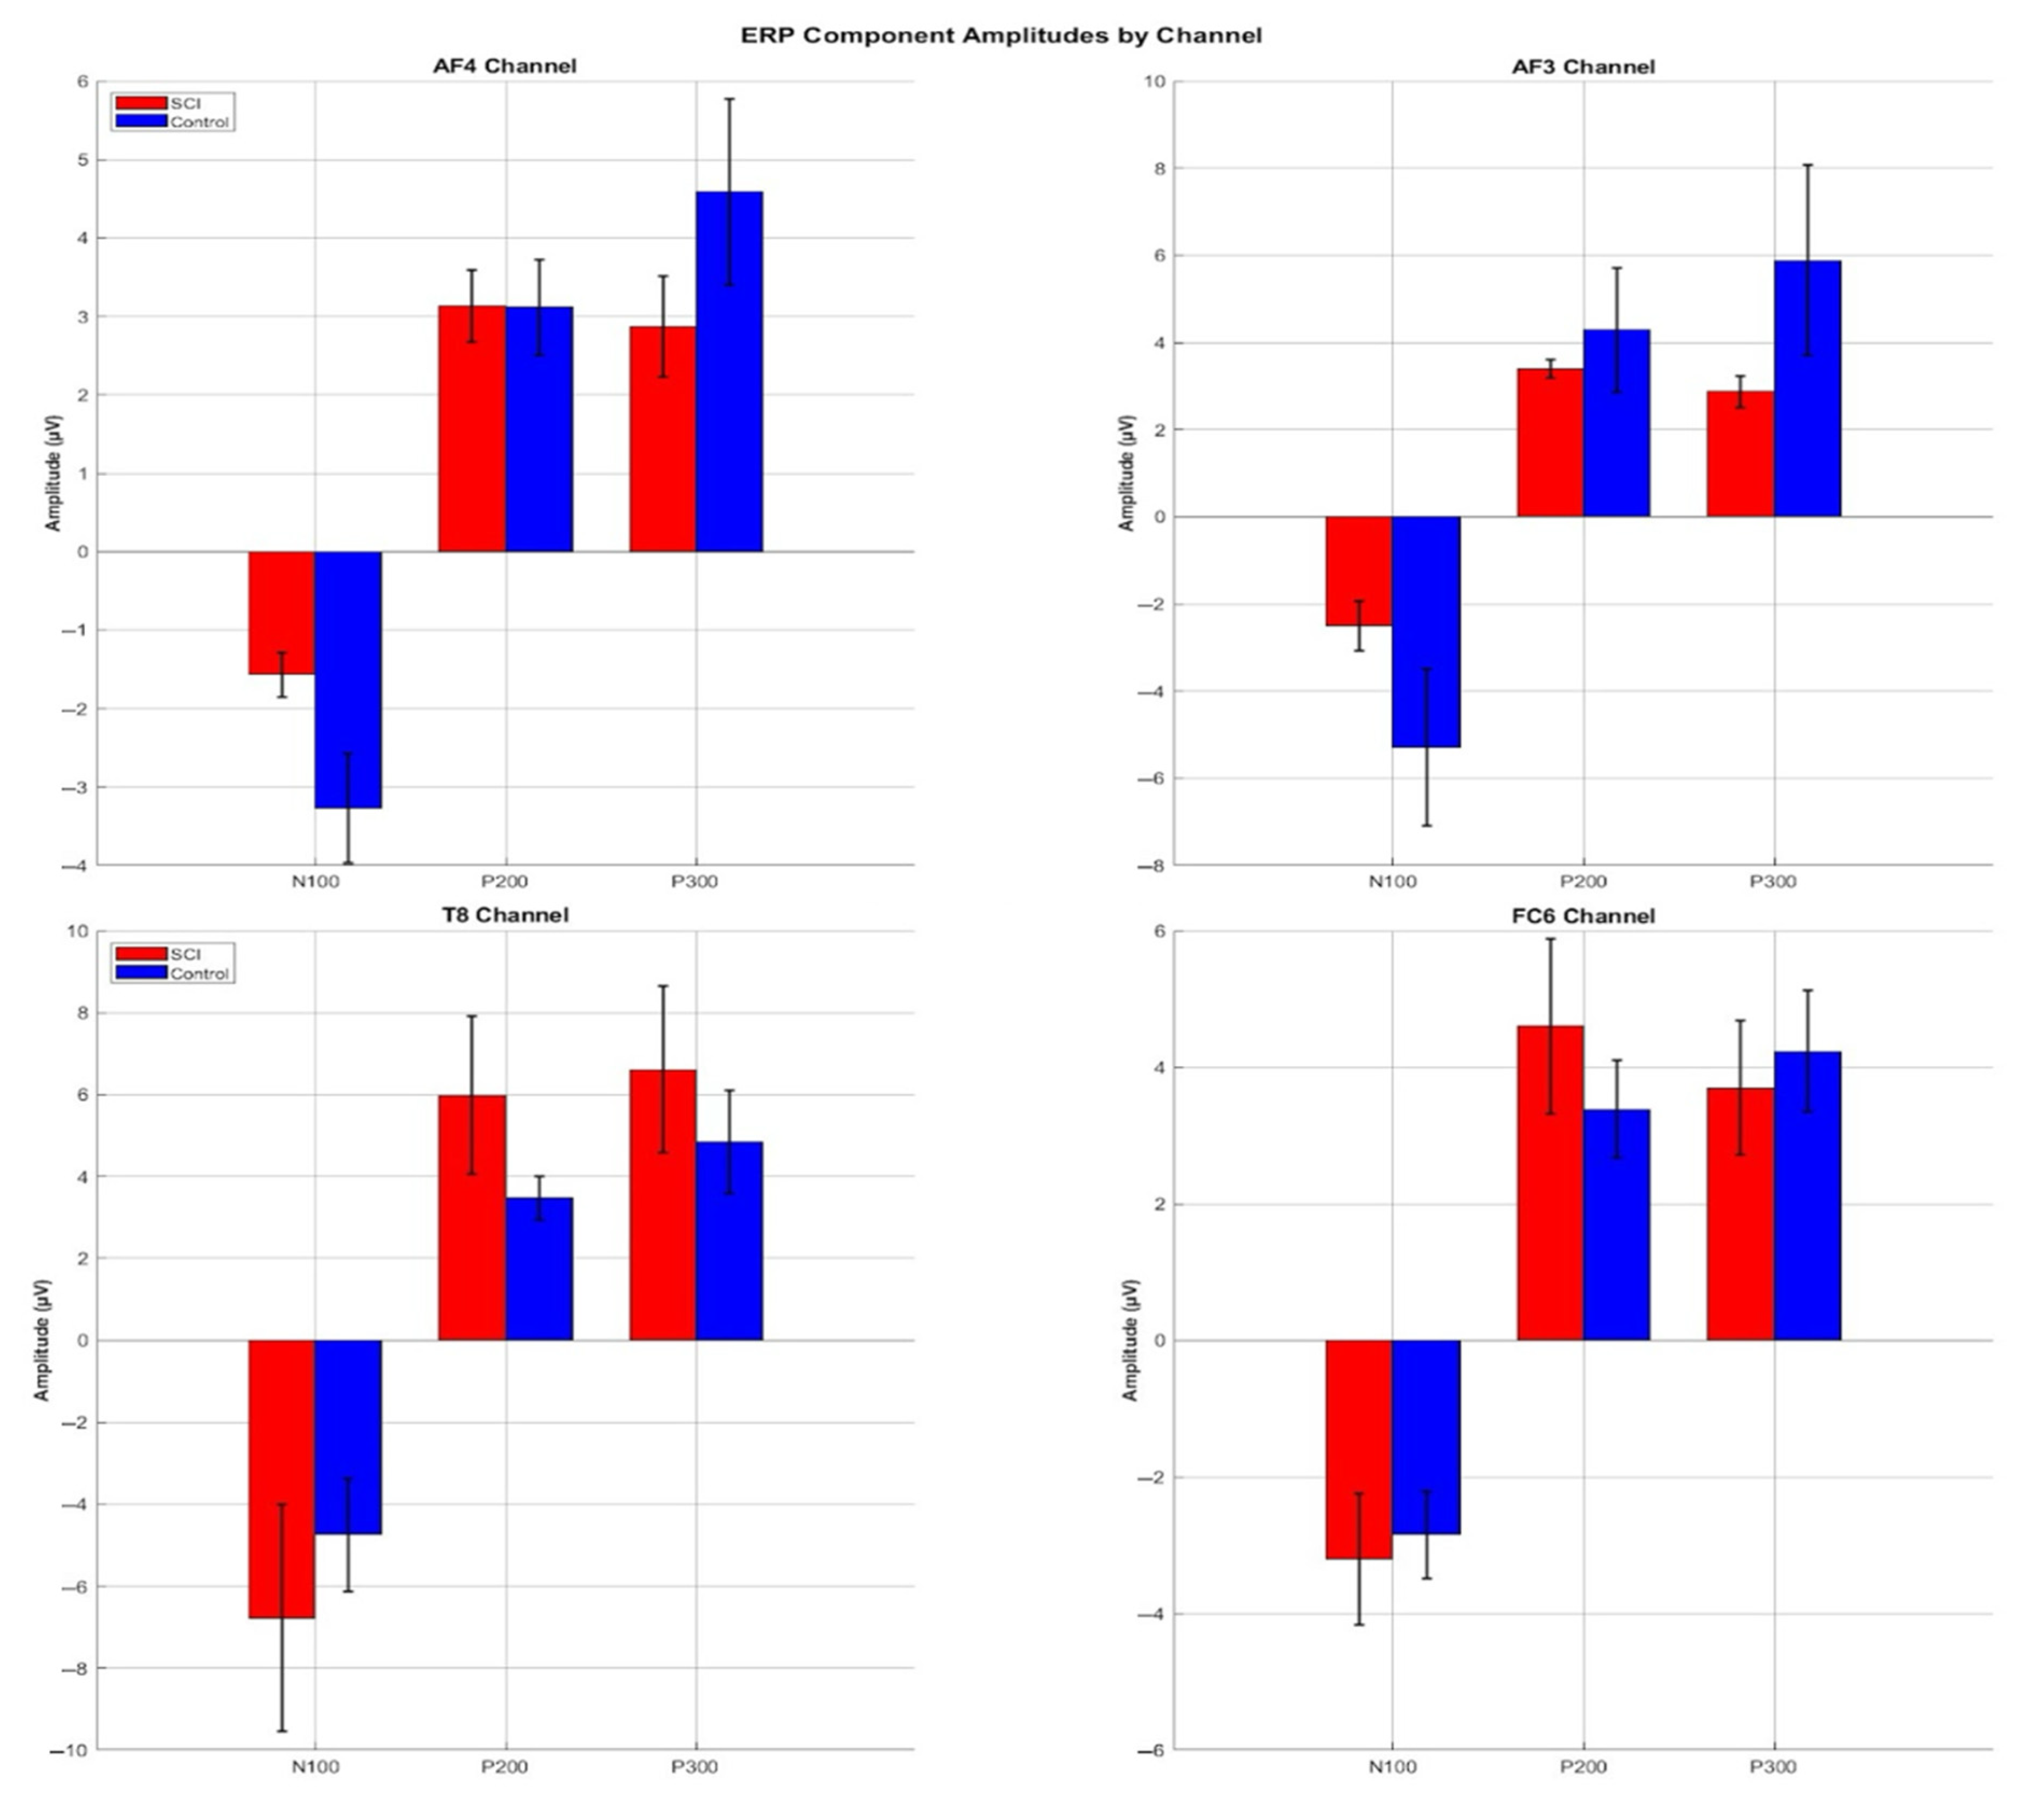
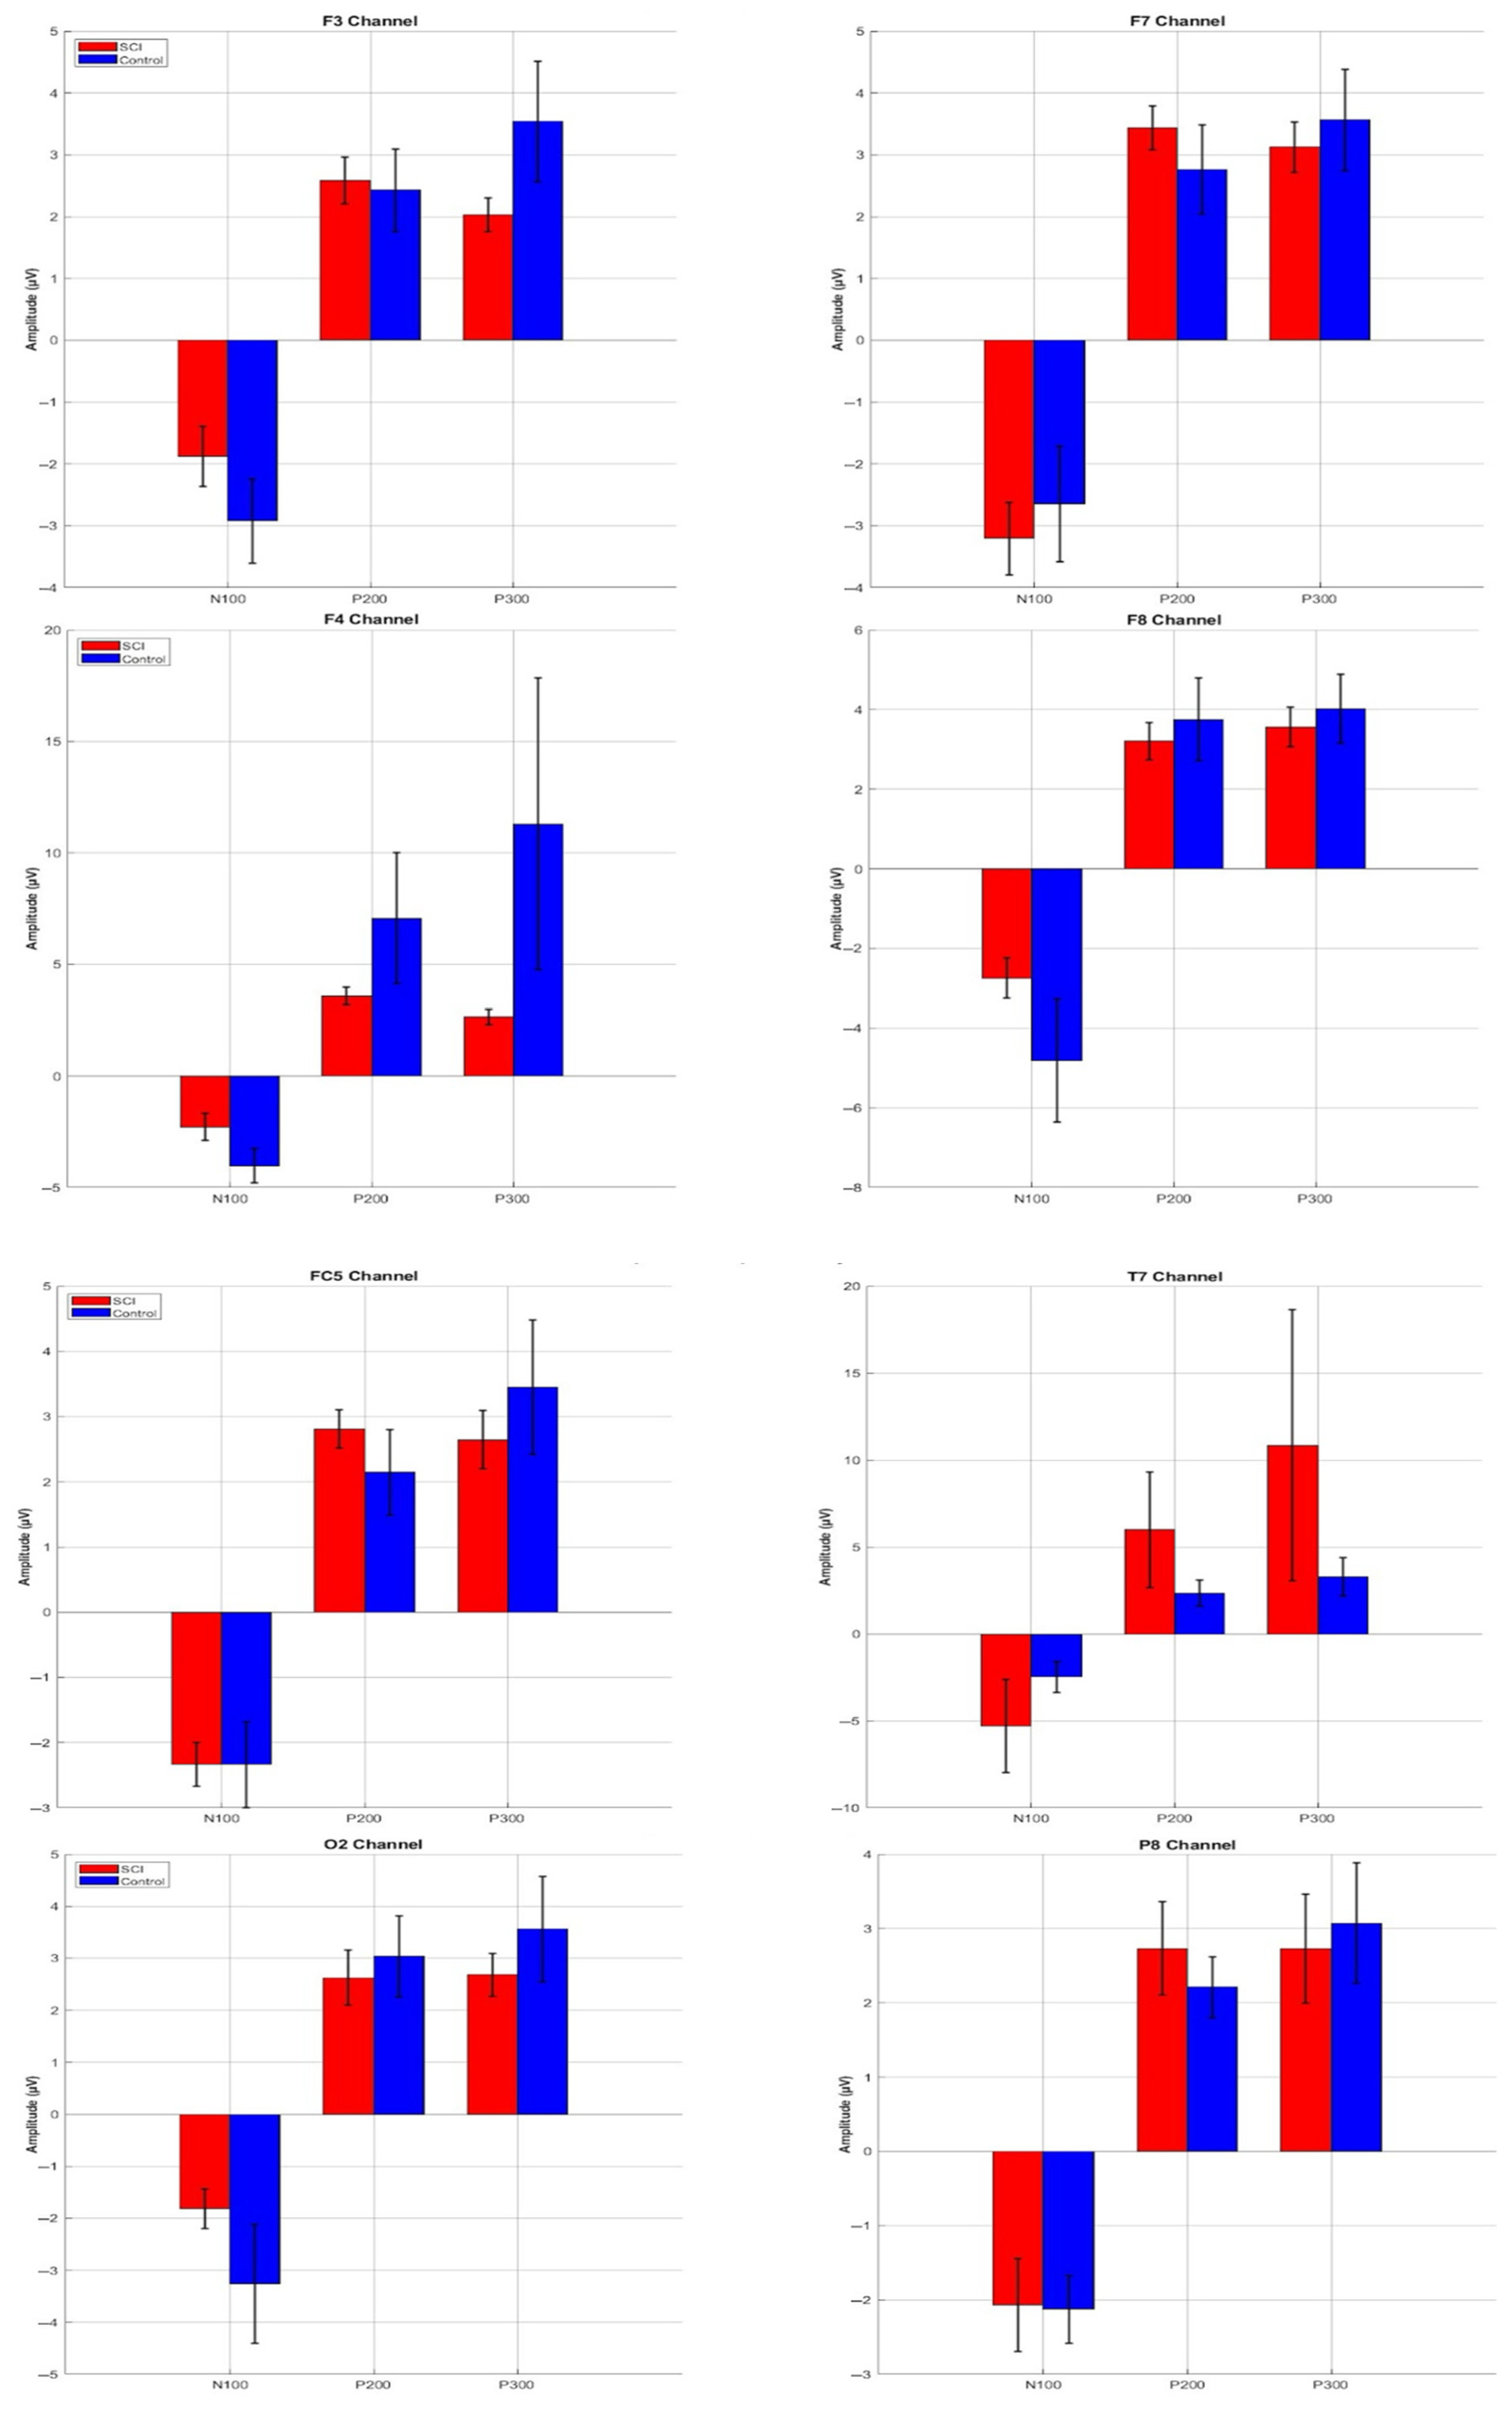
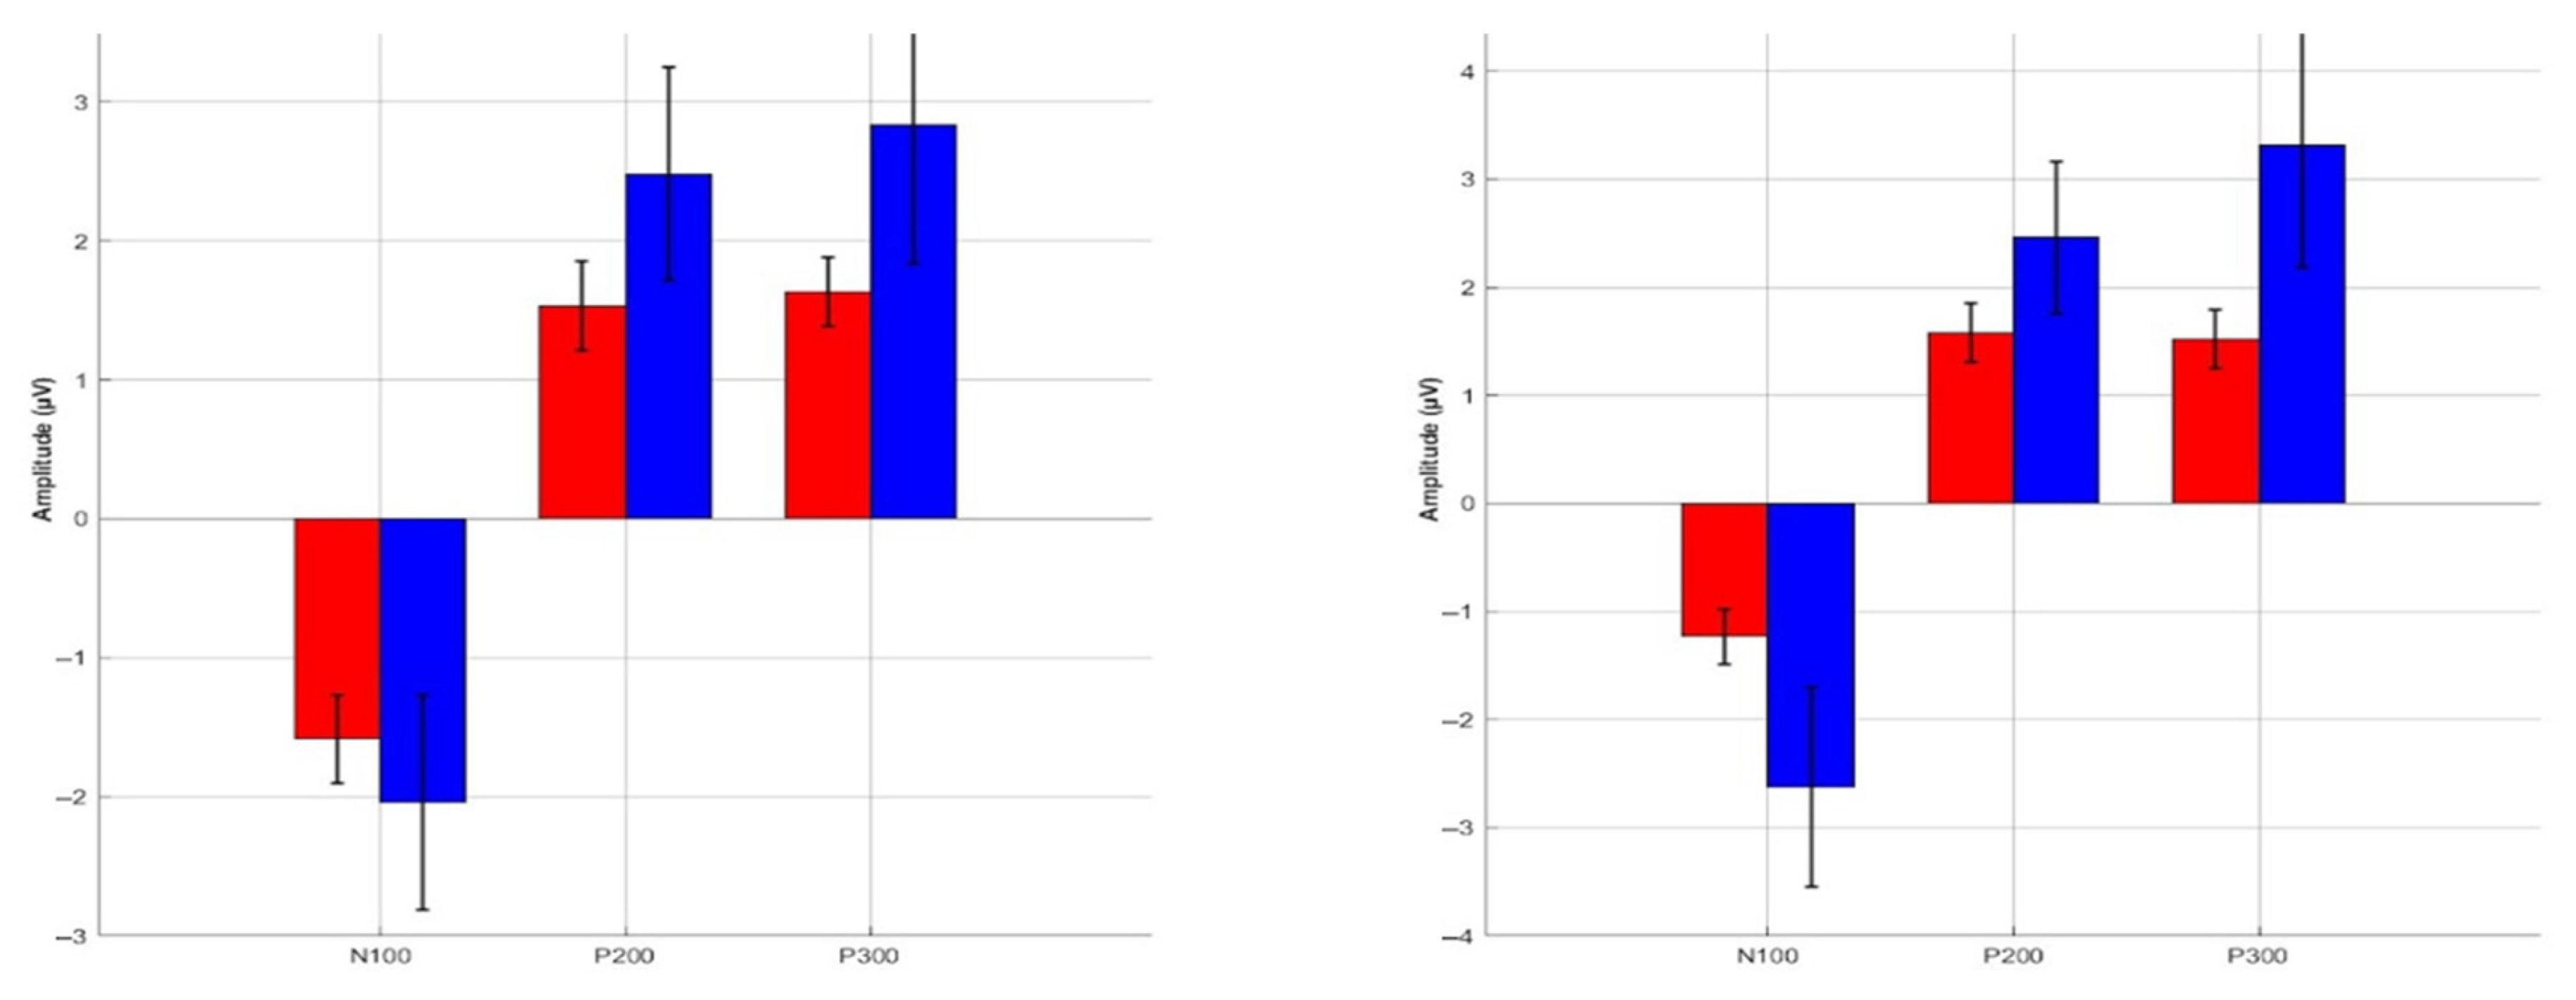
3.3. ERP Component Amplitudes

Table 3 presents the average ERP amplitudes for the major defined ERP components of interest (N100, P200, and P300) across all channels for both the SCI and control groups. This quantitative comparison offers a clear overview of the group differences in cortical responses during the motor imagery task. For the N100 component, amplitude values were relatively consistent across groups in most channels, indicating that early sensory processing might remain largely preserved following SCI. Non-significant trends were observed at AF3, AF4, O1, O2, F3, and F4 (lower amplitudes for SCI patients) and at T7 and T8 (higher amplitudes for SCI patients). Similarly, the P200 and P300 components did not show statistically significant differences. Non-significant trends were observed at F4, P7, O1 (lower amplitudes for SCI patients) and at T7 and T8 (higher amplitudes for SCI patients) (Figure 6). However, the P200 component showed more pronounced amplitude differences, particularly at the T8 channel, where the SCI group exhibited higher average amplitudes compared to controls. These observations align with the statistically significant result shown in Figure 4, indicating altered cortical processing in temporal regions related to motor planning or sensory integration. Since most of the observed amplitude variations were not statistically significant, this emphasizes the importance of cautious interpretation of ERP data at the wavelength level.

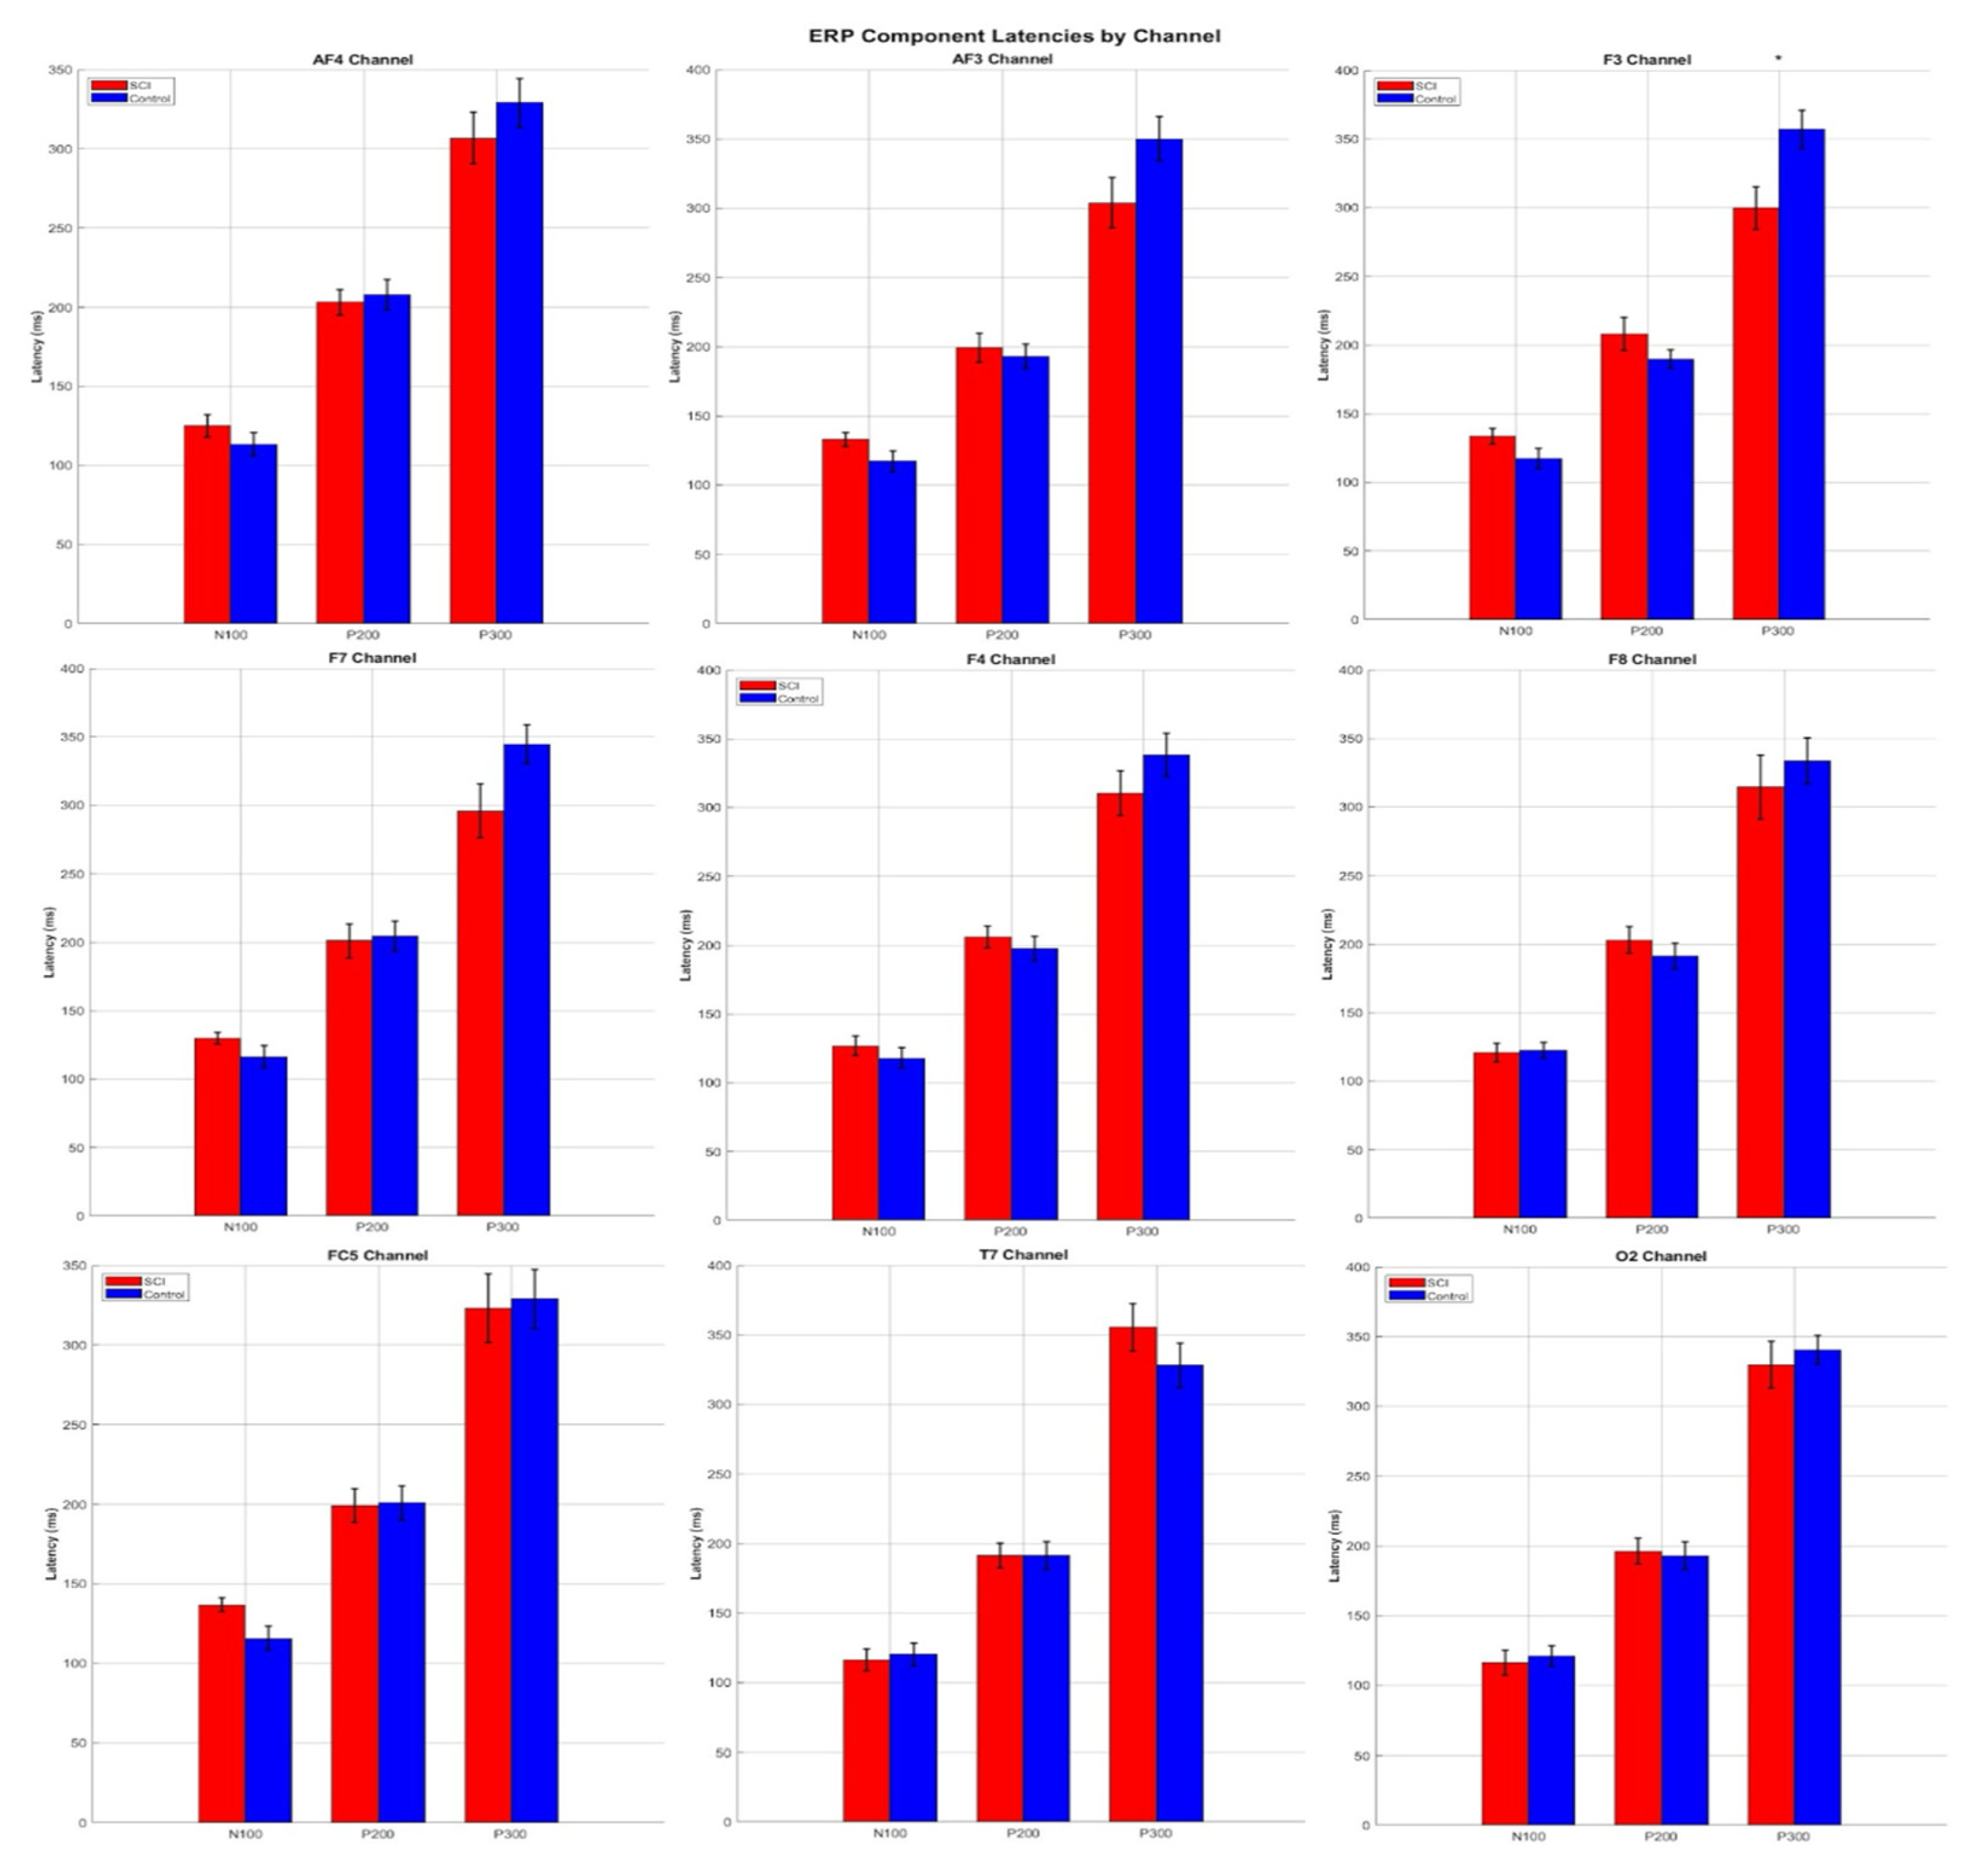
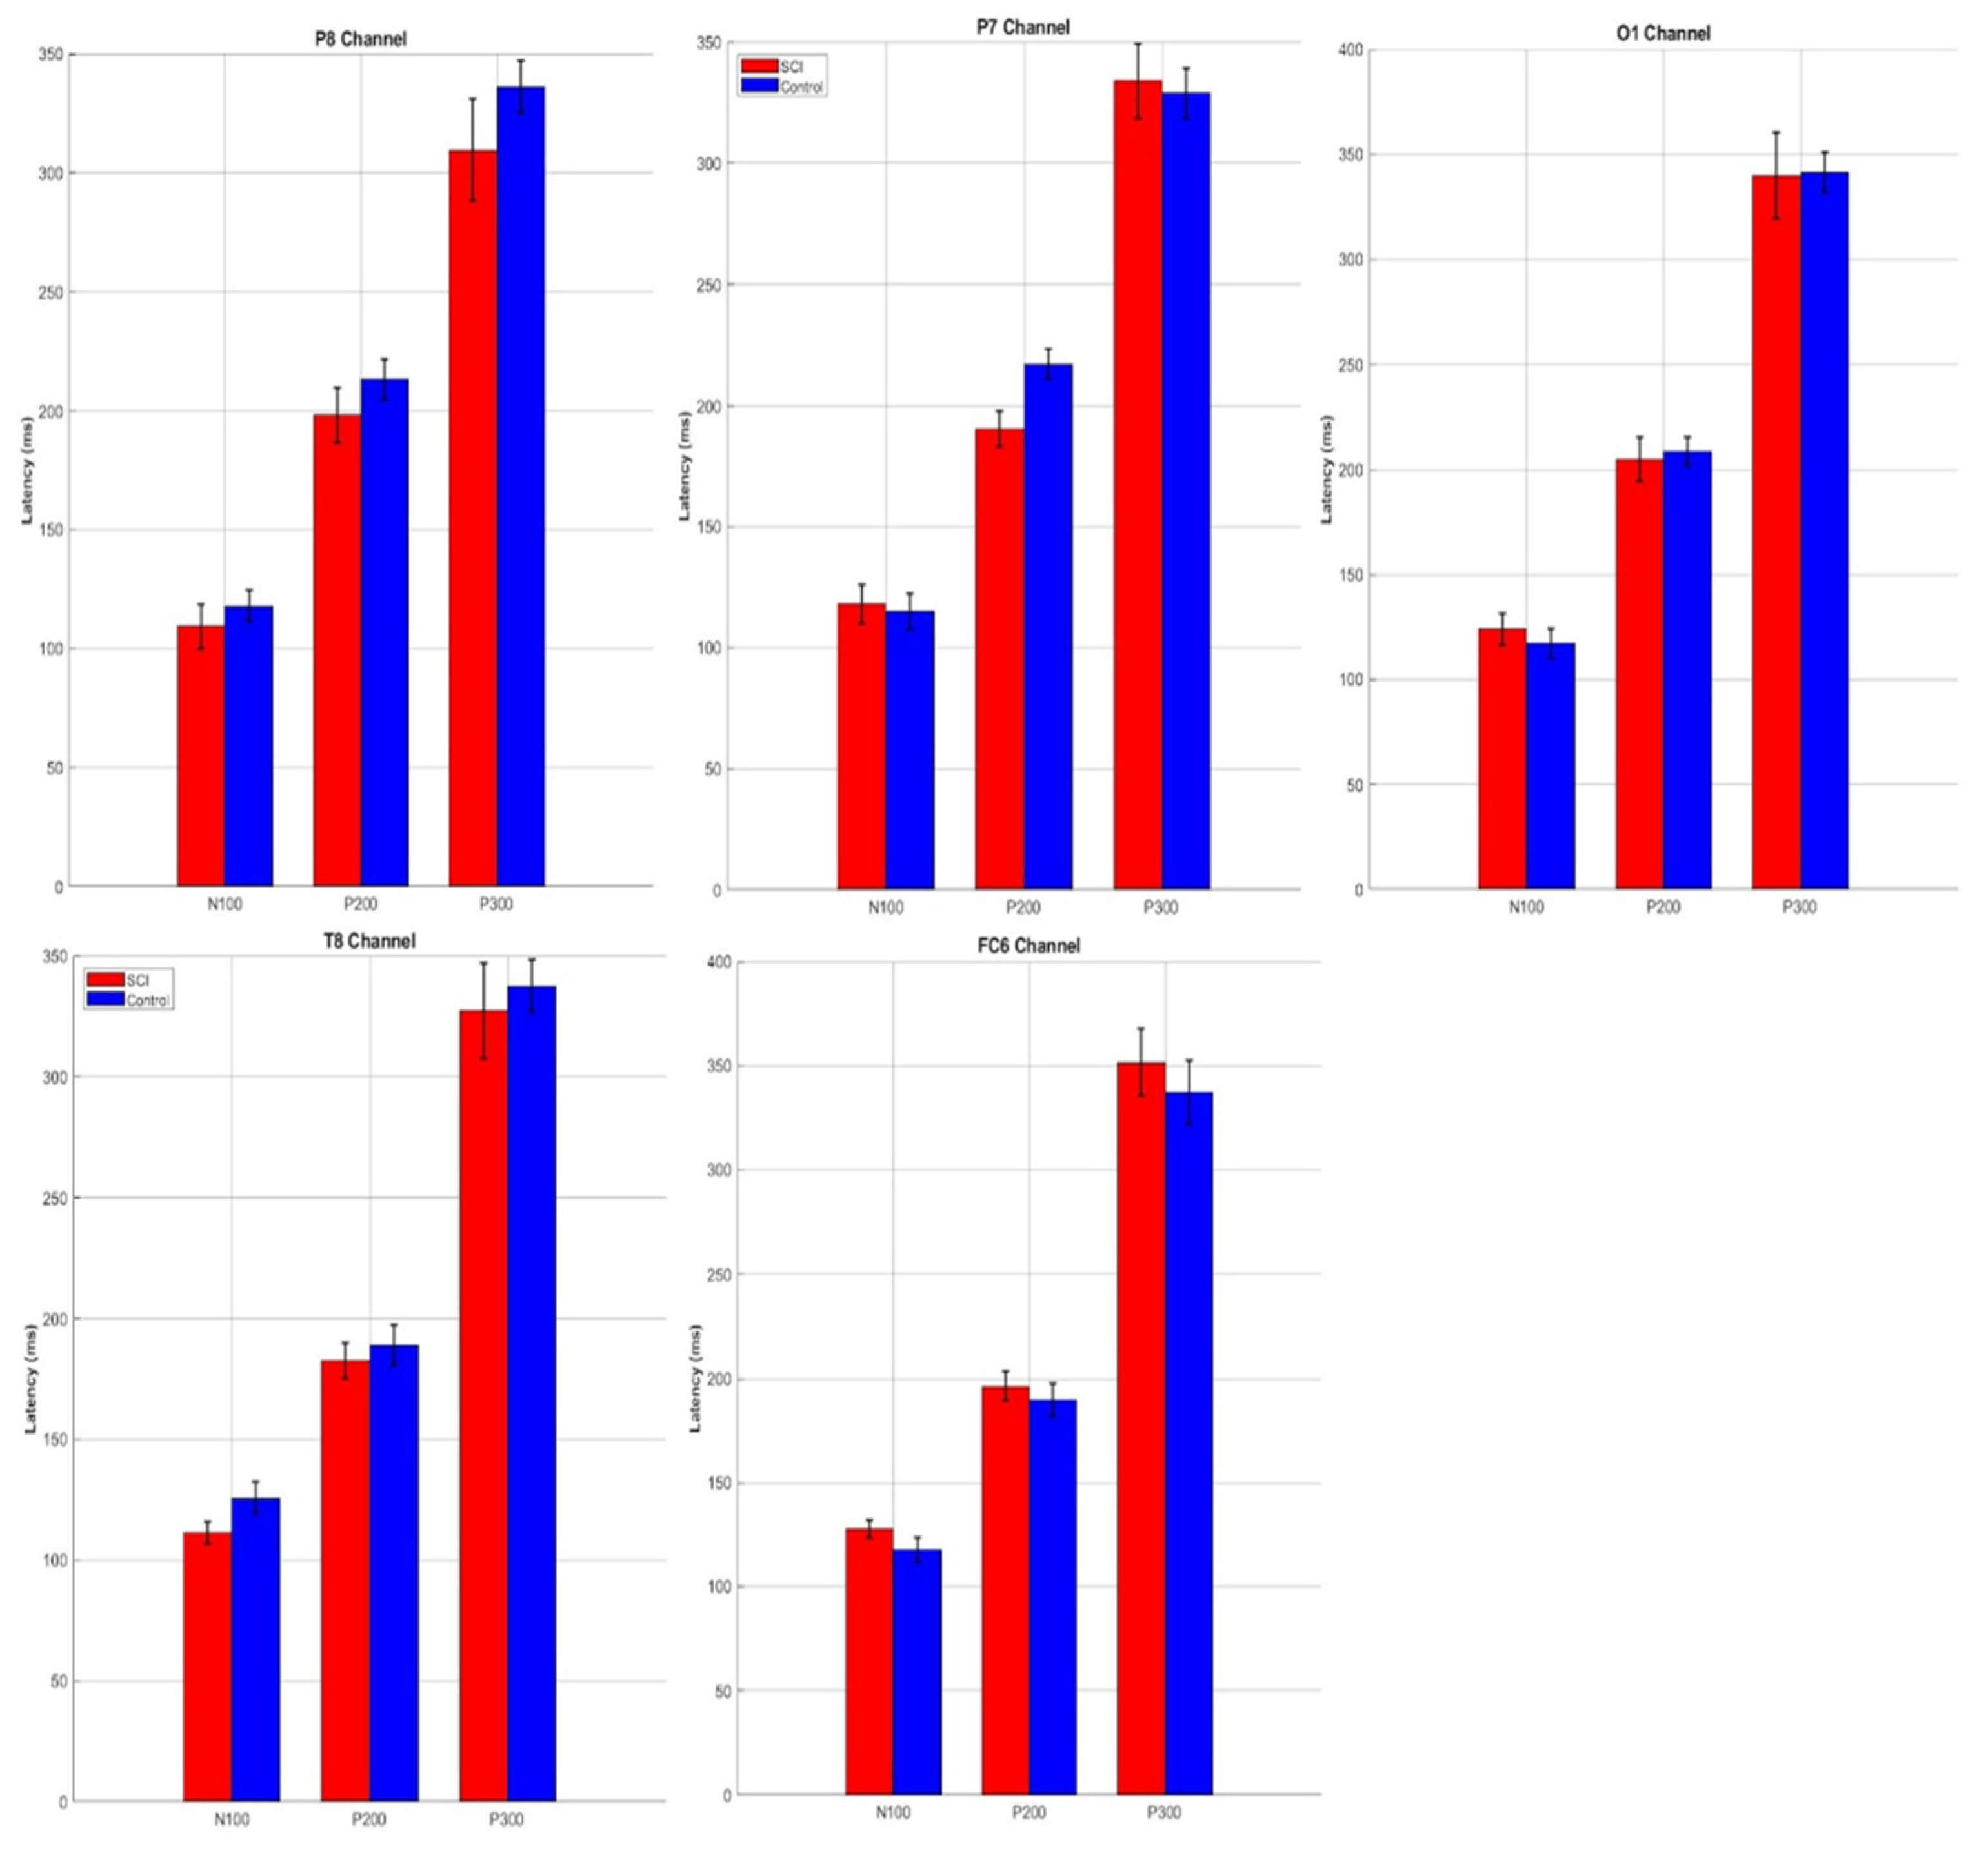
3.4. ERP Component Latencies

As shown in Table 4, participants with SCI appear to exhibit delayed latencies across the N100, P200, and P300 components at nearly all channels when compared to healthy controls. Although these shifts suggest trends toward altered cortical processing in the SCI group, none of the observed latency differences reach statistical significance (p > 0.05), except for P300 at F3 (lower latency for SCI patients). The non-significant observed trends were for N100 at FC5 (higher latency for SCI patients) and at T8 (lower latency for SCI patients), for P200 at P7 (lower latency for SCI patients), and for P300 at P8 and P7 (lower latency for SCI patients) (Figure 7). The SCI P300 latencies also appeared shortened, albeit non-significantly, in posterior channels (O1, O2), which are commonly implicated in cognitive evaluation processes.
These trends in N100, P200, and P300 delays may indicate subtle disruptions in sensory attention and early sensorimotor integration. Despite the lack of statistical significance, these trends align with findings from previous ERP studies in SCI populations [10,11,14] and could reflect subclinical alterations in information processing speed due to stress and neural reorganization. Further research with larger samples may be required to determine whether these differences attain statistical and clinical relevance.

4. Discussion

4.1. Key Contributions and Analysis Pipeline

The current study aimed to investigate the temporal cortical dynamics of KMI in individuals with SCI through post hoc analysis of ERP key components—specifically N100, P200, and P300—compared to healthy individuals. Primarily, our findings revealed no statistically significant differences in mean amplitude and latency across most EEG channels for any of the key ERP components we studied, hinting at a relative preservation of temporal dynamics of the cortical sensorimotor network in the recruited SCI patients during MI tasks. Since the patients had exhibited a generally positive neurological outcome following their injury, this overall temporal dynamics preservation can also be attributed to adaptive neural plasticity mechanisms [33]. The absence of significant differences in the N100, P200, and P300 components across widely distributed EEG channels (in frontal, frontocentral, parietal, and temporal areas) reinforces the hypothesis that the relative preservation of motor-related cortical activity in SCI patients could be also contingent upon injury severity and neurological outcome, aligning with studies demonstrating feasible cortical motor planning and sensorimotor integration processes in incomplete spinal cord damage [7]. A notable exception was observed in the P200 component, especially at the T8 channel, which demonstrated significantly increased signal amplitude in the SCI group. These results, interpreted with caution, should contribute to the broader understanding of cortical reorganization following SCI and its implications for motor-related brain activity under BCI control.
Another key contribution of our study lies in the comparative assessment of ERP extraction and classification performance against prior methodologies applied in SCI populations. Earlier studies employing standard ICA-based artifact removal pipelines have reported inconsistent detection of changes among the key ERP components, particularly in the P300, as well as relatively modest classification accuracies [11,14,34]. For instance, Cohen et al. [11] observed reduced P300 amplitudes but no consistent changes in latency, while Lazzaro et al. [14] reported diminished amplitudes without discussing their practical use in classification. These inconsistencies in the literature could be partially attributed to methodological variability across studies—including differences in preprocessing, ERP time windows, and task paradigms, as well as to individual patient characteristics, such as injury level and neurological outcome. The present study builds upon these findings by implementing a pipeline combining ASR and ICA, which improves signal quality and component separation. In our data, this approach yielded consistent identification of N100, P200, and P300 components across all SCI participants, as well as increased ERP classification performance compared to the results for classic studies in the literature [10,11].
Regarding the parameter tuning for our pipeline, the selection of the 8–30 Hz frequency range is grounded in neurophysiological principles governing motor imagery tasks. This range encompasses the motor imagery-relevant frequency bands, including mu rhythms (8–12 Hz) and beta rhythms (13–30 Hz), which exhibit event-related desynchronization (ERD) and synchronization (ERS) patterns during KMI. Recent optimization studies have confirmed that this frequency range maximizes motor imagery classification accuracy while minimizing noise inclusion from low-frequency artifacts and high-frequency electromyographic contamination [35]. The high-pass filter order of 22 provides adequate attenuation of low-frequency artifacts while minimizing phase distortion and ringing artifacts that can compromise ERP component morphology [36]. The low-pass filter order of 6 balances high-frequency noise rejection with computational efficiency, critical for real-time BCI applications [37]. This configuration represents an optimal trade-off between filter sharpness and processing delay, as demonstrated through systematic filter design optimization in motor imagery BCI systems. In temporal domain parameters, the 0–1000 ms analysis window captures both early sensory processing components (N100, P200), occurring within 250 ms post-stimulus, and later cognitive components (P300), essential for motor imagery discrimination. (Extending the window beyond 1000 ms introduces minimal additional discriminative information while substantially increasing computational burden). The selection of component-specific windows (N100: 50–150 ms, P200: 150–250 ms, P300: 250–400 ms) is based on ERP literature documenting typical latency ranges for these components in motor imagery paradigms. These windows accommodate inter-individual variability in component latencies while maintaining specificity for accurate amplitude and latency measurements [38]. Finally, the peak detection threshold of 2.5 times the baseline root mean square (RMS) amplitude represents an empirically validated criterion that optimizes the balance between sensitivity and specificity in ERP component detection. This threshold effectively discriminates neural signals from background noise while minimizing false positive detections that can compromise subsequent analyses. Systematic threshold optimization studies have demonstrated that values below 2.0 × RMS result in excessive false positives, while values above 3.0 × RMS lead to missed genuine components [39].

4.2. Neurophysiological Context for ERPs in BCI After Spinal Cord Injury

The N100 component, an early negative deflection associated with early sensory registration, attention allocation, and stimulus-driven processing, did not show significant differences between SCI patients and controls across any EEG channels. This N100 preservation suggests that primary cortical responses to sensory stimulation, particularly in visual and somatosensory domains, may remain intact despite SCI [40,41]. This finding partially contrasts with the results in the study of Vastano et al. [8], who reported reduced parieto–occipital P100 and N100 responses—especially with regards to body representation—and Ament et al. [10], who also reported a significant attenuation of the N100 component in SCI patients, as well as significant increases in the latency of the N100 component, suggesting overall impaired cortical responsiveness at the early sensory stages, both findings that we did not observe during our analysis. That contrast could be attributed to differences in the studied population characteristics of our study, namely the neurological outcome after chronic SCI, enhancing the hypothesis that preservation of these dynamics is dependent on injury severity. We also observed non-significant amplitude changes at the occipital electrodes (O1, O2), although outside the component window, potentially reflecting somewhat delayed visual processing. Overall, our observations suggest that cortical sensory pathways can retain functional capacity, likely through preserved cortico-cortical communication or cross-modal plasticity [42]. Thus, preserved N100 responses could indicate that early perceptual processing remains accessible for BCI decoding in SCI populations.
The P200 component, which reflects early attentional engagement and stimulus evaluation, was largely unaffected across most channels in our analysis as well, except for a significant increase in P200 amplitude at the T8 channel that was observed in the SCI group. This difference aligns with research [10] suggesting disruptions in early auditory and tactile processing following SCI but also implicates possible right temporal cortex reorganization. Given T8’s proximity to the auditory cortex (BA 41/42), this may reflect compensatory multisensory integration during KMI [43,44,45,46]. Alterations in P200 amplitude have been linked to changes in selective attention and stimulus evaluation, likely influenced by the loss of afferent sensory feedback [8,10]. The localized effect at T8, a temporal region, may reflect compensatory cortical adaptations within somatosensory and motor integration networks.
The P300 component is widely associated with contextual updating, decision making, and working memory operations [4,47]. In our study, no significant differences were found in P300 amplitude between SCI and healthy participants, in contrast with previously reported reduced amplitude in tactile P300 [10,11,14] and in some cases, delayed latencies in SCI individuals. Reduced P300 amplitude reflects a diminution in attentional resources needed for memory-updating processes—a common issue in disrupted sensorimotor networks [43]. Regarding P300 latency, at all channels, as well at T8 for both groups, the results fall within normative ranges for motor imagery tasks, suggesting intact executive function networks [4,48,49], and our data do not confirm a statistically significant reduction in P300, in line with previous research [11], while differing from other research showing delayed ERP responses in more cognitively demanding paradigms [12,13]. Some of our non-significant observations occurred outside standard ERP time windows, potentially indicating compensatory cortical activity or task-specific reorganization. In our sample, the preserved P300 (the attenuation in central-parietal electrodes was not statistically significant) may suggest that MI-related cognitive processing remains intact, despite spinal damage. This may indicate a retention of top-down attentional and evaluative functions, contingent to neurological outcome, supporting the viability of BCI-based cognitive–motor rehabilitation in SCI populations.
Overall, the results could support two complementary neuroplastic mechanisms: (a) intact widespread sensorimotor networks as preserved ERPs over the whole scalp and especially over motor channels (F3, FC5, F7) suggest adaptive plasticity of primary motor circuits [33], and (b) compensatory temporal area reorganization, as enhanced T8 P200 implies secondary sensory areas augmenting motor planning. The T8 activation could also represent increased reliance on auditory–spatial processing during impaired MI. The lack of widespread ERP alterations suggests that MI remains a viable approach for engaging cortical motor areas, even after injury of corticospinal pathways. This has significant implications for the development of BCI systems targeting motor rehabilitation. Preserved ERP responses during MI tasks indicate that SCI patients may retain the ability to generate robust neural signals, which can be harnessed for BCI-based neurorehabilitation [13,50].

4.3. Limitations and Future Work

This study presents several limitations that should be considered when evaluating the results and planning relevant future research. First, the sample size (n = 18, 10 patients) is on the smaller side, although comparable to the other EEG studies with SCI patients in the presented literature, potentially limiting the generalizability and statistical power of our results. Further validating the low-resolution EEG of the commercial BCI device against higher-density EEG recordings with broader coverage over central EEG areas, while recruiting a larger cohort of SCI patients for a new experiment, as well as collecting longitudinal data, would provide further ecological validity and broader applicability for our conclusions. SCI neurophysiological research and clinical trials face systemic, sociocultural, and research-associated barriers and frequently suffer from difficulty in recruiting wide and diverse patient cohorts [51], often limiting the generalization of their findings beyond populations with narrow similar individual patient characteristics, tasks, and analyses. In our study, most patients also displayed a positive neurological outcome, as previously described [21,22]. Future research should involve larger and more balanced samples to increase the robustness of ERP-based findings in patients with SCI. Furthermore, our sample included individuals with varying degrees and types of SCI, which may have introduced heterogeneity in cortical responses. Given that the severity and completeness of SCI can significantly influence neural activation patterns, future studies should investigate those variables. Similarly, the post-injury duration should be carefully controlled, as prior research has shown that prolonged time since injury may degrade MI capabilities [52].
Our analysis was conducted in sensor space (electrode-level EEG data), which lacks the spatial specificity offered by source-space (cortex data) analysis. Indeed, ERPs’ most notable intrinsic limitation lies in their poor spatial resolution. Since no source localization was performed in addition to the ERP analysis, the overall anatomical specificity of our findings is restricted, and the neurophysiological interpretations are limited to broad sensor space areas and interactions rather than specific cortical activations and interactions [53], and as such, our discussion cannot attempt related interpretations. The electrodes signal employed was also derived from the electrodes available in the commercial headset, which markedly omits purely central EEG electrode areas (frontocentral, central, centroparietal) that overlie the sensorimotor cortical regions. The 14-channel Emotiv system also provides limited coverage (56.7% of 10–20 sites [14/25]) compared to that of high-density arrays, and critical motor areas like C3/C4 are not recorded. Nonetheless, the specific commercial EEG–BCI headset is popular in sensorimotor BCI research, including for sensorimotor BCI tasks [54]. Furthermore, although the EEG device we used in our experiments (the Emotiv EPOC) is a commercial solution that has been extensively tested and is still implemented in motor related BCIs [55], as the electrode montage of the device itself does not include central electrodes, lacking direct overlay coverage over key motor areas, it has been previously suggested that it should be used with caution in classic BCI paradigms [56]. Future research should apply source reconstruction methods to evaluate the involvement of motor and sensory cortical networks more thoroughly and to achieve a better understanding of the neuroanatomical substrates underlying MI in SCI.
Noise contamination, especially from muscular (EMG) and cardiac (ECG) activity, remains a technical limitation in EEG recordings. Although ICA was used to minimize artifacts, residual EMG artifacts from facial muscles could influence temporal lobe signals, while it may remove genuine neural activity along with artifacts [57]. EMG or ECG recordings would allow for more accurate identification and removal of physiological noise. EMG co-registration in particular would be critical to distinguish true MI from physical movements. Further signal analysis-related limitations may be derived from the KMI paradigm and the inclusion of sensorimotor-related alpha and beta rhythms (8–30 Hz). Signal attenuation near cutoff frequencies may compromise ERP components with spectral content outside this range. Phase distortions from infinite impulse response (IIR) filters can shift ERP component timing (N100, P200, P300), and spectral leakage from sharp filter transitions may introduce ringing artifacts [36,58]. Moreover, N100 and P300 both contain frequency content below 8 Hz that may be attenuated [59]. Above 30 hz gamma oscillations, while not included in the analysis, may also be completely missed due to the inherent 128 hz sampling rate of the headset, affecting temporal precision of the analysis.
Future studies could also expand the MI paradigm, including variations in task conditions such as speed modulation, multiple joint movement, or performing imagery in diverse recording environments. These variations may reveal alterations in the activation of visual and sensorimotor areas, which are relevant for improving the efficacy of BCI applications. Additionally, comparing kinesthetic and visual MI would offer insights into modality-specific cortical processing and further enhance BCI design. Implementing high-density electrode arrays (64–128 channels) may improve spatial resolution and enable more sophisticated source localization techniques [23] for enhanced MI classification [60]. Consequently, while the current findings offer valuable insights into ERP components during MI in SCI patients, the field remains broad and evolving. Addressing these limitations in future studies will enhance the interpretability of neurophysiological data and support the development of more effective BCI systems for motor rehabilitation. Investigating the potential for closed-loop neurofeedback training to enhance MI ERP amplitude and consistency may improve long-term BCI outcomes [61]. Integrating ERP measurements with other neurophysiological markers (e.g., functional connectivity, oscillatory activity) may provide more comprehensive assessments of MI capability and BCI readiness [62]. Finally, developing machine learning algorithms that can adapt to changing neural signatures in real time will be crucial for maintaining consistent BCI performance across extended use periods [63].

5. Conclusions

We performed a post hoc analysis of EEG ERP components recorded during KMI performed for the control of bimanual anthropomorphic robotic arms by SCI patients and healthy control individuals. Our analysis demonstrates that essential motor planning circuits remain largely functional despite anatomical damage to descending pathways. Primarily, our findings revealed no statistically significant differences (p > 0.05) in mean amplitude and latency across all EEG channels for any of the key ERP components (N100, P200, and P300) we studied, with the notable exception in the post hoc analysis of P200 at the T8 channel, which demonstrated a significantly increased (p = 0.0346) signal amplitude in the SCI group. These findings hint at a relative preservation of the temporal dynamics of the cortical sensorimotor network in the recruited SCI patients during MI tasks. The main contributions of this work are that it proposes a replicable preprocessing pipeline for ERP enhancement in noisy or clinical EEG data, it presents a comparative evaluation of ERP features between SCI patients and healthy control individuals, and it offers quantitative insights into the feasibility of non-invasive ERP-based BCIs for motor intention decoding in SCI populations. The study’s main limitations include (a) the relatively small sample size (n = 18, 10 patients) that hampers the generalization of our findings, (b) the sensor-space analysis that restricts anatomical specificity and neurophysiological interpretations, and (c) the use of a commercial low-density EEG headset (14 channels) lacking coverage over the central EEG regions (available channels in AF, F, FC, T, P, and O electrode sites). Future research should investigate the relationship between clinical factors—such as injury level, injury severity, and chronicity—and ERP characteristics. It should also integrate concurrent physiological measurements alongside source-space EEG analyses to enhance anatomical specificity and develop more personalized and reliable BCI interventions. Additionally, longitudinal studies examining changes in ERP components during BCI training could provide valuable insights into the mechanisms of neural plasticity and motor learning in SCI patients.

Supplementary Materials

The following supporting information can be downloaded at: https://www.mdpi.com/article/10.3390/electronics14153106/s1, Figure S1: Brain–robot interface loop, using a wireless commercial EEG device for unobtrusiveness and simplicity of the system; Figure S2: The experimental setup in Thess-AHAL. (a) SCI subject seated across from the TV/computer monitor and between two robotic arms, wearing a wireless commercial EEG device; (b) close-up of a “Mercury 2.0” house-built robotic arm; (c) the right robotic arm, showing eight possible DoFs, grouped into proximal and distal movements; (d) the left robotic arm, showing DoFs that result in rotational or linear movement. Each DoF allows movement towards two possible directions.

Author Contributions

Conceptualization, M.S. and A.A.; methodology, M.S., T.G., V.T. and A.A.; software, M.S., T.G., V.T. and A.A.; validation, K.M., A.V., M.H. and A.A.; formal analysis, M.S., T.G., V.T. and A.A.; investigation, M.S., T.G., V.T. and A.A.; resources, P.D.B. and A.A.; data curation, P.D.B. and A.A.; writing—original draft preparation, M.S., T.G., V.T. and A.A.; writing—review and editing, M.S., T.G., V.T., K.M., A.V., M.H., P.D.B. and A.A.; visualization, M.S., T.G. and V.T.; supervision, A.V., M.H. and A.A.; project administration, P.D.B. and A.A.; funding acquisition, P.D.B. and A.A. All authors have read and agreed to the published version of the manuscript.

Funding

This research project was supported by the Hellenic Foundation for Research and Innovation (H.F.R.I.), https://www.elidek.gr (accessed on 15 December 2024), under the “2nd Call for H.F.R.I. Research Projects to Support Faculty Members & Researchers” (Project Number: 4391).

Data Availability Statement

Data will be made publicly available after the completion of the projects and will be accessible through the institutional project web page under an Attribution-NonCommercial-NoDerivatives 4.0 international license. Data of the analysis presented in the current manuscript and the related code can be made available via a request to the authors following a Memorandum of Understanding (MoU) in the context of the Open Research Initiative.

Acknowledgments

We would like to thank the members of the Biomedical Electronics Robotics and Devices (BERD) research group of the Medical Physics and Digital Innovation Lab, School of Medicine, Aristotle University of Thessaloniki, for their overall support.

Conflicts of Interest

The authors declare no conflicts of interest. The funding body had no role in the design of the study; in the collection, analyses, or interpretation of data; in the writing of the manuscript; or in the decision to publish the results.

Abbreviations

ANOVAAnalysis of Variance
ASRArtificial Subspace Reconstruction
BCIBrain–Computer Interface
BERDBiomedical Electronics Robotics and Devices Group
ECGElectrocardiography
EEGElectroencephalography
EMGElectromyography
ERPEvent Related Potential
FDRFalse Discovery Rate
FIRFinite Impulse Response
FWERFamily-Wise Error Rate
HFRIHellenic Foundation for Research and Innovation
ICAIndependent Component Analysis
IIRInfinite Impulse Response
KMIKinesthetic Motor Imagery
MIMotor Imagery
MoUMemorandum of Understanding
RMSRoot Mean Square
SCISpinal Cord Injury
SDStandard Deviation

References

  1. Athanasiou, A.; Klados, M.A.; Styliadis, C.; Foroglou, N.; Polyzoidis, K.; Bamidis, P.D. Investigating the Role of Alpha and Beta Rhythms in Functional Motor Networks. Neuroscience 2018, 378, 54–70. [Google Scholar] [CrossRef]
  2. Athanasiou, A.; Klados, M.A.; Pandria, N.; Foroglou, N.; Kavazidi, K.R.; Polyzoidis, K.; Bamidis, P.D. A Systematic Review of Investigations into Functional Brain Connectivity Following Spinal Cord Injury. Front. Hum. Neurosci. 2017, 11, 517. [Google Scholar] [CrossRef]
  3. Ruggiero, F.; Ferrucci, R.; Bocci, T.; Nigro, M.; Vergari, M.; Marceglia, S.; Barbieri, S.; Priori, A. Spino-Cerebellar tDCS Modulates N100 Components of the P300 Event Related Potential. Neuropsychologia 2019, 135, 107231. [Google Scholar] [CrossRef] [PubMed]
  4. Polich, J. Updating P300: An Integrative Theory of P3a and P3b. Clin. Neurophysiol. 2007, 118, 2128–2148. [Google Scholar] [CrossRef]
  5. Aguilar, J.; Humanes-Valera, D.; Alonso-Calviño, E.; Yague, J.G.; Moxon, K.A.; Oliviero, A.; Foffani, G. Spinal Cord Injury Immediately Changes the State of the Brain. J. Neurosci. 2010, 30, 7528–7537. [Google Scholar] [CrossRef]
  6. Kotchoubey, B.; Lang, S.; Winter, S.; Birbaumer, N. Cognitive Processing in Completely Paralyzed Patients with Amyotrophic Lateral Sclerosis. Eur. J. Neurol. 2003, 10, 551–558. [Google Scholar] [CrossRef]
  7. López-Larraz, E.; Trincado-Alonso, F.; Rajasekaran, V.; Pérez-Nombela, S.; del-Ama, A.J.; Aranda, J.; Minguez, J.; Gil-Agudo, A.; Montesano, L. Control of an Ambulatory Exoskeleton with a Brain–Machine Interface for Spinal Cord Injury Gait Rehabilitation. Front. Neurosci. 2016, 10, 359. [Google Scholar] [CrossRef]
  8. Vastano, R.; Widerstrom-Noga, E. Event-Related Potentials during Mental Rotation of Body-Related Stimuli in Spinal Cord Injury Population. Neuropsychologia 2023, 179, 108447. [Google Scholar] [CrossRef] [PubMed]
  9. Lyu, Y.; Guo, X.; Bekrater-Bodmann, R.; Flor, H.; Tong, S. An Event-Related Potential Study on the Time Course of Mental Rotation in Upper-Limb Amputees. Clin. Neurophysiol. 2017, 128, 744–750. [Google Scholar] [CrossRef]
  10. Ament, P.A.; Cohen, M.J.; Schandler, S.L.; Sowa, M.; Vulpe, M. Auditory P3 Event Related Potentials (ERP) and Brainstem Auditory Evoked Responses (BAER) after Spinal Cord Injury in Humans. J. Spinal Cord Med. 1995, 18, 208–215. [Google Scholar] [CrossRef] [PubMed]
  11. Cohen, M.J.; Ament, P.A.; Schandler, S.L.; Vulpe, M. Changes in the P300 Component of the Tactile Event-Related Potential Following Spinal Cord Injury. Spinal Cord 1996, 34, 107–112. [Google Scholar] [CrossRef] [PubMed]
  12. Lacourse, M. Cortical Potentials during Imagined Movements in Individuals with Chronic Spinal Cord Injuries. Behavioural. Brain Res. 1999, 104, 73–88. [Google Scholar] [CrossRef]
  13. Di Russo, F.; Aprile, T.; Spitoni, G.; Spinelli, D. Impaired Visual Processing of Contralesional Stimuli in Neglect Patients: A Visual-Evoked Potential Study. Brain 2008, 131, 842–854. [Google Scholar] [CrossRef] [PubMed]
  14. Lazzaro, I.; Tran, Y.; Wijesuriya, N.; Craig, A. Central Correlates of Impaired Information Processing in People with Spinal Cord Injury. J. Clin. Neurophysiol. 2013, 30, 59–65. [Google Scholar] [CrossRef] [PubMed]
  15. Zhang, R.; Wang, Q.; Li, K.; He, S.; Qin, S.; Feng, Z.; Chen, Y.; Song, P.; Yang, T.; Zhang, Y.; et al. A BCI-Based Environmental Control System for Patients With Severe Spinal Cord Injuries. IEEE Trans. Biomed. Eng. 2017, 64, 1959–1971. [Google Scholar] [CrossRef]
  16. Rupp, R. Challenges in Clinical Applications of Brain Computer Interfaces in Individuals with Spinal Cord Injury. Front. Neuroeng. 2014, 7, 38. [Google Scholar] [CrossRef]
  17. Mondini, V.; Sburlea, A.-I.; Müller-Putz, G.R. Towards Unlocking Motor Control in Spinal Cord Injured by Applying an Online EEG-Based Framework to Decode Motor Intention, Trajectory and Error Processing. Sci. Rep. 2024, 14, 4714. [Google Scholar] [CrossRef]
  18. Bamidis, P. HEROES: Human Extremity Robotic Rehabilitation and Outcome Enhancement for Stroke; Clinicaltrials.Gov: Bethesda, MD, USA, 2024.
  19. Bamidis, P. Brainwave Control of a Wearable Robotic Arm for Rehabilitation and Neurophysiological Study in Cervical Spine Injury; Clinicaltrials.Gov: Bethesda, MD, USA, 2020.
  20. Arfaras, G.; Athanasiou, A.; Pandria, N.; Kavazidi, K.R.; Kartsidis, P.; Astaras, A.; Bamidis, P.D. Visual Versus Kinesthetic Motor Imagery for BCI Control of Robotic Arms (Mercury 2.0). In Proceedings of the 2017 IEEE 30th International Symposium on Computer-Based Medical Systems (CBMS), Thessaloniki, Greece, 22–24 June 2017; IEEE: Piscataway, NJ, USA, 2017; pp. 440–445. [Google Scholar]
  21. Athanasiou, A.; Xygonakis, I.; Pandria, N.; Kartsidis, P.; Arfaras, G.; Kavazidi, K.R.; Foroglou, N.; Astaras, A.; Bamidis, P.D. Towards Rehabilitation Robotics: Off-the-Shelf BCI Control of Anthropomorphic Robotic Arms. BioMed. Res. Int. 2017, 2017, 1–17. [Google Scholar] [CrossRef]
  22. Athanasiou, A.; Arfaras, G.; Pandria, N.; Xygonakis, I.; Foroglou, N.; Astaras, A.; Bamidis, P.D. Wireless Brain-Robot Interface: User Perception and Performance Assessment of Spinal Cord Injury Patients. Wirel. Commun. Mob. Comput. 2017, 2017, 1–16. [Google Scholar] [CrossRef]
  23. Xygonakis, I.; Athanasiou, A.; Pandria, N.; Kugiumtzis, D.; Bamidis, P.D. Decoding Motor Imagery through Common Spatial Pattern Filters at the EEG Source Space. Comput. Intell. Neurosci. 2018, 2018, 1–10. [Google Scholar] [CrossRef]
  24. Moustakas, N.; Kartsidis, P.; Athanasiou, A.; Astaras, A.; Bamidis, P.D. Development of MERCURY Version 2.0 Robotic Arms for Rehabilitation Applications. In Proceedings of the 8th ACM International Conference on PErvasive Technologies Related to Assistive Environments, Corfu, Greece, 1–3 July 2015; pp. 1–4. [Google Scholar]
  25. Delorme, A.; Makeig, S. EEGLAB: An Open Source Toolbox for Analysis of Single-Trial EEG Dynamics Including Independent Component Analysis. J. Neurosci. Methods 2004, 134, 9–21. [Google Scholar] [CrossRef] [PubMed]
  26. CIMeC Wiki|Data Pre-Processing. Available online: http://wiki.cimec.unitn.it/tiki-index.php?page=Data+pre-processing (accessed on 12 June 2025).
  27. Nounou, M.N.; Bakshi, B.R. Multiscale Methods for Denoising and Compression. In Data Handling in Science and Technology; Elsevier: Amsterdam, The Netherlands, 2000; Volume 22, pp. 119–150. ISBN 978-0-444-50111-0. [Google Scholar]
  28. Mitra, S.K. Digital Signal Processing: A Computer-Based Approach, 2nd ed.; McGraw-Hill Series in Electrical and Computer Engineering; McGraw-Hill/Irwin: Boston, MA, USA, 2001; ISBN 978-0-07-232105-0. [Google Scholar]
  29. Miyakoshi, M. Artifact Subspace Reconstruction: A Candidate for a Dream Solution for EEG Studies, Sleep or Awake. Sleep 2023, 46, zsad241. [Google Scholar] [CrossRef] [PubMed]
  30. Kothe, C.A.; Makeig, S. BCILAB: A Platform for Brain–Computer Interface Development. J. Neural Eng. 2013, 10, 056014. [Google Scholar] [CrossRef] [PubMed]
  31. Hyvärinen, A.; Oja, E. Independent Component Analysis: Algorithms and Applications. Neural Netw. 2000, 13, 411–430. [Google Scholar] [CrossRef]
  32. Kim, H.-Y. Analysis of Variance (ANOVA) Comparing Means of More than Two Groups. Restor. Dent. Endod. 2014, 39, 74. [Google Scholar] [CrossRef]
  33. Athanasiou, A.; Terzopoulos, N.; Pandria, N.; Xygonakis, I.; Foroglou, N.; Polyzoidis, K.; Bamidis, P.D. Functional Brain Connectivity during Multiple Motor Imagery Tasks in Spinal Cord Injury. Neural Plast. 2018, 2018, 1–20. [Google Scholar] [CrossRef]
  34. Herbert, B.M.; Pollatos, O.; Schandry, R. Interoceptive Sensitivity and Emotion Processing: An EEG Study. Int. J. Psychophysiol. 2007, 65, 214–227. [Google Scholar] [CrossRef]
  35. Dagdevir, E.; Tokmakci, M. Optimization of Preprocessing Stage in EEG Based BCI Systems in Terms of Accuracy and Timing Cost. Biomed. Signal Process. Control 2021, 67, 102548. [Google Scholar] [CrossRef]
  36. Widmann, A.; Schröger, E.; Maess, B. Digital Filter Design for Electrophysiological Data—A Practical Approach. J. Neurosci. Methods 2015, 250, 34–46. [Google Scholar] [CrossRef]
  37. De Cheveigné, A.; Nelken, I. Filters: When, Why, and How (Not) to Use Them. Neuron 2019, 102, 280–293. [Google Scholar] [CrossRef]
  38. Kappenman, E.S.; Luck, S.J. The Effects of Electrode Impedance on Data Quality and Statistical Significance in ERP Recordings. Psychophysiology 2010. [Google Scholar] [CrossRef]
  39. Luck, S.J.; Gaspelin, N. How to Get Statistically Significant Effects in Any ERP Experiment (and Why You Shouldn’t). Psychophysiology 2017, 54, 146–157. [Google Scholar] [CrossRef] [PubMed]
  40. Näätänen, R.; Picton, T. The N1 Wave of the Human Electric and Magnetic Response to Sound: A Review and an Analysis of the Component Structure. Psychophysiology 1987, 24, 375–425. [Google Scholar] [CrossRef] [PubMed]
  41. Freund, P.; Weiskopf, N.; Ashburner, J.; Wolf, K.; Sutter, R.; Altmann, D.R.; Friston, K.; Thompson, A.; Curt, A. MRI Investigation of the Sensorimotor Cortex and the Corticospinal Tract after Acute Spinal Cord Injury: A Prospective Longitudinal Study. Lancet Neurol. 2013, 12, 873–881. [Google Scholar] [CrossRef] [PubMed]
  42. Collignon, O.; Vandewalle, G.; Voss, P.; Albouy, G.; Charbonneau, G.; Lassonde, M.; Lepore, F. Functional Specialization for Auditory–Spatial Processing in the Occipital Cortex of Congenitally Blind Humans. Proc. Natl. Acad. Sci. USA 2011, 108, 4435–4440. [Google Scholar] [CrossRef]
  43. Ritter, W.; Simson, R.; Vaughan, H.G. Event-Related Potential Correlates of Two Stages of Information Processing in Physical and Semantic Discrimination Tasks. Psychophysiology 1983, 20, 168–179. [Google Scholar] [CrossRef]
  44. Crowley, K.E.; Colrain, I.M. A Review of the Evidence for P2 Being an Independent Component Process: Age, Sleep and Modality. Clin. Neurophysiol. 2004, 115, 732–744. [Google Scholar] [CrossRef]
  45. Rademacher, J.; Morosan, P.; Schormann, T.; Schleicher, A.; Werner, C.; Freund, H.-J.; Zilles, K. Probabilistic Mapping and Volume Measurement of Human Primary Auditory Cortex. NeuroImage 2001, 13, 669–683. [Google Scholar] [CrossRef]
  46. Driver, J.; Noesselt, T. Multisensory Interplay Reveals Crossmodal Influences on ‘Sensory-Specific’ Brain Regions, Neural Responses, and Judgments. Neuron 2008, 57, 11–23. [Google Scholar] [CrossRef]
  47. Soltani, M.; Knight, R.T. Neural Origins of the P300. Crit. Rev. Neurobiol. 2000, 14, 199–224. [Google Scholar] [CrossRef]
  48. Comerchero, M.D.; Polich, J. P3a and P3b from Typical Auditory and Visual Stimuli. Clin. Neurophysiol. 1999, 110, 24–30. [Google Scholar] [CrossRef] [PubMed]
  49. Pfurtscheller, G.; Neuper, C. Motor Imagery and Direct Brain-Computer Communication. Proc. IEEE 2001, 89, 1123–1134. [Google Scholar] [CrossRef]
  50. López-Larraz, E.; Antelis, J.M.; Montesano, L.; Gil-Agudo, A.; Minguez, J. Continuous Decoding of Motor Attempt and Motor Imagery from EEG Activity in Spinal Cord Injury Patients. In Proceedings of the 2012 Annual International Conference of the IEEE Engineering in Medicine and Biology Society, San Diego, CA, USA, 28 August–1 September 2012; IEEE: Piscataway, NJ, USA, 2012; pp. 1798–1801. [Google Scholar]
  51. Blight, A.R.; Hsieh, J.; Curt, A.; Fawcett, J.W.; Guest, J.D.; Kleitman, N.; Kurpad, S.N.; Kwon, B.K.; Lammertse, D.P.; Weidner, N.; et al. The Challenge of Recruitment for Neurotherapeutic Clinical Trials in Spinal Cord Injury. Spinal Cord 2019, 57, 348–359. [Google Scholar] [CrossRef] [PubMed]
  52. Barbeau, H.; Norman, K.; Fung, J.; Visintin, M.; Ladouceur, M. Does Neurorehabilitation Play a Role in the Recovery of Walking in Neurological Populations? Ann. N. Y. Acad. Sci. 1998, 860, 377–392. [Google Scholar] [CrossRef]
  53. Gomez-Tapia, C.; Bozic, B.; Longo, L. Evaluation of EEG Pre-Processing and Source Localization in Ecological Research. Front. Neuroimaging 2025, 4, 1479569. [Google Scholar] [CrossRef]
  54. Salisbury, D.B.; Parsons, T.D.; Monden, K.R.; Trost, Z.; Driver, S.J. Brain–Computer Interface for Individuals after Spinal Cord Injury. Rehabil. Psychol. 2016, 61, 435–441. [Google Scholar] [CrossRef]
  55. Tarara, P.; Przybył, I.; Schöning, J.; Gunia, A. Motor Imagery-Based Brain-Computer Interfaces: An Exploration of Multiclass Motor Imagery-Based Control for Emotiv EPOC X. Front. Neuroinform. 2025, 19, 1625279. [Google Scholar]
  56. Fakhruzzaman, M.N.; Riksakomara, E.; Suryotrisongko, H. EEG Wave Identification in Human Brain with Emotiv EPOC for Motor Imagery. Procedia Comput. Sci. 2015, 72, 269–276. [Google Scholar] [CrossRef]
  57. Winkler, I.; Haufe, S.; Tangermann, M. Automatic Classification of Artifactual ICA-Components for Artifact Removal in EEG Signals. Behav. Brain Funct. 2011, 7, 30. [Google Scholar] [CrossRef]
  58. Acunzo, D.J.; MacKenzie, G.; Van Rossum, M.C.W. Systematic Biases in Early ERP and ERF Components as a Result of High-Pass Filtering. J. Neurosci. Methods 2012, 209, 212–218. [Google Scholar] [CrossRef]
  59. Tanner, D.; Morgan-Short, K.; Luck, S.J. How Inappropriate High-pass Filters Can Produce Artifactual Effects and Incorrect Conclusions in ERP Studies of Language and Cognition. Psychophysiology 2015, 52, 997–1009. [Google Scholar] [CrossRef] [PubMed]
  60. Michel, C.M.; Murray, M.M. Towards the Utilization of EEG as a Brain Imaging Tool. Neuroimage 2012, 61, 371–385. [Google Scholar] [CrossRef]
  61. Zoefel, B.; Huster, R.J.; Herrmann, C.S. Neurofeedback Training of the Upper Alpha Frequency Band in EEG Improves Cognitive Performance. Neuroimage 2011, 54, 1427–1431. [Google Scholar] [CrossRef]
  62. Babiloni, C.; Blinowska, K.; Bonanni, L.; Cichocki, A.; De Haan, W.; Del Percio, C.; Dubois, B.; Escudero, J.; Fernández, A.; Frisoni, G.; et al. What Electrophysiology Tells Us about Alzheimer’s Disease: A Window into the Synchronization and Connectivity of Brain Neurons. Neurobiol. Aging 2020, 85, 58–73. [Google Scholar] [CrossRef] [PubMed]
  63. Reuderink, B.; Mühl, C.; Poel, M. Valence, Arousal and Dominance in the EEG during Game Play. IJAACS 2013, 6, 45. [Google Scholar] [CrossRef]
Figure 1. The brain–computer interface (BCI) robotic arm training and classification trial procedure. DoF: degree-of-freedom; EEG: electroencephalography; KMI: kinesthetic motor imagery.
Electronics 14 03106 g001
Figure 2. Flowchart of the preprocessing, ERP extraction, and statistical analysis. ANOVA: analysis of variance; EEG: electroencephalography; FDR: false discovery rate; ICA: independent component analysis; SCI: spinal cord injury.
Electronics 14 03106 g002
Figure 3. Average EEG wavelength amplitudes from both SCI and healthy control participant groups. Black dots denote statistically significant differences between groups (p = 0.05).
Electronics 14 03106 g003aElectronics 14 03106 g003b
Figure 4. p-values from ANOVA between SCI and healthy control participant groups at time points corresponding to ERP components in every EEG channel. Dash line indicates p-value of 0.05. Asterisks (*) denote p-values below 0.05.
Electronics 14 03106 g004
Figure 5. Post hoc results for the T8 channel regarding the P200 ERP component. The means of the SCI and control group demonstrate a statistically significant difference (p = 0.05). Regarding our two groups comparison results, the p-value associated with the comparison between the two groups (control and SCI) was 0.0346, the mean difference between the two groups was 3.5211, and the upper limit of a confidence interval for the mean difference, which provides a range within which we can be confident that the true mean difference lies, was 7.0075.
Electronics 14 03106 g005
Figure 6. Boxplots demonstrating mean ERP component amplitude (N100, P200, P300) at each channel from both SCI and healthy control participant groups. Asterisks correspond to statistically significant differences between groups (p = 0.05).
Electronics 14 03106 g006aElectronics 14 03106 g006bElectronics 14 03106 g006c
Figure 7. Boxplots demonstrating mean component latencies (N100, P200, P300) at each channel from both SCI and healthy control participant groups. Asterisks correspond to statistically significant differences between groups (p = 0.05). Observed latency differences did not reach statistical significance (p > 0.05), except for P300 at F3.
Electronics 14 03106 g007aElectronics 14 03106 g007b
Table 1. The table presents the ERP amplitudes range (in μV) across the selected EEG channels, comparing the SCI group to the healthy control participants group.
ChannelsSCI Group
Min (μV)
Control Group
Min (μV)
SCI Group
Min (μV)
Control Group
Max (μV)
AF3−6.70−6.564.287.77
F7−8.76−7.197.196.26
F3−4.82−5.742.795.35
FC5−5.89−6.564.375.25
T7−21.62−5.6019.725.55
P7−5.15−6.254.005.74
O1−5.07−5.663.25.49
O2−7.29−4.946.034.85
P8−7.99−5.967.055.02
T8−8.67−4.199.005.20
FC6−4.60−5.763.346.15
F4−5.94−14.193.9811.83
F8−7.08−4.885.414.31
AF4−5.68−6.663.574.76
Table 2. The table presents the ERP latencies range across the selected EEG channels, comparing the SCI group to the healthy control participants group.
ChannelSCI Group Min
(ms)
Control Group Min (ms)SCI Group Max
(ms)
Control Group Max (ms)
AF300320.31343.75
F700304.69375.00
F300398.44312.50
FC500382.81382.81
T700375.00390.62
P700351.56328.12
O100328.12367.19
O200398.44312.50
P800398.44390.62
T800375.00312.50
FC600328.12370.00
F400380.00375.00
F800367.19310.00
AF400310.00390.00
Table 3. Average, minimum, and maximum ERP amplitude for N100, P200, and P300 between SCI and healthy control participants for all channels.
ChannelsComponentsSCI
Min (μV)
SCI
Max (μV)
SCI
Mean (μV)
Control
Min (μV)
Control
Max (μV)
Control
Mean (mV)
AF3N100−5.24−1.35−2.97−17.27−0.75−5.68
P2002.264.193.410.7015.254.29
P3001.234.302.820.4416.554.43
F7N100−6.06−1.15−3.27−10.46−0.47−2.80
P2002.144.623.440.537.612.76
P3001.915.282.820.764.342.61
F3N100−4.35−0.67−2.13−11.20−0.65−3.29
P2000.983.992.580.716.982.43
P3000.853.302.010.496.592.21
FC5N100−3.85−1.40−2.36−8.98−0.26−2.65
P2001.504.212.810.286.012.15
P3000.204.452.140.239.602.72
T7N100−23.94−1.69−5.52−13.27−0.47−2.92
P2001.0329.146.000.408.022.34
P3000.6265.0710.040.769.892.60
P7N100−2.77−0.65−1.63−10.16−0.19−2.76
P2000.493.351.530.196.572.48
P3000.611.731.260.548.472.30
O1N100−2.35−0.58−1.27−15.08−0.52−3.19
P2000.492.581.580.768.032.46
P3000.161.771.110.9411.002.69
O2N100−3.98−1.15−1.98−12.86−0.69−3.80
P2000.704.962.620.969.353.03
P3000.783.842.411.0110.082.94
P8N100−4.86−0.55−2.38−6.66−0.71−2.79
P2000.906.682.730.855.222.21
P3000.526.682.580.464.952.21
T8N100−19.55−1.30−7.31−14.98−0.93−4.74
P2001.6515.955.981.666.003.47
P3000.5319.385.560.9913.664.00
FC6N100−8.48−0.75−3.51−7.19−0.43−3.30
P2001.8312.274.600.997.893.39
P3001.0510.053.290.906.332.79
F4N100−5.98−1.15−2.69−10.74−1.20−4.53
P2001.664.773.570.9130.487.07
P3000.193.552.410.8530.486.39
F8N100−5.05−1.47−3.09−14.89−1.36−4.98
P2001.244.983.210.9110.443.75
P3001.326.123.150.878.683.56
AF4N100−4.11−0.59−2.41−20.84−0.67−4.78
P2000.604.693.130.685.823.11
P3000.555.712.800.9712.343.31
Table 4. Average, minimum, and maximum ERP latency for N100, P200, and P300 between SCI and healthy control participants for all channels.
ChannelsComponentsSCI
Min (ms)
SCI
Max (ms)
SCI
Mean (ms)
Control
Min (ms)
Control
Max (ms)
Control
Mean (ms)
AF3N10054.69148.44109.3854.69148.44109.38
P200156.25250.00199.22156.25226.56192.97
P300250.00320.31281.25257.81320.31284.72
F7N10070.31148.44124.0254.69148.44101.56
P200156.25250.00201.17156.25250.00204.69
P300250.00304.69274.41250.00343.75300.78
F3N10054.69148.44116.2154.69148.44109.38
P200156.25250.00208.01156.25218.75189.84
P300257.81328.12290.04250.00343.75288.28
FC5N10070.31148.44130.8654.69148.4499.22
P200164.06250.00199.22156.25250.00200.78
P300250.00328.12289.06250.00343.75292.19
T7N10054.69132.81103.5254.69140.6293.75
P200156.25218.75191.41156.25250.00191.41
P300257.81328.12294.92250.00343.75296.88
P7N10062.50148.44112.3054.69148.4495.31
P200156.25226.56190.43179.69242.19217.19
P300250.00335.94288.09257.81343.75230.31
O1N10054.69148.44112.3054.69140.62100.00
P200171.88250.00205.08164.06234.38208.59
P300250.00328.12284.18273.44343.75314.06
O2N10070.31148.4498.6362.50148.44107.03
P200156.25234.38196.29156.25234.38102.97
P300250.00343.75302.73257.81343.75312.50
P8N10070.31148.4498.6362.50148.44105.47
P200156.25250.00198.24156.25250.00213.28
P300250.00296.88267.58257.81343.75303.12
T8N10054.69117.1998.8485.94148.44125.78
P200156.25210.94182.68164.06226.56189.06
P300250.00312.50282.23257.81343.75299.22
FC6N10062.50140.62110.3554.69140.62107.81
P200164.06226.56196.29156.25226.56189,84
P300250.00320.31291.02250.00343.75283.59
F4N10054.69148.44102.5454.69148.44110.16
P200179.69250.00206.05156.25250.00197.66
P300250.00328.12289.06250.00320.31282.03
F8N10054.69140.62102.5454.69140.62114.84
P200164.06242.19282.23156.25226.56278.91
P300250.00320.31367.19257.81320.31312.50
AF4N10054.69140.6299.6154.69140.62100.78
P200179.69250.00203.12164.06250.00207.81
P300250.00328.12291.99250.00320.31282.03
Disclaimer/Publisher’s Note: The statements, opinions and data contained in all publications are solely those of the individual author(s) and contributor(s) and not of MDPI and/or the editor(s). MDPI and/or the editor(s) disclaim responsibility for any injury to people or property resulting from any ideas, methods, instructions or products referred to in the content.

