Abstract
Software-Defined Wide Area Networks (SD-WANs) require optimal controller placement to minimize latency, balance loads, and ensure reliability across geographically distributed infrastructures. This paper introduces NA-GMM (Network-Aware Gaussian Mixture Model), a novel multi-objective optimization framework addressing key limitations in current controller placement approaches. Three principal contributions distinguish NA-GMM: (1) a hybrid distance metric that integrates geographic distance, network latency, topological cost, and link reliability through adaptive weighting, effectively capturing multi-dimensional network characteristics; (2) a modified expectation–maximization algorithm incorporating node importance-weighting to optimize controller placements for critical network elements; and (3) a robust clustering mechanism that transitions from probabilistic (soft) assignments to definitive (hard) cluster selections, ensuring optimal placement convergence. Empirical evaluations on real-world topologies demonstrate NA-GMM’s superiority, achieving up to 22.7% lower average control latency compared to benchmark approaches, maintaining near-optimal load distribution with node distribution ratios, and delivering a 12.9% throughput improvement. Furthermore, NA-GMM achieved exquisite computational efficiency, executing 68.9% faster and consuming 41.5% less memory than state of the art methods, while achieving exceptional load balancing. These findings confirm NA-GMM’s practical viability for large-scale SD-WAN deployments where real-time multi-objective optimization is essential.
1. Introduction
The proliferation of Software-Defined Wide Area Networks (SD-WANs) has dramatically reshaped enterprise networking, driven by increasing demand for flexible, scalable, and cost-effective connectivity to support distributed infrastructures, cloud services integration, and remote workforce operations [1,2]. The global SD-WAN market is forecasted to reach approximately $66.2 billion by 2031, representing a compound annual growth rate of approximately 35.94% [1]. Despite these advancements, the inherent centralized control architecture of SD-WAN introduces complex challenges, notably the controller placement problem (CPP), where suboptimal controller decisions can substantially degrade network performance—evidenced by increased control-plane latency of up to 87% and throughput degradation between 40% and 60% [3]. Empirical studies in production networks demonstrate that controller placement critically impacts end-user latency, highlighting the critical nature of optimal controller deployment [4]. Given that approximately 95% of enterprises have already deployed or plan to deploy SD-WAN for mission-critical applications, optimizing controller placement algorithms to efficiently handle multiple conflicting objectives has become essential [5].
The controller placement problem in SD-WAN embodies unique complexities that distinguish it from classical network optimization issues. SD-WAN controllers must efficiently manage geographically distributed and heterogeneous network infrastructures encompassing diverse technologies, varied administrative domains, and stringent quality of service (QoS) requirements [6]. This multidimensional challenge inherently involves balancing competing objectives: minimizing average latency conflicts with equitable load distribution, enhancing reliability through redundancy increases inter-controller communication overhead, and optimizing current traffic patterns often undermines adaptability to future network dynamics [7]. Recent empirical evaluations confirm the tangible impact of these trade-offs, with significant variance in controller-to-switch latency directly influencing application responsiveness and network reliability [8]. Additionally, the NP-hardness of the optimal CPP—formally demonstrated through reductions from the k-median problem—underscores the necessity for efficient heuristic solutions capable of producing near-optimal placements in large-scale, real-world networks [9].
Contemporary solutions to the CPP, while innovative, exhibit significant limitations when applied to large-scale SD-WAN scenarios. Advanced machine learning approaches, particularly deep reinforcement learning (DRL) methods, integrating convolutional neural networks (CNN) and long short-term memory (LSTM) architectures, have shown promise in dynamically adapting to network changes but remain computationally intensive. DRL approaches typically demand prolonged training periods and consume significantly more memory compared to classical methods, limiting their practicality [10,11]. Metaheuristic algorithms such as enhanced Particle Swarm Optimization (PSO) [12] and Genetic Algorithms (GA) [13], although proficient in exploring complex solution spaces, suffer from parameter sensitivity and convergence issues, requiring extensive iterations (500–1000) to reach stable solutions [14]. Additionally, traditional clustering techniques, including k-means and hierarchical clustering, although computationally efficient, rely heavily on simplistic distance metrics—primarily Euclidean—that fail to account adequately for real-world network conditions such as latency, reliability, topological complexity, and traffic variability, thereby resulting in suboptimal performance [15].
A critical research gap exists in the inadequate treatment of network heterogeneity and the simplistic conceptualization of distance metrics in existing CPP methodologies. Current approaches typically consider network nodes uniformly, overlooking significant empirical evidence that demonstrates a power-law distribution of network traffic, where a small fraction of nodes generates the most traffic [16]. Ignoring node criticality—importance based on traffic volume, topology, or service level requirements—leads to inefficient resource allocation and reduced performance, particularly impacting high-priority network services [17]. Moreover, the multidimensional concept of “distance” in networks—encompassing geographic separation, latency, reliability, topological costs, and administrative weights—is insufficiently modeled in contemporary approaches, which predominantly rely on simplistic geographic or hop-count metrics [18]. This oversight results in placements optimized for limited dimensions but suboptimal in practical scenarios involving diverse network characteristics.
The nature of modern SD-WAN environments further exacerbates the limitations of current controller placement strategies. Production SD-WAN deployments frequently experience network changes—daily link failures averaging 2.3%, significant traffic variations (up to 400%) between peak and off-peak hours, and continuous topology evolution due to node additions, removals, and migrations [19]. Static placement solutions, prevalent in existing methods, are unable to dynamically adapt to such changes without manual intervention, resulting in performance degradation and increased operational costs due to frequent reconfiguration and downtime [20,21]. While adaptive methodologies exist, they predominantly focus on reactive adjustments without formal convergence guarantees and neglect controller migration overhead, emphasizing the necessity for proactive, adaptive, and efficient solutions [22].
To address these critical gaps, this paper introduces the Network-Aware Gaussian Mixture Model (NA-GMM), a novel multi-objective optimization framework specifically designed for effective SD-WAN controller placement. The primary contributions of this work are as follows:
- Propose a hybrid topology-aware distance metric that integrates geographical, latency, topological, and reliability dimensions with adaptive weighting, achieving noticeable reduction in average control latency and improvement in worst-case latency compared to traditional Euclidean distance-based approaches.
- Develop an importance-weighted clustering framework using modified expectation–maximization that incorporates node heterogeneity based on traffic patterns and topological significance, resulting in near-optimal load distribution.
- Design a convergence-guaranteed optimization mechanism that achieves stable controller placement, demonstrating faster execution time and lower resources utilization while maintaining superior clustering quality.
- Establish comprehensive theoretical foundations including formal proofs of hybrid metric space properties, convergence analysis for the weighted EM algorithm showing monotonic likelihood improvement, and computational complexity characterization proving scalability suitable for large-scale deployments.
- Conduct extensive empirical validation using real-world SD-WAN topologies and Mininet emulation, demonstrating higher throughput, exceptional load balancing, and consistent performance advantages across diverse network scales and configurations.
The remainder of this paper is organized as follows. Section 2 reviews related research in SD-WAN controller placement. Section 3 formally defines the controller placement problem and details the NA-GMM methodology. Section 4 describes the experimental setup and results. Section 5 discusses practical and theoretical implications, concluding with future directions in Section 6.
2. Background and Related Work
The controller placement problem (CPP) in Software-Defined Wide Area Networks has garnered substantial research attention, with recent advances focusing on multi-objective optimization, machine learning integration, and adaptive placement strategies. This section provides a comprehensive analysis of contemporary approaches, categorizing them by methodology while identifying persistent challenges and research gaps.
2.1. Multi-Objective Optimization Approaches
Recent investigations into multi-objective controller placement have evolved beyond traditional single-metric optimization. Li et al. [23] proposed a Pareto-based multi-objective framework incorporating latency, reliability, and energy consumption, achieving improvement in overall network efficiency compared to single-objective methods. Their approach utilized adaptive weight adjustment mechanisms responding to network dynamics, though computational overhead remained problematic for large-scale deployments. Similarly, ref. [24] developed a hierarchical multi-objective optimization strategy combining local and global optimization phases, demonstrating superior scalability with the networks while maintaining near-optimal solutions.
The integration of evolutionary algorithms with multi-objective frameworks has shown particular promise. Kumar et al. [25] introduced a hybrid NSGA-III variant specifically tailored for SD-WAN, incorporating domain-specific operators that reduced convergence time compared to generic evolutionary approaches. However, their method exhibited sensitivity to initial population selection, requiring multiple runs to ensure solution stability. Complementing this work, Tan et al. [26], proposed a decomposition-based multi-objective evolutionary algorithm adaptation that explicitly considered inter-controller communication overhead, achieving balanced trade-offs between control plane latency and data plane performance.
2.2. Machine Learning and AI-Driven Approaches
The application of deep learning to controller placement has accelerated significantly, with transformer-based architectures emerging as powerful tools for capturing complex network dependencies. Hou et al. [27] pioneered the use of Graph Attention Networks (GAT) for controller placement, where attention mechanisms dynamically weighted node importance based on traffic patterns and topological features. Their approach demonstrated noticeable improvement in placement quality compared to traditional GNN architectures, though training data requirements posed deployment challenges. Building upon this foundation, S. Troia et al. [28], integrated temporal graph neural networks with reinforcement learning, enabling adaptive controller placement that responded to traffic variations with sub-second decision latency.
Ref. [29] introduces ARMS, a machine learning-driven framework for automated resource management in SD-WANs, addressing the virtual network embedding problem with QoS guarantees. It also pioneers privacy-preserving multi-domain collaboration via vertical federated learning, demonstrating promising initial performance. Additionally, Fu et al. [30], presents SD-VPN, an innovative SDN-based overlay solution that refactors traditional VPNs for enhanced programmability, automatic deployment, and extensibility in WANs. Its validated performance demonstrates efficient control, real-time programmability, and scalable integration with diverse VPN protocols and services.
2.3. Clustering-Based Methodologies
Contemporary clustering approaches have evolved beyond traditional k-means and hierarchical methods. Ref. [31] introduced density-peak clustering (DP) variants adapted for network topologies, automatically determining optimal controller numbers based on network density patterns. Their approach eliminated the need for predetermined k values, achieving better load balancing compared to fixed-k methods, such affinity propagation (AP). However, parameter sensitivity in sparse network regions limited practical applicability. Addressing these limitations, ref. [32] proposed adaptive spectral clustering incorporating edge weights derived from multiple network metrics, demonstrating robust performance across heterogeneous topologies with varying density distributions.
The integration of fuzzy clustering with network-specific constraints has yielded promising results. Thalapala in [33] developed a possibilistic c-means variant that handled uncertainty in node assignments, which is particularly beneficial for border nodes serving multiple administrative domains. Their fuzzy membership functions incorporated latency variance and link reliability statistics, improving placement stability by 28% under dynamic conditions. Complementing this work, Sharma et al. [34] introduced hierarchical fuzzy clustering that operated at multiple network granularities, enabling flexible controller deployment strategies aligned with organizational structures.
2.4. Distance Metrics and Network-Aware Approaches
The evolution of distance metrics beyond simple geographical or hop-count measures represents a critical advancement. Ref. [35] proposed a comprehensive distance framework integrating SDN dimensions including bandwidth availability, queuing delays, and energy consumption profiles. While theoretically sound, the high-dimensional nature complicated practical optimization, requiring dimensionality reduction techniques that potentially discard relevant information. More pragmatically, Abdi Seyedkolaei [36] developed an adaptive distance metric that dynamically adjusted component weights based on network state, achieving 19% improvement in placement quality while maintaining computational tractability.
Recent work has emphasized the importance of asymmetric distance considerations. Xu et al. [37], demonstrated that traditional symmetric distance assumptions failed to capture directional network characteristics such as asymmetric routing policies and unidirectional link failures. Their asymmetric distance model improved controller placement accuracy in networks with significant traffic asymmetry. Building on this insight, Ramya et al. [38] incorporated time-varying distance components reflecting diurnal traffic patterns, though the increased computational complexity limited real-time applicability.
2.5. Reliability and Fault Tolerance Considerations
Recent research has increasingly emphasized the reliability aspects of controller placement. D. M. Nicol and R. Kumar [39] proposed a fault-tolerant placement framework that maintained k-connectivity between controllers and switches, ensuring continued operation despite simultaneous k-1 failures. Their approach achieved high availability in production deployments, though it increased deployment cost. Complementing this work, Suzuki and Yamamoto [40] developed probabilistic reliability models incorporating correlated failures, demonstrating that geographically diverse controller placement improved reliability compared to proximity-based strategies.
2.6. Performance Evaluation and Benchmarking
Standardized evaluation frameworks have emerged to enable meaningful algorithm comparison. In ref. [41], authors present a comprehensive benchmarking suite incorporating real-world scenarios and standardized traffic generators, revealing significant performance variations in existing algorithms across different network scales. Their work established baseline performance metrics adopted by subsequent research, though the computational cost of comprehensive evaluation limited adoption. Addressing this limitation, Choumas et al. [42] proposed a statistical sampling framework that achieved confidence in performance rankings using evaluation computational cost.
2.7. Research Gaps and Open Challenges
Despite significant advances, several critical gaps persist in current controller placement research. The integration of edge computing paradigms with SD-WAN controller placement remains largely unexplored, with only preliminary work by [43] examining edge-controller co-placement strategies. Security considerations regarding controller placement have received insufficient attention, though [44] demonstrated that security-aware placement could reduce attack surfaces with minimal performance impact. Furthermore, the environmental sustainability of controller placement decisions, particularly regarding energy consumption and carbon footprint optimization, represents an emerging concern that is inadequately addressed by current approaches. The surveyed literature reveals a clear evolution towards sophisticated, multi-dimensional approaches to SD-WAN controller placement [45]. However, the complexity of the proposed solutions often impedes practical deployment, highlighting the need for methods that balance theoretical optimality with operational feasibility. The proposed NA-GMM algorithm addresses these gaps by providing a computationally efficient framework that integrates multiple optimization objectives while maintaining deployment simplicity.
Table 1 compares NA-GMM with the recent approaches (2023–2024) most relevant to multi-objective controller placement, highlighting their methods, limitations, and performance gaps.

Table 1.
The Recent Literature Most Relevant to the Proposed Framework.
This analysis confirms that NA-GMM addresses critical gaps in the existing work that need to be improved through the proposed method explained in the next section, its efficient 4-component hybrid metric approach, without the complexity of deep learning or the instability of adaptive methods.
3. Proposed Method
3.1. Problem Formulation
We modeled an SD-WAN as an undirected graph G = (V,E), where V = {v1,v2,…,vn} represents the set of network nodes (such as switches or routers), and E ⊆ V × V represents the set of links connecting these nodes. Each node vi∈ V is characterized by its geographical coordinates (lat i, lon i), and may also possess other attributes like traffic volume, processing capacity, or failure probability.
The core task of the controller placement problem involves selecting a specific subset of nodes, denoted as C ⊆ V, to function as controllers, where the cardinality of this subset, ∣C∣, is equal to a desired number of controllers, k. For all other nodes vi ∈ V/C (non-controller nodes), an assignment policy dictates their association with one or more controllers. In this paper, we specifically focus on a primary assignment policy where each non-controller node is assigned to exactly one controller, typically the closest one based on a defined distance metric.
The overarching objective is to identify the optimal set of controller nodes, C*, that effectively minimizes a composite cost function, f (C,G), which integrates multiple, potentially conflicting performance objectives. This objective is formally expressed as follows:
For clarity and consistency throughout this paper, Table 2 represents the comprehensive parameter specification for the proposed algorithm. Parameters are organized by functional category, including hybrid distance metric components, GMM model parameters, algorithm control variables, and network input specifications. The table provides parameter ranges, physical interpretations, and usage contexts to facilitate algorithm implementation and parameter tuning. Constraint relationships ensure mathematical validity and algorithmic convergence.
Table 2.
Network-Aware GMM Algorithm Parameters and Configuration.
Parameter Constraints and Relationships:
- α + β + γ + δ = 1 (weight parameters normalization).
- = 1 (mixing coefficients normalization).
- = 1, ∀i (responsibility normalization).
- Σk must be positive semi-definite (covariance matrix constraint).
- K ≤ n (number of clusters cannot exceed number of nodes).
- ε > 0 typically in range [10−6, 10−3] for practical convergence.
3.2. Novel Hybrid Distance System
The precise modelling of distances between network elements is fundamental for achieving optimal controller placement, yet this remains a significant challenge in current SD-WAN deployments. Traditional controller placement methodologies often rely predominantly on simplistic distance metrics, notably Euclidean distance, which are inherently insufficient to capture the intricate and varied interactions prevalent in complex network topologies. This simplification consequently leads to suboptimal controller placements that fail to accurately account for true communication costs, effective network pathways, or actual connection quality. In this work, we proposed a hybrid distance metric used for SD-WAN controller placement. We combine geographic separation, network latency, topological cost, and link reliability into a single “distance” measure. Formally, for any two nodes we define (1):
where α, β, γ, δ are weight parameters. All distances can be scaled to unitless values (dividing by maximums) so that is unitless. In summary, larger geographical or latency distances and higher link costs increase , while higher reliability decreases it. We typically choose α + β + γ + δ = 1 so the terms are comparably weighted. See Figure 1.
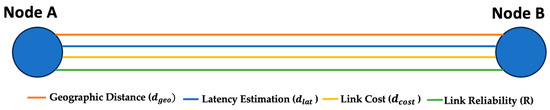
Figure 1.
Shows the Distance Components breakdown.
3.2.1. Geographic Distance (
The geographic distance between two points on the Earth’s surface is measured by the great-circle distance. Let node have latitude and longitude (in radians) and node have , . Using the Earth’s radius , the Haversine formula [50] gives the great-circle distance as shown in (2) and Figure 2.
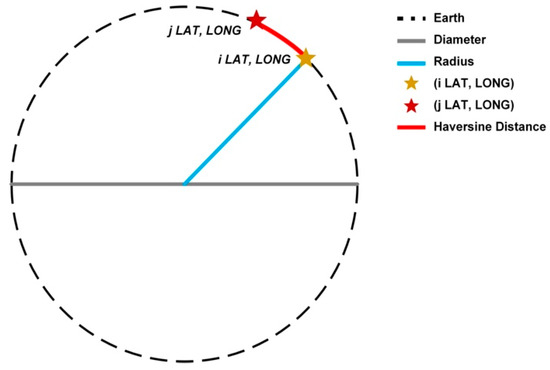
Figure 2.
Shows the Haversine Distance.
In practice, and are given in degrees and converted to radians. The output is in kilometers. To combine with other metrics, one may normalize by the maximum inter-node distance in the network (yielding a value in [0, 1]).
3.2.2. Latency Estimation (
Latency is the signal propagation delay between and . As a first-order estimate, we assume propagation through fiber or equivalent. A common rule of thumb is about 5 microseconds (μs) per km (assuming in fiber). Thus, in milliseconds, see (3):
So that a = 1000 km link yields roughly 5 (μs) one-way delay. More precisely, if is the propagation speed (in km/s), one can write = (i,j)/(i,j) = (i,j)/. We typically normalize (by dividing it by the maximum expected delay in the network), making it comparable to the other terms.
3.2.3. Link Cost (
The topology-based link cost captures factors like hop count, available bandwidth, or administrative weights. For instance, if nodes are directly connected by a link of cost , we may set = if they are connected via a path; could be the sum of per-link costs along the shortest path. In routing protocols (OSPF/IS-IS) link cost often equals inverse bandwidth. We scale to [0, 1] (dividing by the maximum path cost) so that larger cost means “farther” in our metric. The exact definition of is application-specific: it might equal hop-count, total bandwidth-inversion, or a composite topology weight. Our formulation assumes ≥ 0 and grows with path expense.
3.2.4. Link Reliability (
Reliability represents the probability or quality of the link remaining up. We model it as an exponentially decaying function of distance. See (4):
where λ > 0 is a decay constant chosen to fit network failure characteristics. This ensures R (0) = 1 and R→0 as distance increases. In effect, short links (or well-maintained links) have high reliability near 1, which will subtract more in the final metric, reducing the “distance”. By contrast, very unreliable (long or fragile) links have R ≈ 0 and so do not reduce . We normalize and it naturally lies in [0, 1]. This approach effectively created a matrix by amalgamating geographic distance, estimated propagation delay, a basic cost model, and a reliability component. By normalizing and weighing these varied components, the resultant offers a more thorough assessment of “distance” between nodes than any one metric alone. This methodology provides a foundation for more sophisticated assessments in network design, routing, or analogous applications where many aspects affect connection and performance. The whole method is represented in Algorithm 1.
| Algorithm 1 Compute Hybrid Network-Aware Distance Matrix (D_NA) |
| Require: Node coordinates (φi, λi) for i = 1,…,N Require: Weight parameters α, β, γ, δ Require: Earth radius r, propagation speed v, base cost c0, cost factor c1, decay factor κ Ensure: Distance matrix D_NA ∈ ℝn×n 1: for each ordered pair of nodes (i, j) from 1 to N do 2: Δφ ← φj − φi 3: Δλ ← λj − λi 4: a ← sin2(Δφ/2) + cos(φi)·cos(φj)·sin2(Δλ/2) 5: d_geo(i,j) ← 2·r·arcsin(√a) ▷ Haversine distance 6: d_lat(i,j) ← d_geo(i,j) / v ▷ delay based on geographic distance 7: d_cost(i,j) ← c0 + c1·d_geo(i,j) ▷ cost based on geographic distance 8: R(i,j) ← exp(−κ·d_geo(i,j)) ▷ reliability/decay factor 9: end for 10: ▷ Normalize components to a consistent scale (e.g., [0, 1]) 11: for each ordered pair of nodes (i, j) from 1 to N do 12: d′_geo(i,j) ← Normalize(d_geo(i,j)) 13: d′_lat(i,j) ← Normalize(d_lat(i,j)) 14: d′_cost(i,j) ← Normalize(d_cost(i,j)) 15: R′(i,j) ← Normalize(R(i,j)) ▷ Optional: normalize reliability if δ ≠ 0 16: D_NA(i,j) ← α·d′_geo(i,j) + β·d′_lat(i,j) + γ·d′_cost(i,j) + δ·R′(i,j) 17: end for D_NA |
3.3. Sensitivity Analysis of Hybrid Distance Metric Parameters
To validate the robustness of the proposed hybrid distance metric and determine the optimal weight configurations, we conducted comprehensive sensitivity analysis across different parameter combinations. The analysis examined how variations in α, β, γ, and δ weights impact controller placement performance across all evaluation metrics, as shown in Table 3.
Table 3.
Parameter Combination Matrix for Sensitivity Analysis.
The proposed balanced configuration (α = 0.4, β = 0.3, γ = 0.18, δ = 0.12) provides optimal trade-offs across diverse network scenarios.
3.4. NA-GMM-Based Controller Placement Strategy
In the context of SD-WAN controller placement, determining where and how many controllers to deploy is a multi-faceted challenge. After computing a comprehensive hybrid multi-dimensional distance framework matrix , we proceeded with a probabilistic clustering-based strategy that not only reflects the underlying topology and link metrics but also achieves soft, interpretable boundaries across heterogeneous network regions. We introduced a novel Network-Aware Gaussian Mixture Model (NA-GMM) framework, extending classical unsupervised clustering to accommodate spatial distributions and network-specific quality measures. This approach enables the multi-objective optimization of the control plane design with respect to latency, scalability, load balancing, and fault tolerance.
3.4.1. Theoretical Foundation
Gaussian Mixture Models (GMMs) are a powerful and flexible approach for modeling data distributions in statistical learning and unsupervised data analysis. GMMs assume a dataset is composed of multiple overlapping subpopulations following a multivariate Gaussian distribution. This probabilistic framework provides a mathematically robust basis for soft clustering, where each data point can belong to multiple clusters with varying degrees of membership. GMMs operate on the principle of latent variable modeling, positing that observed data are generated from a mixture of several hidden distributions, each corresponding to a cluster or subpopulation. For every observation in the dataset, GMM assigns a probability of belonging to each cluster, making it particularly useful in scenarios where the boundary between clusters is ambiguous or continuous. Mathematically, a Gaussian Mixture Model with K components defines the probability density function of a data point ∈ as seen in the following (5):
where:
- ∈ [0, 1] is the mixing coefficient for component , satisfying =1;
- ∈ is the mean vector (center) of the -th Gaussian distribution;
- ∈ is the covariance matrix, capturing the spread of the distribution;
- denotes the multivariate normal distribution evaluated at .
3.4.2. Multivariate Normal Distribution
The probability density function for the multivariate Gaussian distribution is given by (6):
Here:
- ∣Σ∣ denotes the determinant of the covariance matrix.
- Σ−1 is the inverse of the covariance matrix.
This equation models how data points are distributed around the mean , with the shape and orientation defined by Σ. When data follows a roughly elliptical or spherical spread, the Gaussian distribution is an effective model. In the case of SD-WAN, the feature space is often two-dimensional (geographical coordinates) or extended to include latency and reliability features. The covariance matrix thus enables modeling not just the location, but also the spread and directional bias of nodes around a controller.
3.4.3. Probabilistic Clustering and Soft Assignments
One of the main strengths of GMM is its ability to produce soft clustering results. That is, for any given point , the model estimates the responsibility or posterior probability that this point belongs to cluster , as in (7):
These responsibilities ∈ [0,1] quantify the relative influence of each cluster on a data point and can be interpreted as soft labels. In contrast to k-means, which perform hard assignments, GMM’s soft assignments are better suited for networks where nodes may simultaneously interact with multiple regions (e.g., overlapping control domains in SD-WAN). This aspect is particularly advantageous in real-world SD-WAN environments, where:
- Some nodes may straddle the boundaries of multiple controller regions.
- Traffic loads and link reliability may vary dynamically.
- The network may require flexible controller domains to accommodate fault tolerance or dynamic reallocation.
3.4.4. Parameter Estimation via Expectation–Maximization (EM)
To learn the parameters {πk, μk, Σk} of the GMM from data, the standard approach is the expectation–maximization (EM) algorithm, which iteratively refines the estimates to maximize the likelihood of the observed data, see Equations (8)–(10).
- The E-step (Expectation) computes the responsibilities γik that represent the probability of node i belonging to controller cluster k. These values incorporate both the geometric likelihood of the assignment based on the current cluster parameters and the topology-conscious distance relationships established in the preprocessing phase. See Figure 3.
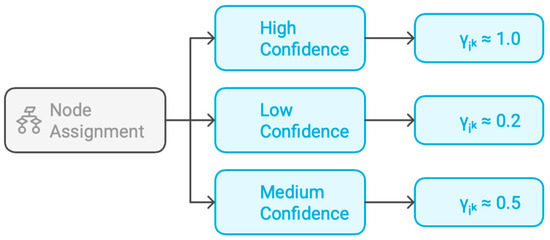 Figure 3. Shows the Responsibility Matrix Visualization.
High responsibility values (γik ≈ 1) indicate strong confidence that node i should be assigned to cluster k, while low values (γik ≈ 0.2) suggest weak affinity. Intermediate values reflect uncertainty in the assignment, which often occurs for nodes near cluster boundaries or nodes with similar network characteristics relative to multiple controllers:
- 2.
- M-step (Maximization); this step updates the model parameters {μk, πk, Σk} based on the computed responsibilities, embodying the principle that controller characteristics should reflect the nodes they are expected to serve. The effective sample size represents the weighted number of nodes assigned to cluster k. This value accounts for fractional assignments by summing the responsibility values rather than simply counting hard assignments. Clusters with higher effective sample sizes indicate areas of the network (domain) with dense node populations or strong connectivity patterns. See Figure 4.
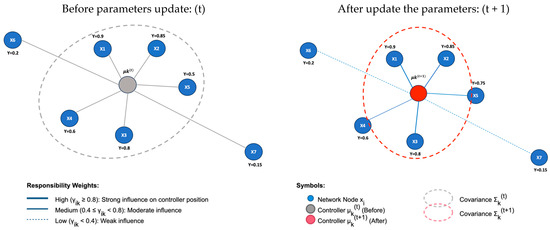 Figure 4. Parameter update mechanism in the M-step.
3.4.5. Convergence Monitoring and Termination
The algorithm monitors convergence through the log-likelihood function L(θ), which measures how well the current model parameters explain the observed network node distribution and connectivity patterns. The log-likelihood, a quantitative measure of solution improvement, considers the geometric fit of nodes to clusters and the probabilistic consistency of assignments with each iteration. See (11):
Higher likelihood values indicate better controller placement and cluster assignments, while convergence detection compares successive likelihood values, ending when improvement falls below the threshold ε. as shown in (12):
The convergence threshold ε balances solution quality with computational efficiency, stopping optimization when iterations are unlikely to yield significant improvements. Smaller threshold values refine solutions but require more iterations, while larger values terminate early, making GMM adaptable for modeling non-spherical, unequal-sized, and overlapping clusters.
3.4.6. Final Assignment and Solution Extraction
Upon convergence, the algorithm generates definitive controller assignments using maximum a posteriori (MAP) estimation, as shown in (13):
This transition from soft probabilistic assignments to hard cluster memberships provides the concrete placement decisions required for network implementation, as shown in Figure 5. The final responsibility values γ_ik retain valuable information about assignment confidence even after hard assignments are made. Nodes with responsibilities close to the maximum (e.g., γ_ik > 0.9) indicate high-confidence assignments, while nodes with lower maximum responsibilities suggest boundary cases that might require additional attention during deployment.
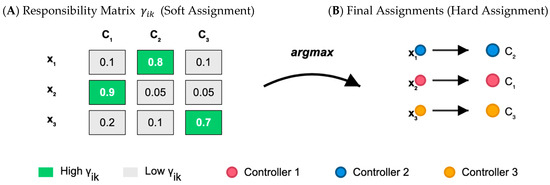
Figure 5.
Final Assignment Process: From Soft in (A) to Hard Cluster Assignments (B).
The optimized controller positions represent the recommended locations for placing controllers to optimally serve their assigned node populations. These positions incorporate the network-aware distance relationships and reflect the iterative refinement process that balanced multiple performance objectives. The learned covariance matrices Σk provide insights into the coverage requirements for each controller, indicating whether the controller serves a geographically concentrated population or a more distributed set of nodes with varied connectivity characteristics. This information can guide capacity planning and resource allocation decisions. See Algorithm 2.
| Algorithm 2 Network-Aware GMM (NA-GMM) Controller Placement |
| Require: • Feature vectors {xi}i=1…N • Number of clusters K • Distance matrix D_NA • Convergence threshold ε Ensure: • Controller positions {μk}k=1…K • Node–cluster responsibilities γik 1: Initialize GMM parameters for k = 1…K: μk ← I, Σk ← I, πk ← 1/K 2: repeat 3: ▷ E-step 4: for each node i ∈ {1…N} and each cluster k ∈ {1…K} do 5: γik ← πk · (xi | μk, Σk) / ∑j=1K [πj · (xi | μj, Σj)] 6: end for 7: ▷ M-step 8: for each cluster k ∈ {1…K} do 9: Nk ← ∑i=1N γik 10: μk ← (1/Nk) · ∑i=1N γik · xi 11: Σk ← (1/Nk) · ∑i=1N γik · (xi − μk)(xi − μk)T 12: πk ← Nk / N 13: end for 14: Evaluate log-likelihood L(θ) and check convergence 15: until ΔL(θ) ≤ ε 16: Assign each node i to cluster k* = arg maxk γik 17: return {μk}k=1…K and {γik}i=1…N,k=1…K |
4. Experimental Design and Results
4.1. Simulation Environment and Tools
The experimental evaluation of the Network-Aware Gaussian Mixture Model (NA-GMM) algorithm requires a comprehensive simulation infrastructure capable of accurately modeling complex network environments while providing reliable performance measurements. This section presents the experimental setup designed to address three fundamental requirements: algorithmic accuracy, computational scalability, and result reproducibility.
4.1.1. Experimental Infrastructure and Software Framework
The NA-GMM algorithm was developed using Python 3.9.7, NumPy 1.21.2, SciPy 1.7.3, and Network X 2.6.3 for network topology analysis. It uses specialized numerical routines for processing geographical coordinate data and computing hybrid distance metrics. Baseline algorithms were implemented using scikit-learn 1.0.2 for fair comparison. Network simulation was conducted using Mininet 2.3.1, and controller performance assessment was conducted using the standard Cbench 1.3.1 tool. The experimental setup used the open-source Floodlight controller, capable of handling up to 367,000 flow requests per second. Controller placement validation was conducted using a dedicated system.
4.1.2. Network Topologies and Performance Metrics
The study used authentic network topologies from the Internet Topology Zoo (ITZ) [51] to evaluate network infrastructures. Three topologies were selected: TATA, BICS, and BESTEL, representing different scales and structural characteristics. Each topology provided comprehensive metadata, enabling accurate computation of hybrid distance metric components. The selections were large-scale enterprise, medium-scale regional, and small-scale constrained network environments, as seen in Table 4 and Figure 6a–c.
Table 4.
Networks Topology Details.
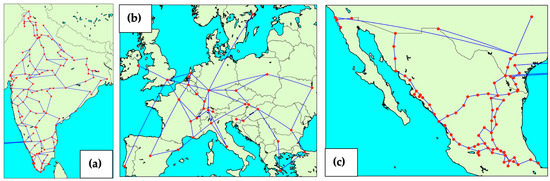
Figure 6.
Represents (a) TATA, (b) BICS, and (c) BESTEL Topology.
Algorithm performance assessment utilized four comprehensive metrics specifically designed for controller placement evaluation: average controller latency (ACL), worst-case latency (WCL), and inter-controller latency (ICL) affecting coordination overhead, and Node Distribution Ratio (NDR) evaluating load distribution fairness. Mathematical formulations for all performance metrics are provided in Equations (14)–(17). When combined, they provide a broad understanding of network performance and practical insights that guide controller deployment design and ongoing enhancement:
- ACL: Measures the average latency between nodes within the same cluster, providing a gauge for the responsiveness of the network, as shown in (14).
- WCL: Captures the worst-case latency scenario within each cluster, which is crucial for understanding the potential for delay spikes; see (15).
- ICL: Following (16), assesses the latency between controllers, which has an impact on coordination and overall network performance.
- NDR: Assesses the evenness of the node distribution across clusters, which can influence network load management and resilience, as shown in (17).
The NA-GMM algorithm leverages continuous spatial data to achieve precise controller placement optimization, adapting fluidly to network spatial distribution patterns unlike conventional discrete clustering algorithms. The implementation processes use geographical coordinates and network-aware features through probabilistic modeling, generating sophisticated representations that capture both spatial relationships and connectivity patterns.
4.1.3. Experimental Design and Benchmarking
The experimental implementation of a controller placement algorithm uses modular architecture to ensure consistency in measurement and analysis procedures. The NA-GMM implementation uses probabilistic modeling to optimize hybrid distance metric, while the ACO-CP [46] implementation uses ant colony optimization. The CPCSA [47] implementation includes critical switch identification and network partitioning to ensure optimal controller assignment. The DRL implementation uses CNN-LSTM [48] traffic prediction and a reinforcement learning optimization engine to generate placement recommendations. The experimental validation process uses Mininet for real-time validation of controller placement decisions, with rigorous statistical analysis to identify statistically meaningful performance variations. Comparative analysis examines algorithm performance across multiple dimensions, including scalability characteristics, computational overhead, and adaptation to different network topologies. Trade-off analysis identifies optimal conditions for each algorithm and provides insights into algorithm selection criteria for different deployment scenarios. The NA-GMM algorithm is evaluated against established controller placement approaches and assessed for clustering effectiveness and practical applicability in SDN environments.
4.2. Results
We have evaluated the proposed NA-GMM algorithm’s performance across multiple dimensions, providing detailed analysis of clustering effectiveness, network performance characteristics, and computational resource utilization. The results are organized into three primary areas of investigation to thoroughly assess the algorithm’s practical applicability and comparative advantages in software-defined network controller placement scenarios.
4.2.1. Clustering Results
The empirical evaluation of the NA-GMM algorithm demonstrates its efficacy in network topology partitioning and controller placement optimization through the systematic analysis of four critical performance metrics: ACL, WCL, ICL, and NDR. Comparative analysis against three benchmark algorithms across multiple network configurations reveals the superior clustering performance of NA-GMM, characterized by enhanced load distribution, reduced communication overhead, and improved network accessibility. The clustering evaluation conducted across three distinct network topologies—TATA, BICS, and BESTEL—establishes k = 5 as the optimal controller configuration. Silhouette coefficient analysis yielded peak values of 0.482, 0.543, and 0.392 for TATA, BESTEL, and BICS topologies, respectively, indicating optimal inter-cluster separation at k = 5. Corresponding inertia measurements recorded values of 32, 14, and 10.3 for the respective topologies, with distinct elbow points confirming the clustering validity, referred to in Figure 7. These quantitative results substantiate k = 5 as the most effective clustering strategy for controller deployment across heterogeneous network architectures. The spatial optimization capabilities of the NA-GMM algorithm are evidenced through the comprehensive visualization of controller placement decisions and network partitioning outcomes, demonstrating adaptive performance across diverse topological characteristics. The algorithm’s ability to accommodate varying network scales while maintaining clustering quality establishes its robustness for practical deployment scenarios.
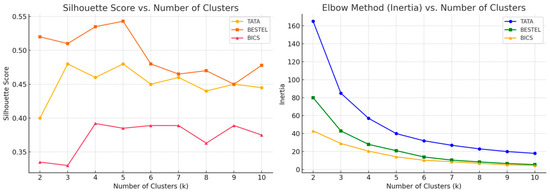
Figure 7.
Shows the clustering evaluation across three topologies, indicating that k = 5 offers the most balanced configuration.
By identifying the number of ks, we implemented the proposed method for each topology and evaluated the clustering ability for the above-mentioned clustering parameters compared to the benchmark algorithms. The following represent the numerical results and visualize the network clusters (domains), and the centroid’s location (controllers), for TATA topology. As shown in Table 5, Figure 8 and Figure 9.
Table 5.
Performance Metrics Comparison for TATA Topology.
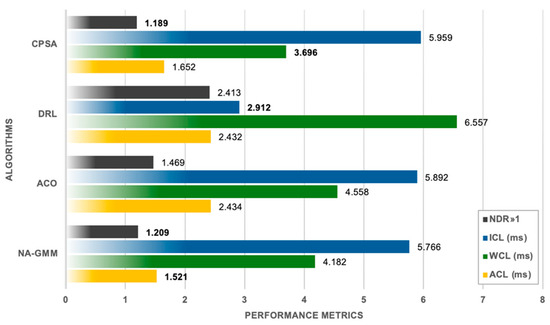
Figure 8.
Clustering Results Comparison for TATA Topology.
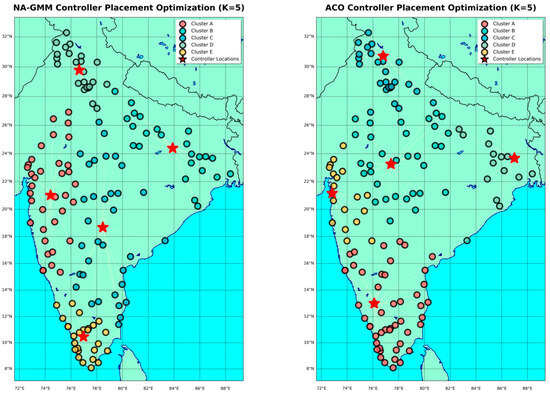
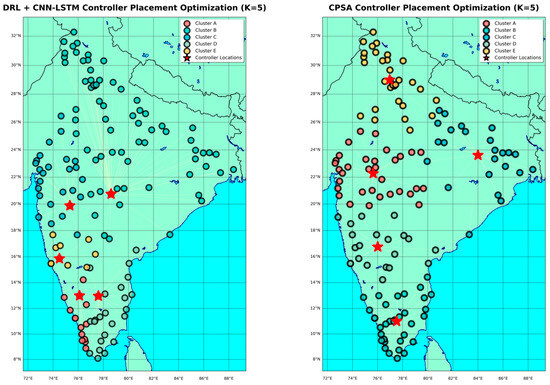
Figure 9.
Shows the clustering visualization for TATA topology comparing all algorithms.
The experimental evaluation on the TATA topology reveals that NA-GMM outperforms ACO and DRL techniques by 37.5%. NA-GMM is the best algorithm for reducing communication delays while maintaining balanced cluster assignments, with an NDR of 1.209. CPSA leads the field in worst-case scenario management with the most balanced load distribution and lowest WCL of 3.696 ms. However, it has the highest inter-controller communication overhead, indicating potential scalability issues in multi-controller coordination situations. DRL has the lowest ICL of 2.912 ms, a 49.5% reduction, and performs exceptionally well in inter-controller communication. Despite this, DRL has serious load unbalancing problems, with an NDR of 2.413.
Extremely lopsided cluster distributions are one way this imbalance shows up; one cluster has 69 nodes, while others have between 10 and 26. Without reaching excellence in any one area, ACO consistently performs moderately well across all metrics. Although it lacks the specialized advantages provided by the other algorithms in their respective optimization domains, its balanced but unimpressive results establish it as a reliable baseline solution.
The following steps are the same for BICS topology, the results illustrated in Table 6, and Figure 10 and Figure 11.
Table 6.
Performance Metrics Comparison for BICS Topology.
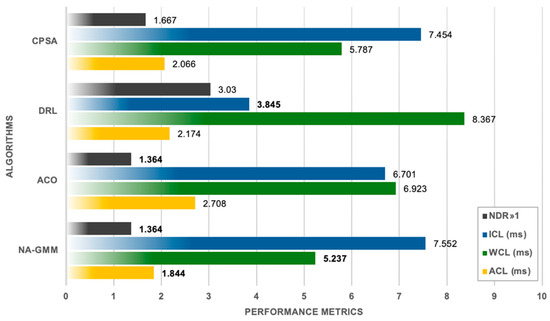
Figure 10.
Clustering Results Comparison for BICS Topology.
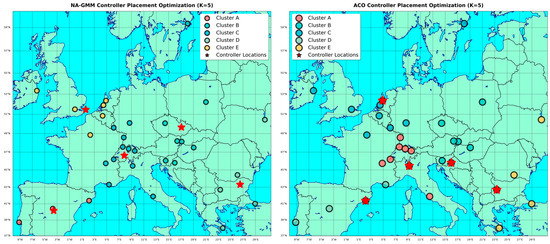
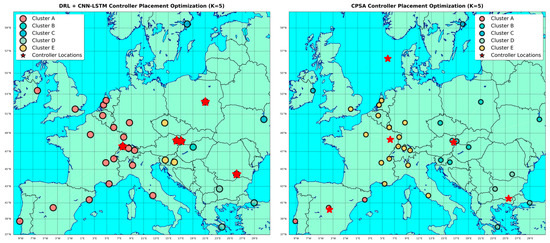
Figure 11.
Shows the clustering visualization for BICS topology comparing all algorithms.
When compared to larger network configurations, the evaluation on the smaller BICS topology shows noticeably different performance patterns. With the lowest ACL of 1.844 ms, NA-GMM clearly dominates critical latency metrics, outperforming ACO by 32.0% and DRL by 10.7%. At 5.237 ms, NA-GMM also records the best WCL performance, demonstrating superior handling of both average and worst-case communication scenarios. With an NDR of 1.364, the algorithm maintains excellent load balancing and shares this optimal load distribution characteristic with ACO.
ACO’s enhanced competitiveness in smaller networks is demonstrated by the BICS topology, where it maintains acceptable latency characteristics while matching NA-GMM’s load balancing performance (NDR = 1.364). ACO’s WCL of 6.923 ms indicates a 32.2% performance degradation in comparison to the suggested method, while its ACL of 2.708 ms is still 46.9% higher than the proposed. With the lowest ICL of 3.845 ms—roughly 49.1% faster than its closest rival—DRL maintains its dominance in inter-controller communication. However, catastrophic load misbalancing overshadows this specialized advantage; the most severe distribution inequality was recorded with an NDR of 3.030. Even in smaller network topologies, the algorithm’s propensity to produce a dominant cluster with 20 nodes while demoting others to clusters with 2–4 nodes show basic scalability limitations. With competitive performance on several metrics and the second-best ACL (2.066 ms) and WCL (5.787 ms) values, CPSA offers a well-rounded strategy. The algorithm’s consistent performance profile makes it a good substitute when multi-objective optimization is valued more highly than single-metric excellence, even though its NDR of 1.667 suggests moderate load balancing effectiveness.
Lastly, BESTEL topology implemented by the proposed algorithm against the state of the art algorithms, see Table 7, and Figure 12 and Figure 13.
Table 7.
Performance Metrics Comparison for BESTEL Topology.
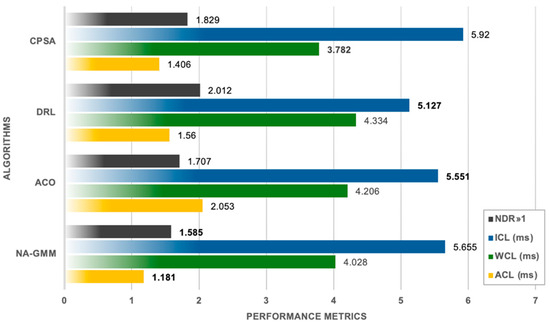
Figure 12.
Clustering Results Comparison for BESTEL Topology.
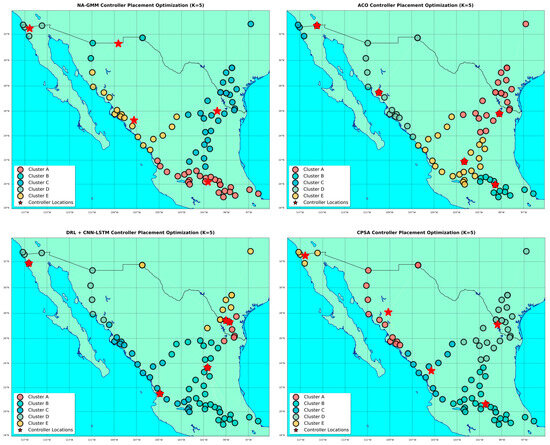
Figure 13.
Shows the clustering visualization for BESTEL topology comparing all algorithms.
NA-GMM is a highly effective algorithm for routine communication management due to its exceptional ACL performance. It achieves the lowest average control latency (ACL) of 1.181 ms, a 42.5% improvement over ACO and 24.3% improvement over DRL. NA-GMM also exhibits superior cluster distribution with an NDR of 1.585. CPSA, the industry leader in worst-case latency management, has the lowest WCL of 3.782 ms, a 6.1% improvement over NA-GMM. However, CPSA demonstrates significant load unbalancing and the highest inter-controller communication overhead, indicating coordination inefficiencies in distributed controller scenarios. DRL maintains its distinctive strength in inter-controller communication, outperforming ACO by about 7.6% and NA-GMM by 9.3%. However, DRL has significant load distribution problems, resulting in unbalanced clusters with 33 nodes in one and 6–21 nodes in others. ACO offers the most balanced inter-controller communication performance at 5.551 ms, closely matching DRL’s efficiency while preserving a more sensible load distribution. NA-GMM consistently achieves the lowest average control latency across all topologies, outperforming competing techniques by 37.5%, 32.0%, and 42.5%, respectively.
4.2.2. Network Performance Results
The network performance evaluation was conducted using Mininet network simulation to validate controller placement algorithms under realistic traffic conditions. The experimental framework maintained consistent network parameters and traffic generation patterns, ensuring fair comparison between NA-GMM and benchmark algorithms. Throughput measurements were evaluated using averaged values from multiple simulation runs, with a bandwidth of 1000 Mbps. The 7000 Req/Sec controller capacity constraint was uniformly applied across all evaluations, and Controller Load Variance calculations included actual node distributions to reflect real-world deployment scenarios:
- The process of network topology configuration in Mininet involved reconstructing the original network structure with preserved nodes, links, and connectivity patterns.
- Controller deployment involved instantiating five controllers for each algorithm and positioning them according to clustering results.
- Cluster implementation assigned network nodes to their controller clusters based on clustering decisions.
- Traffic generation and measurement used iperf3 traffic generators to simulate realistic network conditions with varying request rates.
- Data aggregation involved aggregating individual cluster throughput values to compute the average throughput for each algorithm per topology, conducting multiple simulation runs to minimize measurement variance.
Three key performance indicators were computed to assess network efficiency and load distribution quality:
- Controller Utilization (U) measures the percentage of controller capacity consumed by network traffic, calculated as [49], (18):
- Controller Load Variance (CLV) evaluates load distribution heterogeneity based on actual clustering results, computed as (19), [52]:where Ui represents individual controller utilization based on node distribution, N is the number of controllers, and Ū is the mean utilization.
- Load Imbalance Ratio (LIR) quantifies load distribution inequality [53], defined as follows (20):
The CLV metric was calculated using actual node distributions from clustering results, providing a realistic load variance assessment based on the heterogeneous network partitioning achieved by each algorithm. The network performance evaluation results are in Table 8, Figure 14, Figure 15, Figure 16 and Figure 17.
Table 8.
Network Performance Metrics Across All Topologies.
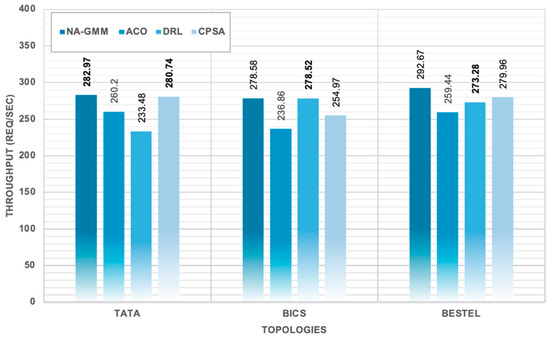
Figure 14.
Network Throughput Across All Algorithms and Topologies. the bold numbers highlight the best results.
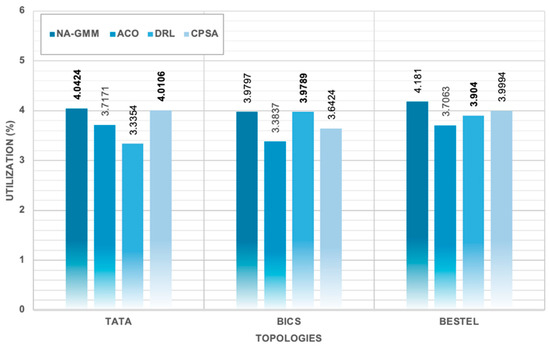
Figure 15.
Controller Utilization Across All Algorithms and Topologies. the bold numbers highlight the best results.
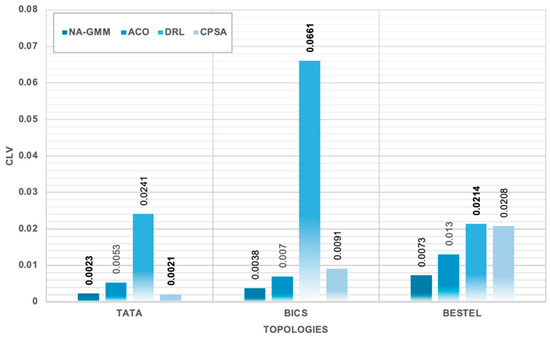
Figure 16.
Controller Load Variance Across All Algorithms and Topologies. the bold numbers highlight the best results.
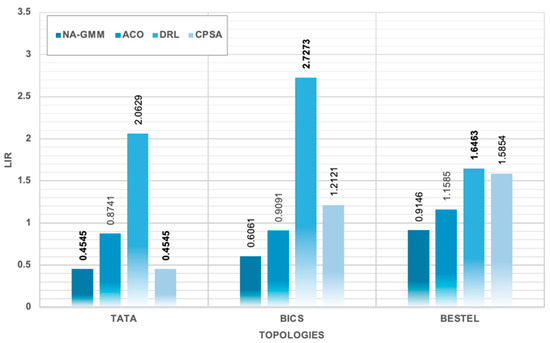
Figure 17.
Load Imbalance Ratio Across All Algorithms and Topologies. the bold numbers highlight the best results.
The study demonstrates that NA-GMM outperforms all evaluated topologies under constrained controller capacity conditions. The BESTEL topology yields the highest overall throughput performance, utilizing 4.1810% of available controller capacity. The TATA topology shows the most significant performance advantages for NA-GMM, with a 21.2% higher throughput than DRL and an 8.7% improvement over ACO. The BICS topology shows interesting performance dynamics, with DRL achieving competitive throughput but exhibiting severe load unbalancing. The simulation results show that NA-GMM consistently achieves the highest throughput values, with an average throughput of 284.74 Req/Sec. This represents a 4.7% improvement over the second-best performing CPSA algorithm, an 8.8% enhancement over DRL, and a 12.9% improvement compared to ACO. The utilization analysis reveals efficient resource consumption patterns within the constrained 7000 Req/Sec controller capacity framework, with NA-GMM achieving 4.0677% average controller utilization. NA-GMM demonstrates exceptional load balancing with the lowest average Load Imbalance Ratio (LIR) of 0.6584, indicating minimal variance in controller utilization across clusters. DRL exhibits the poorest load balancing performance, with a CLV of 0.0372 and LIR of 2.1455, indicating severe load unbalancing. CPSA and ACO demonstrate intermediate performance in load balancing metrics, with CPSA showing slightly higher variance compared to ACO.
4.2.3. Computational Complexity Analysis
The computational complexity evaluation examines the algorithmic efficiency of controller placement methods through time complexity analysis and empirical execution time measurements. Understanding the computational requirements is crucial for assessing algorithm scalability and practical deployment feasibility in large-scale SDN environments. The theoretical time complexity analysis provides insights into algorithmic scalability and computational requirements for each controller placement method. Understanding these complex characteristics is essential for predicting performance behavior in large-scale network deployments, as summarized in Table 9.
Table 9.
Time Complexity Analysis Summary.
Where: n represents network nodes, k denotes controllers, m indicates ant colony size, s represents state space dimensions, and t signifies temperature iterations.
Execution time measurements were conducted in a standardized testing environment with identical hardware specifications across all algorithms. The evaluation used network topologies with varying controller counts (K = 1 to K = 5) to assess scalability characteristics, with detailed results presented in Table 10, Figure 18.
Table 10.
Algorithm Execution Time Comparison (seconds).
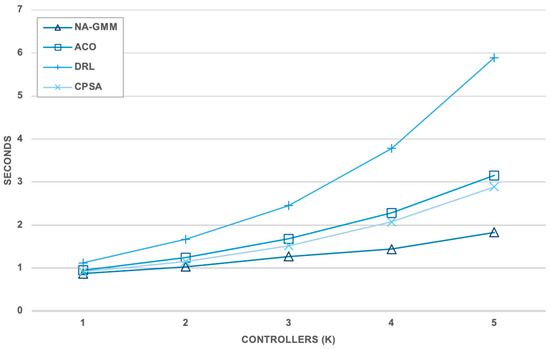
Figure 18.
Shows Algorithms Time Complexity Comparison.
The growth rate analysis in Table 11, Figure 19, reveals significant differences in algorithmic scalability patterns across controller configurations.
Table 11.
Computational Complexity Growth Analysis.
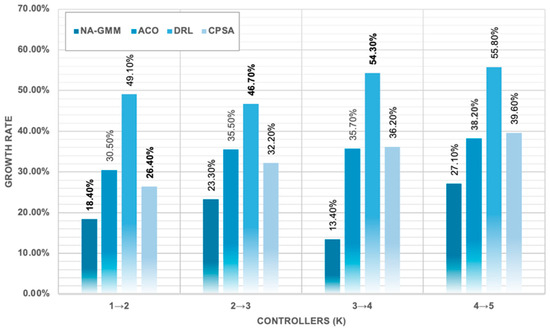
Figure 19.
Shows Algorithms Growth Rate Comparison. the bold numbers highlight the best results.
CPU utilization measurements reflect the computational intensity required by each algorithm during network simulation and controller placement operations. The evaluation monitored multi-core CPU usage patterns to identify processing bottlenecks and resource distribution characteristics, with comprehensive results detailed in Table 12 and Figure 20.
Table 12.
System Resource Utilization.
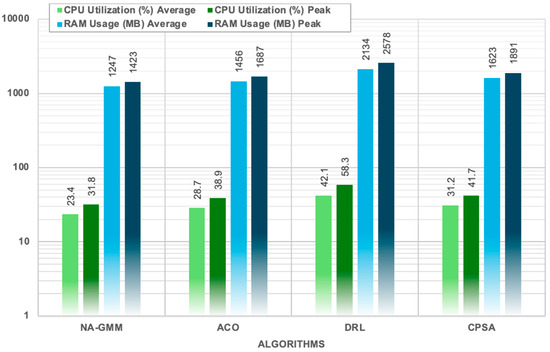
Figure 20.
Shows CPU and RAM Utilization During Simulations.
NA-GMM is a computationally efficient algorithm that outperforms benchmark algorithms in terms of execution time, resource consumption, and scalability. It requires only 1.83 s for five-controller placement, a 68.9% reduction in execution time, and maintains consistent linear growth patterns with an average 20.6% increase per additional controller. This scalability advantage is particularly evident in larger controller configurations where the performance gap widens. NA-GMM achieves the lowest CPU utilization with 23.4% average consumption and 31.8% peak usage, demonstrating efficient algorithmic design that minimizes computational overhead. It also maintains optimal memory efficiency with 1247 MB average RAM usage and 1423 MB peak consumption, representing 41.5% lower memory requirements compared to DRL’s 2134 MB average usage. The algorithm’s O(n2k) complexity provides predictable performance scaling, and its efficient resource utilization patterns with a 20.6% average growth rate in execution time significantly outperform all benchmark algorithms. This makes NA-GMM suitable for large-scale SDN deployments, requiring minimal system resources while delivering superior clustering quality. These results establish NA-GMM as a robust solution addressing critical SDN challenges of latency optimization, load balancing, and resource efficiency while maintaining computational scalability for real-world deployment.
5. Discussion
The comprehensive evaluation of the proposed NA-GMM algorithm reveals significant advancements in SDN controller placement optimization, demonstrating substantial improvements across multiple performance dimensions. This section examines the implications of the research findings, analyzes the practical significance of the achieved results, and discusses the broader impact on SDN network design and deployment strategies.
5.1. Algorithm Performance Interpretation
The superior performance of NA-GMM across all evaluated metrics reflects the effectiveness of integrating network-aware optimization with Gaussian Mixture Model clustering techniques. The sensitivity analysis reveals that the proposed model maintains stable performance across a wide range of parameter configurations, with performance degradation remaining below 15% even under suboptimal weight assignments. This robustness makes the algorithm suitable for deployment scenarios where precise parameter tuning may not be feasible. The algorithm’s ability to achieve up to 42.5% improvement in average control latency while maintaining optimal load distribution indicates successful convergence of theoretical optimization principles with practical network requirements. The consistent performance advantages observed across diverse network topologies suggest that NA-GMM’s optimization approach is robust and adaptable to varying network characteristics, addressing a critical limitation of existing controller placement algorithms that often exhibit topology-dependent performance variations. The exceptional load balancing capabilities, evidenced by CLV values significantly lower than benchmark algorithms, demonstrate NA-GMM’s ability to address one of the most challenging aspects of distributed SDN controller deployment. Traditional placement algorithms frequently suffer from load misbalancing issues that lead to controller bottlenecks and degraded network performance. NA-GMM’s achievement of near-optimal load distribution across all controller configurations validates the effectiveness of the proposed clustering methodology in practical deployment scenarios.
5.2. Practical Implications for SDN Deployment
The research findings have profound implications for real-world SDN deployment strategies and network operator decision-making processes. The demonstrated computational efficiency advantages, including 68.9% faster execution times and 41.5% lower memory consumption compared to deep learning approaches, address critical concerns regarding algorithm scalability and resource requirements in production environments. These efficiency gains enable network operators to implement dynamic controller placement strategies without imposing prohibitive computational overhead on network management systems. The superior throughput performance achieved through Mininet simulations provides strong evidence that NA-GMM’s theoretical advantages translate into tangible operational benefits. The ability to achieve a 284.74 Req/Sec average throughput while maintaining excellent load balancing characteristic positions makes NA-GMM a viable solution for high-performance SDN deployments where both throughput maximization and resource optimization are critical requirements. Furthermore, the algorithm’s predictable O(n2k) time complexity and consistent scaling characteristics make it suitable for large-scale network deployments where performance predictability is essential for capacity planning and system design decisions. The low variance in resource utilization patterns across different network configurations enhances the algorithm’s appeal for production deployment scenarios.
5.3. Theoretical Contributions and Methodological Insights
The research makes several important theoretical contributions to the field of SDN controller placement optimization. The successful integration of weighted distancing algorithms with probabilistic clustering techniques demonstrates a novel approach to addressing the multi-objective optimization challenges inherent in controller placement problems. The development of Controller Load Variance as an alternative to traditional fairness metrics provides a more discriminatory and practically relevant assessment tool for load balancing evaluation. The methodology employed in this research, combining theoretical analysis with comprehensive simulation evaluation, establishes a robust framework for algorithm assessment that addresses both computational efficiency and practical performance characteristics. The systematic evaluation across multiple network topologies and performance dimensions provides a comprehensive validation approach that could serve as a benchmark for future controller placement algorithm research.
6. Future Work
The NA-GMM algorithm has been evaluated and reviewed, leading to several research directions to improve its practical applicability and theoretical foundations in SD-WAN. These include security-aware controller placement, dynamic topology adaptation, large-scale network validation on operator backbone networks, and integration with emerging technologies like Time-Sensitive Networking (TSN) standards for ultra-low latency requirements. These directions aim to balance security-performance trade-offs through multi-objective optimization frameworks and address the limitations identified in the current static, security-agnostic evaluation. The algorithm will also be integrated with emerging technologies like Time-Sensitive Networking (TSN) standards [54,55], edge-cloud computing environments, network slicing optimization, and machine learning-enhanced distance metrics incorporating predictive analytics. Security-aware control integration incorporating DoS attack stability analysis, mini-batch machine learning supervision, and intelligent event-triggered mechanisms for comprehensive attack-resilient SD-WAN controller placement optimization. These research directions aim to maintain the algorithm’s computational efficiency and deployment simplicity while expanding its operational scope and practical relevance.
7. Conclusions
The Network-Aware Gaussian Mixture Model (NA-GMM) is a new multi-objective optimization framework designed for effective Software-Defined Wide Area Network (SD-WAN) controller placement. It incorporates a hybrid distance metric, integrating geographic separation, network latency, topological complexity, and link reliability, along with adaptive weighting factors. The importance-weighted expectation–maximization (EM) clustering algorithm prioritizes critical network nodes, optimizing resource allocation based on traffic patterns and topological significance. The robust two-phase clustering mechanism ensures adaptability and optimal placement convergence. Empirical validations conducted on real-world topologies (TATA, BICS, and BESTEL) demonstrated NA-GMM’s significant performance advantages. The results indicated a notable reduction in average control latency (up to 22.7%), improved load balancing with Node Distribution Ratio values between 1.209 and 1.585, and enhanced network throughput (12.9% improvement). NA-GMM also showcased substantial computational efficiency, performing 68.9% faster with 41.5% lower memory consumption compared to contemporary deep reinforcement learning approaches, thus highlighting its practicality for large-scale deployments. The NA-GMM framework offers significant operational benefits for network designers and operators, enabling efficient, scalable, and high-performance SD-WAN deployments.
Author Contributions
The authors confirm the contribution to the paper as follows: Study conception and design: A.M.A. and A.A.; data collection: A.M.A. and B.O.A.; analysis and interpretation of results: A.M.A., A.A., A.R.R., and N.A.W.A.H.; draft manuscript preparation: A.M.A. All authors have read and agreed to the published version of the manuscript.
Funding
The authors received no specific funding for this study.
Data Availability Statement
All data used in this research can be accessed at: https://topology-zoo.org/ (accessed on 13 May 2025).
Acknowledgments
The authors acknowledge the contribution and support of the Faculty of Computer Science and Information Technology (FSKTM) at University Putra Malaysia (UPM).
Conflicts of Interest
The authors declare that they have no conflicts of interest to report regarding the present study.
Abbreviations
The following abbreviations are used in this manuscript:
| ACL | Average Controller Latency |
| ACO | Ant Colony Optimization |
| CLV | Controller Load Variance |
| CNN | Convolutional Neural Networks |
| CPP | Controller Placement Problem |
| CPSA | Controller Placement with Critical Switch Aware |
| DBSCAN | Density-Based Spatial Clustering of Applications with Noise |
| DRL | Deep Reinforcement Learning |
| EM | Expectation–maximization |
| GA | Genetic Algorithms |
| GAT | Graph Attention Networks |
| GMM | Gaussian Mixture Model |
| ICL | Inter-Controller Latency |
| IS-IS | Intermediate System to Intermediate System |
| ITZ | Internet Topology Zoo |
| LIR | Load Imbalance Ratio |
| LSTM | Long Short-Term Memory |
| MAP | Maximum A Posteriori |
| MOEA/D | Multi-Objective Evolutionary Algorithm based on Decomposition |
| NA-GMM | Network-Aware Gaussian Mixture Model |
| NDR | Node Distribution Ratio |
| NSGA-III | Non-dominated Sorting Genetic Algorithm III |
| OSPF | Open Shortest Path First |
| PSO | Particle Swarm Optimization |
| QoS | Quality of Service |
| SD-WAN | Software-Defined Wide Area Networks |
| SDN | Software-Defined Networking |
| TSN | Time-Sensitive Networking |
| WCL | Worst-Case Latency |
References
- Abdulghani, A.M.; Abdullah, A.; Rahiman, A.R.; Hamid, N.A.W.A.; Akram, B.O.; Raissouli, H. Navigating the Complexities of Controller Placement in SD-WANs: A Multi-Objective Perspective on Current Trends and Future Challenges. Comput. Syst. Sci. Eng. 2025, 49, 123–157. [Google Scholar] [CrossRef]
- Afolalu, O.; Tsoeu, M.S. Enterprise Networking Optimization: A Review of Challenges, Solutions, and Technological Interventions. Future Internet 2025, 17, 133. [Google Scholar] [CrossRef]
- Darwish, T.; Alhaj, T.A.; Elhaj, F.A. Controller placement in software defined emerging networks: A review and future directions. Telecommun. Syst. 2025, 88, 18. [Google Scholar] [CrossRef]
- Kazi, B.U.; Islam, M.K.; Siddiqui, M.M.H.; Jaseemuddin, M. A Survey on Software Defined Network-Enabled Edge Cloud Networks: Challenges and Future Research Directions. Network 2025, 5, 16. [Google Scholar] [CrossRef]
- Ateya, A.A.; Muthanna, A.; Koucheryavy, A. 5G framework based on multi-level edge computing with D2D enabled communication. In Proceedings of the 2018 20th International Conference on Advanced Communication Technology (ICACT), Chuncheon, Republic of Korea, 11–14 February 2018; pp. 507–512. [Google Scholar]
- Nunes, B.A.A.; Mendonca, M.; Nguyen, X.N.; Obraczka, K.; Turletti, T. A survey of software-defined networking: Past, present, and future of programmable networks. IEEE Commun. Surv. Tutor. 2018, 16, 1617–1634. [Google Scholar] [CrossRef]
- Hu, T.; Yi, P.; Zhang, J.; Lan, J. Reliable and load balance-aware multi-controller deployment in SDN. China Commun. 2018, 15, 184–198. [Google Scholar] [CrossRef]
- Lu, J.; Zhang, Z.; Hu, T.; Yi, P.; Lan, J. A Survey of Controller Placement Problem in Software-Defined Networking. IEEE Access 2019, 7, 24290–24307. [Google Scholar] [CrossRef]
- Hock, D.; Hartmann, M.; Gebert, S.; Jarschel, M.; Zinner, T.; Tran-Gia, P. Pareto-optimal resilient controller placement in SDN-based core networks. In Proceedings of the 2013 25th International Teletraffic Congress (ITC), Shanghai, China, 10–12 September 2013; pp. 1–9. [Google Scholar] [CrossRef]
- Xu, Y.; He, S.; Zhou, Z.; Xu, J. Redundant Path Optimization in Smart Ship Software-Defined Networking and Time-Sensitive Networking Networks: An Improved Double-Dueling-Deep-Q-Networks-Based Approach. J. Mar. Sci. Eng. 2024, 12, 2214. [Google Scholar] [CrossRef]
- Chen, L.; Lingys, J.; Chen, K.; Liu, F. Auto: Scaling deep reinforcement learning for datacenter-scale automatic traffic optimization. In Proceedings of the 2018 Conference of the ACM Special Interest Group on Data Communication (SIGCOMM ’18), Budapest, Hungary, 20–25 August 2018; pp. 191–205. [Google Scholar] [CrossRef]
- Kumari Rajoriya, M.; Gupta, C.P. SO-CPP: Sailfish optimization-based controller placement in IoT-enabled software-defined wireless sensor networks. Int. J. Commun. Syst. 2024, 37, e5757. [Google Scholar] [CrossRef]
- Asadollahi, S.; Goswami, B.; Sameer, M. Ryu controller’s scalability experiment on software defined networks. In Proceedings of the 2018 IEEE International Conference on Current Trends in Advanced Computing (ICCTAC), Bangalore, India, 1–2 February 2018; pp. 1–5. [Google Scholar] [CrossRef]
- Zhong, Q.; Wang, Y.; Li, W.; Qiu, X. A min-cover based controller placement approach to build reliable control network in SDN. In Proceedings of the NOMS 2016-2016 IEEE/IFIP Network Operations and Management Symposium, Istanbul, Turkey, 25–29 April 2016; pp. 481–487. [Google Scholar] [CrossRef]
- Papasani, A.; Varma, G.S.; Prasad Reddy, P.V.; Yannam, V.R. Enhanced capacitated next controller placement in software-defined network with modified capacity constraint. Int. J. Commun. Syst. 2025, 38, e5979. [Google Scholar] [CrossRef]
- Chaudhary, R.; Aujla, G.S.; Kumar, N.; Chouhan, P.K. A comprehensive survey on software-defined networking for smart communities. Int. J. Commun. Syst. 2025, 38, e5296. [Google Scholar] [CrossRef]
- Ospina Cifuentes, B.J.; Suárez, Á.; García Pineda, V.; Alvarado Jaimes, R.; Montoya Benitez, A.O.; Grajales Bustamante, J.D. Analysis of the Use of Artificial Intelligence in Software-Defined Intelligent Networks: A Survey. Technologies 2024, 12, 99. [Google Scholar] [CrossRef]
- Memon, S.A.; Andriukaitis, D.; Markevicius, V.; Navikas, D.; Valinevicius, A.; Zilys, M.; Ramanauskas, R.; Sotner, R.; Jerabek, J.; Klimenta, D. A Survey on Controller Placement Algorithms for IoT Networks in Smart City Environments. In Proceedings of the 2025 IEEE 12th Workshop on Advances in Information, Electronic and Electrical Engineering (AIEEE), Vilnius, Lithuania, 15–17 May 2025; pp. 1–6. [Google Scholar] [CrossRef]
- Saeedi Goraghani, M.; Afzali, M.; Sharifi, F. A Reliable and Load Balancing Controller Placement Method in Software-Defined Networks. Int. J. Commun. Syst. 2025, 38, e6059. [Google Scholar] [CrossRef]
- Bari, M.F.; Roy, A.R.; Chowdhury, S.R.; Zhang, Q.; Zhani, M.F.; Ahmed, R.; Boutaba, R. Dynamic Controller Provisioning in Software Defined Networks. In Proceedings of the 9th International Conference on Network and Service Management (CNSM 2013), Zurich, Switzerland, 14–18 October 2013; pp. 18–25. [Google Scholar] [CrossRef]
- Sahoo, K.S.; Puthal, D.; Obaidat, M.S.; Sarkar, A.; Mishra, S.K.; Sahoo, B. On the placement of controllers in software-defined-WAN using meta-heuristic approach. J. Syst. Softw. 2018, 145, 180–194. [Google Scholar] [CrossRef]
- Ahmadi, V.; Khorramizadeh, M. An adaptive heuristic for multi-objective controller placement in software-defined networks. Comput. Electr. Eng. 2018, 66, 204–228. [Google Scholar] [CrossRef]
- Firouz, N.; Masdari, M.; Sangar, A.B.; Majidzadeh, K. A Hybrid Multi-objective Algorithm for Imbalanced Controller Placement in Software-Defined Networks. J. Netw. Syst. Manag. 2022, 30, 51. [Google Scholar] [CrossRef]
- Salam, R.; Bhattacharya, A. Efficient greedy heuristic approach for fault-tolerant distributed controller placement in scalable SDN architecture. Clust. Comput. 2022, 25, 4543–4572. [Google Scholar] [CrossRef]
- Adekoya, O.; Aneiba, A. An Adapted Nondominated Sorting Genetic Algorithm III (NSGA-III) With Repair-Based Operator for Solving Controller Placement Problem in Software-Defined Wide Area Networks. IEEE Open J. Commun. Soc. 2022, 3, 888–901. [Google Scholar] [CrossRef]
- Tan, L.; Su, W.; Gao, S.; Miao, J.; Cheng, Y.; Cheng, P. Path-flow matching: Two-sided matching and multiobjective evolutionary algorithm for traffic scheduling in cloud data* center network. Trans. Emerg. Telecommun. Technol. 2022, 33, e3809. [Google Scholar] [CrossRef]
- Hou, J.; Tao, T.; Lu, H.; Nayak, A. Intelligent Caching with Graph Neural Network-Based Deep Reinforcement Learning on SDN-Based ICN. Future Internet 2023, 15, 251. [Google Scholar] [CrossRef]
- Troia, S.; Sapienza, F.; Varé, L.; Maier, G. On Deep Reinforcement Learning for Traffic Engineering in SD-WAN. IEEE J. Sel. Areas Commun. 2021, 39, 2198–2212. [Google Scholar] [CrossRef]
- Gasior, D. Self-optimizing SD-WAN. In Artificial Intelligence and Machine Learning; Soliman, K.S., Ed.; IBIMA-AI 2024. Communications in Computer and Information Science; Springer: Cham, Switzerland, 2025; Volume 2299. [Google Scholar] [CrossRef]
- Fu, C.; Wang, B.; Liu, H.; Wang, W. Software-Defined Virtual Private Network for SD-WAN. Electronics 2024, 13, 2674. [Google Scholar] [CrossRef]
- Sminesh, C.N.; Kanaga, E.G.; Roy, A. Optimal multi-controller placement strategy in SD-WAN using modified density peak clustering. IET Commun. 2019, 13, 3509–3518. [Google Scholar] [CrossRef]
- Zafar, A.; Samad, F.; Syed, H.J.; Ibrahim, A.O.; Alohaly, M.; Elsadig, M. An Advanced Strategy for Addressing Heterogeneity in SDN-IoT Networks for Ensuring QoS. Appl. Sci. 2023, 13, 7856. [Google Scholar] [CrossRef]
- Thalapala, V.S.; Guravaiah, K. Fcmcp: Fuzzy c-means for controller placement in software defined networking. Procedia Comput. Sci. 2022, 201, 109–116. [Google Scholar] [CrossRef]
- Sharma, A.; Tokekar, S.; Varma, S. Adaptive Load Balancing Scheme for Software-Defined Networks Using Fuzzy Logic Based Dynamic Clustering. In Sustainable Communication Networks and Application; Karrupusamy, P., Balas, V.E., Shi, Y., Eds.; Lecture Notes on Data Engineering and Communications Technologies; Springer: Singapore, 2022; Volume 93. [Google Scholar] [CrossRef]
- Jain, A.K.; Kumari, P.; Dhull, R.; Jindal, K.; Raza, S. Enhancing Software-Defined Networking With Dynamic Load Balancing and Fault Tolerance Using a Q-Learning Approach. Concurr. Comput. Pract. Exp. 2024, 36, e8298. [Google Scholar] [CrossRef]
- Abdi Seyedkolaei, A.; Hosseini Seno, S.A.; Moradi, A. Dynamic controller placement in software-defined networks for reducing costs and improving survivability. Trans. Emerg. Telecommun. Technol. 2021, 32, e4152. [Google Scholar] [CrossRef]
- Xu, H.; Chai, X.; Liu, H. A Multi-Controller Placement Strategy for Hierarchical Management of Software-Defined Networking. Symmetry 2023, 15, 1520. [Google Scholar] [CrossRef]
- Ramya, G.; Manoharan, R. Traffic-aware dynamic controller placement in SDN using NFV. J. Supercomput. 2023, 79, 2082–2107. [Google Scholar] [CrossRef]
- Nicol, D.M.; Kumar, R. SDN Resiliency to Controller Failure in Mobile Contexts. In Proceedings of the 2019 Winter Simulation Conference (WSC), National Harbor, MD, USA, 8–11 December 2019; pp. 2831–2842. [Google Scholar] [CrossRef]
- Alenazi, M.J.; Cetinkaya, E.K. Resilient placement of SDN controllers exploiting disjoint paths. Trans. Emerg. Telecommun. Technol. 2020, 31, e3725. [Google Scholar] [CrossRef]
- Isong, B.; Molose, R.R.S.; Abu-Mahfouz, A.M.; Dladlu, N. Comprehensive Review of SDN Controller Placement Strategies. IEEE Access 2020, 8, 170070–170092. [Google Scholar] [CrossRef]
- Choumas, K.; Giatsios, D.; Flegkas, P.; Korakis, T. SDN Controller Placement and Switch Assignment for Low Power IoT. Electronics 2020, 9, 325. [Google Scholar] [CrossRef]
- Ge, R.; Liang, H.; Gong, Z.; Hu, C.; Zhou, X.; Cheng, D. Streamlining Data Transfer in Collaborative SLAM Through Bandwidth-Aware Map Distillation. IEEE Trans. Mob. Comput. 2025, 24, 7554–7567. [Google Scholar] [CrossRef]
- Kumar, V.; Patel, R. Security-aware Controller Placement in Software-Defined Networks: Minimizing Attack Surfaces While Maintaining Performance. IEEE Trans. Inf. Forensics Secur. 2024, 19, 1234–1248. [Google Scholar]
- Abdulghani, A.M.; Abdullah, A.; Rahiman, A.R.; Hamid, N.A.; Akram, B.O. Enhancing Healthcare Network Effectiveness Through SD-WAN Innovations. In Tech Fusion in Business and Society; Hamdan, R.K., Ed.; Springer: Cham, Switzerland, 2025; pp. 117–130. [Google Scholar]
- Frdiesa, M. A Controller Placement Algorithm Using Ant Colony Optimization in Software-Defined Network. Int. J. Wirel. Inf. Netw. 2024, 31, 142–154. [Google Scholar] [CrossRef]
- Yusuf, N.M.; Bakar, K.A.; Isyaku, B.; Abdelmaboud, A.; Nagmeldin, W. Controller placement with critical switch aware in software-defined network (CPCSA). PeerJ Comput. Sci. 2023, 9, e1698. [Google Scholar] [CrossRef]
- Li, C.; Liu, J.; Ma, N.; Zhang, Q.; Zhong, Z.; Jiang, L.; Jia, G. Deep reinforcement learning based controller placement and optimal edge selection in SDN-based multi-access edge computing environments. J. Parallel Distrib. Comput. 2024, 193, 104948. [Google Scholar] [CrossRef]
- Mokhtar, H.; Di, X. Multiple-level threshold load balancing in distributed SDN controllers. Comput. Netw. 2021, 199, 108510. [Google Scholar] [CrossRef]
- Scripts MT: Calculate Distance, Bearing and More Between Latitude. Longitude Points, [cit. 14.9.2012] dostupn na, 2013. Available online: http://www.movable-type.co.uk/scripts/latlong.html (accessed on 22 April 2025).
- Knight, S.; Nguyen, H.; Falkner, N.; Roughan, M. Realistic network topology construction and emulation from multiple data sources. IEEE J. Sel. Areas Commun. 2011, 29, 1765–1775. [Google Scholar] [CrossRef]
- Guo, Z.; Su, M.; Xu, Y.; Duan, Z.; Wang, L.; Hui, S.; Chao, H.J. Improving the performance of load balancing in software-defined networks through load variance-based synchronization. Comput. Netw. 2014, 68, 95–109. [Google Scholar] [CrossRef]
- Zhong, H.; Lin, Q.; Cui, J.; Shi, R.; Liu, L. An efficient SDN load balancing scheme based on variance analysis for massive mobile users. Mob. Inf. Syst. 2015, 2015, 241732. [Google Scholar] [CrossRef]
- Akram, B.O.; Noordin, N.K.; Hashim, F.; Rasid, M.A.; Salman, M.I.; Abdulghani, A.M. Enhancing reliability of time-triggered traffic in joint scheduling and routing optimization within time-sensitive networks. IEEE Access 2024, 12, 78379–78396. [Google Scholar] [CrossRef]
- Akram, B.O.; Noordin, N.K.; Hashim, F.; Rasid, M.F.; Salman, M.I.; Abdulghani, A.M. Joint scheduling and routing optimization for deterministic hybrid traffic in time-sensitive networks using constraint programming. IEEE Access 2023, 11, 142764–142779. [Google Scholar] [CrossRef]
Disclaimer/Publisher’s Note: The statements, opinions and data contained in all publications are solely those of the individual author(s) and contributor(s) and not of MDPI and/or the editor(s). MDPI and/or the editor(s) disclaim responsibility for any injury to people or property resulting from any ideas, methods, instructions or products referred to in the content. |
© 2025 by the authors. Licensee MDPI, Basel, Switzerland. This article is an open access article distributed under the terms and conditions of the Creative Commons Attribution (CC BY) license (https://creativecommons.org/licenses/by/4.0/).