Article

MedLangViT: A Language–Vision Network for Medical Image Segmentation

1
Information Engineering College, Capital Normal University, Beijing 100048, China
2
Faculty of Informatics, Shonan Institute of Technology, 1-1-25 Tsujido-Nishikaigan, Fujisawa-shi 251-8511, Kanagawa, Japan
3
College of Humanities and Sciences, Nihon University, Tokyo 156-8550, Japan
*
Author to whom correspondence should be addressed.
Electronics 2025, 14(15), 3020; https://doi.org/10.3390/electronics14153020
Submission received: 28 June 2025 / Revised: 26 July 2025 / Accepted: 28 July 2025 / Published: 29 July 2025

Abstract

Precise medical image segmentation is crucial for advancing computer-aided diagnosis. Although deep learning-based medical image segmentation is now widely applied in this field, the complexity of human anatomy and the diversity of pathological manifestations often necessitate the use of image annotations to enhance segmentation accuracy. In this process, the scarcity of annotations and the lightweight design requirements of associated text encoders collectively present key challenges for improving segmentation model performance. To address these challenges, we propose MedLangViT, a novel language–vision multimodal model for medical image segmentation that incorporates medical descriptive information through lightweight text embedding rather than text encoders. MedLangViT innovatively leverages medical textual information to assist the segmentation process, thereby reducing reliance on extensive high-precision image annotations. Furthermore, we design an Enhanced Channel-Spatial Attention Module (ECSAM) to effectively fuse textual and visual features, strengthening textual guidance for segmentation decisions. Extensive experiments conducted on two publicly available text–image-paired medical datasets demonstrated that MedLangViT significantly outperforms existing state-of-the-art methods, validating the effectiveness of both the proposed model and the ECSAM.

1. Introduction

Medical image segmentation is a critical component of medical image analysis, playing a vital role in clinical diagnosis, treatment planning, and disease research. Its applications range from tumor detection to organ segmentation, making it indispensable in modern medicine. However, obtaining high-quality annotated medical images faces significant challenges. These challenges are particularly pronounced in COVID-19 lesion segmentation, where the visual identification of lesions faces inherent difficulties due to low contrast boundaries between lesions like ground-glass opacities and surrounding lung tissue, heterogeneous manifestations appearing as diverse patterns including nodular, patchy, and diffuse across patients, and ambiguous margins with ill-defined edges that challenge precise delineation even for experts [1,2]. Accompanying textual annotations provide critical complementary information by specifying anatomical context, characterizing lesion attributes, and highlighting clinically relevant features that may be visually obscure in the images. On the one hand, annotation requires substantial time and effort from medical professionals, which results in high labor costs. On the other hand, the complexity and specificity of medical images make annotation more difficult compared with conventional images, while consistency across annotations is also hard to ensure. These factors severely limit the performance improvement of medical image segmentation models.
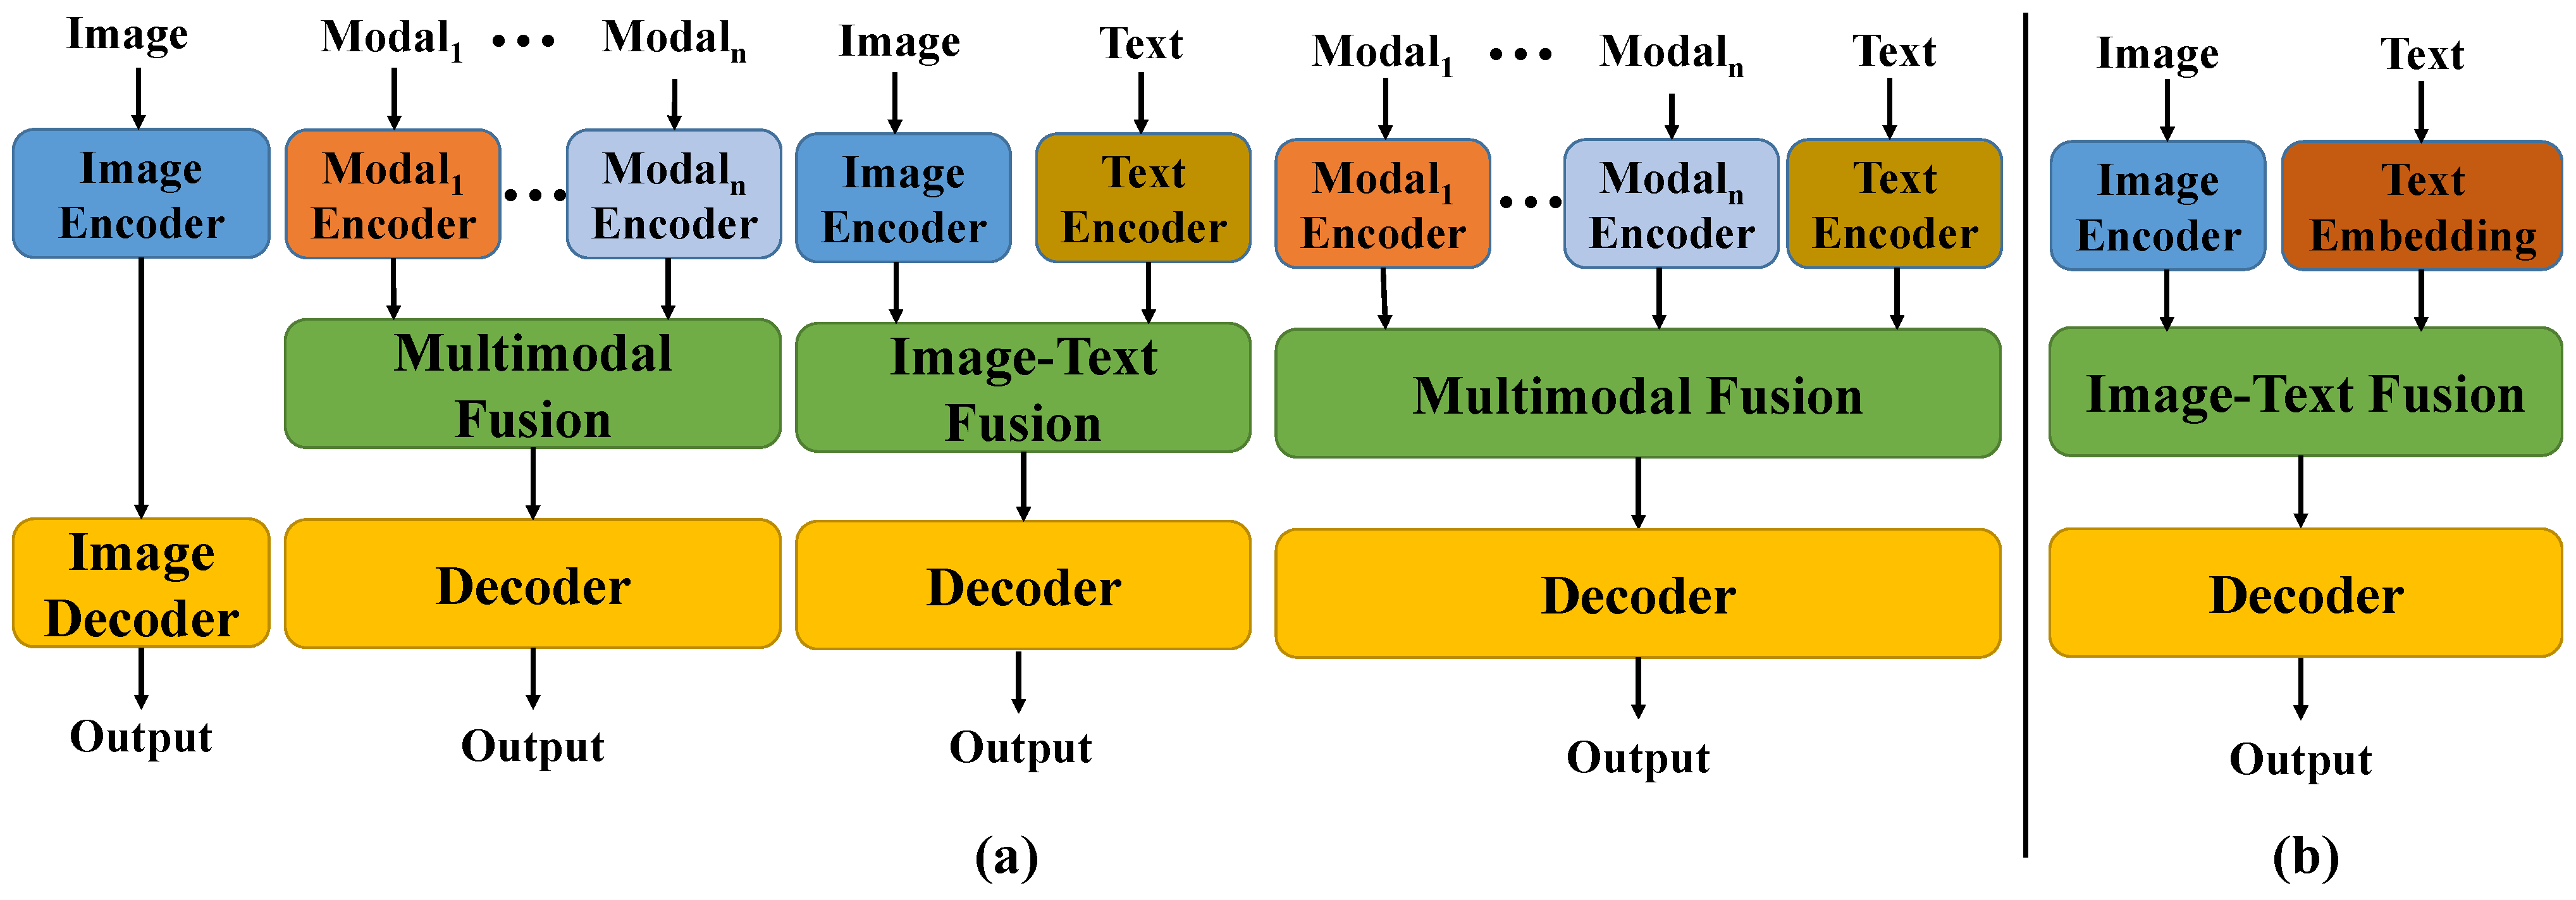
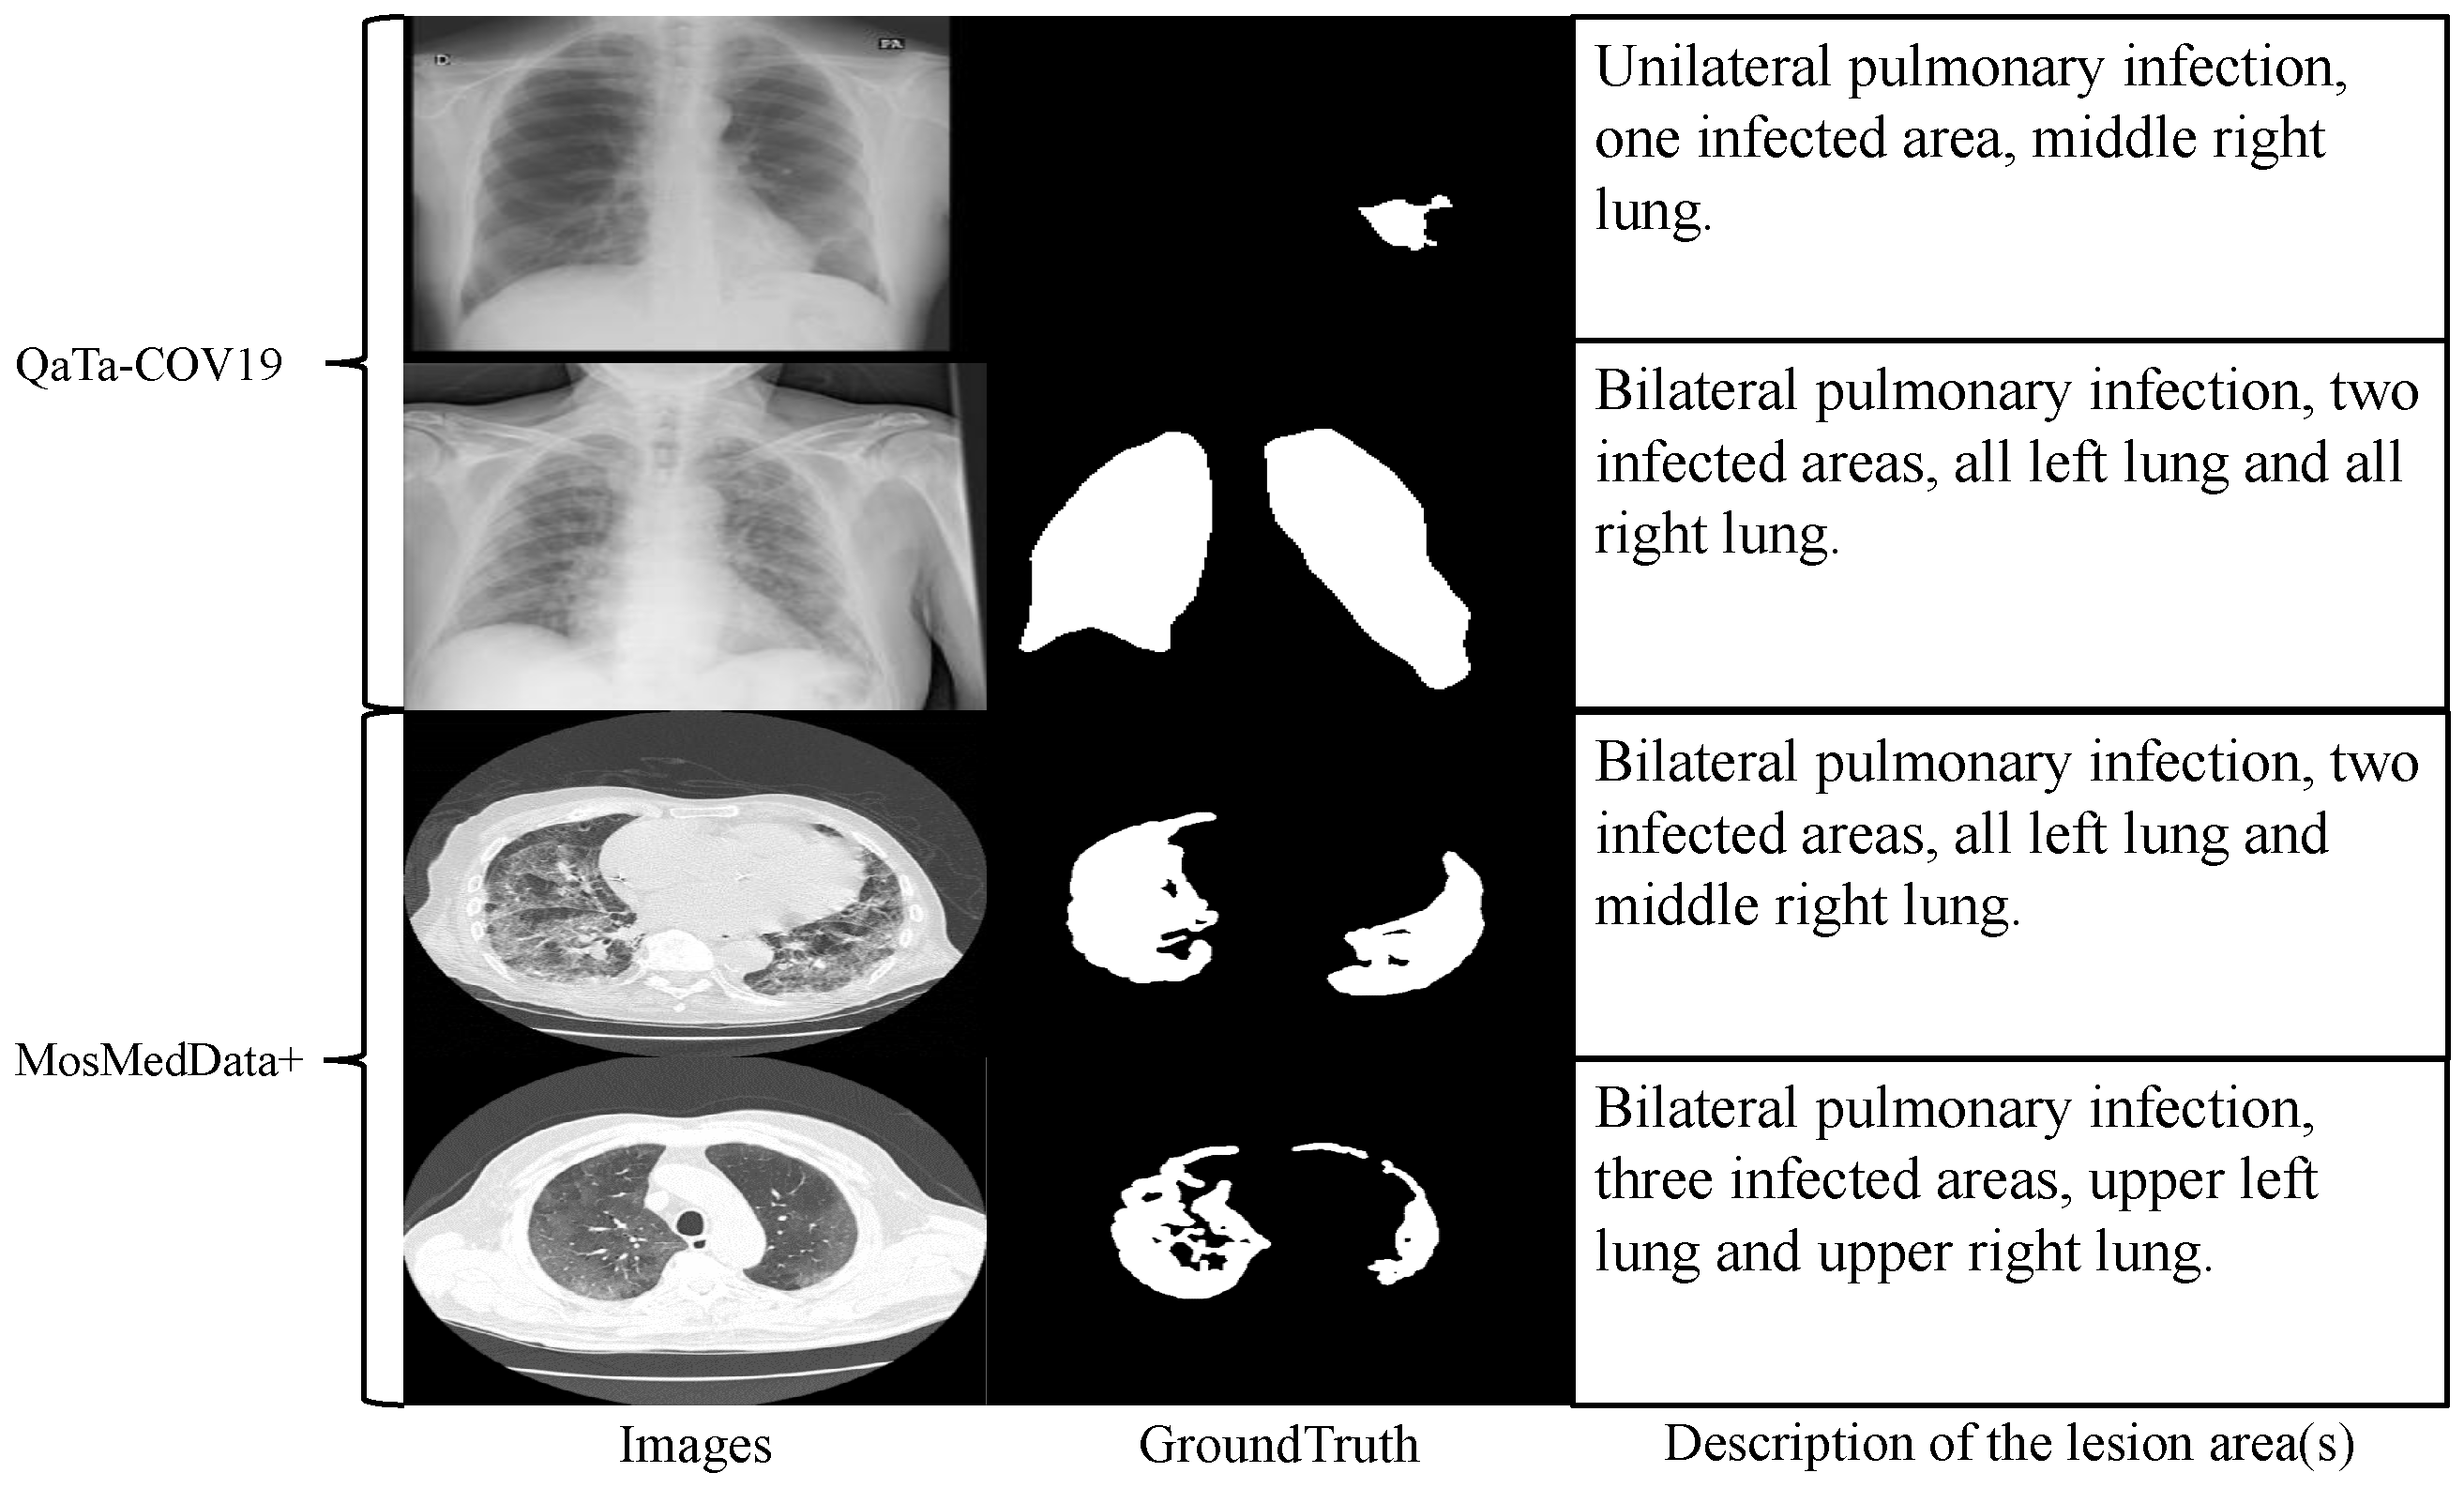
In recent years, although deep learning technologies have achieved remarkable results in this field, most existing models rely on large-scale annotated data for supervised learning and struggle to overcome the data bottleneck. In practical applications, as shown in Figure 1a, medical images are often accompanied by textual annotations that contain rich semantic information, such as the location, shape, and number of lesions [3]. Effectively integrating such textual information with visual data through a text encoder could bring new opportunities to segmentation tasks. However, the substantial parameter footprint of text encoders imposes a significant computational burden when used jointly with visual models. Therefore, adopting a lightweight text embedding scheme as an alternative to text encoders can enable high-accuracy text-assisted medical image segmentation with minimal parameter overhead. Meanwhile, medical images often exhibit blurred boundaries between different regions and low grayscale contrast, making accurate segmentation highly challenging [4]. Therefore, more efficient feature fusion mechanisms and attention strategies are urgently needed to address this issue [5].
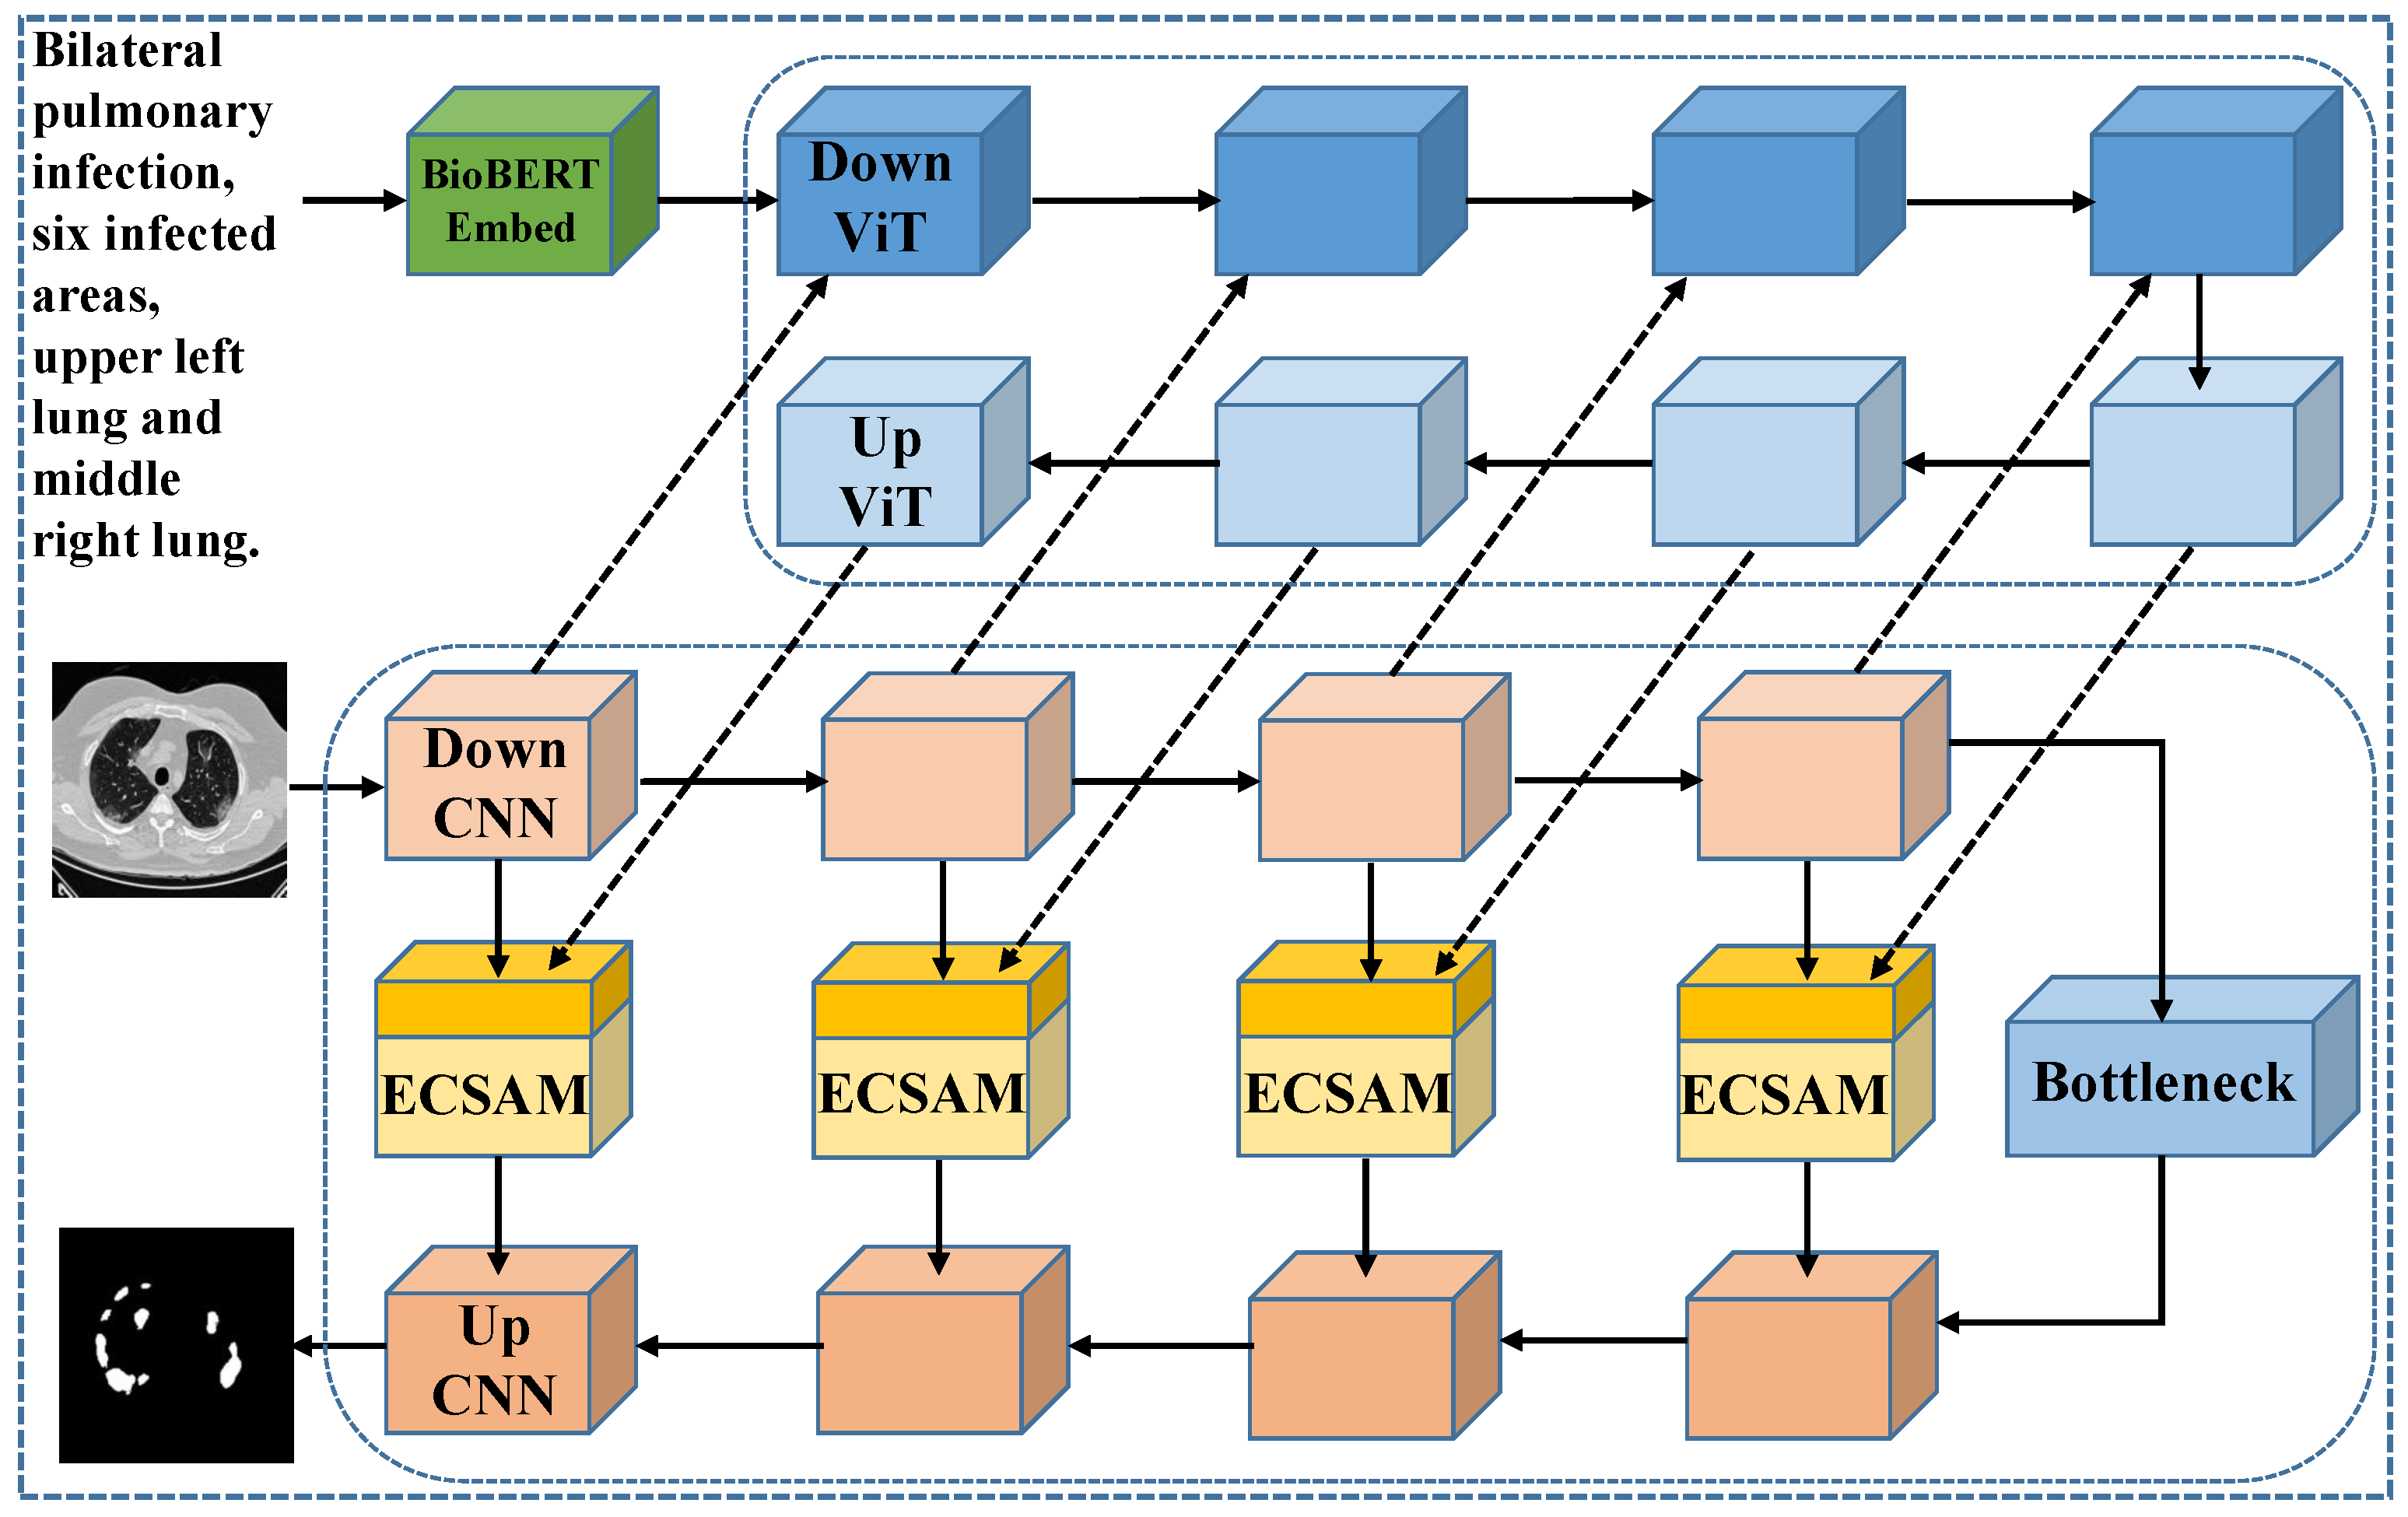
To address these challenges, we propose an innovative medical image segmentation approach that replaces the traditional text encoder with a novel, parameter-efficient text embedding method. Specifically, we introduce BioBERT [6], a model pre-trained on large-scale medical literature and specifically designed for the biomedical domain. With its profound understanding of medical terminology and semantics, BioBERT outperforms general BERT [7] in generating more clinically relevant text representations, thus providing a robust foundation for subsequent tasks.
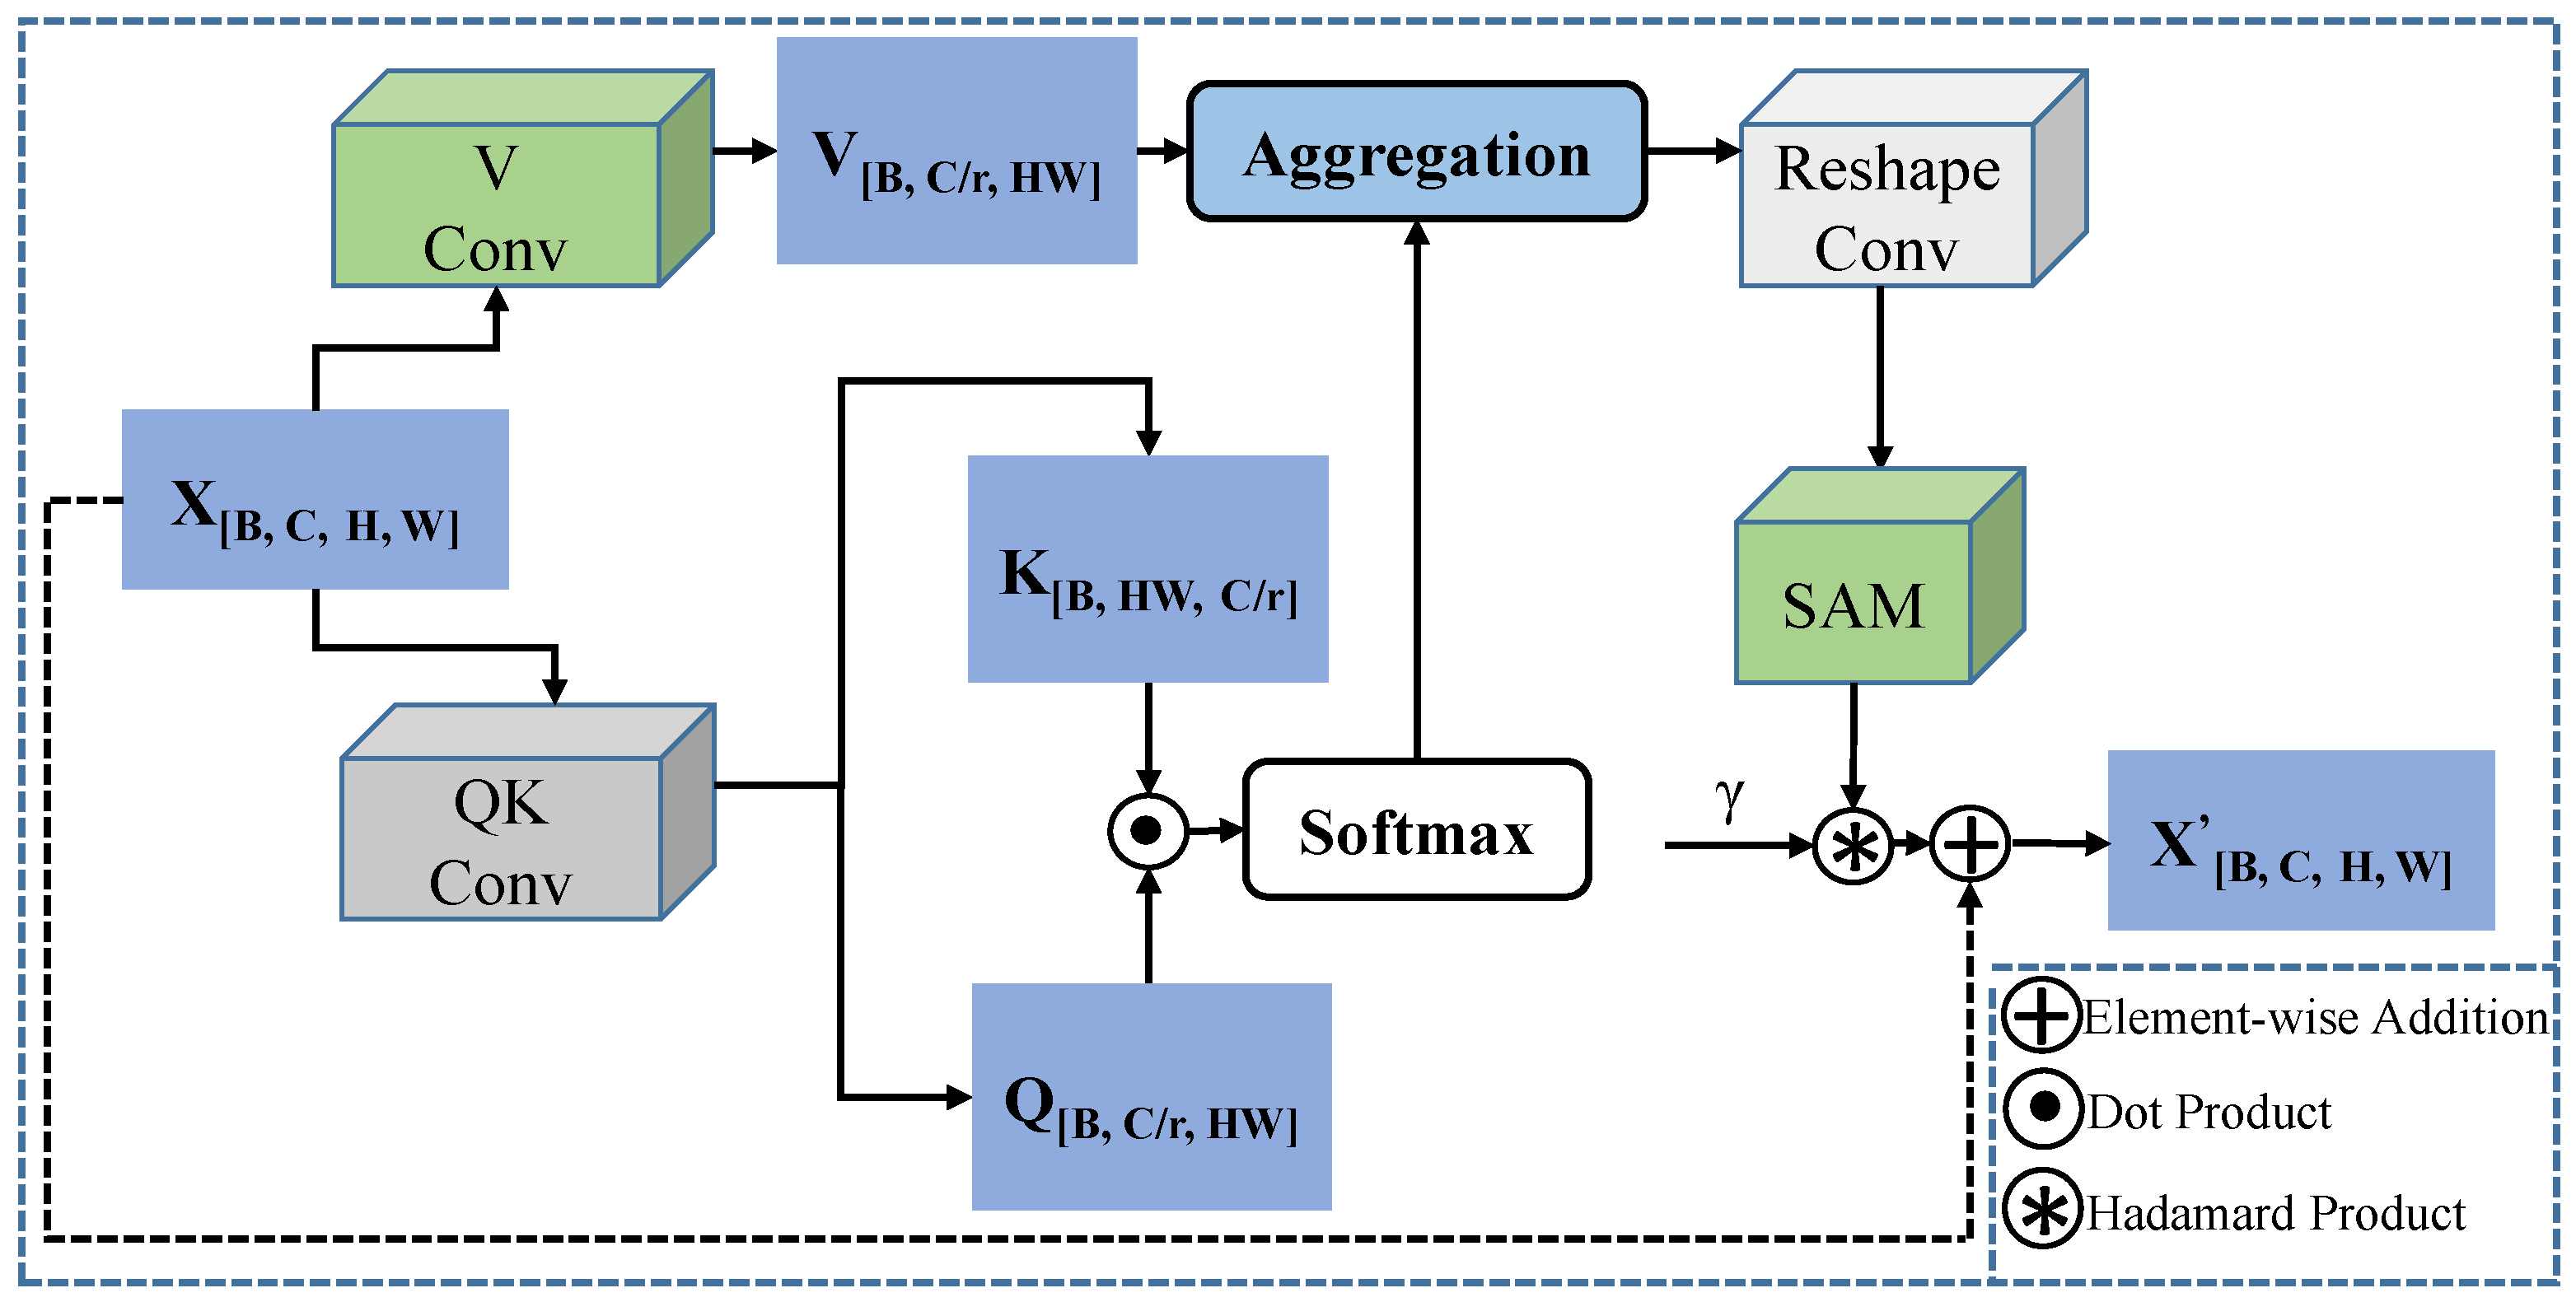
Additionally, we design a lightweight feature fusion module named the Enhanced Channel-Spatial Attention Module (ECSAM), which incorporates critical enhancements for multimodal feature fusion. Through its attention mechanism, ECSAM effectively captures cross-modal associations between images and text while enhancing MedLangViT’s focus on critical areas (e.g., lesion regions) and suppressing irrelevant information. This design significantly improves the discriminative power of feature representations.
In order to verify the effectiveness of the proposed method, we conducted comprehensive experiments on the MosMedData+ [8] and QaTa-COV19 [9,
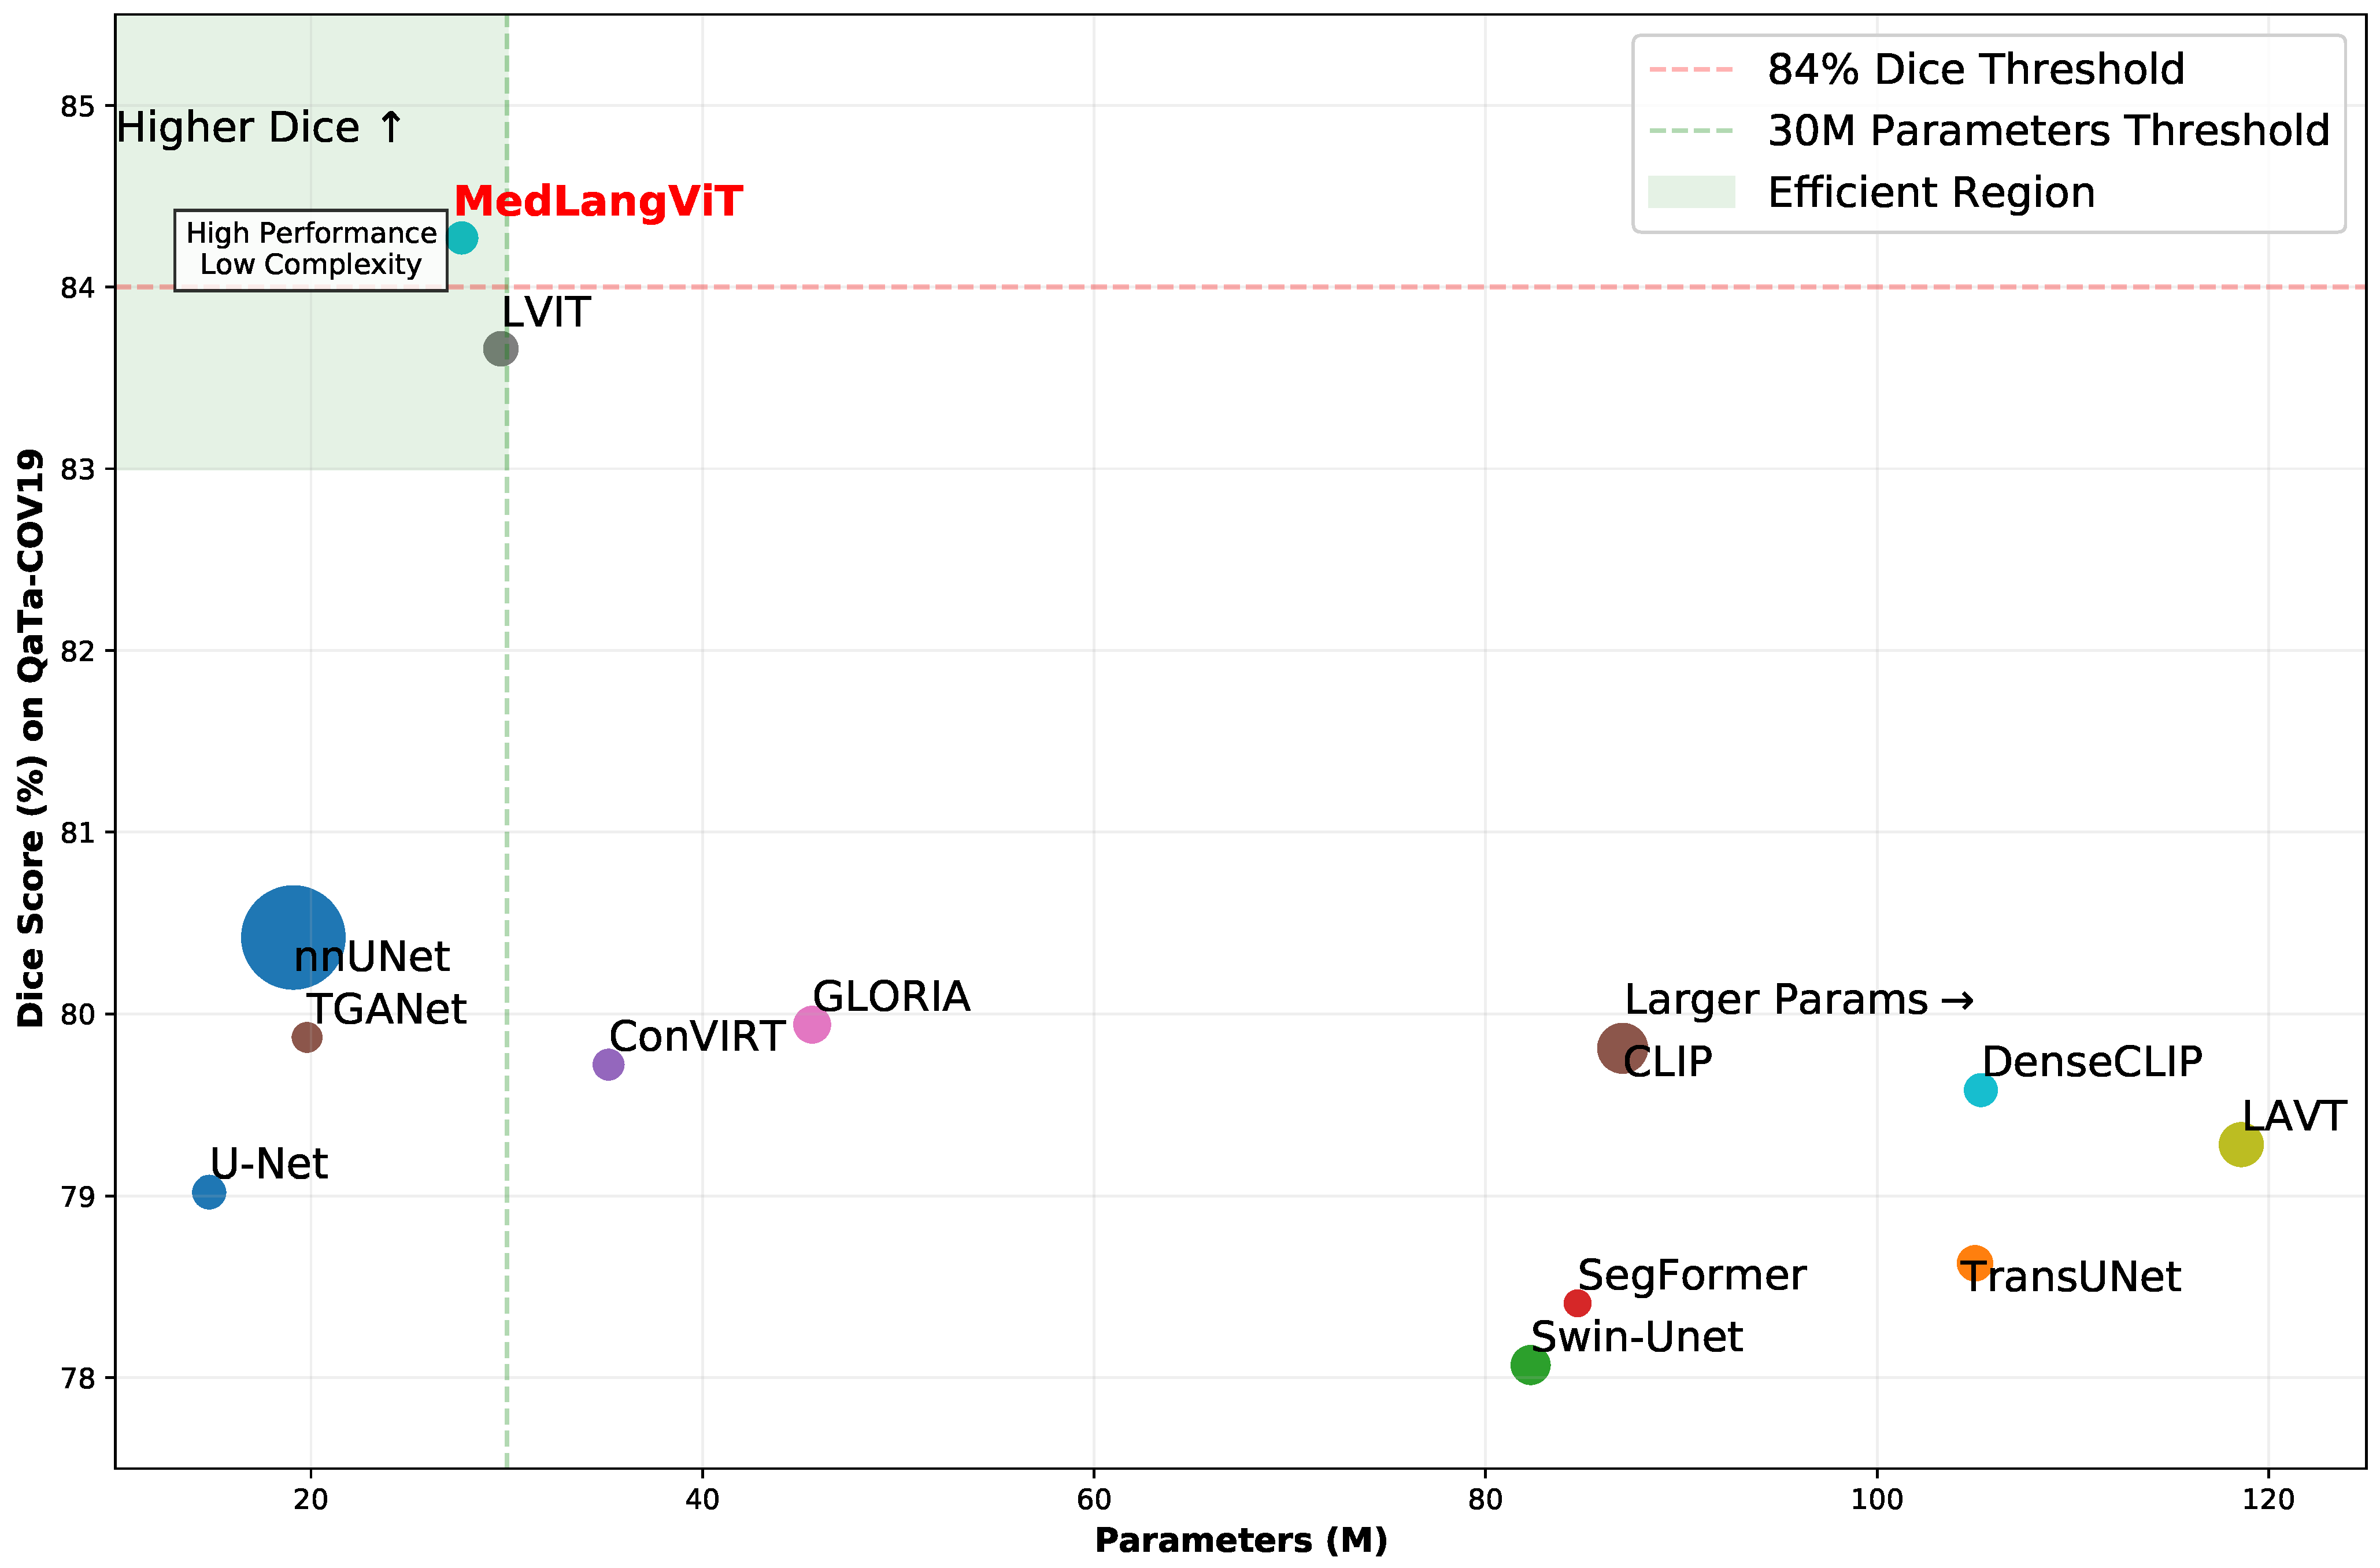
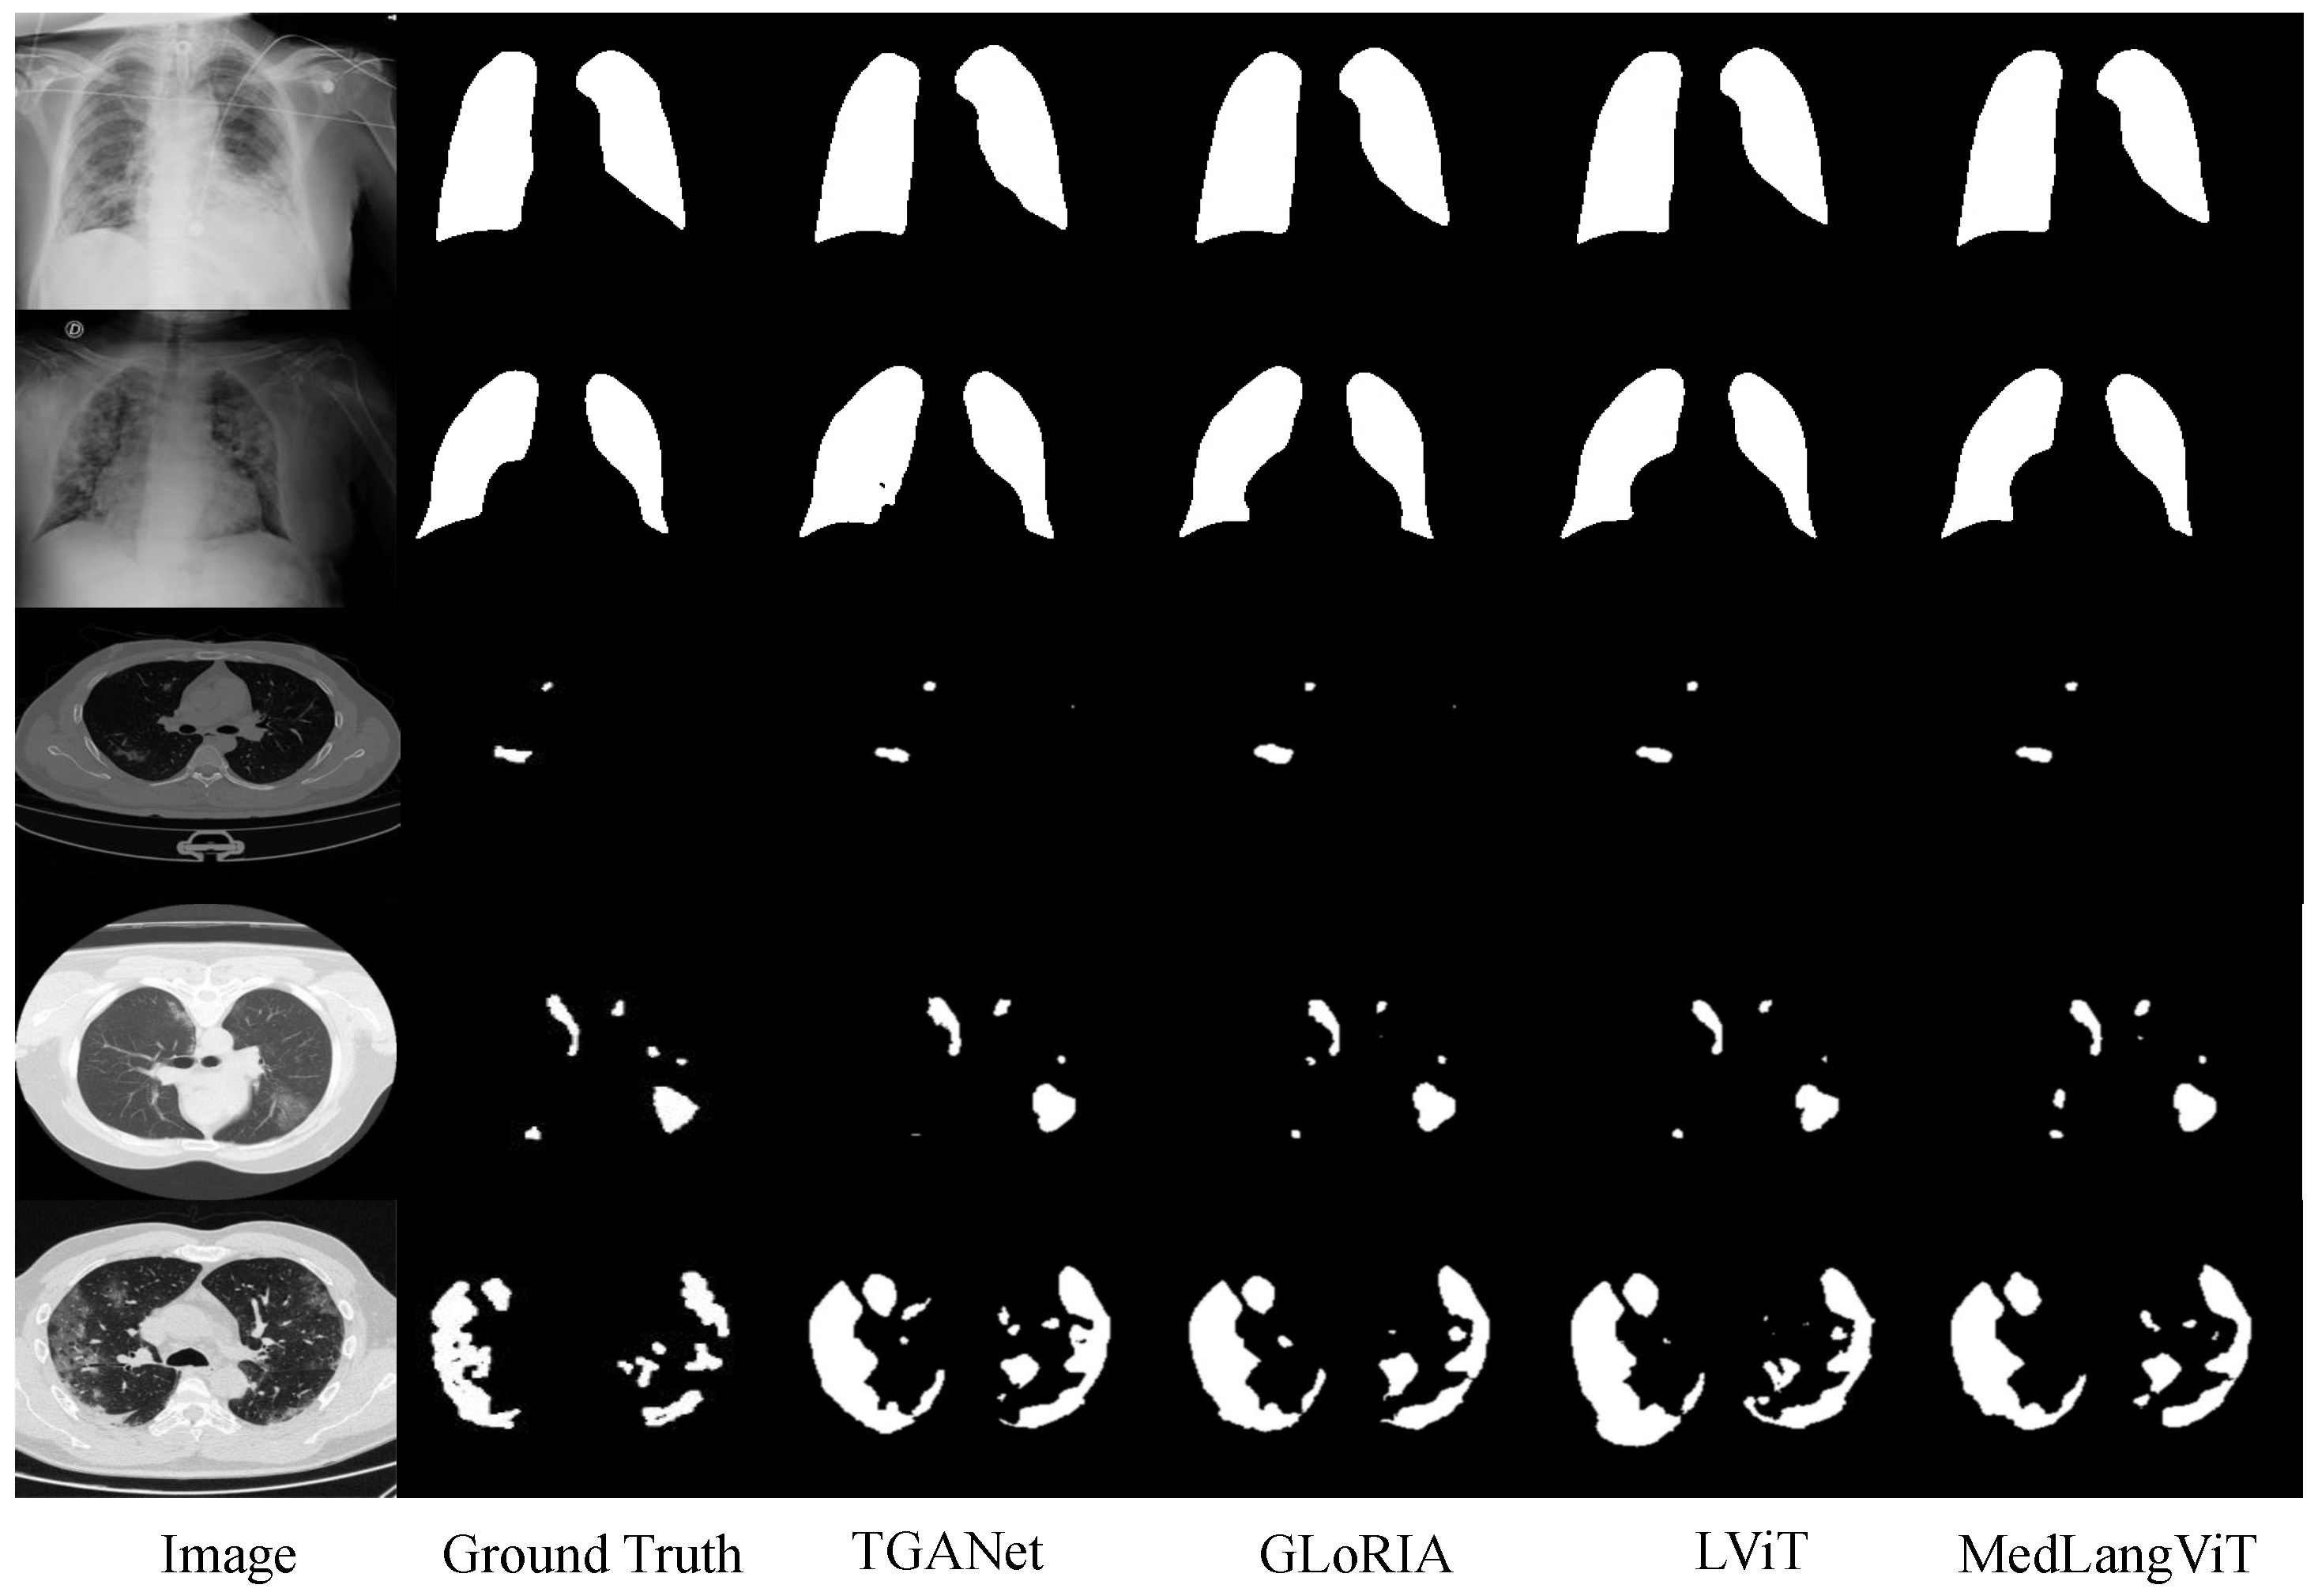
10] datasets. The MosMedData+ dataset contains extensive lung CT images with diverse infection types and lesion characteristics, while the QaTa-COV19 dataset comprises COVID-19 chest X-ray images with varied lesion patterns and detailed annotations. The experimental results are presented in Figure 2, demonstrating that MedLangViT achieves significant improvements in segmentation performance despite using fewer parameters. Key metrics, including the Dice coefficient and mean Intersection over Union (mIoU), surpass those of existing methods while maintaining lower computational complexity. These findings validate the method’s strong clinical applicability and suggest promising new research directions for medical image segmentation. Our key contributions are summarized as follows:
Novel Network Architecture. Leveraging BioBERT as the text embedder, we propose MedLangViT, an innovative image–text framework specifically designed for medical image segmentation tasks enriched with textual annotations.
Innovative Attention Module. We propose the Enhanced Channel-Spatial Attention Module, a lightweight feature-fusion mechanism that effectively captures cross-modal correlations between visual and textual modalities.
Superior Performance. MedLangViT achieves state-of-the-art results on the QaTa-COV19 and MosMedData+ datasets, demonstrating substantial improvements in medical image segmentation accuracy.
The remainder of this paper is organized as follows. Section 2 reviews related work. Section 3 presents the proposed MedLangViT method in detail. Section 4 describes the experimental setup and reports results on multiple datasets, including comprehensive ablation studies. Section 5 discusses the limitations of our approach and outlines directions for future improvement, and Section 6 concludes the paper.

2. Related Work

2.1. Medical Image Segmentation

Medical image segmentation has undergone transformative advancements with the advent of deep learning. Early architectures like U-Net [11] established the foundation for encoder–decoder frameworks, leveraging skip connections to preserve spatial details. Subsequent innovations, such as UNet++ [12] and nnUNet [13], introduced nested structures and automated hyper-parameter tuning to enhance robustness across diverse imaging modalities. Despite these improvements, a persistent challenge remains: the reliance on large-scale, high-quality annotated datasets, which are labor-intensive to curate in clinical environments. To address annotation scarcity, semi-supervised learning (SSL) [14] methods like DTC [15] and PLCT [16] exploit unlabeled data through consistency regularization or pseudo-label refinement. More specifically, in medical imaging, multi-perspective dynamic consistency learning frameworks [17] have advanced SSL by enforcing prediction invariance across diverse anatomical views and adaptive perturbation strategies. Recently, pyramid-structured transformers with adaptive fusion mechanisms have shown promise in enhancing multi-scale feature learning for semi-supervised segmentation tasks, particularly in handling complex spatial contexts [18]. Hybrid architectures such as TransUNet [19] and Swin-UNet [20] integrate Transformer modules with CNNs to capture long-range contextual dependencies while retaining local anatomical details. However, these approaches predominantly focus on imaging-only inputs, overlooking the rich semantic information embedded in clinical text reports—a critical limitation given the complementary nature of radiological text and imaging data in diagnostic workflows.

2.2. Vision–Language Models in Medical Imaging

Vision–language pretraining (VLP) models, such as CLIP [21] and ViLT [22], have significantly advanced natural image–text alignment through joint embedding learning from large-scale multimodal datasets. However, when directly applied to medical imaging, these models encounter substantial domain-specific challenges. Medical data intricacies manifest in two key aspects: images exhibit subtle intensity variations and blurred boundaries, while radiology reports contain specialized terminology that generic language models struggle to contextualize. To address these challenges, recent studies, including GLoRIA [23] and ConVIRT [24], have employed contrastive learning to align image regions with corresponding textual descriptions. Specifically, GLoRIA extracts both global and local visual features for radiology text matching, whereas ConVIRT utilizes bidirectional contrastive loss to enhance joint image–text representation learning.
BioBERT, pretrained on PubMed abstracts and clinical notes, provides a robust solution to this limitation by embedding domain-specific semantics. Unlike BERT, BioBERT undergoes explicit fine-tuning on biomedical corpora, enabling precise interpretation of medical terminology, such as distinguishing between “consolidation” and “atelectasis.” While BioBERT has demonstrated significant potential in tasks like named entity recognition and relation extraction, its integration within vision–language models for segmentation remains underexplored. Concurrent works such as TGA-Net [25] have begun exploring text-guided attention for polyp segmentation but rely on shallow text embeddings that lack deep linguistic context. Similarly, approaches aligning image patches with report snippets for pneumonia localization depend on generic text encoders, limiting their ability to process nuanced clinical descriptions. MedLangViT therefore represents an innovative advancement by embedding BioBERT within a multimodal architecture, facilitating fine-grained alignment between radiological text and visual features—a critical capability for enhancing pseudo-label quality in semi-supervised settings.

2.3. Attention Mechanisms for Multimodal Fusion

Attention mechanisms are now essential for enhancing feature representations in medical imaging. Spatial-channel attention modules, such as CBAM [26], adaptively highlight regions that are diagnostically relevant, while self-attention models global context within Transformer-based architectures. For multimodal tasks, LAVT [27] introduces pixel-word attention to align visual and linguistic features, and VLT employs cross-modal Transformers for referring segmentation. However, these methods focus on aggregating global context, often neglecting local anatomical details. This is a critical shortcoming in medical segmentation, where boundary precision is paramount. MedLangViT’s Efficient Channel Spatial Attention Module (ECSAM) addresses this imbalance by synergistically combining channel and spatial attention with BioBERT-derived text embeddings. Unlike LAVT’s cross attention, which prioritizes modal alignment, ECSAM first enhances the preservation of local features through inter-channel self-attention aggregation. It then strengthens text-guided semantic clues through spatial attention. For example, the BioBERT embedding for “lower right lung infection” guides ECSAM to enhance features in the corresponding image area. This ensures that textual context refines local structural details rather than overwhelming them. This design is particularly effective for segmenting fuzzy boundaries, such as COVID-19 lesions in X-rays, where text annotations provide key spatial priors.

3. Method

In this section, we first introduce the overall structure of MedLangViT, then explain the vision branch and language branch, and finally describe our proposed ECSAM.

3.1. Overall Architecture

Similar to LViT, our MedLangViT model adopts a Double-U structure, comprising a vision branch and a language branch. The overall architecture of MedLangViT is shown in Figure 3. The vision branch is a U-shaped CNN branch composed of multiple CNN blocks, tasked with image feature extraction and segmentation prediction. The language branch is a U-shaped ViT branch consisting of a BioBERT Embed block and multiple ViT blocks. The BioBERT Embed block conducts medical annotation text embedding to aid segmentation, while the ViT blocks fuse image and text information. Moreover, we integrate an Enhanced Channel-Spatial Attention Module (ECSAM) at the skip connections of the U-shaped CNN branch. This allows the upsampling process in the CNN branch to capture the maximum extent of image feature information. Finally, the network feeds the fused information from corresponding hierarchical levels back to the vision branch for final segmentation. The input shape and output shape of every layer of the network are shown in Table 1 and Table 2.

3.2. Vision Branch

As depicted in Figure 3, the U-shaped CNN branch processes image information and serves as the segmentation head to generate the prediction mask. Each CNN module consists of Convolution, Batch Normalization, and R e L U activation layers. Between successive DownCNN modules, image features undergo downsampling via MaxPool layers. Corresponding UpCNN modules incorporate features through concatenation operations. The operations within each CNN module are formally defined by Equations (1) and (2):
D i = D o w n C N N i = R e L U ( B N ( C o n v i ( · ) ) )
Y D o w n C N N , i + 1 = M a x P o o l ( D i ( Y D o w n C N N , i ) )
where Y D o w n C N N , i represents the input of the i-th DownCNN module, which becomes Y D o w n C N N , i + 1 after the downsampling of the i-th DownCNN module and the MaxPool layer. To enhance image feature learning, an Enhanced Channel-Spatial Attention Module (ECSAM) is integrated at the skip connections within the U-shaped CNN branch. This module receives cross-modal interaction features from both the CNN and ViT branches. The refined features from ECSAM are then propagated to the corresponding UpCNN modules, progressively delivering multi-level contextual information during the upsampling path.

3.3. Language Branch

Within the U-shaped CNN architecture, the complementary U-shaped ViT branch is engineered to integrate visual and textual features. As illustrated in Figure 3, the initial DownViT layer processes two inputs: textual embeddings from BioBERT-Embed and visual features extracted by the first DownCNN layer. Here, BioBERT provides the pretrained foundation for BioBERT-Embed. The cross-modal fusion mechanism is formally defined by Equation (3):
Y D o w n V i T , 1 = V i T ( x i m g , 1 + R e L U ( B N ( C o n v ( x t e x t ) ) )
where x i m g , i denotes image features from the DownCNN path, x t e x t represents textual features, and PatchEmbedding transforms Y D o w n C N N , i into embedded features x i m g , i . The ViT module comprises Multi-headed Self-attention (MHSA) and MLP layers, with LN indicating layer normalization. Subsequent DownViT layers (i = 2, 3, 4) simultaneously consume features from both the preceding DownViT module and the corresponding DownCNN layer, as specified in Equation (4):
Y D o w n V i T , i + 1 = V i T ( Y D o w n V i T , i + x i m g , i + 1 )
These multi-scale features are then propagated back through the UpViT module to the CNN-ViT interaction stage. At each level, they merge with features from the corresponding DownCNN pathway. This hierarchical fusion strategy strengthens global feature representation while diminishing dependence on potentially noisy text annotations, thereby enhancing model robustness.

3.4. Enhanced Channel-Spatial Attention Module

In this subsection, we introduce the Enhanced Channel-Spatial Attention Module (ECSAM), which is designed to improve feature representation by integrating channel and spatial attention mechanisms while maintaining computational efficiency. ECSAM is composed of several key components that work together to achieve this goal, as shown in Figure 4.
The ECSAM processes input features X R B × C × H × W through an integrated channel and spatial attention mechanism. First, we perform a shared projection for both query and key vectors using a 1 × 1 convolutional layer with batch normalization and R e L U activation. This produces a combined tensor, which is then split into query matrix Q and key matrix K:
Q K = σ ( B N ( C o n v 1 × 1 ( X ) ) ) , Q , K = s p l i t ( Q K , [ C / r , C / r ] )
where Q R B × C / r × H W and K R B × H W × C / r after reshaping operations. Simultaneously, we compute the value projection V using a separate 1 × 1 convolutional layer with batch normalization and R e L U activation:
V = σ ( B N ( C o n v 1 × 1 ( X ) ) ) R B × C / r × H W
We then compute channel attention weights through matrix multiplication and softmax normalization. These weights are applied to the value matrix to obtain channel-enhanced features:
E n e r g y = Q K , A = s o f t m a x ( E n e r g y ) , V l o w = A V
where V l o w R B × C / r × H W represents the channel-enhanced features in reduced dimension. The channel-enhanced features are restored to the original dimension using a grouped convolution with batch normalization:
V = B N ( G r o u p C o n v 1 × 1 ( r e s h a p e ( V l o w ) ) ) R B × C × H × W
Spatial attention is applied by first extracting spatial information through pooling operations. The average-pooled and max-pooled features are concatenated and processed through a convolutional layer with sigmoid activation to generate spatial attention weights S:
a v g = A v g P o o l ( V ) , m a x = M a x P o o l ( V )
S = σ ( C o n v k × k ( c o n c a t ( a v g , m a x ) ) ) [ 0 , 1 ] B × 1 × H × W
The spatial attention weights are then applied to the channel-enhanced features through element-wise multiplication:
X = V S
Finally, a dynamic weighting parameter γ adjusts the contribution of the attention mechanism, and the output is combined with the original features through a residual connection:
O = γ X + X
where γ R 1 × C × 1 × 1 is a learnable parameter initialized to zero.
In the evolutionary trajectory of channel attention mechanisms, the core innovation of ECSAM lies in its deep integration of efficient self-attention mechanisms into channel modeling, significantly enhancing computational efficiency through parameter sharing and structural optimization. Its design abandons traditional channel statistics extraction based on global pooling (as seen in the channel branches of SE Block [28] and CBAM [26]), as these methods essentially compress the two-dimensional feature map of each channel into a single value through pooling operations. While simple and efficient, they lose spatial details and can only model static statistical relationships between channels. Instead, it employs a shared-weight 1 × 1 convolution to simultaneously generate dimensionality-reduced Query and Key. Within this low-dimensional space, it utilizes self-attention to dynamically learn complex interdependencies between channels. This is followed by efficient channel dimension recovery via grouped convolution, supplemented by a post-positioned lightweight spatial attention module for spatial modulation. Finally, dynamic residual fusion is achieved through a learnable gamma ( γ parameter. Compared with SE Block, which relies solely on global average pooling for static channel weighting and completely ignores spatial information, and CBAM, which combines channel attention (based on maxpooling and avgpooling) and spatial attention but features relatively static channel modeling and lower parameter efficiency, ECSAM achieves richer, more context-aware channel interaction modeling through dynamic self-attention. Concurrently, strategies like shared projections and grouped convolution deliver higher parameter and computational efficiency, forming a synergistic optimization mechanism that fuses dynamic channel interaction with spatial modulation.

4. Experiments and Results

4.1. Datasets

QaTa-COV19 dataset: The QaTa-COV19 dataset is compiled by researchers from Qatar University and Tampere University. It contains 9258 COVID-19 chest X-ray images with manual annotations of COVID-19 lesions. The annotations are subsequently enriched with text-based details as per [10], concentrating on the infection status of both lungs, the quantity of affected zones, and the general location of these infected areas. The detailed dataset partitioning is shown in Table 3.
MosMedData+ dataset: The MosMedData+ dataset, containing 2729 CT scans of lung infections along with corresponding text descriptions (“Bilateral pulmonary infection, three infected areas, middle left lung and middle right lung”), is divided as shown in Table 3.
As shown in Figure 5, there are several example images and corresponding text descriptions.

4.2. Implementation Details

We train each model on a single NVIDIA RTX 6000 GPU with 48 GB memory (NVIDIA Corporation, Santa Clara, CA, USA) using the MosMedData+ and QaTa-COV19 datasets. Our model is based on PyTorch 1.12.0 and we use 224 × 224 images and the Adam optimizer. For MosMedData+, we set the batch size to 8, the learning rate to 1 × 10 3 , and trained for 200 epochs. For QaTa-COV19, we set the batch size to 8, the learning rate to 3 × 10 4 , and the epochs to 200. The loss function is shown as Equation (15).

4.3. Loss Function and Evaluation Metrics

The loss function we use is shown in Equation (15), where L D i c e means dice loss and L C E means cross-entropy loss.
L D i c e = 1 2 × | Y Y ^ | | Y | + | Y ^ |
L C E = 1 N i = 1 N × y i log ( y i ^ ) + ( 1 y i ) log ( 1 y i ^ )
L = ( L D i c e + L C E ) 2
In our experiments, Y and Y ^ are the ground truth and predicted result. N denotes the total pixel count. y i Y and y i ^ Y i ^ .
To assess performance, the Dice score and the mIoU metric are employed to evaluate our MedLangViT model and other SOTA methods, as detailed in Equations (16) and (17):
D I C E ( Y , Y ^ ) = 2 × | Y Y ^ | | Y | + | Y ^ | = 1 L D i c e
I o U ( Y , Y ^ ) = | Y Y ^ | | Y Y ^ |
where Y and Y ^ also have the same definition as in the above section. m I o U is the average of I o U s for all categories.

4.4. Results on QaTa-COV19 and MosMedData+ Datasets

On the QaTa-COV19 dataset, the MedLangViT method achieved a Dice coefficient and mIoU of 84.27% and 75.93%, respectively, as shown in Table 4, representing a significant improvement over other methods. On the more challenging MosMedData+ dataset, it obtained a Dice coefficient of 75.95% and an mIoU of 63.17%, again outperforming other approaches. In terms of parameter count and computational complexity (FLOPs), MedLangViT has a parameter count of 27.7 M and FLOPs of 47.8 G. Compared with recent vision–language models for segmentation, MedLangViT demonstrates superior computational efficiency: It requires only 31.8% of CLIP’s parameters (87.0 M to 27.7 M) and 45.4% of its FLOPs (105.3 G to 47.8 G), while outperforming LAVT (118.6 M/83.8 G) by 5.0% Dice on MosMedData+ with 65% fewer parameters. Even against similarly sized LVIT (29.7 M/54.1 G), MedLangViT achieves higher accuracy with 11.6% fewer FLOPs. Compared with methods with higher parameters and computational complexity, such as TransUNet (105.0 M/56.7 G) and Swin-Unet (82.3 M/67.3 G), MedLangViT achieves superior performance while maintaining lower parameter and computational complexity, indicating a better balance between model efficiency and performance. This efficiency stems from our lightweight medical-specific architecture and optimized text–image fusion, avoiding computational overhead from large pretrained VL backbones or complex fusion modules. Additionally, compared with purely visual methods that do not utilize textual information, all text-guided models demonstrate a significant and consistent advantage on both datasets. This indicates that incorporating auxiliary textual information can effectively enhance MedLangViT’s understanding and segmentation accuracy of COVID-19-related lung lesions. As the optimal text-guided method, MedLangViT’s superior performance and efficiency further confirm the effectiveness of its hybrid architecture (CNN-Transformer) and text–image fusion strategy, particularly in handling complex and diverse lesion patterns.
MedLangViT not only leads in accuracy but also excels in model efficiency, with lower parameter and computational complexity than other high-performance hybrid models, making it more practical. On the more challenging MosMedData+ dataset, MedLangViT shows a greater improvement over the second-best method compared with its improvement on QaTa-COV19, indicating its robustness and generalization ability in handling more complex, noisy, or data with greater annotation differences. Overall, MedLangViT achieves state-of-the-art COVID-19 lung lesion segmentation accuracy on both the QaTa-COV19 and MosMedData+ datasets while maintaining lower model complexity and computational cost, validating its effectiveness and efficiency.
Since the quantitative results of image-only models are consistently lower than those of text–image models, we performed qualitative analysis only on the text–image models. The qualitative results of MedLangViT and other state-of-the-art methods on the MosMedData+ and QaTa-COV19 datasets are shown in Figure 6. To demonstrate segmentation performance across varying lesion sizes, we present representative results from the MosMedData+ dataset categorized into three groups: small, medium, and large lesions. As shown in Figure 6, while segmentation accuracy for small and medium lesions shows comparable performance across methods, our approach achieves significantly superior shape fidelity and topological continuity for large lesions, more closely aligning with the ground truth annotations. The qualitative results demonstrate that MedLangViT exhibits robust semantic segmentation capabilities compared with other state-of-the-art multimodal segmentation methods. Due to the advantage of integrating both text and image information into a single encoder, MedLangViT achieves finer segmentation boundaries.

4.5. Ablation Study

In this section, we conduct five sets of ablation experiments to demonstrate the necessity of each component in MedLangViT, the choice of hyper-parameters, the internal structure of ECSAM, different attention mechanisms, and different BERT-based embeddingson two datasets.

4.5.1. Effect of Each Component

In this section, we conduct an ablation study on the MosMedData+ dataset to demonstrate the necessity of each component in our network architecture. Table 5 ablates the contribution of key components in our framework on the MosMedData+ dataset. We specifically focus on the BERT, Pixel-Level Attention Module (PLAM), BioBERT, and the proposed Enhanced Channel-Spatial Attention Module (ECSAM).
The synergistic combination of BERT and PLAM, as implemented in LViT, achieved a Dice score of 74.57% and an mIoU of 61.33% on the MosMedData+ dataset. Replacing PLAM with ECSAM while retaining BERT improved Dice by 0.32% (74.89%), demonstrating that ECSAM enhances spatial-text feature fusion compared with PLAM. Strikingly, using BioBERT with PLAM yields a Dice of 75.03%, significantly outperforming BERT-based configurations. This confirms that medical-specific language modeling was critical for capturing clinical semantics. Most importantly, the synergistic integration of BioBERT and ECSAM achieves 75.95% Dice and 63.17% mIoU—the highest results in the ablation. This combination surpasses the isolated gains of BioBERT and ECSAM, with a total improvement of 1.38% Dice.
The superadditive effect highlights their complementary roles: BioBERT provides clinically grounded text representations, and ECSAM dynamically aligns these representations with visual features at optimal spatial granularity, thereby eliminating semantic ambiguities and refining lesion boundary delineation. Specifically, the superior performance of ECSAM stems from its dynamic channel modeling that replaces static pooling-based statistics with efficient self-attention, capturing complex inter-channel dependencies while preserving spatial integrity through shared 1 × 1 convolutions for Query/Key generation and lightweight spatial refinement. This paradigm shift from compression-based methods enables richer context-aware feature fusion.

4.5.2. Effect of Hyper-Parameters

In this section, we conduct an ablation study on hyper-parameters, including batch size and learning rate. We test MedLangViT on two datasets: MosMedData+ and QaTa-COV19. For the batch size, we try three different settings: 8, 4, and 2. For the learning rate, we adopted the settings from [10], which are 3 × 10 4 and 1 × 10 3 . The experimental results can be seen in Table 6. As shown in the table, for the QaTa-COV19 dataset, the best results are achieved with a batch size of 8 and a learning rate of 3 × 10 4 . For the MosMedData+ dataset, the optimal results are obtained with a batch size of 8 and a learning rate of 1 × 10 3 . Overall, the results indicate that variations in batch size lead to more significant improvements in performance compared with changes in learning rate.

4.5.3. Effect of Internal Structure of ECSAM

Table 7 quantitatively ablates the internal components of ECSAM on MosMedData+. When employing separate 1 × 1 convolutions for Query and Key generation (QConv + KConv) without SAM, the baseline achieves 73.47% Dice. Replacing these with a unified QKConv (shared-weight 1 × 1 convolution for joint Q/K generation) yields a 0.28% Dice gain, demonstrating that parameter sharing enhances efficiency while maintaining representational capacity. The addition of the Spatial Attention Module (SAM) to separate Q/K convolutions boosts performance substantially to 74.68% Dice, validating SAM’s critical role in spatial refinement. Most significantly, the synergistic integration of QKConv and SAM achieves peak performance (75.95% Dice, 63.17% mIoU), surpassing the isolated QKConv configuration by 2.20% Dice and exceeding the QConv+KConv+SAM combination by 1.27% Dice. This confirms that QKConv’s parameter-efficient channel modeling and SAM’s spatial enhancement operate complementarily, with their joint optimization being essential for ECSAM’s full efficacy.

4.5.4. Effect of Different Attention Mechanism

When analyzing the impact of different attention mechanisms on model performance, the ECSAM demonstrates comprehensive advantages, as shown in Table 8. Compared with the SE Block and CBAM, ECSAM achieves the lowest inference latency of 29.52 ms with only a slight increase in parameter count to 27.74 M and computational load to 47.75 G FLOPs, reducing latency by 1.1% compared with the SE Block and by 3.5% compared with CBAM, while also reducing memory usage to 9.07 MB, which is 6.6% less than the SE Block and 7.0% less than the CBAM. More importantly, ECSAM significantly improves segmentation accuracy, with a Dice coefficient of 75.95%, which is 1.27 percentage points higher than the SE Block and 1.34 percentage points higher than CBAM; the mIoU metric reaches 63.17%, which is 1.39 percentage points better than the SE Block and 1.35 percentage points better than CBAM, fully validating the module’s dual advantages in enhancing feature representation capabilities and optimizing computational efficiency.

4.5.5. Effect of Different BERT-Based Embeddings

To investigate the impact of different BERT-based embeddings, we evaluated MedLangViT integrated with three biomedical BERT variants: PubMedBERT, BlueBERT, and BioBERT. As Table 9 shows, substituting these embedding modules maintained identical parameter counts of 27.74 M and computational costs of 47.75 G FLOPs, since all three share the same BERT-base architecture with only pretrained weights differing based on their training corpora: PubMedBERT used PubMed abstracts [31], BlueBERT combined PubMed abstracts with MIMIC-III clinical notes [32], and BioBERT leveraged both PubMed abstracts and PMC full-text articles [6]. Crucially, despite the identical model scale, segmentation performance varied significantly. BioBERT achieved optimal results with a Dice coefficient of 75.95% and mIoU of 63.17%, attributed to its exposure to detailed radiological descriptions in PMC full texts. PubMedBERT yielded lower performance at 75.41% Dice and 62.21% mIoU due to abstract-only training data limitations. BlueBERT performed weakest at 75.08% Dice and 61.97% mIoU, likely hindered by non-standardized clinical jargon and a smaller pretraining scale. These results confirm that pretraining corpus characteristics drive performance differences when using different BERT-based embeddings, where BioBERT’s full-text exposure aligns best with lung CT segmentation tasks, underscoring the necessity of selecting text embeddings pretrained on task-relevant subdomains within multimodal medical imaging architectures.

4.6. Interpretability Study

We conduct explainability studies on the QaTa-COV19 and MosMedData+ datasets to evaluate whether our network focuses on lesion regions better than other multimodal networks. To intuitively show changes in model attention areas, we use GradCAM [33] to compare activation in these regions. As Figure 7 shows, compared with TGANet, GLoRIA, and LViT, our MedLangViT has more precise activation regions that better match lesion contours on QaTa-COV19. On MosMedData+, MedLangViT activation regions are broader with fewer omissions.
Additionally, to better explore the regional activation patterns within our model’s feature processing process, we conduct further experiments on the MosMedData+ dataset. We select a visually interpretable case (the original ground truth in the third row of Figure 7) for visualization, as shown in Figure 8 and Figure 9. Focusing on the image processing pathway, we generate activation mappings across all DownCNN and UpCNN layers of the network using BioBERT and ECSAM, as well as BioBERT and PLAM. It can be observed in Figure 8 and Figure 9 that during the downsampling stages, activated regions gradually converge toward the core lesion areas. Subsequent upsampling stages then precisely localize these pathological regions. But compared with Figure 9, the activation region in Figure 8 is more accurate. This indicates that our ECSAM is more helpful in improving the attention of lesion areas.

5. Discussion

While MedLangViT has achieved substantial progress by integrating clinical text, its upper limit is ultimately constrained by annotation quality. Firstly, inter-clinician variations in descriptive precision, exemplified by ambiguous phrases such as “mildly opaque” or “hazy area”, introduce semantic ambiguity. This challenges BioBERT’s word sense disambiguation capabilities. Additionally, terminology differences across institutions—including British versus American spellings and abbreviation conventions—further amplify these inconsistencies. Secondly, mismatches between textual descriptions and actual visual features (e.g., mentions of invisible lesions or extremely subtle pathologies) can misguide ECSAM’s spatial attention and cause over-activation of attention heatmaps in erroneous regions. Thirdly, MedLangViT inherently assumes clean and complete text–image pairs. However, common retrospective data issues such as spelling errors, missing fields, and copy–paste artifacts (including repeated or conflicting descriptions) directly undermine segmentation robustness, particularly in low-resource settings. Finally, model confidence may sharply decline when encountering real-world low-quality or partially missing text annotations. Future work will quantify these impacts and develop ambiguity-resilient fusion mechanisms.

6. Conclusions

In this paper, we propose a novel language–vision model for medical image segmentation, termed MedLangViT. The model employs BioBERT—a medically specialized language model—to embed clinical text annotations, thereby mitigating limitations inherent in image-only data. Furthermore, we propose an Enhanced Channel-Spatial Attention Module (ECSAM) that aggregates inter-channel self-attention to enhance local features and subsequently reinforces text-guided semantic cues through spatial attention mechanisms, synergistically integrating textual and visual representations. Experimental results on both MosMedData+ and QaTa-COV19 datasets demonstrate that our model outperforms state-of-the-art approaches, including classical vision-only models and contemporary language–vision frameworks. Future work will explore quantitative and qualitative impacts of text annotations on model performance, including robustness to annotation variability/ambiguity and the framework’s generalizability across diverse medical imaging modalities.

Author Contributions

Conceptualization: Y.W.; methodology: Y.W.; software: Y.W.; validation: Y.W.; investigation: Y.W.; resources: Y.W., E.N. and X.L.; data curation: Y.W.; writing—original draft: Y.W.; writing—review and editing: J.S. and E.N.; visualization: Y.W.; supervision: J.S. and E.N.; project administration: E.N. and X.L.; funding acquisition: E.N. All authors have read and agreed to the published version of the manuscript.

Funding

This work is supported by Jsps kakenhi grant Number JP24K14998.

Data Availability Statement

The data analyzed in this study were obtained from the existing public datasets named QaTa-COV19 Dataset and MosMedData+ Dataset, available at https://www.kaggle.com/datasets/aysendegerli/qatacov19-dataset (accessed on 31 March 2025) and https://medicalsegmentation.com/covid19/ (accessed on 10 March 2025), respectively. No new data were created.

Acknowledgments

During the preparation of this manuscript/study, the author(s) used DeepSeek-R1 for the purposes of the generation of equations in Section 3.4 and Section 4.3. The authors have reviewed and edited the output and take full responsibility for the content of this publication.

Conflicts of Interest

The authors declare no conflicts of interest. The funder is involved in the decision to publish the results.

Abbreviations

The following abbreviations are used in this manuscript:
ECSAMEnhanced Channel-Spatial Attention Module
PLAMPixel-Level Attention Module
ViTVision Transformer
DTCDual-task Consistency
SSLSemi-supervised Learning

References

  1. Li, Z.; Li, D.; Xu, C.; Wang, W.; Hong, Q.; Li, Q.; Tian, J. Tfcns: A cnn-transformer hybrid network for medical image segmentation. In Artificial Neural Networks and Machine Learning – ICANN 2022 31st International Conference on Artificial Neural Networks, Bristol, UK, 6–9 September 2022, Proceedings; Springer: Berlin/Heidelberg, Germany, 2022; pp. 781–792. [Google Scholar]
  2. Roth, H.R.; Xu, Z.; Tor-Díez, C.; Jacob, R.S.; Zember, J.; Molto, J.; Li, W.; Xu, S.; Turkbey, B.; Turkbey, E.; et al. Rapid artificial intelligence solutions in a pandemic—The COVID-19-20 Lung CT Lesion Segmentation Challenge. Med. Image Anal. 2022, 82, 102605. [Google Scholar] [CrossRef] [PubMed]
  3. Zhang, Y.; Lv, B.; Xue, L.; Zhang, W.; Liu, Y.; Fu, Y.; Cheng, Y.; Qi, Y. SemiSAM+: Rethinking Semi-Supervised Medical Image Segmentation in the Era of Foundation Models. arXiv 2025, arXiv:2502.20749. [Google Scholar] [CrossRef]
  4. Lan, X.; Jin, W. Multi-scale input layers and dense decoder aggregation network for COVID-19 lesion segmentation from CT scans. Sci. Rep. 2024, 14, 23729. [Google Scholar] [CrossRef] [PubMed]
  5. Zhang, J.; Ding, X.; Hu, D.; Jiang, Y. Semantic segmentation of COVID-19 lesions with a multiscale dilated convolutional network. Sci. Rep. 2022, 12, 1847. [Google Scholar] [CrossRef] [PubMed]
  6. Lee, J.; Yoon, W.; Kim, S.; Kim, D.; Kim, S.; So, C.H.; Kang, J. BioBERT: A pre-trained biomedical language representation model for biomedical text mining. Bioinformatics 2020, 36, 1234–1240. [Google Scholar] [CrossRef] [PubMed]
  7. Devlin, J.; Chang, M.W.; Lee, K.; Toutanova, K. Bert: Pre-training of deep bidirectional transformers for language understanding. In Proceedings of the 2019 Conference of the North American Chapter of the Association for Computational Linguistics: Human Language Technologies (Long and Short Papers), Minneapolis, MN, USA, 2–7 June 2019; Volume 1, pp. 4171–4186. [Google Scholar]
  8. Morozov, S.P.; Andreychenko, A.E.; Pavlov, N.A.; Vladzymyrskyy, A.; Ledikhova, N.V.; Gombolevskiy, V.A.; Blokhin, I.A.; Gelezhe, P.B.; Gonchar, A.; Chernina, V.Y. Mosmeddata: Chest ct scans with COVID-19 related findings dataset. arXiv 2020, arXiv:2005.06465. [Google Scholar]
  9. Degerli, A.; Kiranyaz, S.; Chowdhury, M.E.; Gabbouj, M. Osegnet: Operational segmentation network for COVID-19 detection using chest x-ray images. In Proceedings of the 2022 IEEE International Conference on Image Processing (ICIP), Bordeaux, France, 16–19 October 2022; IEEE: Piscataway, NJ, USA, 2022; pp. 2306–2310. [Google Scholar]
  10. Li, Z.; Li, Y.; Li, Q.; Wang, P.; Guo, D.; Lu, L.; Jin, D.; Zhang, Y.; Hong, Q. Lvit: Language meets vision transformer in medical image segmentation. IEEE Trans. Med. Imaging 2023, 43, 96–107. [Google Scholar] [CrossRef] [PubMed]
  11. Ronneberger, O.; Fischer, P.; Brox, T. U-net: Convolutional networks for biomedical image segmentation. In Medical Image Computing and Computer-Assisted Intervention—MICCAI 2015: 18th International Conference, Munich, Germany, 5–9 October 2015, Proceedings, Part III 18; Springer: Berlin/Heidelberg, Germany, 2015; pp. 234–241. [Google Scholar]
  12. Zhou, Z.; Rahman Siddiquee, M.M.; Tajbakhsh, N.; Liang, J. Unet++: A nested u-net architecture for medical image segmentation. In Deep Learning in Medical Image Analysis and Multimodal Learning for Clinical Decision Support: 4th International Workshop, DLMIA 2018, and 8th International Workshop, ML-CDS 2018, Held in Conjunction with MICCAI 2018, Granada, Spain, 20 September 2018, Proceedings 4; Springer: Berlin/Heidelberg, Germany, 2018; pp. 3–11. [Google Scholar]
  13. Isensee, F.; Jaeger, P.F.; Kohl, S.A.; Petersen, J.; Maier-Hein, K.H. nnU-Net: A self-configuring method for deep learning-based biomedical image segmentation. Nat. Methods 2021, 18, 203–211. [Google Scholar] [CrossRef] [PubMed]
  14. Peláez-Vegas, A.; Mesejo, P.; Luengo, J. A survey on semi-supervised semantic segmentation. arXiv 2023, arXiv:2302.09899. [Google Scholar] [CrossRef]
  15. Luo, X.; Chen, J.; Song, T.; Wang, G. Semi-supervised medical image segmentation through dual-task consistency. Proc. AAAI Conf. Artif. Intell. 2021, 35, 8801–8809. [Google Scholar] [CrossRef]
  16. Chaitanya, K.; Erdil, E.; Karani, N.; Konukoglu, E. Local contrastive loss with pseudo-label based self-training for semi-supervised medical image segmentation. Med. Image Anal. 2023, 87, 102792. [Google Scholar] [CrossRef] [PubMed]
  17. Zhu, Y.; Wang, X.; Liu, T.; Fu, Y. Multi-perspective dynamic consistency learning for semi-supervised medical image segmentation. Sci. Rep. 2025, 15, 18266. [Google Scholar] [CrossRef] [PubMed]
  18. Zhang, Y.; Yu, P.; Xiao, Y.; Wang, S. Pyramid-structured multi-scale transformer for efficient semi-supervised video object segmentation with adaptive fusion. Pattern Recognit. Lett. 2025, 194, 48–54. [Google Scholar] [CrossRef]
  19. Chen, J.; Lu, Y.; Yu, Q.; Luo, X.; Adeli, E.; Wang, Y.; Lu, L.; Yuille, A.L.; Zhou, Y. Transunet: Transformers make strong encoders for medical image segmentation. arXiv 2021, arXiv:2102.04306. [Google Scholar] [CrossRef]
  20. Cao, H.; Wang, Y.; Chen, J.; Jiang, D.; Zhang, X.; Tian, Q.; Wang, M. Swin-unet: Unet-like pure transformer for medical image segmentation. In Proceedings of the European Conference on Computer Vision, Tel Aviv, Israel, 23–27 October 2022; Springer: Cham, Switzerland, 2022; pp. 205–218. [Google Scholar]
  21. Radford, A.; Kim, J.W.; Hallacy, C.; Ramesh, A.; Goh, G.; Agarwal, S.; Sastry, G.; Askell, A.; Mishkin, P.; Clark, J.; et al. Learning transferable visual models from natural language supervision. In Proceedings of the International Conference on Machine Learning, PMLR, Online, 18–24 July 2021; pp. 8748–8763. [Google Scholar]
  22. Kim, W.; Son, B.; Kim, I. Vilt: Vision-and-language transformer without convolution or region supervision. In Proceedings of the International Conference on Machine Learning, PMLR, Online, 18–24 July 2021; pp. 5583–5594. [Google Scholar]
  23. Huang, S.C.; Shen, L.; Lungren, M.P.; Yeung, S. Gloria: A multimodal global-local representation learning framework for label-efficient medical image recognition. In Proceedings of the IEEE/CVF International Conference on Computer Vision, Montreal, QC, Canada, 10–17 October 2021; pp. 3942–3951. [Google Scholar]
  24. Zhang, Y.; Jiang, H.; Miura, Y.; Manning, C.D.; Langlotz, C.P. Contrastive learning of medical visual representations from paired images and text. In Proceedings of the Machine Learning for Healthcare Conference, PMLR, Durham, NC, USA, 5–6 August 2022; pp. 2–25. [Google Scholar]
  25. Tomar, N.K.; Jha, D.; Bagci, U.; Ali, S. TGANet: Text-guided attention for improved polyp segmentation. In Proceedings of the International Conference on Medical Image Computing and Computer-Assisted Intervention, Singapore, 18–22 September 2022; Springer: Cham, Switzerland, 2022; pp. 151–160. [Google Scholar]
  26. Woo, S.; Park, J.; Lee, J.Y.; Kweon, I.S. Cbam: Convolutional block attention module. In Proceedings of the European Conference on Computer Vision (ECCV), Munich, Germany, 8–14 September 2018; pp. 3–19. [Google Scholar]
  27. Yang, Z.; Wang, J.; Tang, Y.; Chen, K.; Zhao, H.; Torr, P.H. Lavt: Language-aware vision transformer for referring image segmentation. In Proceedings of the IEEE/CVF Conference on Computer Vision and Pattern Recognition, New Orleans, LA, USA, 18–24 June 2022; pp. 18155–18165. [Google Scholar]
  28. Hu, J.; Shen, L.; Sun, G. Squeeze-and-excitation networks. In Proceedings of the IEEE Conference on Computer Vision and Pattern Recognition, Salt Lake City, UT, USA, 18–23 June 2918; pp. 7132–7141. [Google Scholar]
  29. Xie, E.; Wang, W.; Yu, Z.; Anandkumar, A.; Alvarez, J.M.; Luo, P. SegFormer: Simple and efficient design for semantic segmentation with transformers. Adv. Neural Inf. Process. Syst. 2021, 34, 12077–12090. [Google Scholar]
  30. Rao, Y.; Zhao, W.; Chen, G.; Tang, Y.; Zhu, Z.; Huang, G.; Zhou, J.; Lu, J. Denseclip: Language-guided dense prediction with context-aware prompting. In Proceedings of the IEEE/CVF Conference on Computer Vision and Pattern Recognition, New Orleans, LA, USA, 18–24 June 2022; pp. 18082–18091. [Google Scholar]
  31. Gu, Y.; Tinn, R.; Cheng, H.; Lucas, M.; Usuyama, N.; Liu, X.; Naumann, T.; Gao, J.; Poon, H. Domain-specific language model pretraining for biomedical natural language processing. ACM Trans. Comput. Healthcare (HEALTH) 2021, 3, 1–23. [Google Scholar] [CrossRef]
  32. Peng, Y.; Yan, S.; Lu, Z. Transfer learning in biomedical natural language processing: An evaluation of BERT and ELMo on ten benchmarking datasets. arXiv 2019, arXiv:1906.05474. [Google Scholar] [CrossRef]
  33. Selvaraju, R.R.; Cogswell, M.; Das, A.; Vedantam, R.; Parikh, D.; Batra, D. Grad-cam: Visual explanations from deep networks via gradient-based localization. In Proceedings of the IEEE International Conference on Computer Vision, Venice, Italy, 22–29 October 2017; pp. 618–626. [Google Scholar]
Figure 1. The different methods of medical image segmentation. (a) The different frameworks of medical image segmentation. (b) Ours.
Electronics 14 03020 g001
Figure 2. Our MedLangViT is compared with some other methods in terms of Dice and Parameters on QaTa-COV19 dataset. The radius of the circle represents GFLOPs. “↑” indicates an increasing trend in DICE. “→” indicates an increasing trend in Parameters.
Electronics 14 03020 g002
Figure 3. The overall architecture of MedLangViT.
Electronics 14 03020 g003
Figure 4. The overall architecture of Enhanced Channel-Spatial Attention Module (ECSAM). γ is a learnable parameter.
Electronics 14 03020 g004
Figure 5. Image examples and corresponding text content for QaTa-COV19 and MosMedData+ datasets.
Electronics 14 03020 g005
Figure 6. The qualitative results of different methods on QaTa-COV19 and MosMedData+ datasets.
Electronics 14 03020 g006
Figure 7. Visualization of saliency maps of different approaches on the MosMedData+ and QaTa-COV19 datasets. The text input of the first row is “Bilateral pulmonary infection, two infected areas, lower left lung and lower right lung”. The text input of the second row is “Bilateral pulmonary infection, six infected areas, all left lung and middle right lung”. The text input of the third row is “Bilateral pulmonary infection, six infected areas, upper left lung and middle right lung”.
Electronics 14 03020 g007
Figure 8. Visualization of saliency maps of different layers of network with BioBERT and ECSAM on the MosMedData+ dataset.
Electronics 14 03020 g008
Figure 9. Visualization of saliency maps of different layers of network with BioBERT and PLAM on the MosMedData+ dataset.
Electronics 14 03020 g009
Table 1. CNN module architecture.
Layer NameInput ShapeOutput Shape
InConv3 × 224 × 22464 × 224 × 224
DownCNN164 × 224 × 224128 × 112 × 112
DownCNN2128 × 112 × 112256 × 56 × 56
DownCNN3256 × 56 × 56512 × 28 × 28
DownCNN4512 × 28 × 28512 × 14 × 14
Reconstruct164 × 14 × 1464 × 224 × 224
Reconstruct2128 × 14 × 14128 × 112 × 112
Reconstruct3256 × 14 × 14256 × 56 × 56
Reconstruct4512 × 14 × 14512 × 28 × 28
UpCNN4512 × 14 × 14 + 512 × 28 × 28256 × 28 × 28
UpCNN3256 × 28 × 28 + 256 × 56 × 56128 × 56 × 56
UpCNN2128 × 56 × 56 + 128 × 112 × 11264 × 112 × 112
UpCNN164 × 112 × 112 + 64 × 224 × 22464 × 224 × 224
OutConv64 × 224 × 2241 × 224 × 224
Table 2. Transformer and text module architecture.
Module NameLayer NameInput ShapeOutput Shape
Transformer moduleDownVit164 × 224 × 22464 × 14 × 14
DownVit2128 × 112 × 112128 × 14 × 14
DownVit3256 × 56 × 56256 × 14 × 14
DownVit4512 × 28 × 28512 × 14 × 14
UpVit4512 × 14 × 14512 × 14 × 14
UpVit3256 × 14 × 14256 × 14 × 14
UpVit2128 × 14 × 14128 × 14 × 14
UpVit164 × 14 × 1464 × 14 × 14
Text moduleText_module4768 × 128512 × 128
Text_module3512 × 128256 × 128
Text_module2256 × 128128 × 128
Text_module1128 × 12864 × 128
Table 3. The specific division of different datasets.
QaTa-COV19MosMedData+
Train57162183
Validation1429273
Test2113273
Total92582729
Table 4. The quantitative results of different methods on the QaTa-COV19 and MosMedData+ datasets. The “Hybrid” means CNN-Transformer structure.
MethodsBackboneTextParam (M)FLOPs (G)QaTa-COV19MosMedData+
Dice (%)mIoU (%)Dice (%)mIoU (%)
U-Net [11]CNN×14.850.379.0269.4664.6050.73
nnUNet [13]CNN×19.1412.780.4270.8172.5960.36
TransUNet [19]Hybrid×105.056.778.6369.1371.2458.44
Swin-Unet [20]Hybrid×82.367.378.0768.3463.2950.19
SegFormer [29]Hybrid×84.735.178.4168.8365.0554.34
MedLangViT (w/o)Hybrid×26.047.281.9771.7773.0260.53
ConVIRT [24]CNN 35.244.679.7270.5872.0659.73
TGANet [25]CNN 19.841.979.8770.7571.8159.28
CLIP [21]Hybrid 87.0105.379.8170.6671.9759.64
GLORIA [23]Hybrid 45.660.879.9470.6872.4260.18
LViT [10]Hybrid 29.754.183.6675.1174.5761.33
LAVT [27]Hybrid 118.683.879.2869.8973.2960.41
DenseCLIP [30]Hybrid 105.349.979.5870.3771.6258.95
MedLangViTHybrid 27.747.884.2775.9375.9563.17
Table 5. The effect of each component on MosMedData+ dataset. PLAM (Pixel-Level Attention Module) is the part of LViT that corresponds to ECSAM in MedLangViT.
BERTPLAMBioBERTECSAMDice (%)mIoU (%)
74.5761.33
74.8961.76
75.0362.06
75.9563.17
Table 6. The effect of different hyper-parameters.
Hyper-ParametersQaTa-COV19MosMedData+
Dice (%)mIoU (%)Dice (%)mIoU (%)
Batch Size884.2775.9375.9563.17
482.9374.2173.4360.01
282.4173.5873.2059.78
Learning Rate 3 × 10 4 84.2775.9375.2662.73
1 × 10 3 83.6575.0275.9563.17
Table 7. The effect of internal structure of ECSAM on MosMedData+ dataset.
QConvKConvSAMQKConvDice (%)mIoU (%)
73.4760.59
73.7561.22
74.6861.54
75.9563.17
Table 8. The effect of MedLangViT with different attention mechanism on MosMedData+ dataset. “aLatency” means the average of latency measurements taken ten times. “aMU” means the average memory usage measured ten times.
ModulesParams (M)FLOPs (G)aLatency (ms)aMU (MB)Dice (%)mIoU (%)
SE Block [28]27.7247.3829.859.7174.6861.78
CBAM [26]27.7247.3930.589.7474.6161.82
ECSAM27.7447.7529.529.0775.9563.17
Table 9. The effect of MedLangViT with different BERT-based embeddings on MosMedData+ dataset.
ModulesParams (M)FLOPs (G)Dice (%)mIoU (%)
PubMedBERT [31]27.7447.7575.4162.21
BlueBERT [32]27.7447.7575.0861.97
BioBERT [6]27.7447.7575.9563.17
Disclaimer/Publisher’s Note: The statements, opinions and data contained in all publications are solely those of the individual author(s) and contributor(s) and not of MDPI and/or the editor(s). MDPI and/or the editor(s) disclaim responsibility for any injury to people or property resulting from any ideas, methods, instructions or products referred to in the content.

