1. Introduction
Photovoltaic (PV) power generation, as a clean and sustainable energy source, has emerged as a vital part of global energy transitions and achieved widespread adoption across the world. With the widespread deployment of PV modules in extreme climatic and geographical conditions, higher requirements are placed on their stability and reliability [
1]. Among the various factors affecting PV module performance, bird-dropping contamination and hotspot defects are two of the most common and harmful problems. Bird droppings can block sunlight, significantly reducing light absorption efficiency [
2,
3], while also causing local temperature increases that can accelerate module aging and even lead to physical damage. Hotspot defects, usually caused by abnormal cell performance or partial shading, not only decrease power generation efficiency, but can also cause thermal burnout or even fires in severe cases [
4,
5]. Thus, developing an efficient and accurate detection method to recognize bird droppings and hotspots on photovoltaic panels is one of the core issues in defect identification scenarios.
Traditional fault identification in photovoltaic modules is predominantly reliant on manual inspection and basic image-processing techniques. These approaches are labor-intensive, heavily dependent on human expertise, and difficult to scale to large PV installations. Thanks to the progress in deep learning and computer vision, intelligent fault identification approaches grounded in image recognition have emerged as a key research area in diagnosing PV systems. By integrating such methods into intelligent inspection robots, researchers have significantly improved detection accuracy and operational efficiency [
6,
7].
For hotspot defect detection, current studies mainly focus on improving the model architecture to extract deeper features of the thermal infrared image and enhance both accuracy and inference speed. For instance, Cao et al. [
8] introduced depth-wise convolution into the YOLOv8 backbone, effectively reducing parameter size. Wu et al. [
9] replaced pooling layers with ROI Align in a faster region-based convolutional neural network (R-CNN), achieving an accuracy of 79.98%. Feng et al. [
10] developed a lightweight bottleneck module using reversible column networks (RevCol) and efficient multi-scale attention (EMA), striking a balance between complexity and performance. Similarly, Zheng et al. [
11] and Lei et al. [
12] proposed backbone replacements and multi-scale heads using Focus, ShuffleNetv2, and MobileNetV3 to improve inference speed and small-object detection. Chen et al. [
13] replaced the original backbone of YOLOv8 with the FasterNet architecture and introduced a slim neck based on hybrid convolution techniques that substantially reduced both parameter count and computational overhead. Yang et al. [
14] provided a comprehensive overview of existing PV detection technologies through two critical dimensions: PV panel surface condition monitoring and PV module fault diagnosis. They systematically analyze respective merits, limitations, and critical influencing factors of each method. Similarly, the data for bird-dropping recognition mainly uses RGB images, and the detection accuracy is improved by optimizing the model structure. Liu et al. [
15] introduced a cooperative attention mechanism between the backbone and neck to enhance multi-scale feature fusion, increasing mAP by 5.2% at the cost of 1.7 MB additional parameters. Antonio Di Tommaso et al. [
16] combined thermal and RGB inputs via a multi-stage YOLOv3-based network, but the RGB detection accuracy remained limited at 68.45%. While these methods offer gains in precision, speed, or lightweight design, most are only able to detect single defect types and often lack scalability in multi-defect scenarios. Moreover, few works explicitly address the constraints of edge device deployment, such as model size, inference latency, and power consumption.
Among mainstream object detection frameworks, the you only look once (YOLO) series stands out for PV fault detection due to its single-stage architecture, real-time performance, and low resource demand [
17,
18,
19,
20,
21,
22,
23,
24,
25]. Compared with two-stage methods like Faster R-CNN, YOLO integrates both tasks into a unified pipeline, achieving faster inference. Although R-CNN variants may offer higher detection accuracy [
9,
26,
27,
28], their greater computational burden and memory requirements limit their suitability for resource-constrained edge environments [
29,
30].
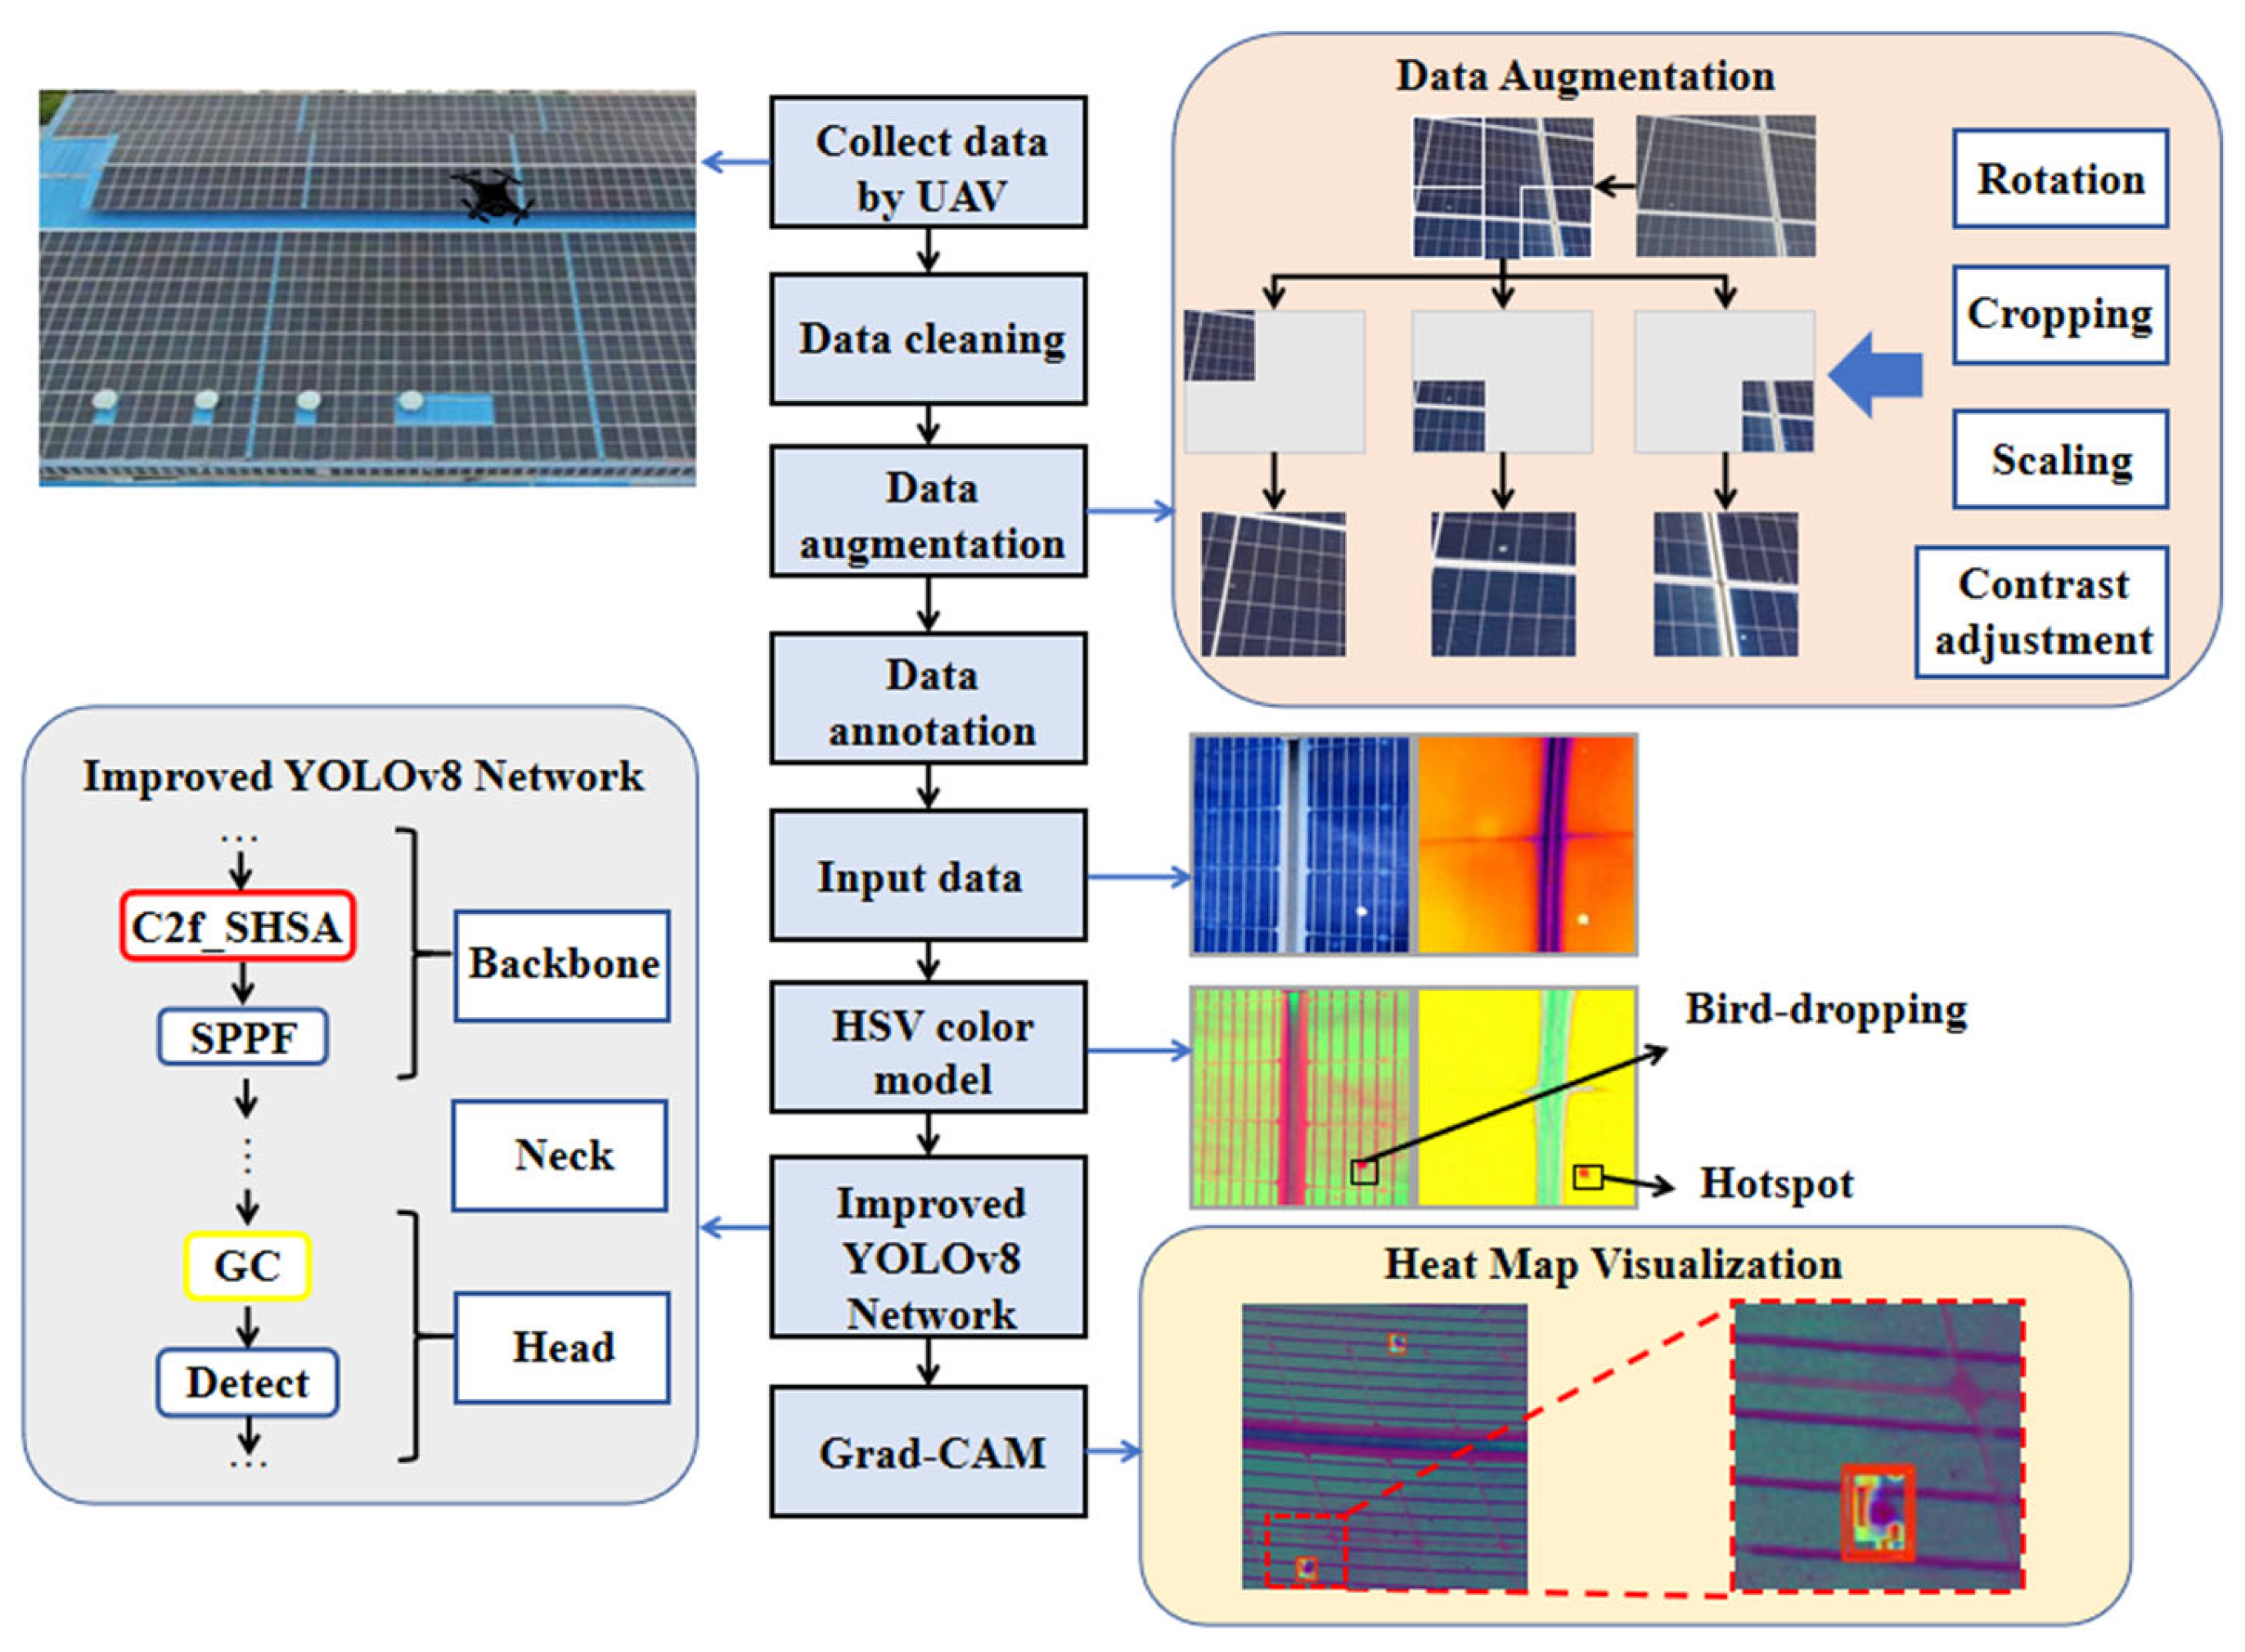
To achieve a balance between detection accuracy, the light weight of the model, and real-time performance, this paper introduces a PV surface defect detection model built upon an enhanced YOLOv8 framework. The model fuses RGB and infrared intensity images from a self-constructed multi-defect dataset as multimodal inputs and enhances the YOLOv8 backbone with a lightweight single-head self-attention (SHSA) module and global context (GC) modules. This architecture enables high-precision recognition for simultaneous detection of bird droppings and hotspot faults with minimal computational overhead. Furthermore, the model can be integrated into unmanned aerial vehicle (UAV) platforms to realize efficient photovoltaic defect inspection, achieving a favorable balance between performance and deployment efficiency, while this approach also supplies an effective and trustworthy solution for the intelligent management and upkeep of solar power plants.
The main contributions of this work are as follows:
- (1)
A defect recognition dataset of the PV module was created, containing 2704 images of RGB and infrared data, covering bird droppings and hotspot faults. In addition, image enhancement was performed on the data to improve the generalization ability and performance of the model.
- (2)
To boost robustness in multi-sensor settings, luminance and chrominance features were separated using the hue–saturation–value (HSV) color model. This yielded more distinctive features and better model generalization and adaptation across lighting and sensor conditions.
- (3)
To enhance the effectiveness of feature representation at a low computational cost, a lightweight SHSA module was introduced for key feature refinement. Moreover, a GC module was integrated to capture long-range dependencies, strengthening semantic representation. The improved model can enhance the ability of YOLOv8 to detect small or visually ambiguous photovoltaic faults in intelligent robot detection scenarios.
- (4)
Extensive experiments and ablation studies were conducted to validate the effectiveness of the improved method. The results demonstrated that the model can significantly boost fault detection accuracy, and the lightweight structure confirms its feasibility in the inspection robots.
The rest of this paper is arranged as follows:
Section 2 presents the YOLOv8 detection network. In
Section 3, the research context is introduced and the suggested model framework is detailed. Experimental outcomes and analyses, along with comparisons of detection accuracy and model size, are shown in
Section 4. Finally,
Section 5 concludes the paper and presents future research directions.
2. YOLOv8 Detection Network Overview
Object detection algorithms have evolved from two-stage models like Faster R-CNN to more efficient one-stage models such as the YOLO series. For PV panel fault detection, which requires fast real-time inference on edge devices and deals with relatively small datasets, one-stage algorithms are more suitable due to their speed and lower risk of overfitting [
31]. Therefore, YOLOv8, a state-of-the-art object detection algorithm, is selected as the baseline model in this paper. As demonstrated in the comparative results presented in
Section 4.3, YOLOv8 achieves the best overall performance on the proposed dataset, outperforming other leading algorithms such as YOLOv5 [
20], YOLOv7 [
22], YOLOv10 [
25], SSD [
32], and RT-DETR [
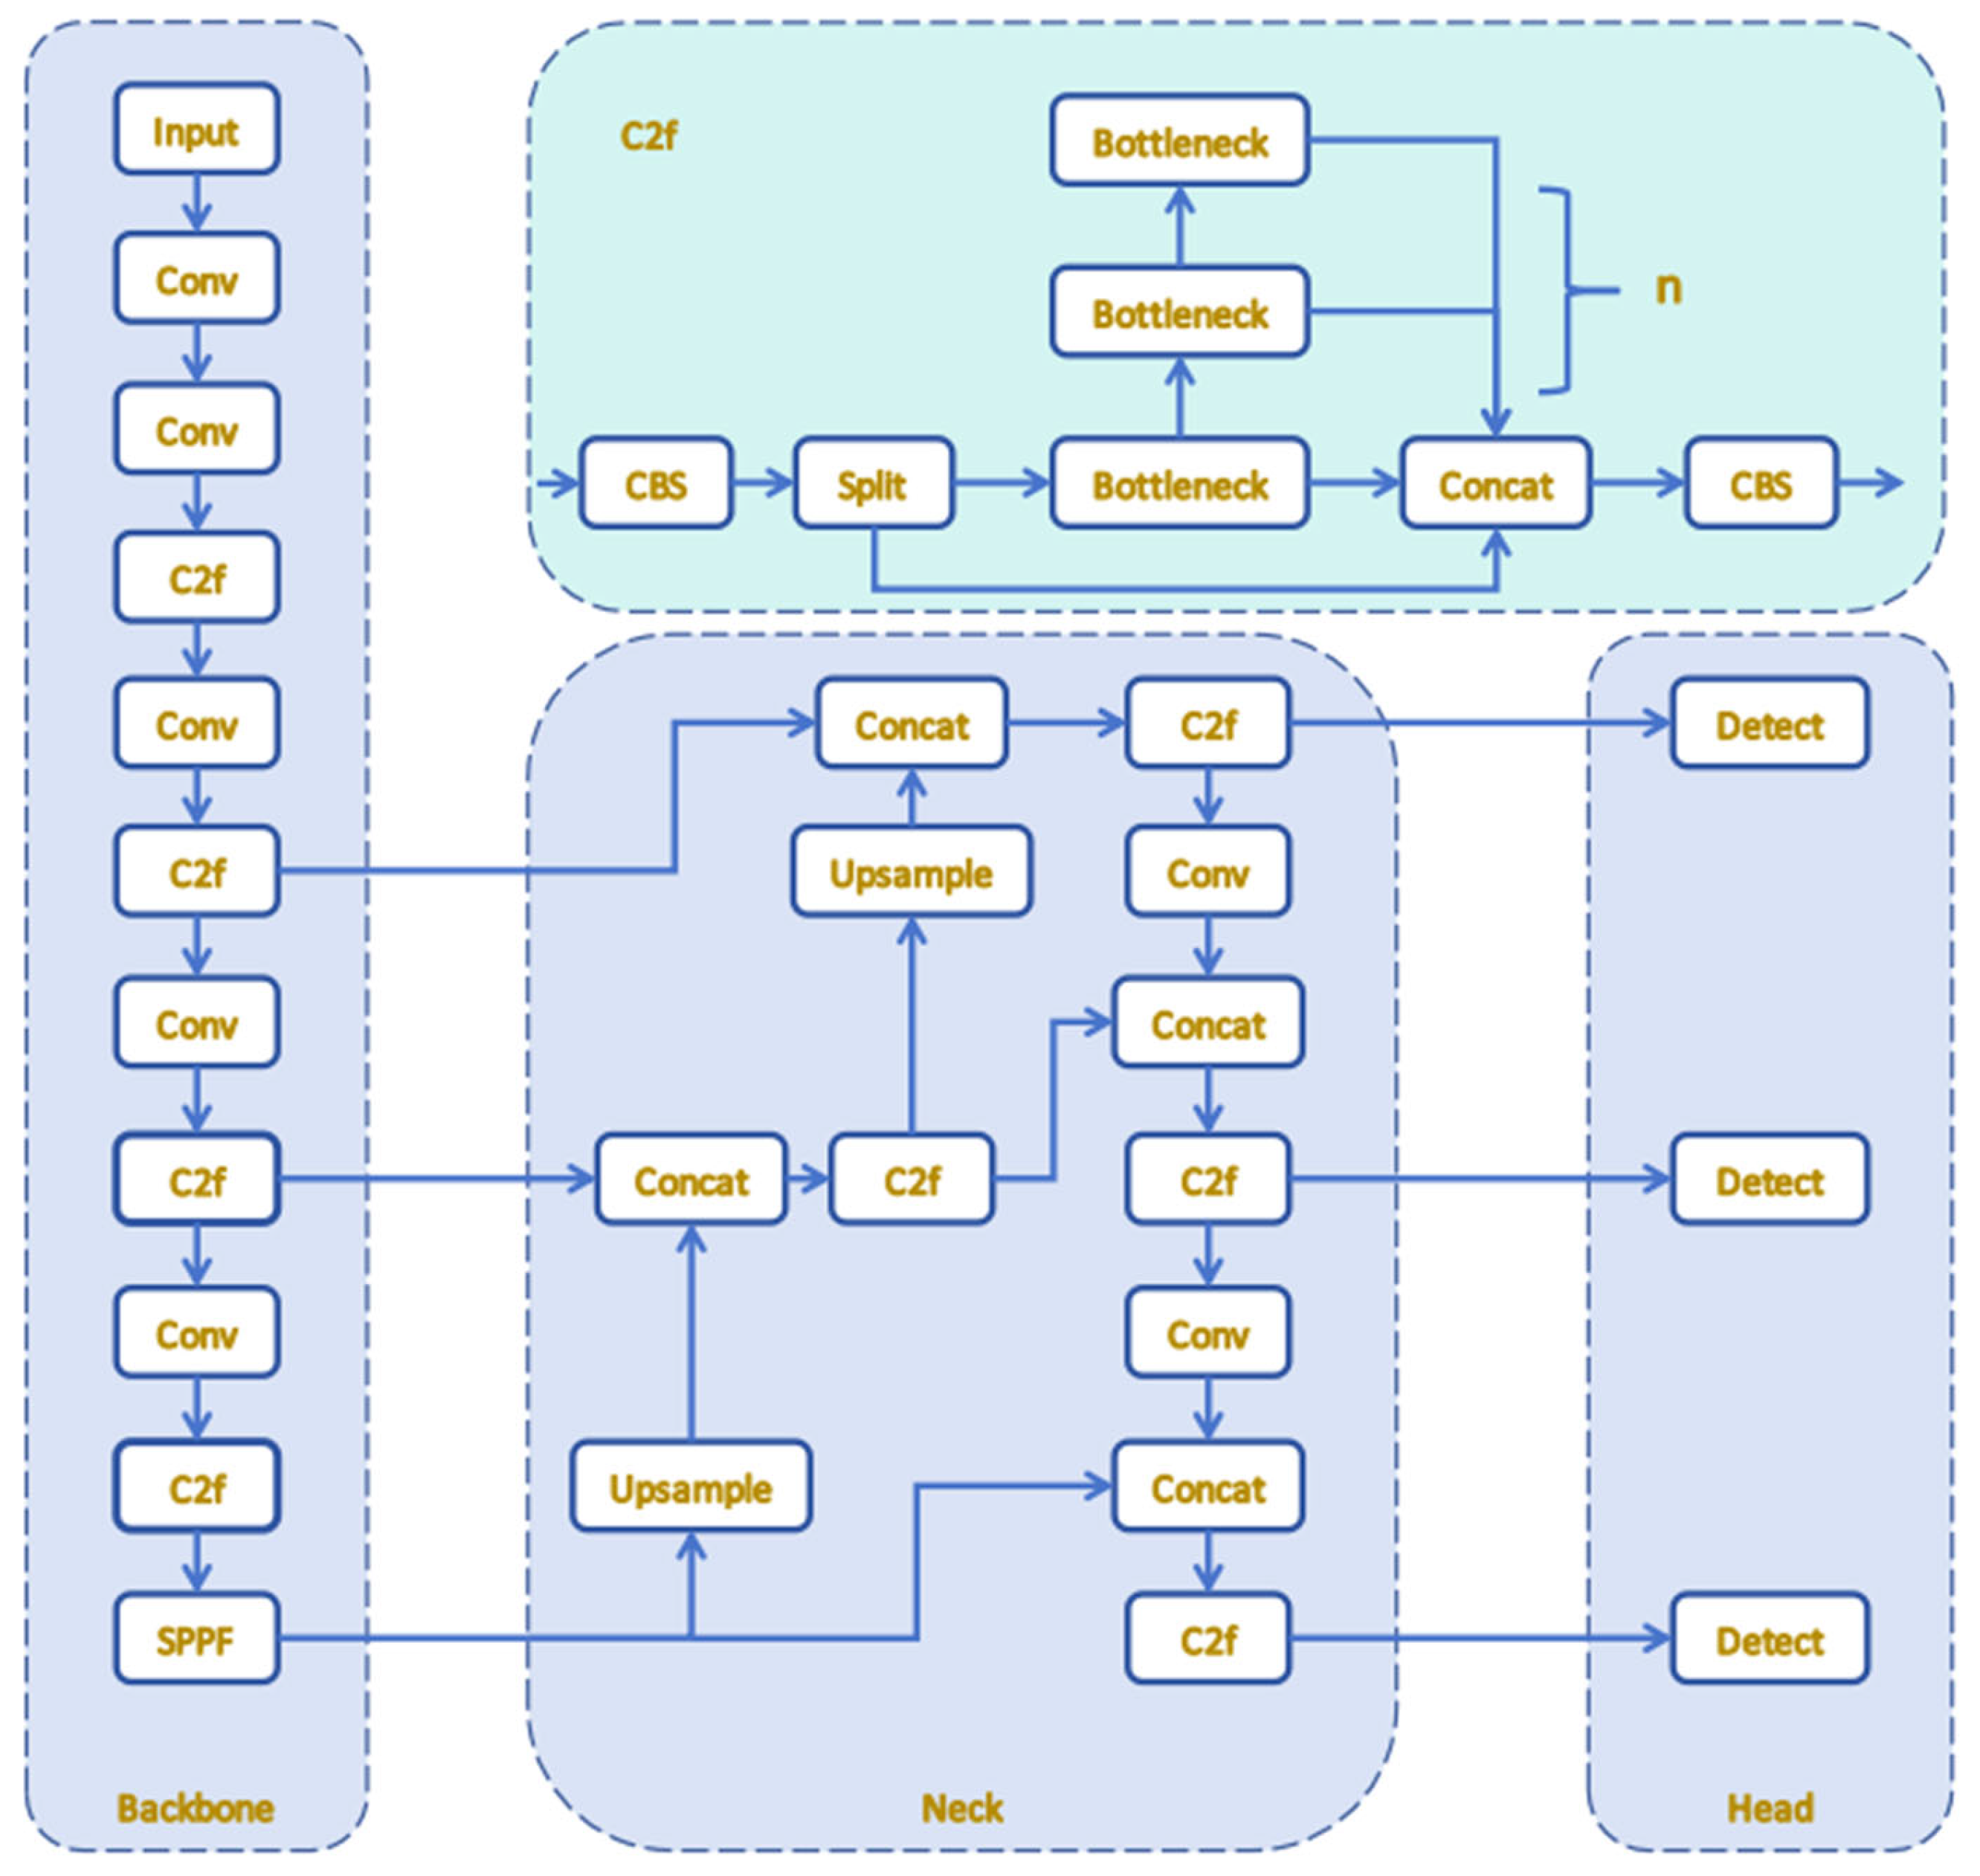
17]. Additionally, YOLOv8 surpassed YOLOv10 in this task. Its lightweight structure is more suitable for object detection in small datasets, whereas YOLOv10’s complex design is prone to overfitting. YOLOv8 comprises three main modules: backbone, neck, and head. The backbone relies on the cross-stage partial network (CSPDarkNet) architecture, which achieves a balance between computational efficiency and accuracy. The neck module merges multi-scale features from the backbone. Then, the head processes these integrated features to make predictions, which boosts detection accuracy. The overall architecture of YOLOv8 is illustrated in
Figure 1. It depicts the overall structure of the YOLOv8 network, highlighting the key components such as the backbone, neck, and head. It also shows the connections and data flow between these components, providing a clear visualization of how the network processes input data to produce object detection outputs.
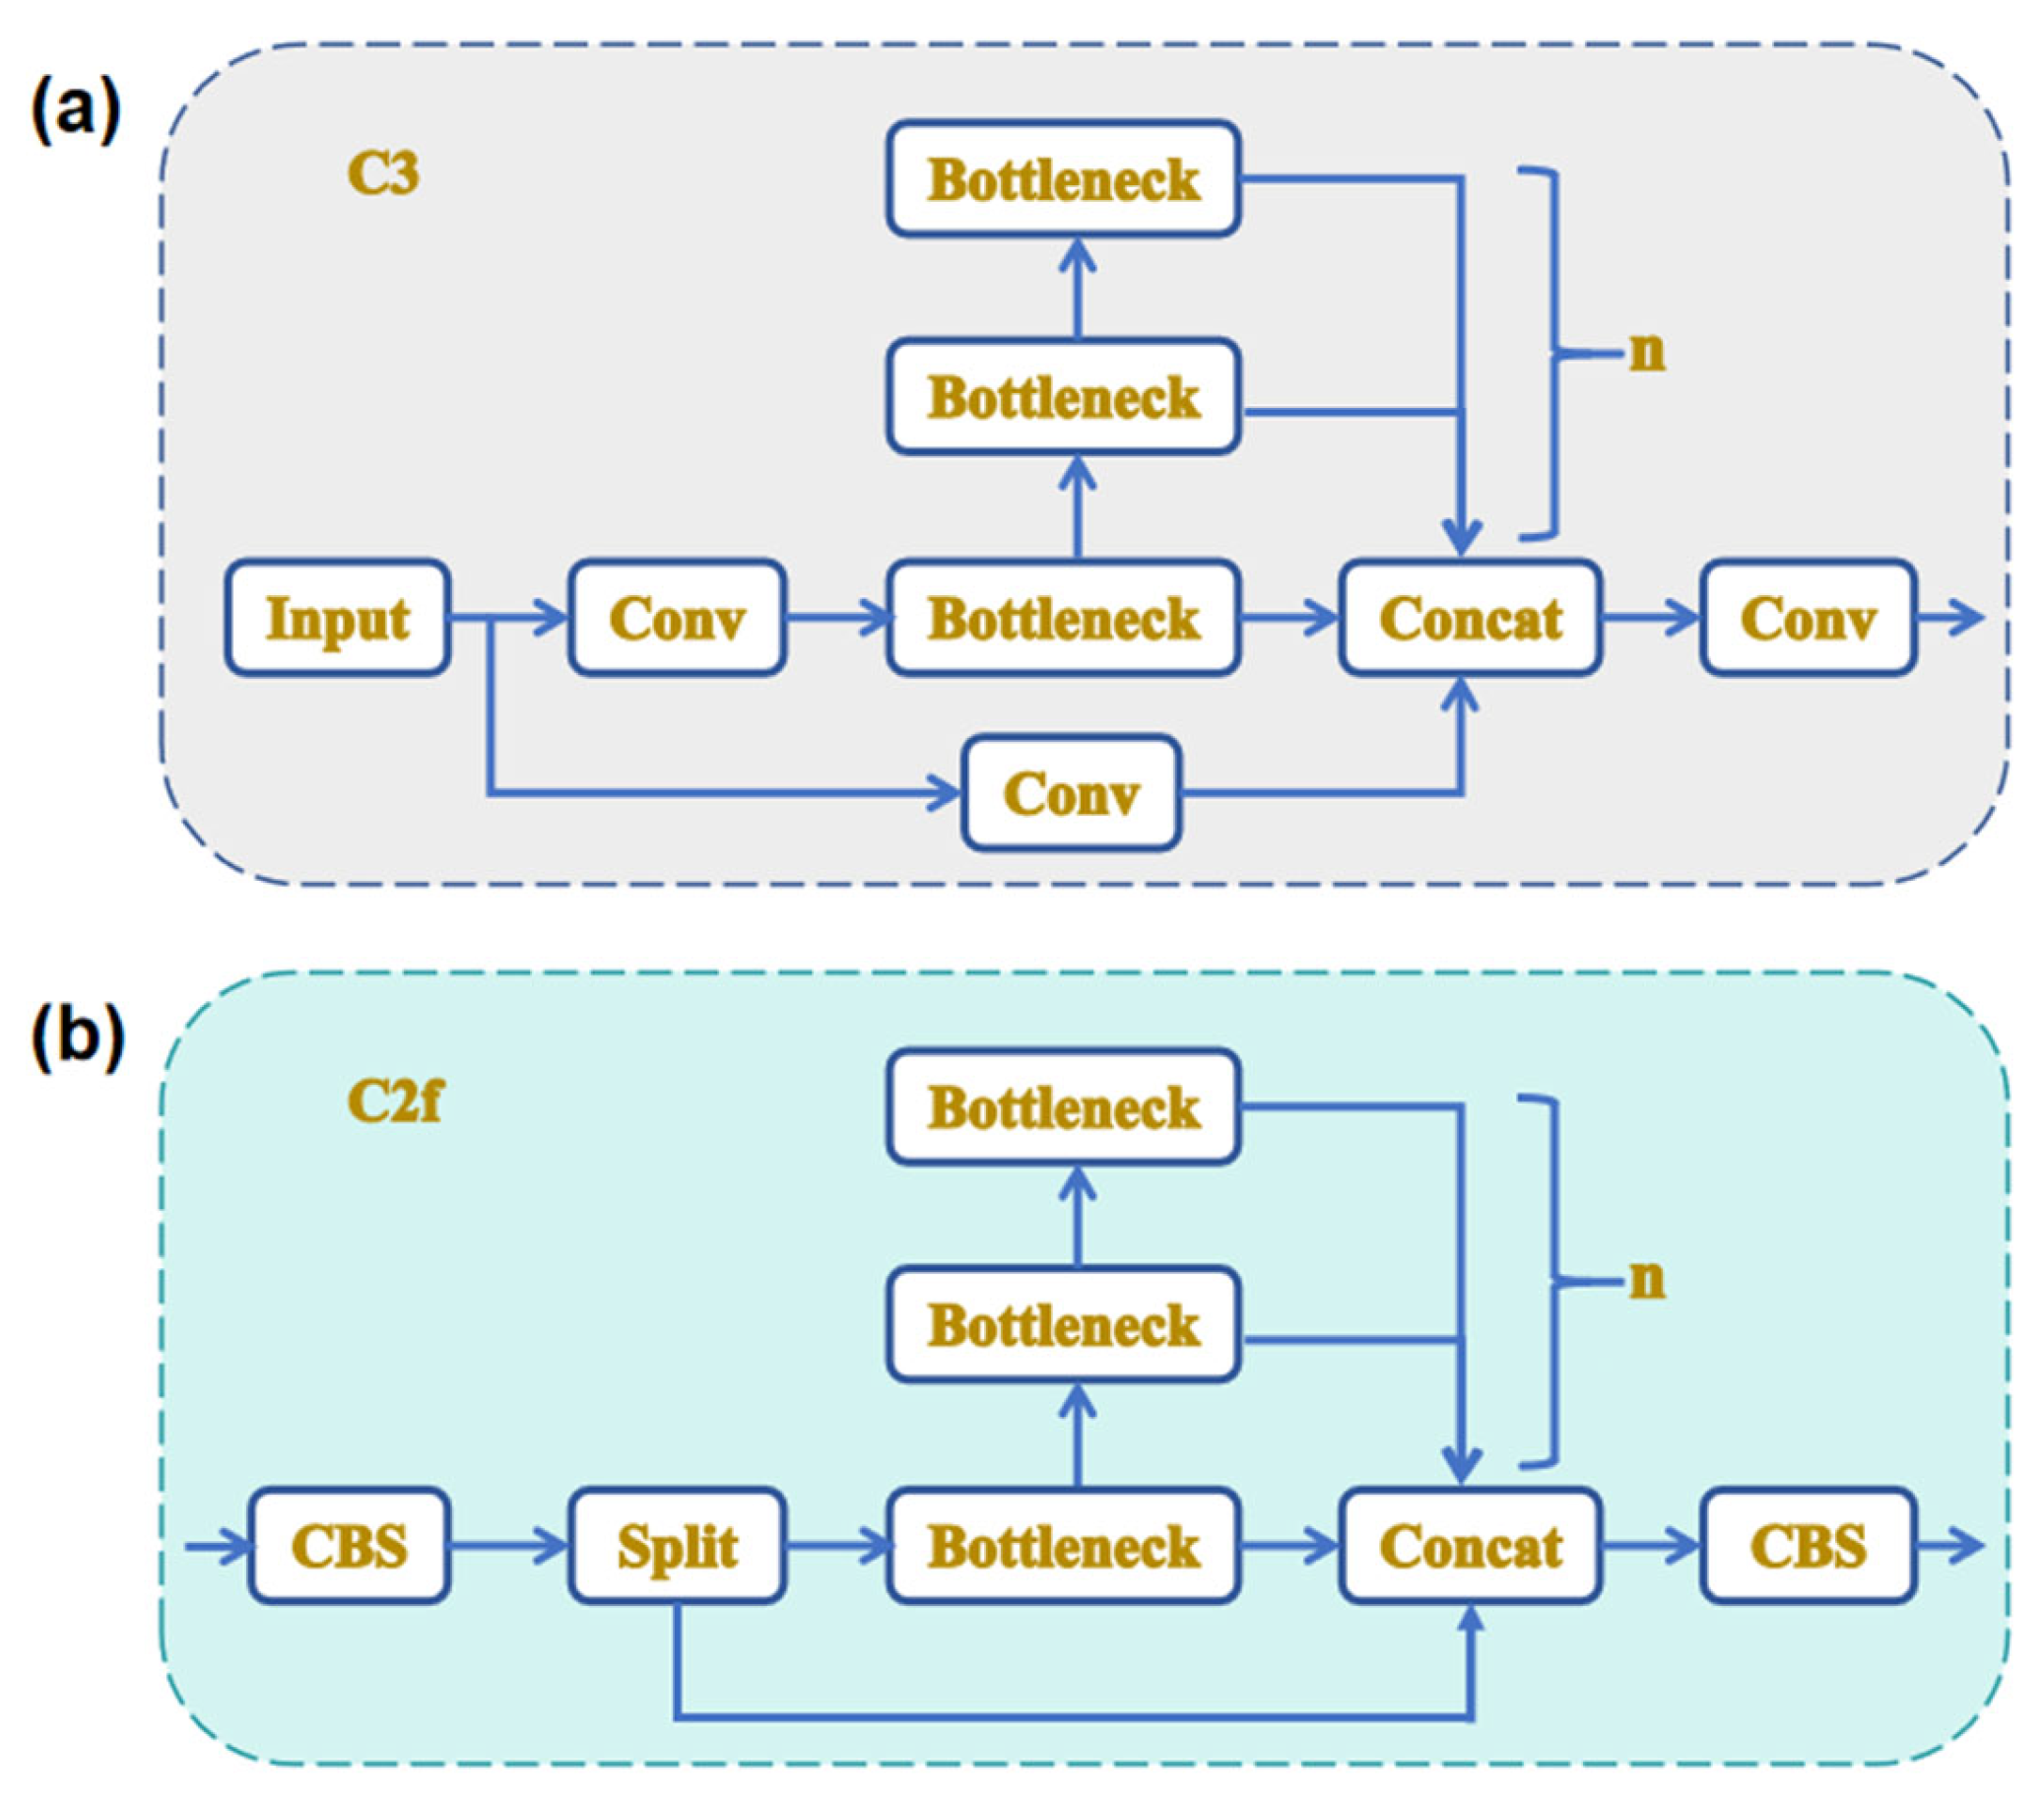
YOLOv8 replaces the convolutional 3-layer (C3) module in the backbone and neck with the csplayer_2conv (C2f) module [
33,
34]. This module adopts a lightweight design and increases gradient flow by introducing more skip connections and additional split operations, thereby improving convergence speed and effect. The C2f module uses two convolution block shuffle (CBS) components and N bottleneck flows. A CBS consists of a 2D convolution layer, a batch normalization layer, and an SiLU activation function. This design allows for multi-dimensional gradient flow while keeping the model lightweight.
Figure 2 shows the structure of the C2f module, where
N is the number of bottleneck modules. YOLOv8 has a basic 22-layer structure, including seven CBS convolutional layers and eight C2f convolutional layers, effectively balancing model complexity and feature extraction capability.
Moreover, the head structure has been substantially transformed from the design of YOLOv5 by implementing the contemporary decoupled head structure (DHS), which isolates the classification and detection components, and has evolved from being anchor-based (AB) to anchor-free (AF). Regarding loss computation, YOLOv8 employs the task-aligned assigner (TAA) for positive sample assignment and integrates distribution focal loss (DFL), enhancing both detection accuracy and overall performance [
35].
Currently, YOLOv8 has been widely applied in multiple fields. In industrial quality inspection, it can efficiently detect product defects and assembly errors of components, etc. In the field of intelligent transportation, it is used for vehicle and pedestrian detection as well as traffic violation identification. In security monitoring scenarios, it realizes abnormal behavior analysis and target tracking. Moreover, it is suitable for the identification of crop diseases and insect pests in agriculture.
3. Method
By incorporating a SHSA module and a GC module, our method improved the YOLOv8 target detection model, achieving precise localization and detection of bird droppings and hotspot faults while reducing computational and memory resource consumption. In data collection, a UAV was used to collect RGB and infrared images of rural photovoltaic panels, and a photovoltaic module fault image dataset dedicated to detecting bird-dropping contamination and hotspot defects was constructed. Meanwhile, the HSV color model was utilized to enhance the color difference in fault areas, improving the accuracy of feature extraction. The specific research process is shown in
Figure 3.
3.1. Data Collection
The images of bird-dropping contamination and hotspot defects were captured from rural areas and photovoltaic power stations in Yushan District, Ma’anshan City, Anhui Province (Longitude 118.49, Latitude 31.68). A DJI Mavic 3T thermographic drone [
36] was used for image acquisition, which is capable of stable operation at the highest operating temperature and is equipped with high-resolution wide-angle and infrared cameras. In addition, its compact body design effectively avoids light blocking during filming [
37]. To avoid the impact of adverse weather on infrared image accuracy, data collection was carried out around 3:00 p.m. In order to guarantee dataset diversity, images were captured from diverse angles and under varying lighting conditions. A total of 515 images of bird-dropping contamination and 90 images of hotspot defects were chosen and saved in .jpg format.
Table 1 presents the specific drone parameters.
3.2. Data Processing and Annotation
To further reduce the impact of data collection interference on subsequent detection accuracy, we implemented preprocessing steps including data cleaning, contrast adjustment, cropping and scaling, and data annotation [
38,
39,
40]. Data cleaning was conducted to remove blurry and duplicate images, enhancing the accuracy and stability of model training and prediction. Random rotation and translation of images were then applied to simulate diverse shooting angles and scenarios, thereby boosting the generalizability of the model. Next, image parameters such as brightness, contrast, and saturation were adjusted to mimic the variations in lighting conditions. Finally, random cropping and scaling were performed. Given that infrared images have a resolution of 640 × 512 and that of RGB images is 4000 × 3000, they were cropped and scaled to 640 × 640 with the center as a reference. After obtaining clean and accurate photovoltaic images, Roboflow [
41] was utilized to annotate bird droppings and hotspot defects within the images, providing precise training data for subsequent detection and analysis.
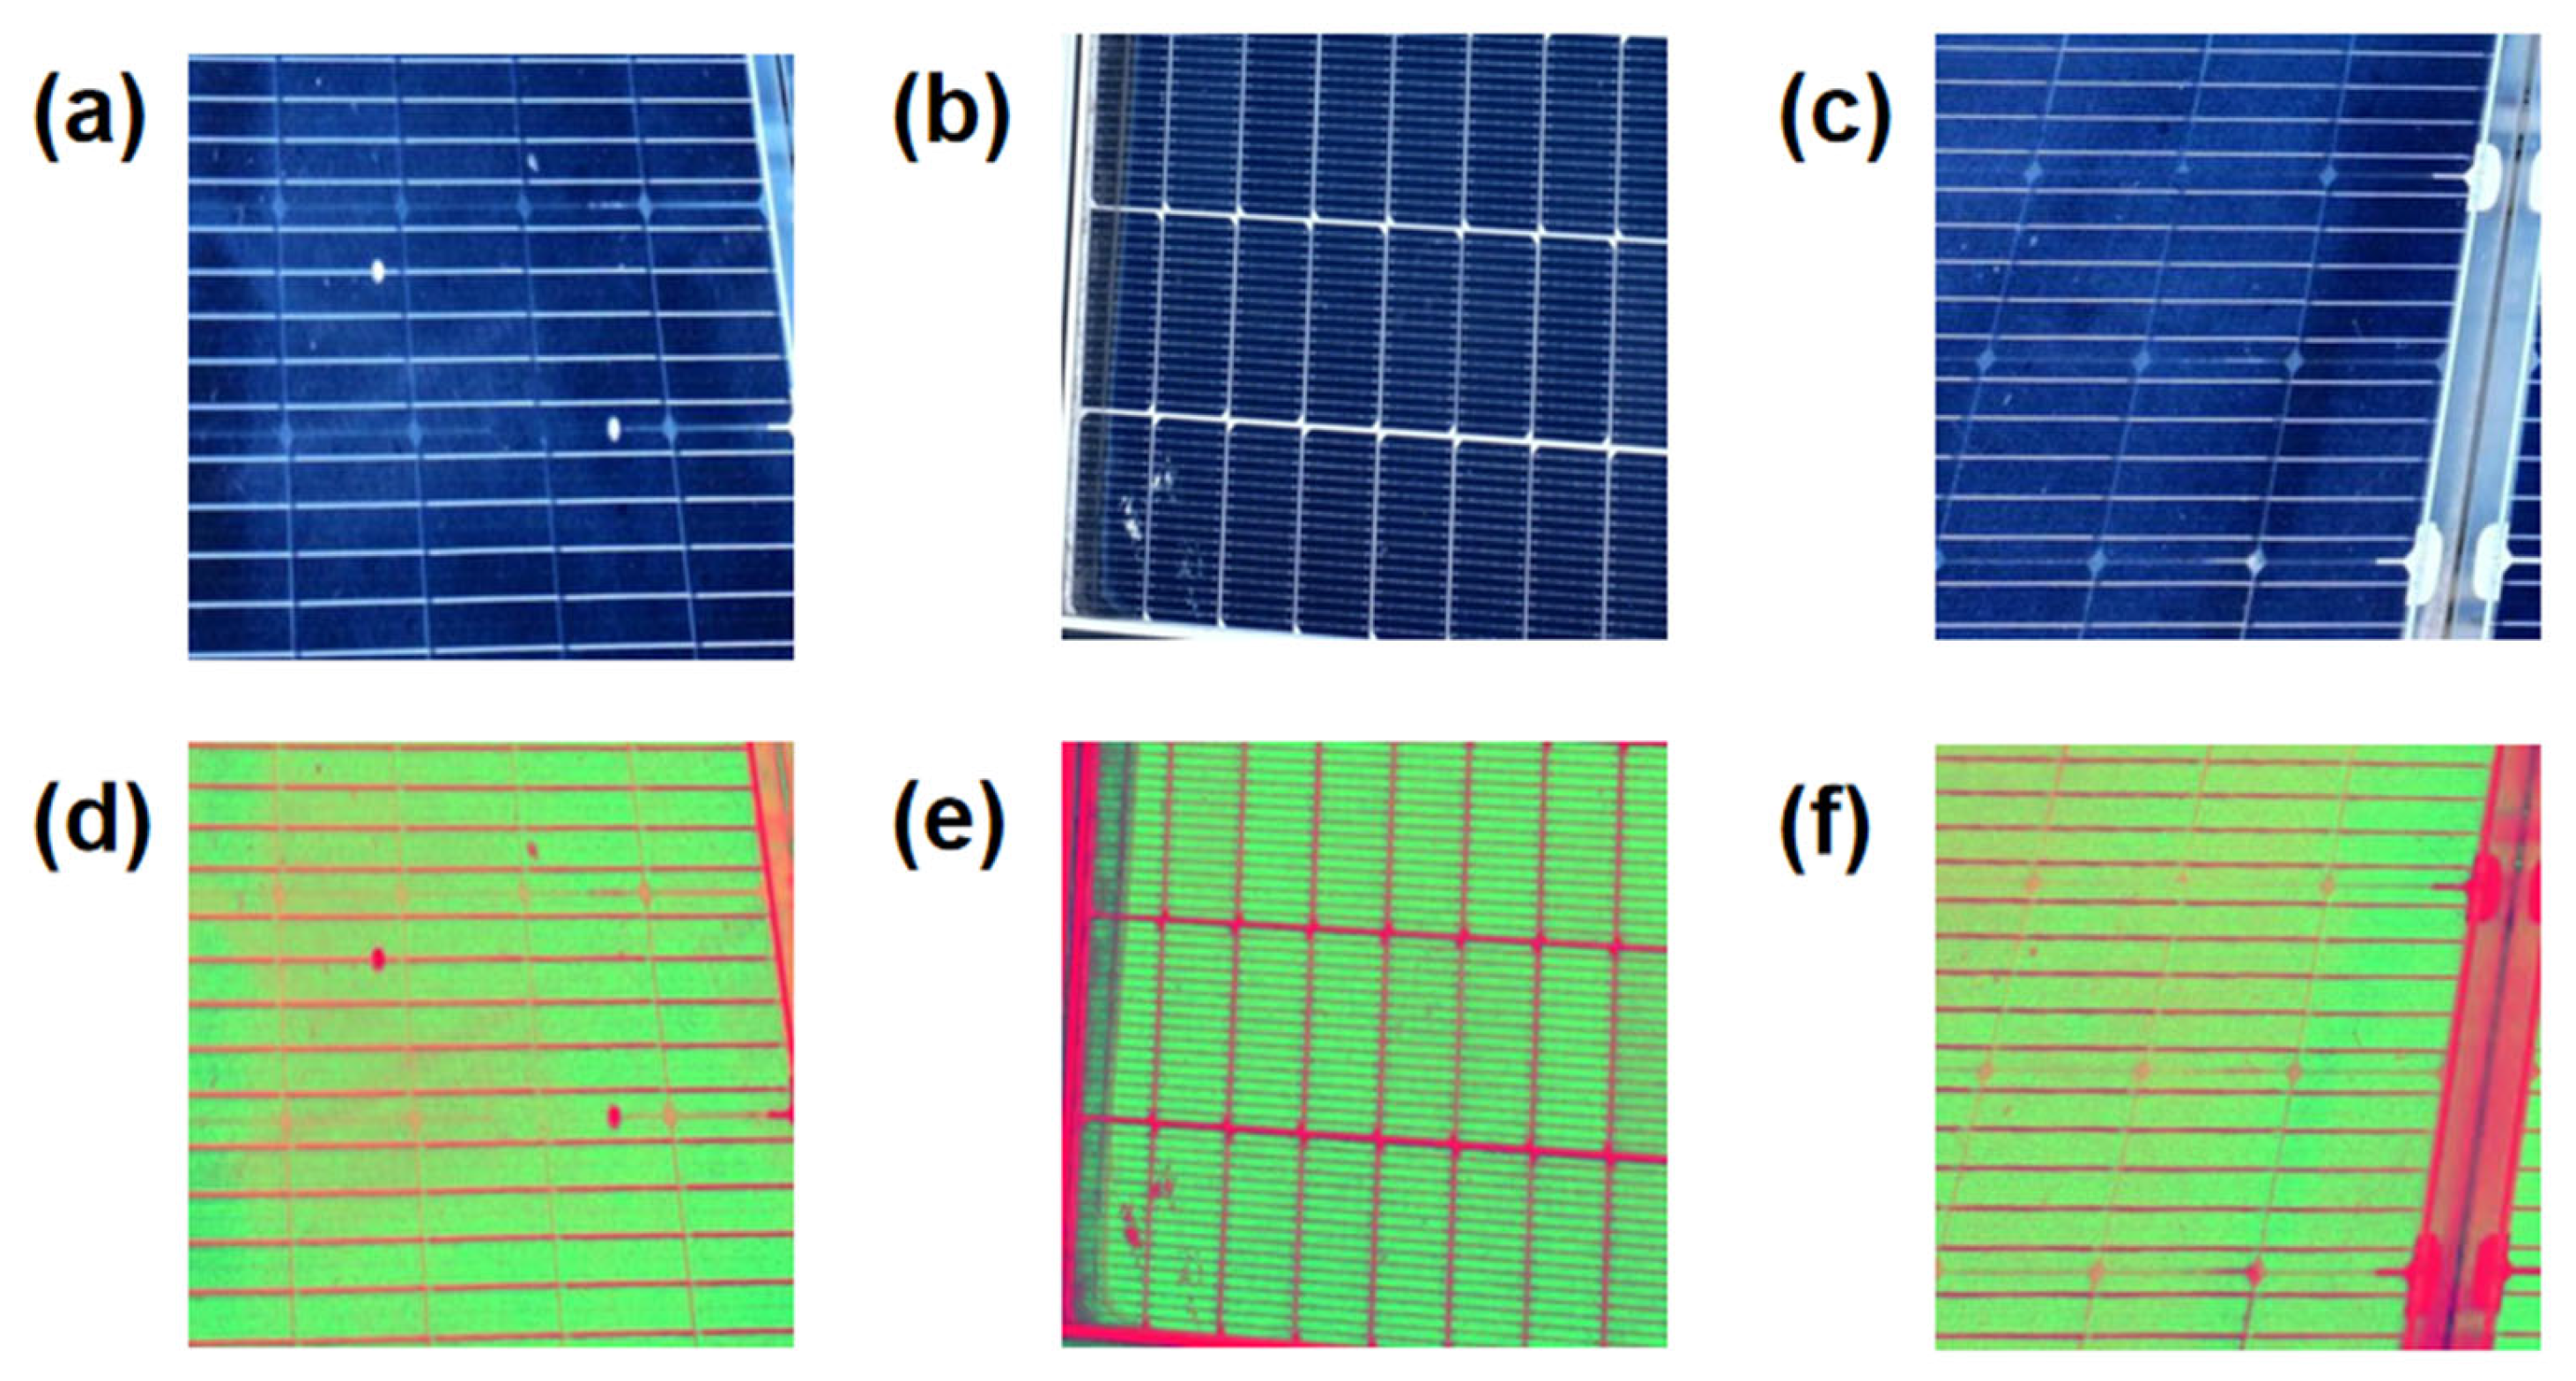
Figure 4 displays a set of typical RGB and infrared images in the dataset.
As illustrated in
Figure 4a, the infrared and wide-angle cameras are integrated into a UAV [
42]. By acquiring two images simultaneously, the different defects can be detected jointly. Since the accumulation of bird droppings can also cause hotspot defects, there is a spatial correspondence between the two in some images as shown in
Figure 4b,c.
3.3. HSV Color Model
Due to the device simultaneously collecting two images, the RGB model cannot effectively represent data from different sensors or maintain performance consistency across sensors, nor can it handle illumination variations. To address these issues, this paper employs the HSV color model [
43] to decouple image brightness and chromatic features. The comparison of the photovoltaic image before and after conversion is shown in
Figure 4. The model decomposes color information into three independent components (
H,
S,
V), where
H,
S, and
V are hue, saturation, and value, respectively, so that the model can more successfully capture color differences in fault regions. Additionally, the hue must be calculated in a segmented manner according to the main channel. The conversion Formulas (1)–(3) are as follows.
In the RGB color space, color values are represented as
, where
,
, and
denote the red, green, and blue channel intensities of a pixel, each ranging from 0 to 255.
and
refer to the maximum and minimum values among the three channels, respectively. After conversion to the HSV color space, the pixel is represented as
, where
indicates brightness (value),
represents saturation, and
is the hue angle, calculated piecewise based on the dominant channel.
Figure 5 intuitively displays the comparison of photovoltaic images before and after conversion.
As shown in
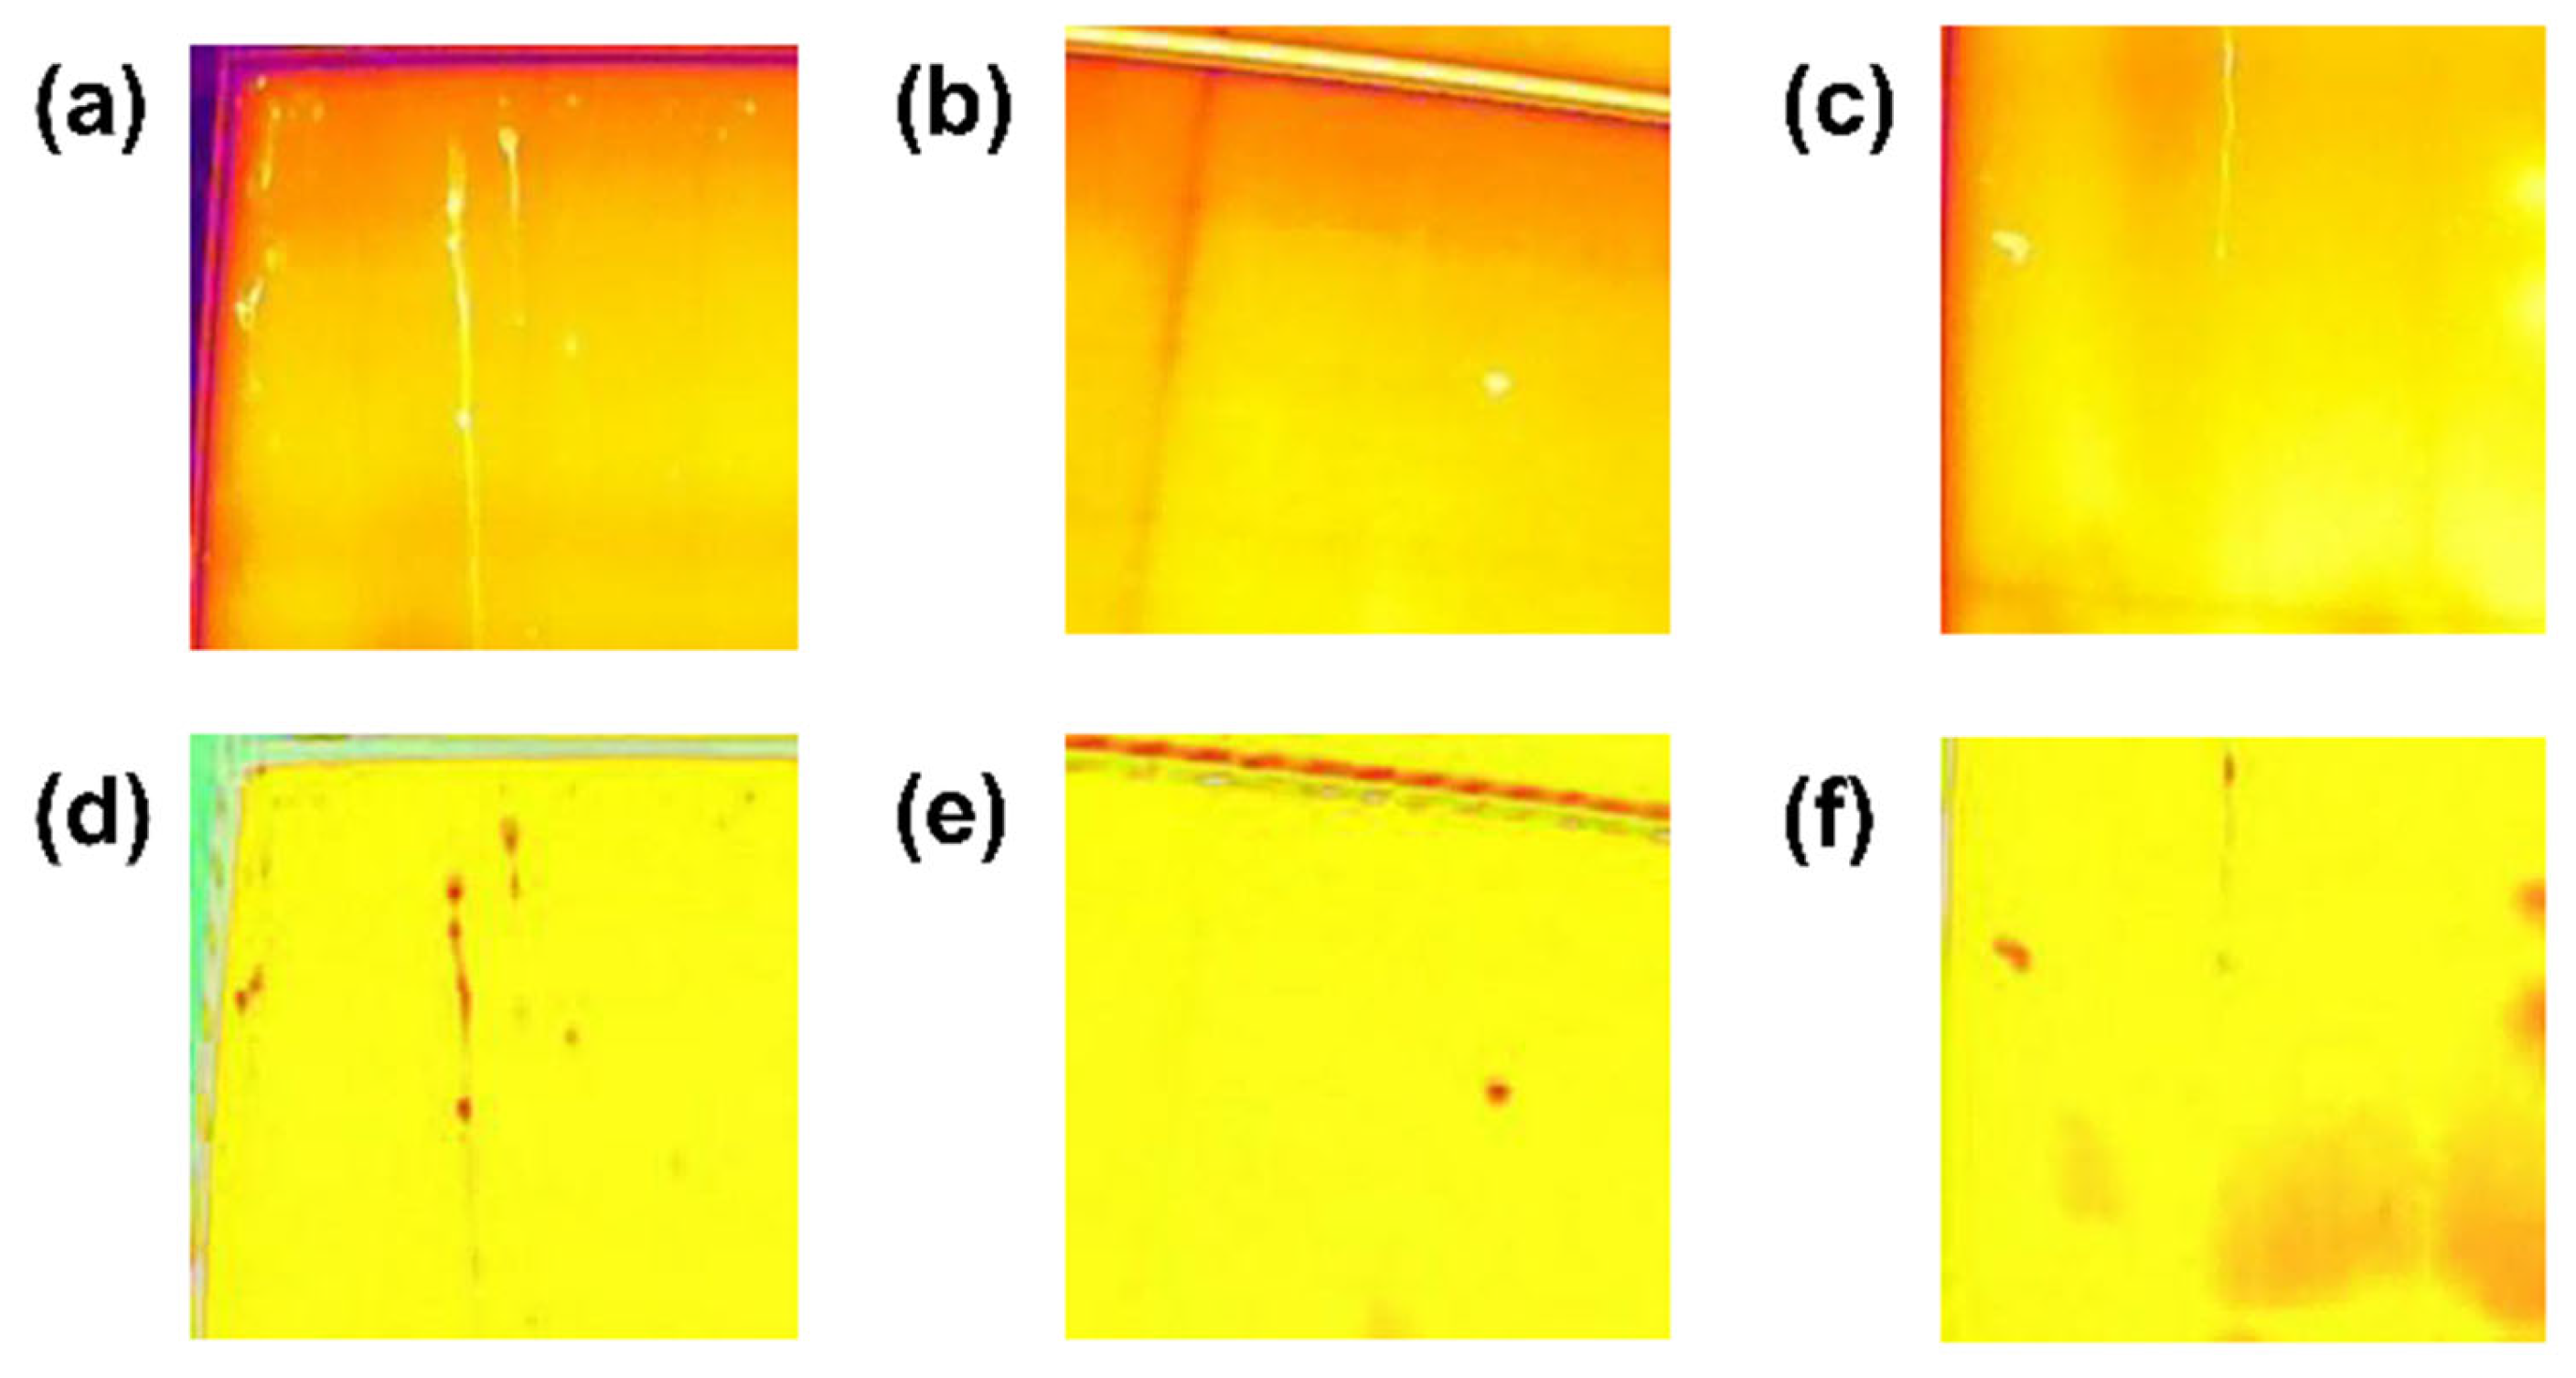
Figure 5, RGB images were converted to the HSV color space, and the hue and saturation channels were chosen to enhance the color features of bird-dropping contamination for easier identification. For infrared images, as displayed in
Figure 6, we selected the value channel data, which were changed to HVB space for highlighting thermal anomalies [
44]. This transformation improves the robustness of the model under varying sensor conditions and illumination environments. Moreover, it enhances the extraction of unique key features of photovoltaic modules and enables intelligent inspection robots to detect faults with greater accuracy and reliability in complex and noisy conditions.
3.4. Improved Yolov8 Network Architecture
In photovoltaic fault detection, YOLOv8 exhibits several limitations, including inadequate adaptability to diverse fault types, suboptimal generalization performance, and insufficient feature extraction. To overcome these challenges, this paper proposes an enhanced YOLOv8 algorithm with integrated GC [
45] and SHSA [
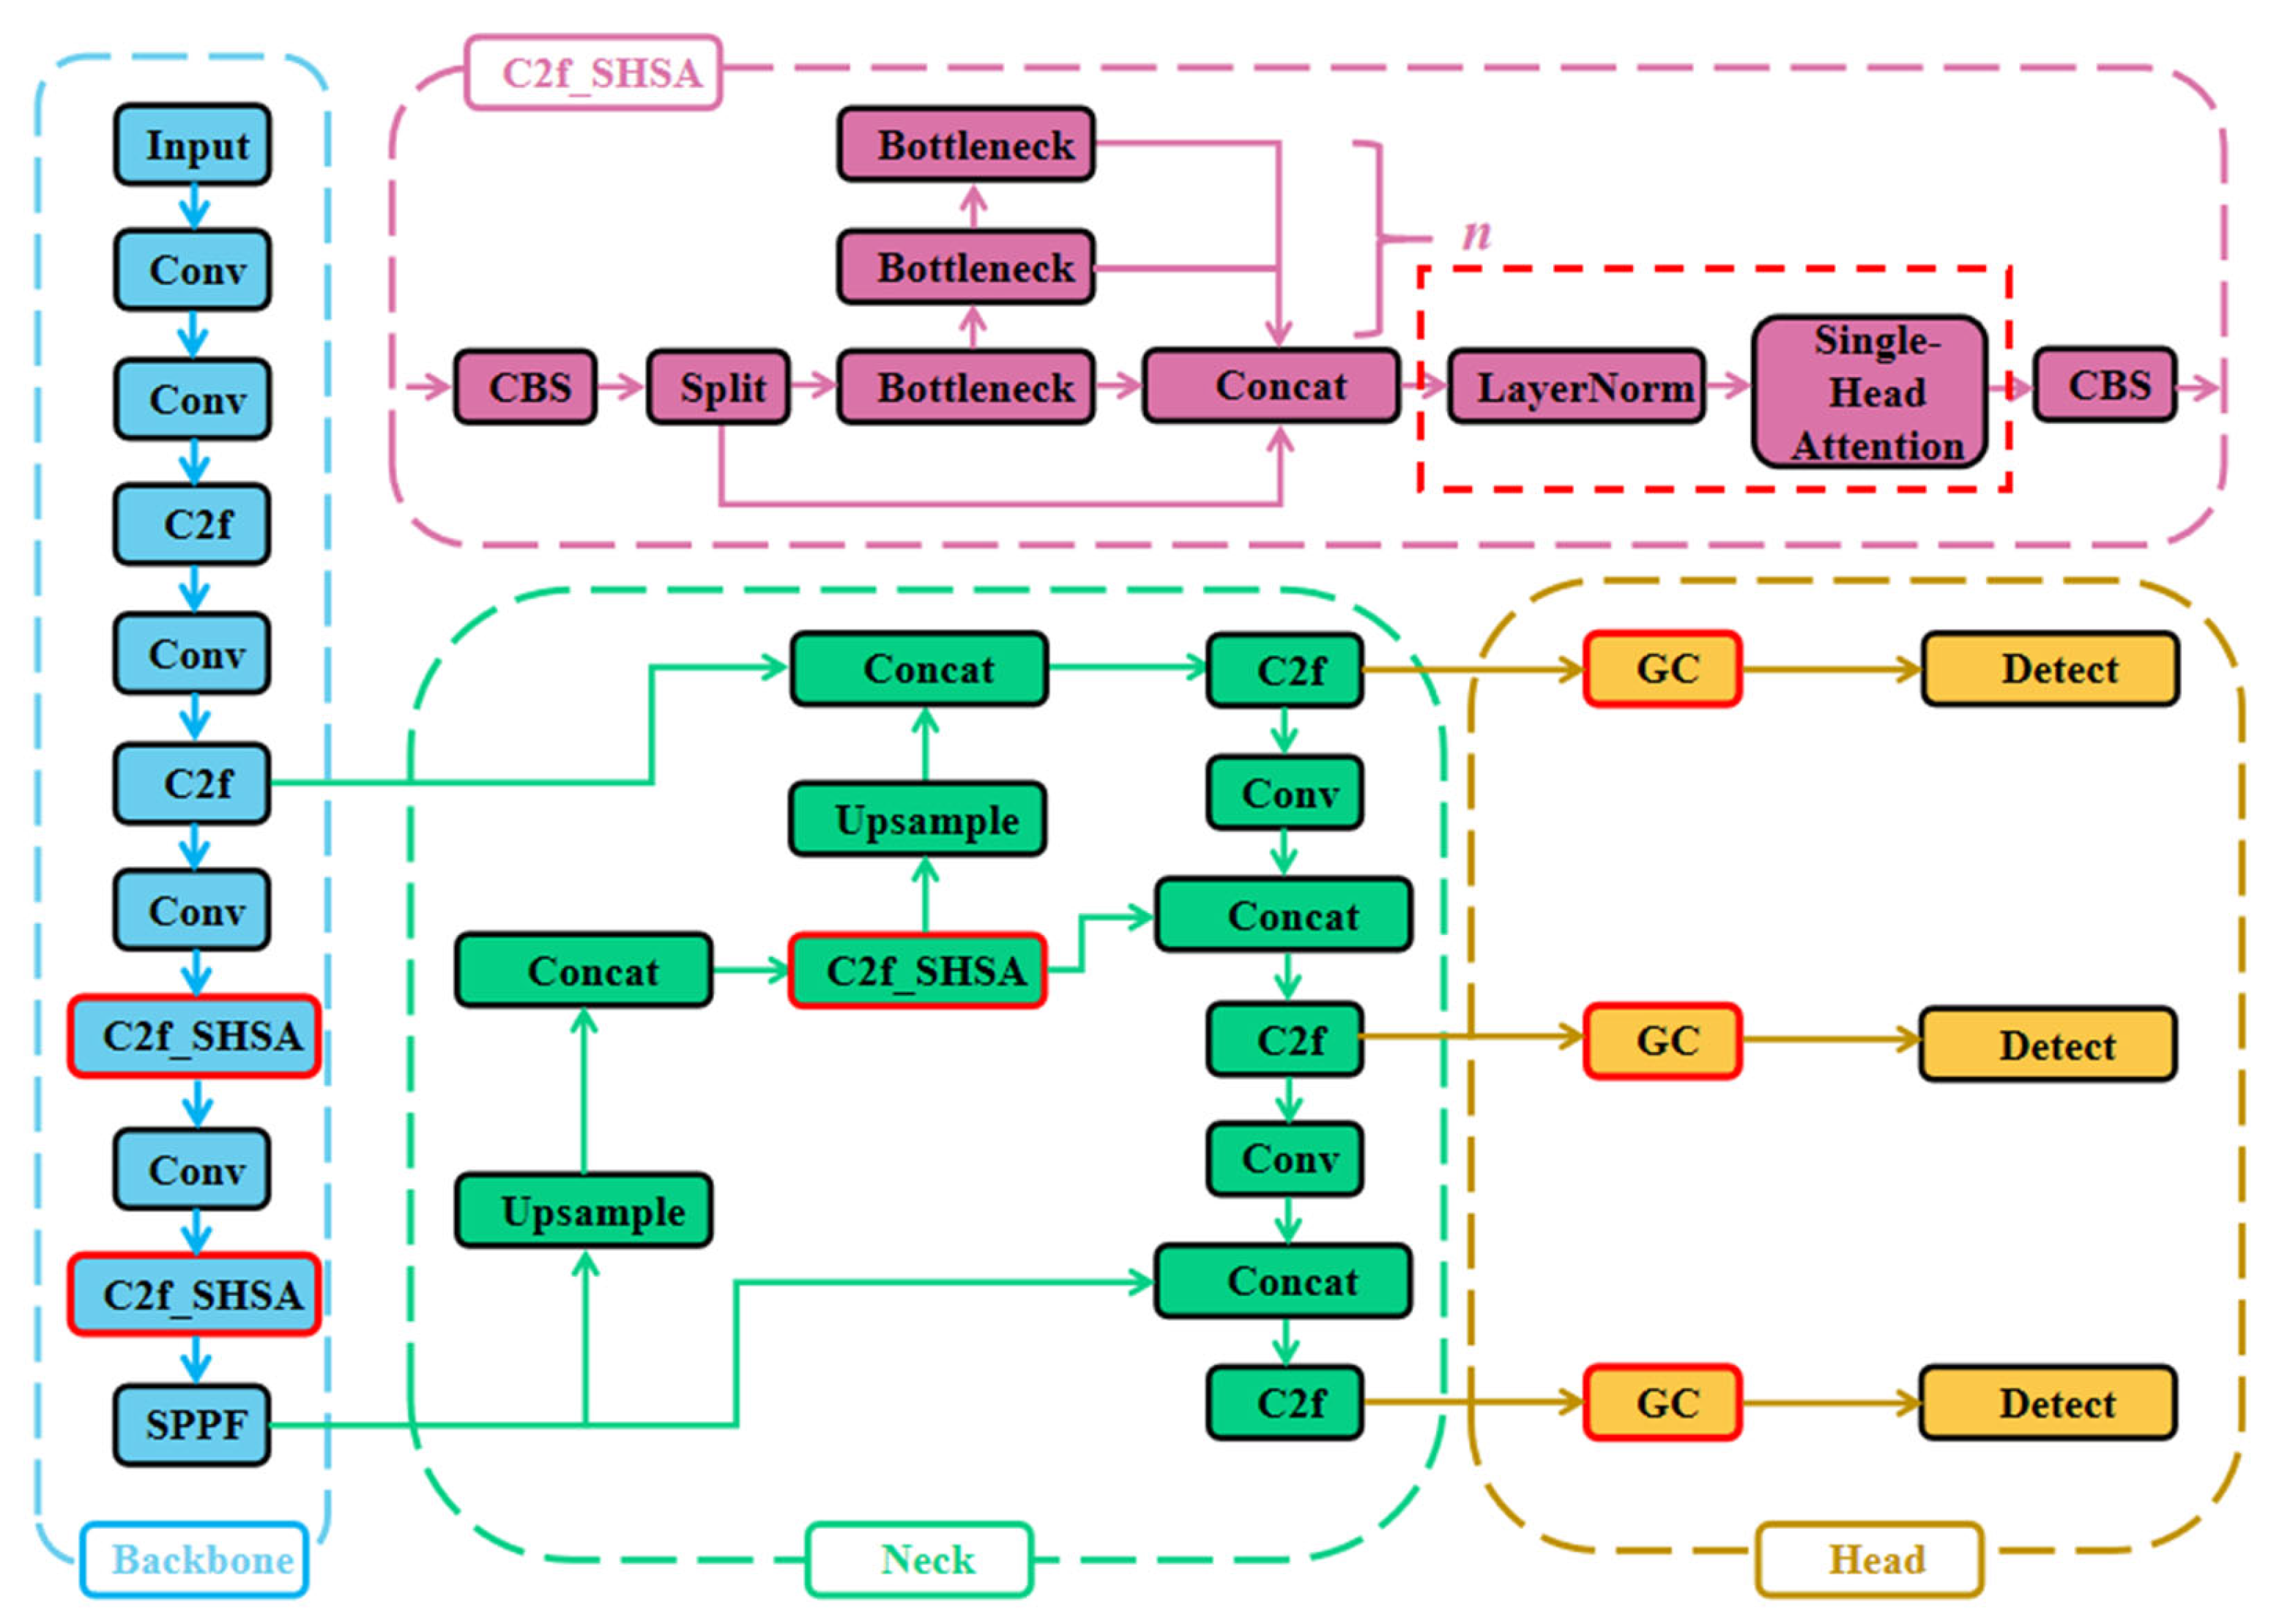
46] modules, named YOLOv8-SHSA-GC (YOLOv8-SG). These architectural enhancements enable YOLOv8-SG to maintain computational efficiency while achieving substantial improvements in detection accuracy and generalization performance, particularly in the precise identification of bird droppings and hotspot faults. The comprehensive architecture of YOLOv8-SG is illustrated in
Figure 7.
The proposed YOLOv8-SG architecture comprises three main components: the backbone, neck, and head. The backbone performs hierarchical feature extraction, capturing both semantic and spatial information from input images with particular emphasis on regions relevant to fault localization [
47]. Due to the substantial variations in photovoltaic module faults—including size, shape, spatial distribution, and orientation—conventional convolutional operations often fail to achieve precise fault localization. This limitation results in reduced model adaptability and increased rates of both false negatives and false positives in fault detection. To overcome these challenges, we propose an enhanced architecture that integrates the SHSA module with YOLOv8’s native C2f structure, forming our novel C2f_SHSA module. This combination improves multi-scale feature representation and semantic richness while keeping computational overhead low, ultimately strengthening the ability of the backbone to identify small or densely distributed targets in complex photovoltaic images.
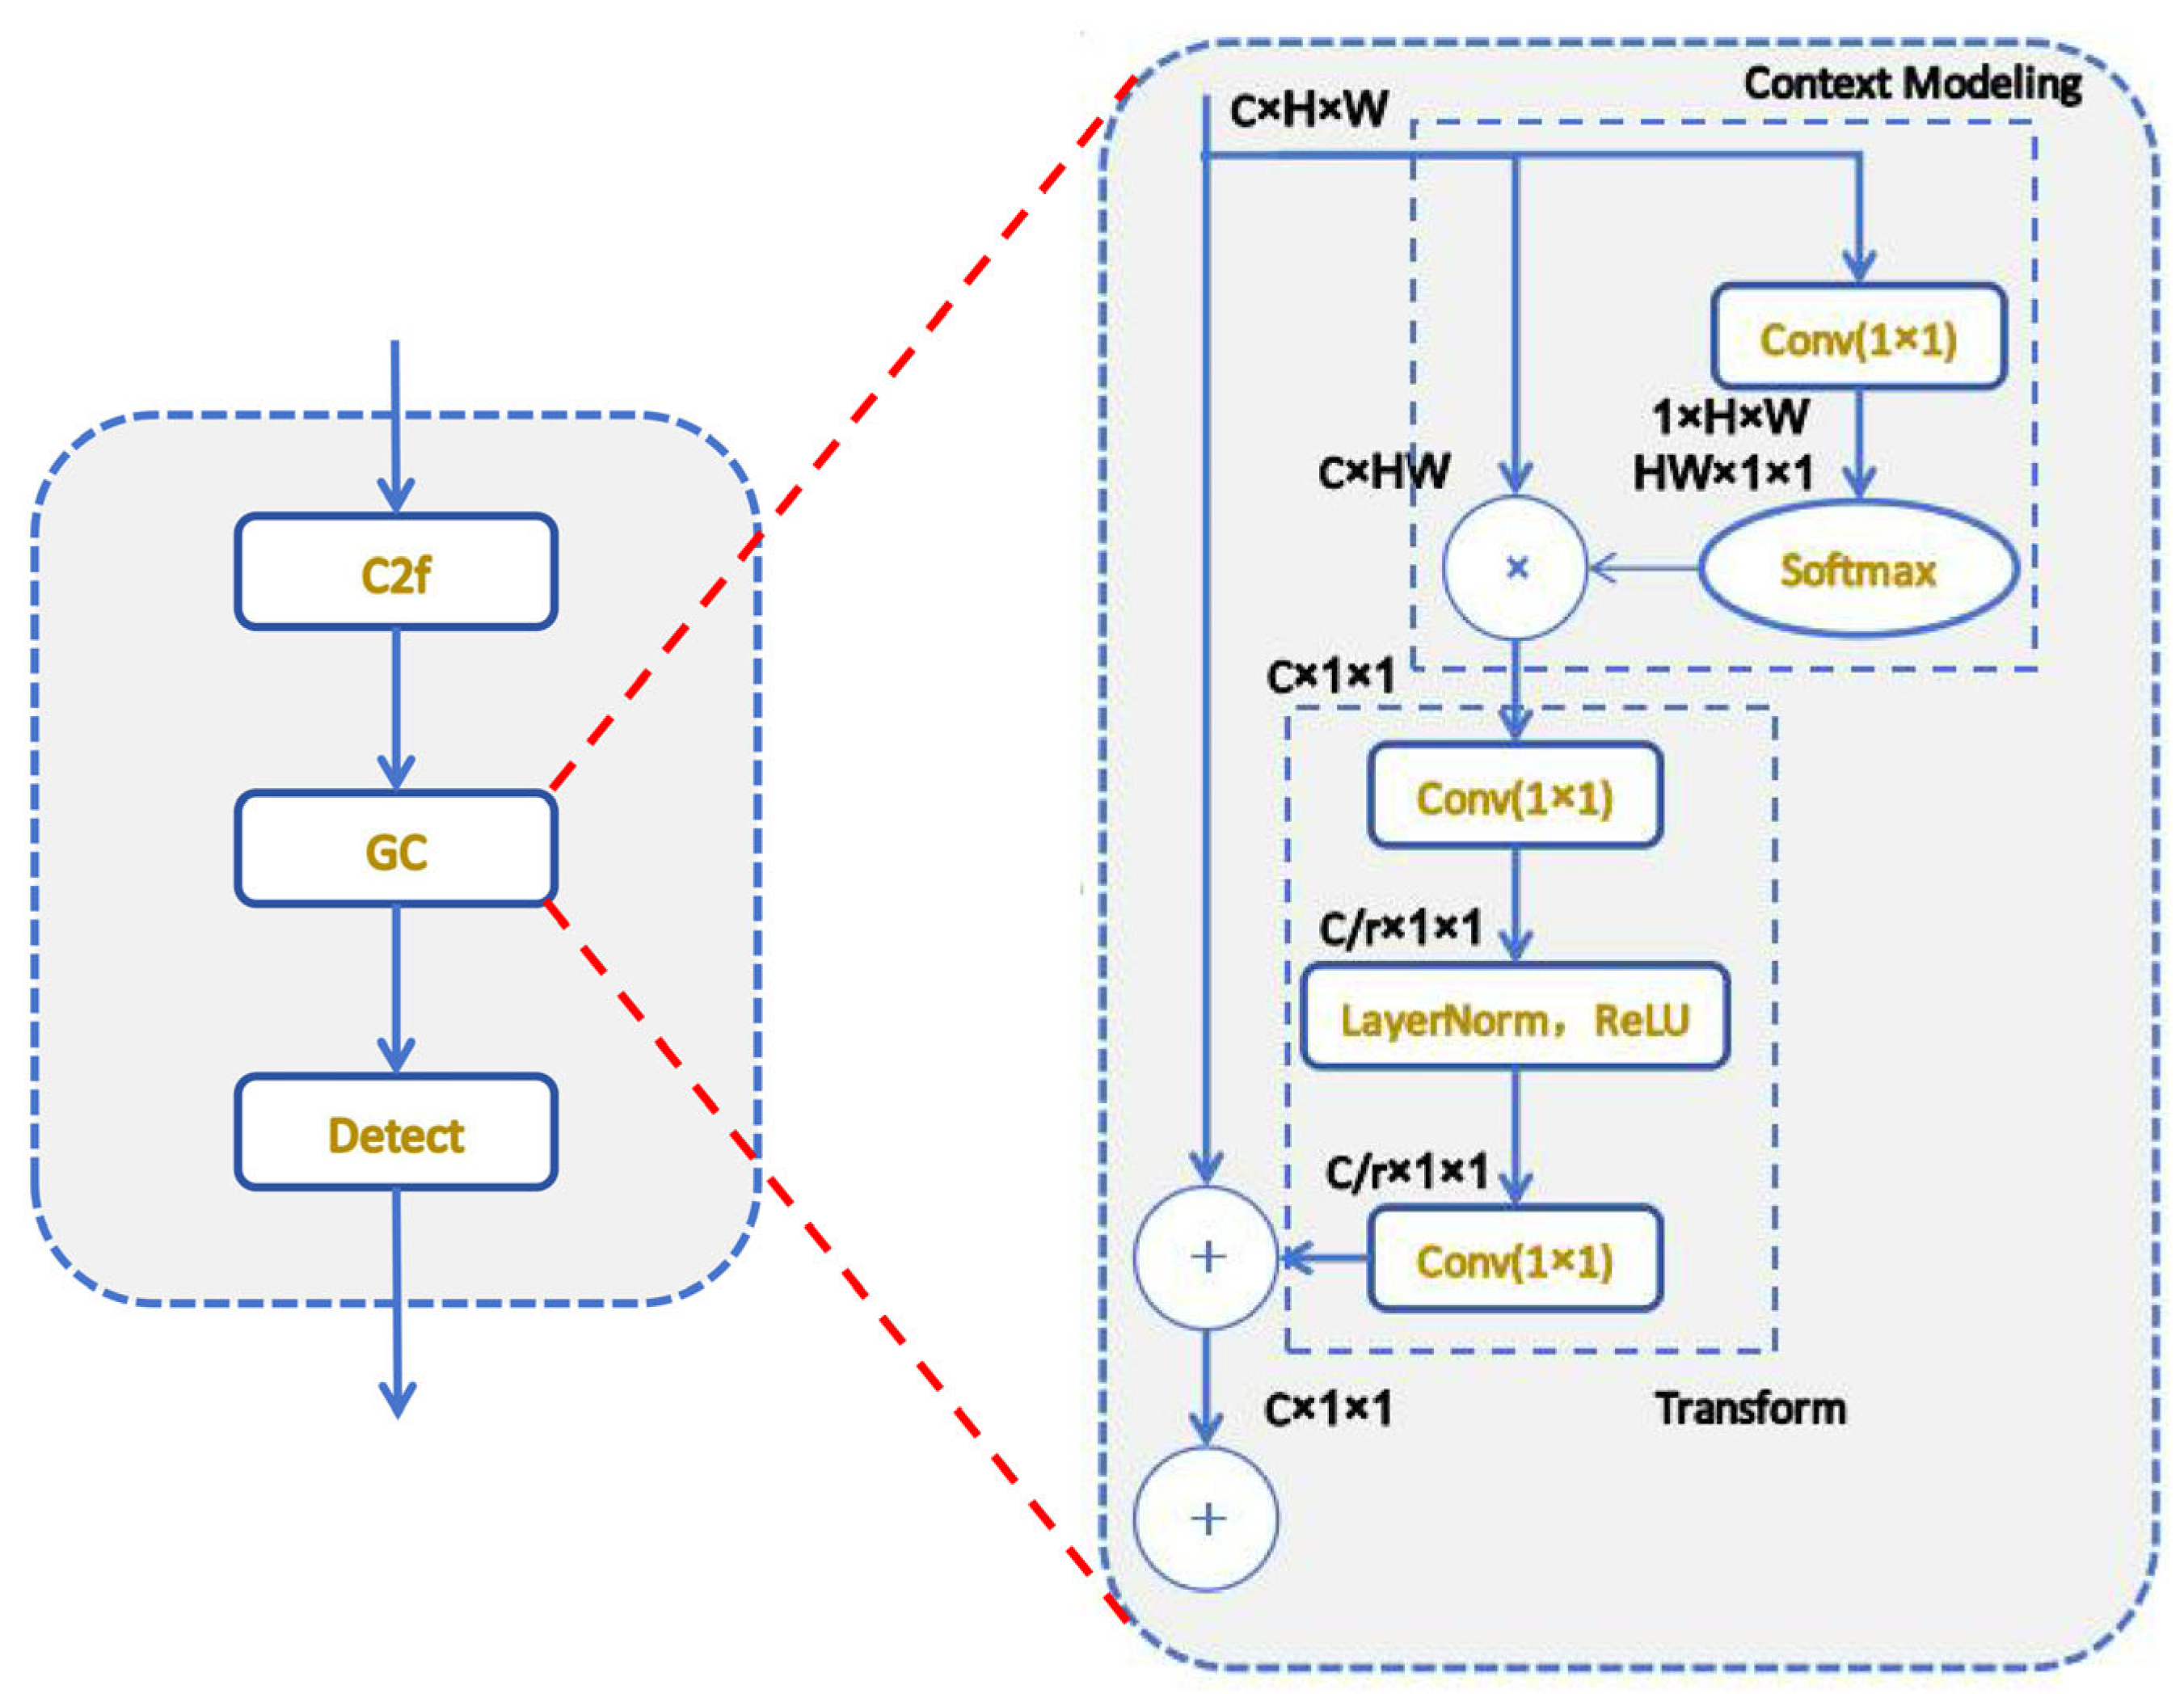
The neck performs feature fusion by aggregating information across three different spatial scales, thereby facilitating the integration of local and global contexts. In the head, fused features are processed to generate object detection outputs. To further enhance global context awareness, we introduce GC modules, which significantly improve the network’s ability to focus on salient regions while effectively refining feature selection.
Furthermore, the loss function integrates an auxiliary bounding box mechanism to enhance the speed of bounding box regression and to ensure more stable convergence. The detailed architecture and functional roles of each module are described in the following subsections.
3.4.1. Single-Head Self-Attention
During multi-scale feature fusion, the SHSA module employs a self-attention mechanism that performs spatial feature aggregation through a dedicated attention layer. The architecture effectively captures multi-scale and multi-level feature information [
48,
49]. The specific SHSA module is depicted in
Figure 8. For an input image of size
, feature matrix extraction via patch division yields a feature matrix of the following size.
Let
denote the patch edge length. The SHSA mechanism computes relationships among feature patches. For each patch, the new feature representation is obtained via attention calculation as follows.
In Equation (5),
,
, and
represent the query, key, and value matrices. The softmax operation normalizes to calculate attention weights. Afterward, a feed-forward neural network processes the attention output to generate new feature representations. By replacing the final three C2f modules in YOLOv8’s backbone with C2f_SHSA, local self-attention calculations are performed within Windows. This reduces computational costs compared to traditional global self-attention. This strategy preserves performance gains while more effectively managing computational and memory resource consumption, resulting in a more lightweight model architecture.
Figure 8.
The architecture of the SHSA module.
Figure 8.
The architecture of the SHSA module.
3.4.2. Global Context
The addition of the GC module enables architecture to capture global information within features before detection, thereby substantially boosting the capacity of the model to discern global relationships within images. The GC module is embedded after the last CBS layer of the bottleneck. As depicted in
Figure 9, the GC module employs a convolution operation in conjunction with a softmax function to derive attention weights, followed by attention pooling to extract global context features. Within the bottleneck transformation, two convolutional layers are utilized to capture channel dependencies through feature transformation. Ultimately, global context features are incorporated into each position’s features through broadcasting element-wise addition, accomplishing feature fusion. The formula for the feature fusion function is as follows.
In the Equation (7),
represents the weight of global attention pooling,
represents the number of locations in the feature map, and
represents the bottleneck transformation.
Figure 9.
The architecture of the GC module.
Figure 9.
The architecture of the GC module.
3.4.3. Inner-Lou Loss Function
In object detection tasks, the intersection over union (IoU) metric serves as a prevalent tool for assessing the degree of overlap between predicted bounding boxes and ground truth boxes, and it serves as a fundamental measure in bounding box regression. In subsequent studies, some variants based on IoU have emerged. However, these variants aim to overcome the limitations of the original IoU loss, particularly concerning gradient instability and insufficient localization accuracy in cases involving non-overlapping or misaligned boxes. However, these methods may still encounter challenges when applied to objects with irregular shapes or large-scale variations in complex environments.
Considering the variability of illumination and the complexity of the environment, the Inner-IoU loss function [
50] is adopted as an alternative to the default YOLOv8 loss formulation due to its potential benefits in photovoltaic module fault detection. The Inner-IoU loss enhances localization precision by matching predicted bounding boxes with auxiliary ground truth boxes at multiple spatial scales based on the overlap of their inner regions. This strategy is expected to be particularly effective in addressing small-scale bird droppings and irregularly shaped hotspot defects, where accurate localization is essential. The mathematical formulation of the Inner-IoU loss is presented as follows:
where the ground truth box (GT box) and anchor box are denoted as
and
, respectively. The center points of the ground truth box and the inner GT box are represented by
, while
signify the center points of the anchor box and the inner anchor box. The width and height of the ground truth box are denoted as
and
, whereas those of the anchor box are represented as
and
. The variable ratio corresponds to the scaling factor, which typically falls within a defined range.
The Inner-loU loss is in the range of . When the ratio exceeds 1, the auxiliary box surpasses the actual GT box in size. This expands the effective scope of regression, helping the model better detect small amounts of bird-dropping contamination or local hotspot defects and cut down missed detections. When this ratio is less than 1, the auxiliary box shrinks below the size of the actual GT box. This accelerates the convergence of high IoU samples, allowing the model to rapidly improve the precision of bounding box localization for more conspicuous bird-dropping areas or obvious hotspot abnormalities. As a result, the localization of the model accuracy improves, and the incidence of false detections is diminished.
3.5. Model Interpretation Based on Grad-CAM
The gradient-weighted class activation mapping (Grad-CAM) [
51] technique is considered in this study as a model interpretability method due to its effectiveness in visualizing class-discriminative regions within deep convolutional neural networks. By creating visual heatmaps that emphasize key areas of the input image, Grad-CAM reveals how different image parts influence model predictions, offering transparency into the model’s reasoning.
To implement Grad-CAM, the last convolutional layer of the target neural network is selected as the focus layer, as it retains rich spatial information while being semantically strong. Let us denote the input image
, the confidence score for class
, and
the feature maps of the selected layer
(with
being the number of feature maps in that layer). These feature maps are gathered during the forward pass. Partial backpropagation from the output of the model to the selected layer is then performed to compute the gradient values of each pixel in the feature maps with respect to the class score
, represented as
(where k indicates the kth feature map). The weights
corresponding to each feature map are obtained by taking the global average of these gradient values.
Here,
Z represents the size of the feature map and the
linear combination of these weighted feature maps yields the initial explanatory map
.
Based on this, the initial Grad-CAM map is up-sampled to the original image resolution using bilinear interpolation, resulting in a class-discriminative heatmap. This heatmap is designed to highlight the spatial regions that contribute most to the prediction of the model, enabling a visual interpretation of the attention of the model during the photovoltaic fault detection process. By localizing the focus of the model on potential fault areas, such as bird droppings or hotspots, the Grad-CAM visualization can facilitate further analysis of model behavior and improve interpretability in complex decision-making scenarios.
4. Results and Discussion
4.1. Dataset Description and Experimental Setup
4.1.1. Dataset Configuration
Based on the data collection, augmentation, and annotation methods in
Section 3, we assembled a multi-modal set of 2704 high-resolution field images from photovoltaic strings. Approximately 80% (n = 2146) are RGB frames depicting bird-dropping contamination, while the remaining 20% (n = 558) are infrared thermograms highlighting hotspot anomalies. The corpus was partitioned into data 1 (70%), data 2 (10%), and data 3 (20%) subsets, as detailed in
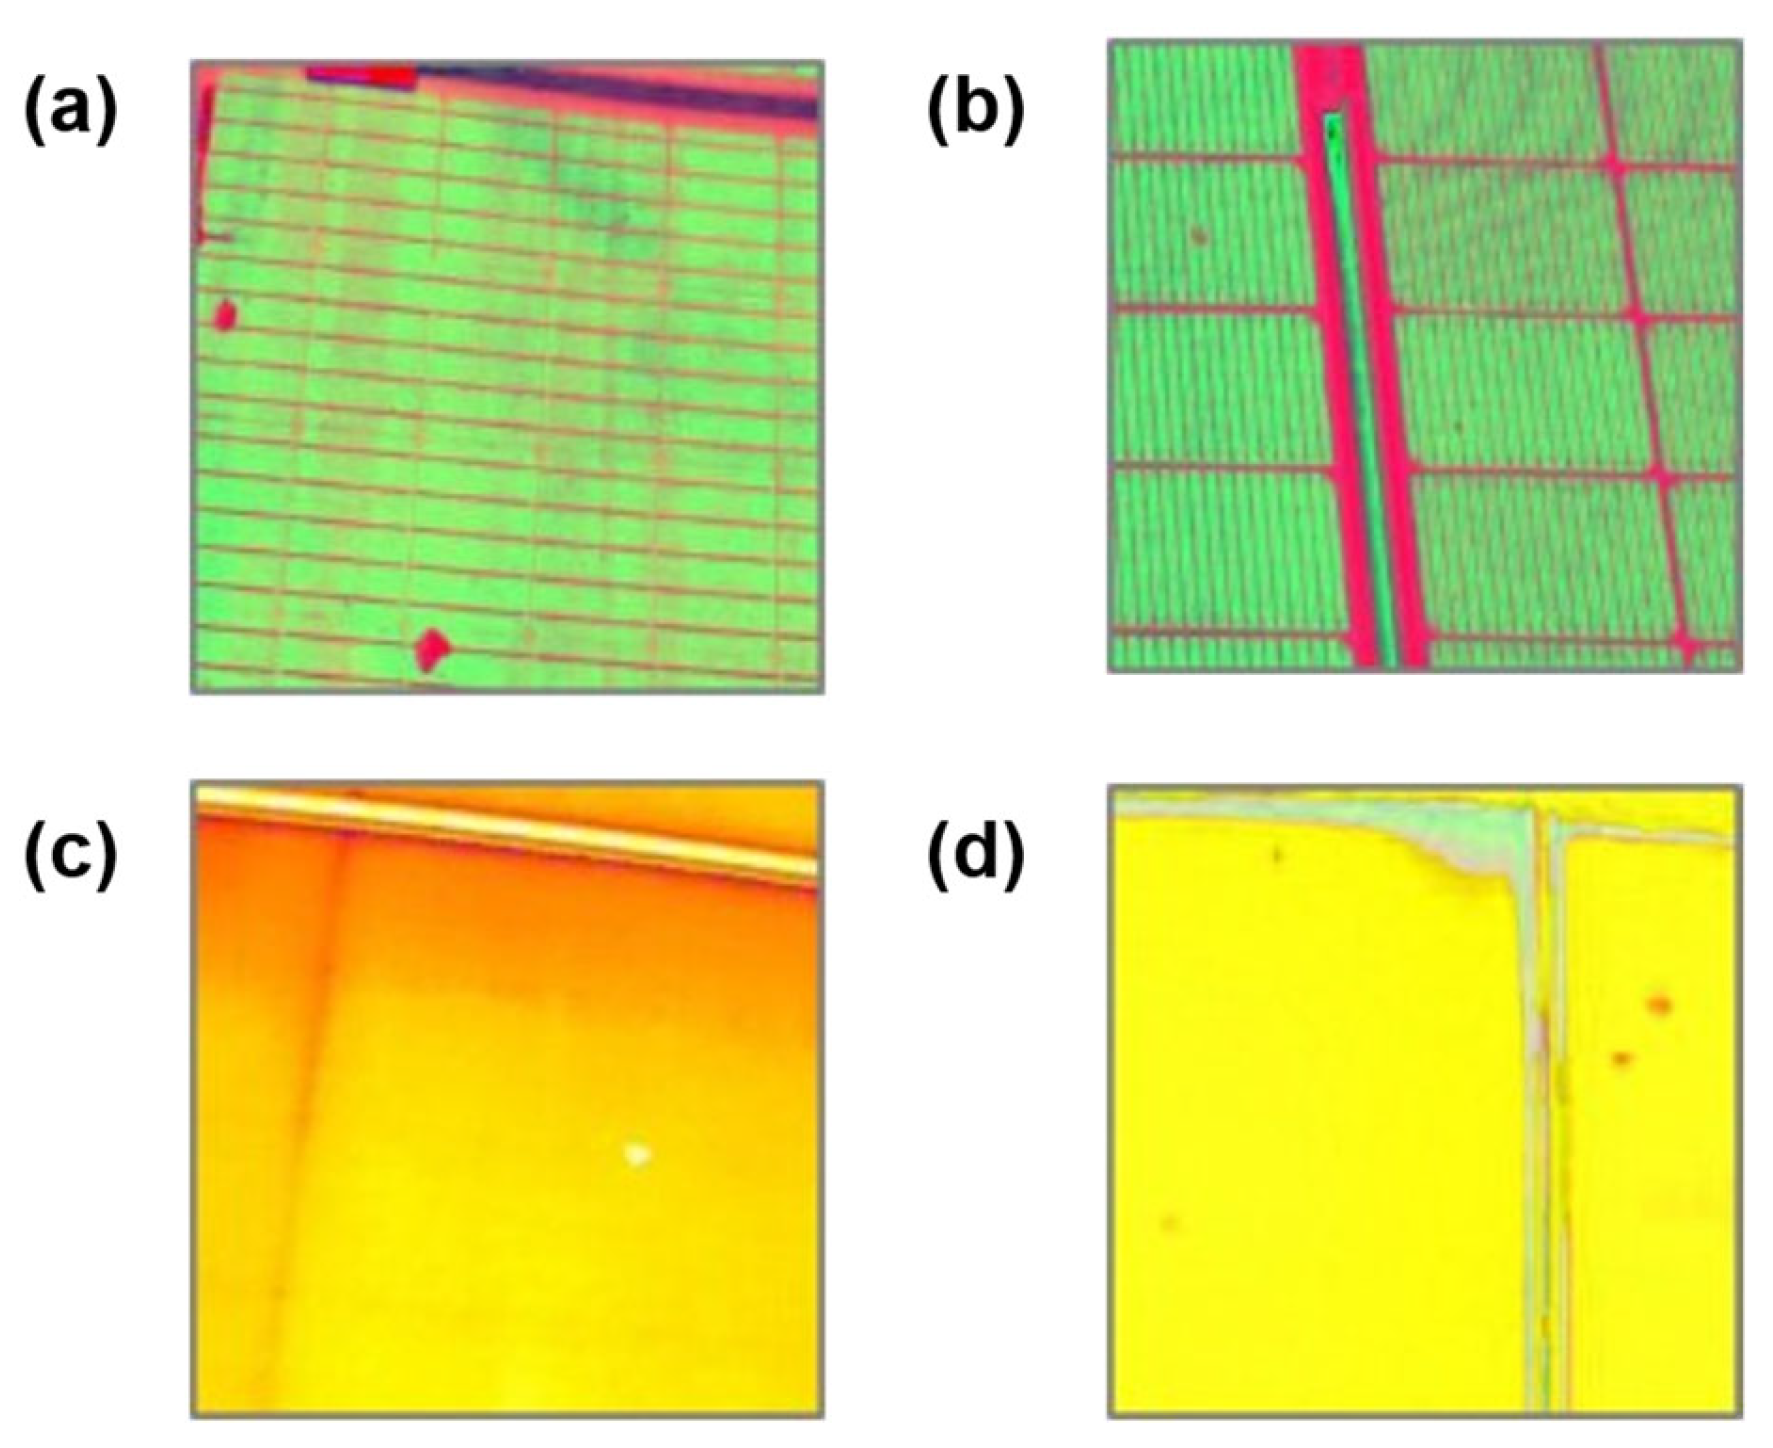
Table 2, yielding a moderate class imbalance of 1289 hotspot labels versus 5963 bird-dropping labels (ratio ≈ 1:4.6), where data 1 is for training, data 2 is for validation, and data 3 represents the test subset. Without resorting to loss re-weighting, we mitigated this imbalance through tailored augmentation strategies and a training protocol that prioritizes hard-example mining, thereby preserving sensitivity to the minority hotspot class. Representative RGB and infrared photovoltaic images from the dataset are presented in
Figure 10.
4.1.2. Experimental Setup
All experiments were conducted on an NVIDIA RTX 3090 GPU with the following computational environment: CUDA 12.5, Python 3.10, and PyTorch 2.4.0. For model optimization, we employed the SGD optimizer [
52] with an initial learning rate of 0.01. The training protocol consisted of 150 epochs with a fixed batch size of eight, which ensured consistent convergence across all model configurations.
4.2. Evaluation Metrics
In the evaluation of the YOLOv8 model, key metrics include precision (P), recall (R), mean average precision (mAP), and the number of model parameters [
53]. These metrics collectively offer a comprehensive assessment of the model’s effectiveness on the custom dataset.
Precision measures the accuracy of detections, calculated as the ratio of true positives (TP) to the sum of TP and false positives (FP).
Recall evaluates the ability of the model to identify all instances of objects, calculated as the ratio of TP to the sum of TP and false negatives (FN).
Average precision (AP) aggregates precision and recall across various thresholds, indicating the effectiveness of the model in identifying objects within a particular category. For datasets with multiple categories, mean average precision (mAP) is computed as the average of AP values across all categories.
The next section presents experimental results based on these metrics and parameters.
4.3. Comparative Experiments
To comprehensively evaluate the performance of the proposed algorithm, comparative experiments were conducted against several mainstream object detection models and their peer-improved variants under identical experimental datasets and training conditions. Considering the constraints on model size and computational resources for deployment in intelligent inspection robots, the lightweight ‘s’ variants of the YOLO series were selected for comparison. The results of these experiments are summarized in
Table 3.
As shown in
Figure 3, the proposed method achieves an mAP@0.5 of 0.868, a recall of 0.827, and a precision of 0.836, outperforming all other models listed. YOLOv8 was selected as the baseline model due to its robust performance and balanced computational efficiency, providing a strong foundation with an mAP@0.5 of 0.841, a recall of 0.822, and a precision of 0.785. This strategic choice was made because YOLOv8 offered high initial detection accuracy while maintaining manageable computational demands, with a parameter size of 21.5 MB. We then integrated the HSV, GC, SHSA, and Inner-lou modules to the model. Specifically, HSV for enhanced color feature extraction, GC for improved global context awareness, SHSA for bolstered small-object detection, and Inner-lou for structural optimization. These enhancements not only improved detection accuracy, but also demonstrated the model’s enhanced capability in handling complex backgrounds and small targets.
Furthermore, SG-YOLOv8 and YOLOv5+SA are improved models based on YOLOv8 and YOLOv5, respectively [
54,
55]. SG-YOLOv8 enhances the feature extraction process by integrating spatial attention mechanisms and depth-wise separable convolutions, thereby improving detection accuracy. However, it has a slightly lower recall rate compared to YOLOv5+SA. On the other hand, YOLOv5+SA improves the detection capability of hotspot regions by embedding a spatial attention mechanism, but its precision is slightly lower than that of SG-YOLOv8. Our method outperforms both models in terms of mAP@0.5, recall, and precision, indicating a superior balance in feature extraction, target localization, and false positive suppression.
In summary, the proposed method’s superior performance is attributed to the strategic integration of modules that enhance feature extraction, context awareness, and detection accuracy. While the enhancements led to a slight increase in computational complexity, the trade-off was justified by the significant gains in detection performance. Future research should focus on developing more efficient module designs to further enhance detection capabilities without a substantial increase in computational overhead. Additionally, exploring advanced data augmentation techniques could improve the model’s adaptability to diverse environmental conditions, thereby enhancing its generalization capability.
4.4. Ablation Experiment
To evaluate the effectiveness of the modules in YOLOv8s, the impact of adding the HSV color model was first assessed. Then, ablation studies on the SHSA and GC modules, integrated into YOLOv8s with HSV, were conducted. Finally, the Inner-lou loss function was incorporated. The results are presented in
Table 4 and
Table 5.
As elucidated by the ablation studies in
Table 4, the integration of various modules into the YOLOv8 framework has a pronounced effect on overall detection performance. The baseline YOLOv8 model, with an mAP@0.5 of 0.841, a recall of 0.822, a precision of 0.785, and a parameter size of 21.5 MB and operating at 6.75 FPS, provides a robust benchmark for subsequent module assessments. Sequential introduction of modules yields varying degrees of performance enhancement: the HSV module marginally increases mAP@0.5 to 0.847, albeit with a slight drop in recall to 0.785 and a rise in precision to 0.819, accompanied by a minor decrease in FPS to 6.68. The GC module significantly boosts mAP@0.5 to 0.853, recall to 0.842, and precision to 0.802, albeit at the expense of reduced FPS to 6.49. The SHSA module, while trimming the parameter size to 18.7 MB and elevating FPS to 7.29, marginally reduces recall to 0.817 and precision to 0.776, yet lifts mAP@0.5 to 0.852. When all modules, including Inner-lou, are incorporated, mAP@0.5 peaks at 0.868, recall ascends to 0.827, precision rises to 0.836, the parameter size stands at 18.8 MB, and FPS is 6.83, highlighting the synergistic enhancement in all performance metrics through module integration. These findings underscore the critical role of module integration in bolstering detection capabilities, especially in handling complex backgrounds and minute targets.
The sensitivity of specific categories to module integration, as revealed in
Table 5, further elucidates the differential response of categories to the introduction of modules. For bird-dropping contamination, the base model’s mAP@0.5 of 0.876 experiences a slight dip to 0.872 upon the introduction of HSV but, ultimately, climbs to 0.899 with all modules in place. Similarly, for hotspot defects, the base model’s mAP@0.5 progressively increases from 0.771 to 0.837 when all modules are activated, highlighting the significant sensitivity of this category to the incorporation of GC and SHSA modules. These results emphasize the varied responsiveness of different categories to module introduction, with bird-dropping contamination and hotspot defects achieving notable improvements in detection accuracy through the strategic addition of modules.
In summary, the amalgamation of modules markedly enhances detection performance, with GC and SHSA modules playing a pivotal role. However, this performance uplift is juxtaposed against increased computational demands, necessitating a judicious trade-off between performance gains and resource utilization. Future research should focus on developing more streamlined module architectures that can deliver enhanced detection capabilities without a significant increase in computational overhead. Additionally, exploring advanced data augmentation techniques could bolster the model’s adaptability to diverse environmental conditions, thereby enhancing its generalization capability.
4.5. Visualization Analysis Based on Grad-CAM
In this study, an innovative approach was adopted to visualize and analyze the performance of the YOLOv8s model in photovoltaic (PV) panel fault detection through heat maps generated by Grad-CAM. This method not only enhances the model’s interpretability, but also provides a profound understanding of the model’s behavior by intuitively displaying the distribution of its attention.
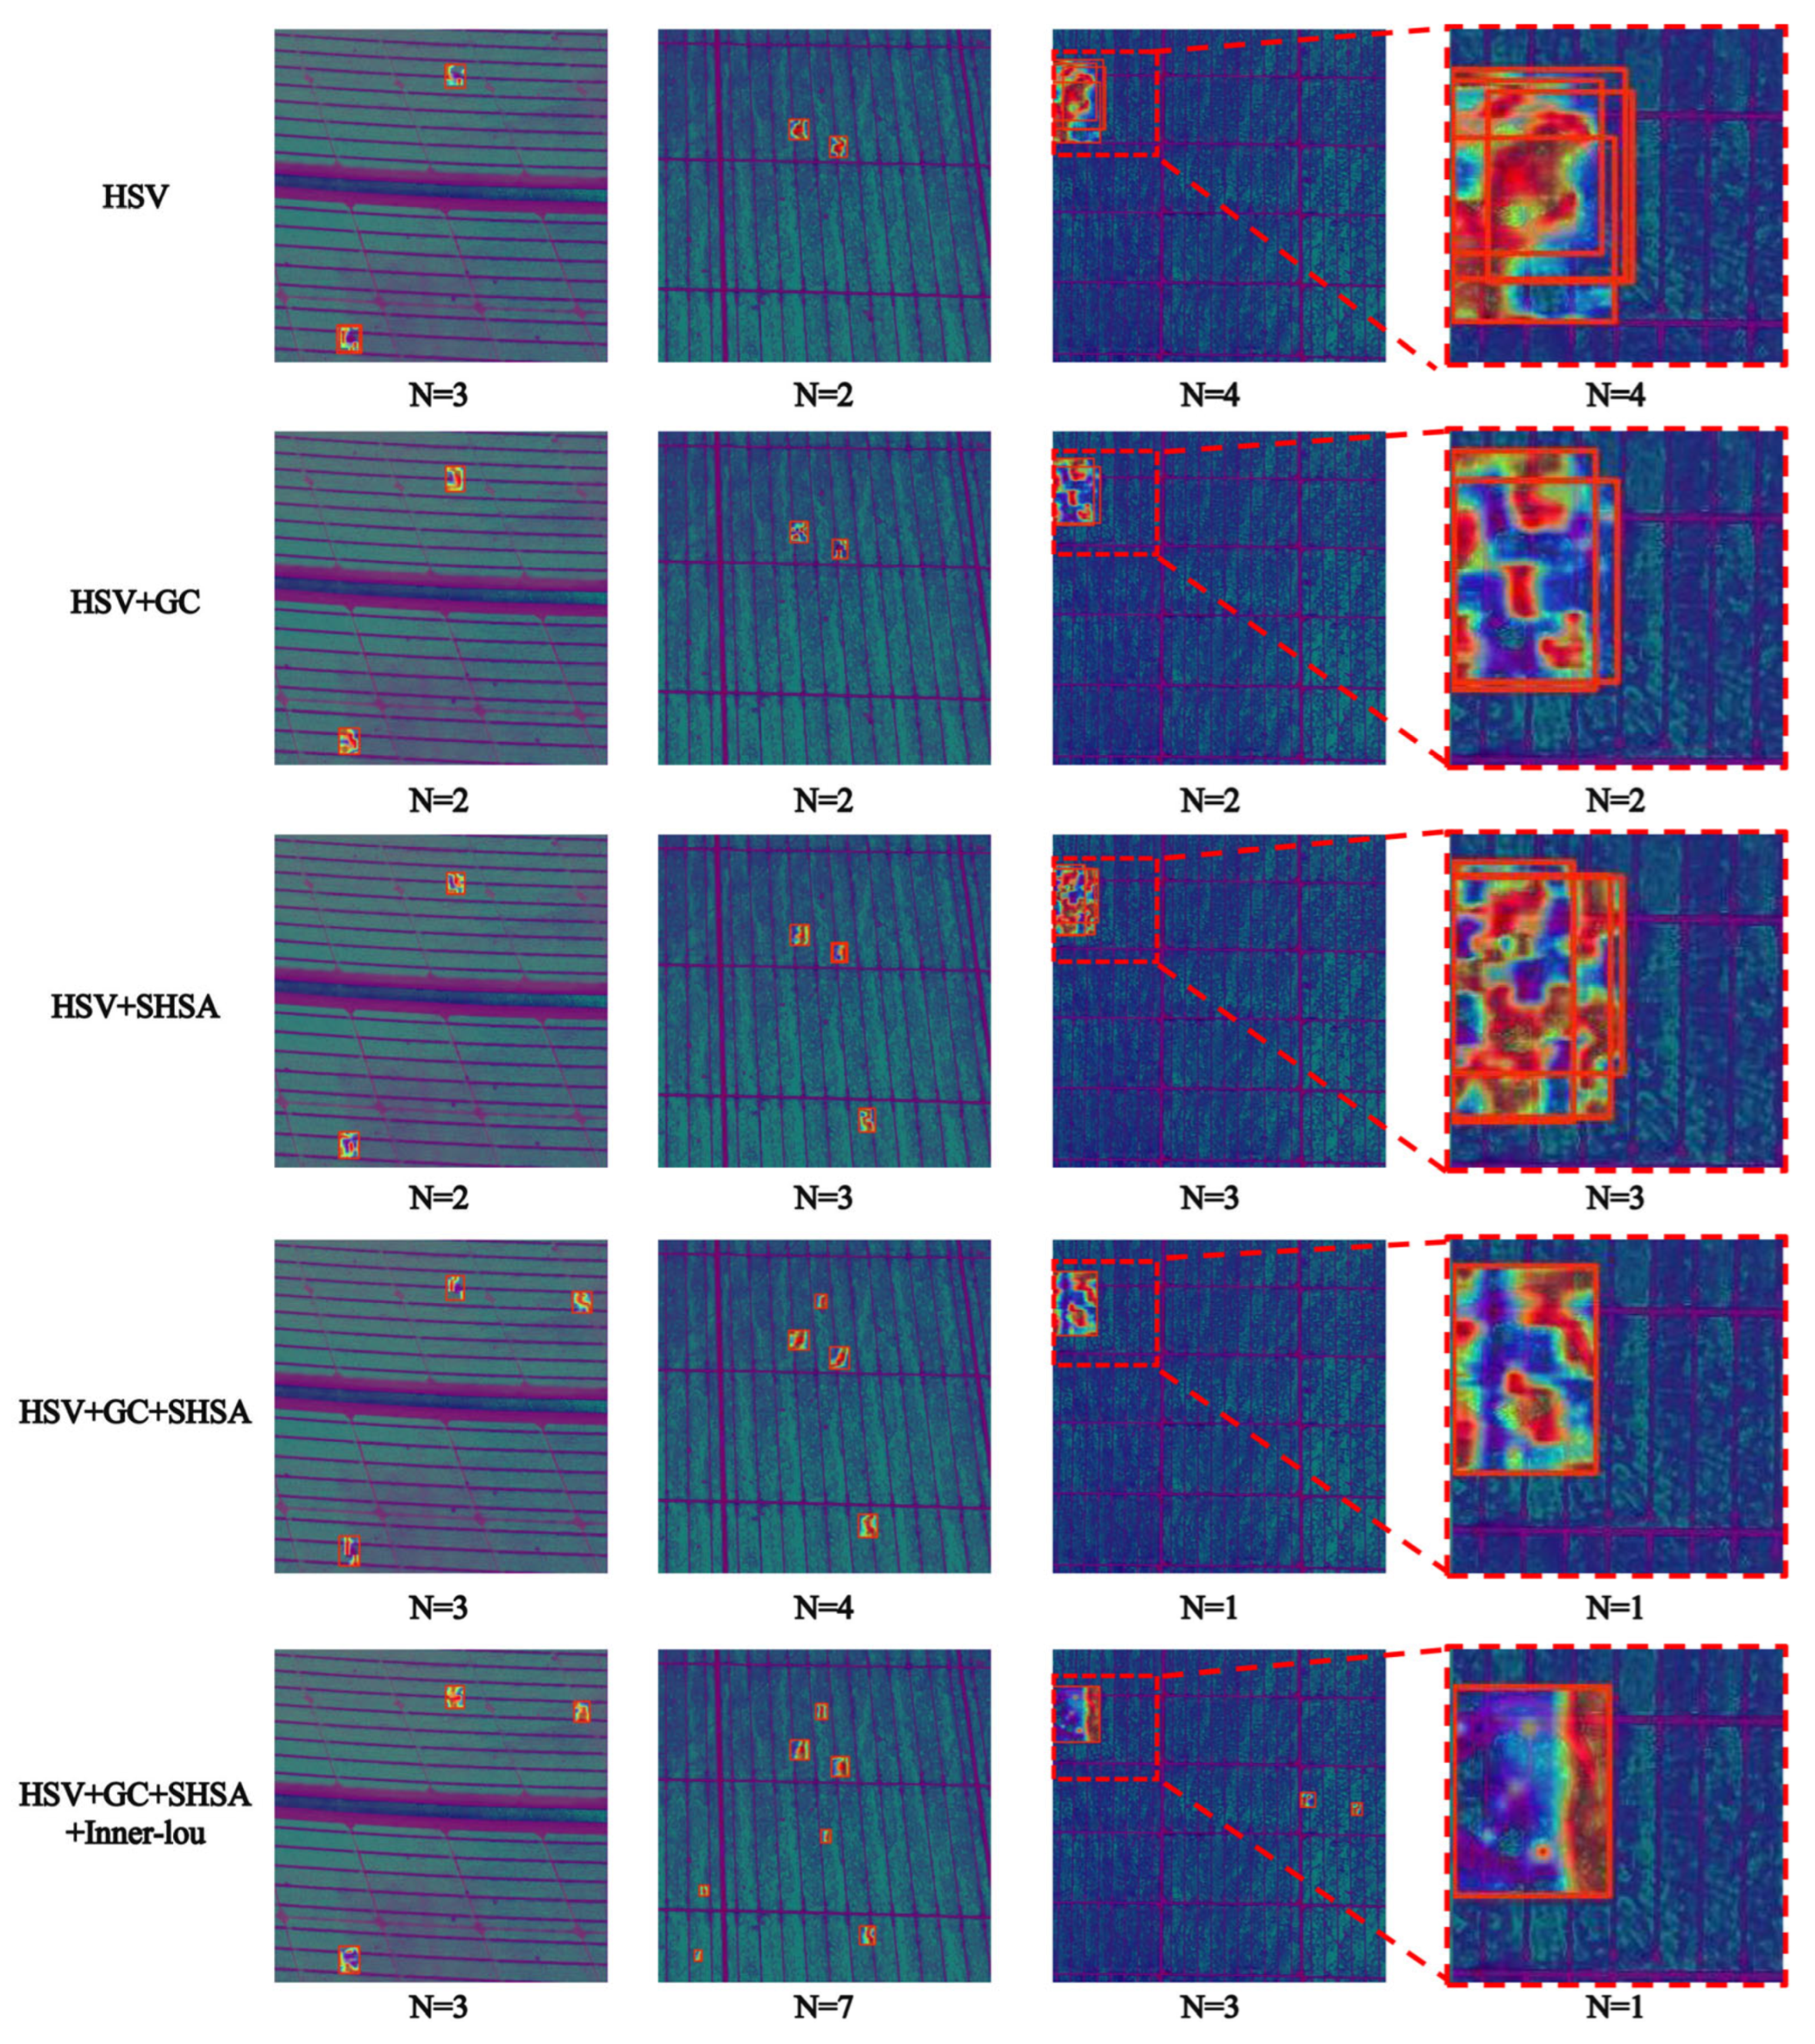
The heat maps in
Figure 11 clearly demonstrate how the feature extraction capability gradually improves with the increasing complexity of the model. The initial model, using only the HSV color space, had a relatively basic feature extraction capability. However, with the introduction of GC and SHSA modules, the model’s ability to identify fault areas was significantly enhanced. The integration of these modules not only improved detection accuracy, but also optimized resource utilization, reducing the omission and misclassification of faults. This finding confirms the results of our previous ablation study, which showed that integrating different modules can significantly enhance the model’s computational power and feature extraction capabilities.
Despite the overall excellent performance of the model, the analysis of false positives and false negatives reveals its limitations under certain circumstances. For instance, in low-contrast or partially occluded situations, the model may struggle to accurately distinguish between faulty and non-faulty areas. These challenges point to the direction of future research, which needs to further improve the model to enhance its robustness and adaptability in complex environments. Additionally, the model’s behavior in low-confidence detections is also noteworthy and may require the introduction of more contextual information or the adoption of more advanced algorithms to assist in decision making.
In
Figure 11, it can be observed that, as the model is refined, the number of duplicate detection boxes decreases, allowing the model to detect more areas. This improvement is crucial for enhancing the comprehensiveness and accuracy of the detection. In correct detection results, the heat maps clearly highlight the fault areas, showing the model’s accurate focus on the target regions. However, in incorrect detection results, the heat maps may show scattered or inaccurate attention distribution, indicating that the model may be interfered with or misled under these circumstances.
An in-depth analysis of the model’s behavior reveals that it encounters difficulties when dealing with regions exhibiting complex textures or color variations, or when multiple similar faults are present. These findings underscore the need for further research to enhance performance under such challenging conditions, particularly through the integration of the recently proposed non-intrusive soft-computing defect-grading framework [
56].
In conclusion, the YOLOv8s model proposed in this study, by integrating the HSV, SHSA, GC modules, and Inner-lou loss function, has demonstrated exceptional performance in PV fault detection. The model’s robust adaptability and generalization capabilities make it an ideal choice for intelligent inspection robots performing maintenance and fault diagnosis of PV components. However, we also recognize that, to further enhance the model’s performance, future research needs to focus on improving the model’s adaptability and accuracy in complex and variable environments. This may involve more complex model structures, richer datasets, and more advanced training strategies. Through these efforts, we hope to advance the development of PV fault detection technology and contribute to the realization of more efficient and reliable PV systems. Future research should also explore the model’s interpretability to better understand the model’s decision-making process and intervene when necessary. Additionally, research should pay attention to the ethical and social impact of the model to ensure that the development of technology aligns with the overall interests of society.


