Article

ImpactAlert: Pedestrian-Carried Vehicle Collision Alert System

1
Department of Computer Science Tandon/Courant, New York University, New York, NY 10012, USA
2
Department of Computer Science, Columbia University, New York, NY 10027, USA
*
Author to whom correspondence should be addressed.
Electronics 2025, 14(15), 3133; https://doi.org/10.3390/electronics14153133
Submission received: 6 March 2025 / Revised: 29 July 2025 / Accepted: 31 July 2025 / Published: 6 August 2025

Abstract

The ImpactAlert system is a chest-mounted system that detects objects that are likely to hit a pedestrian and alerts that pedestrian. The primary use cases are visually impaired pedestrians or pedestrians who need to be warned about vehicles or other pedestrians coming from unseen directions. This paper argues for the need for such a system, the design and algorithms of ImpactAlert, and experiments carried out in varied urban environments, ranging from densely crowded to semi-urban in the United States, India and China. ImpactAlert makes use of a LiDAR camera found on a commercial wireless phone, processes the data over several frames to evaluate the time to impact and speed of potential threats. When ImpactAlert determines a threat meets the criteria set by the user, it sends warning signals through an output device to warn a pedestrian. The output device can be an audible warning and/or a low-cost smart cane that vibrates when danger approaches. Our experiments in urban and semi-urban environments show that (i) ImpactAlert can avoid nearly all false negatives (when an alarm should be sent and it isn’t) and (ii) enjoys a low false positive rate. The net result is an effective low cost system to alert pedestrians in an urban environment.

1. Introduction

City streets and sidewalks are bustling with vehicles, and for the visually impaired, navigating these environments can be particularly perilous. According to recent accident statistics, visually impaired individuals are at a significantly higher risk of collisions compared to the general population. One study found that 1 in 12 pedestrians with blindness reported being hit by a motor vehicle or cyclist [1]. Additionally, about 40% of blind individuals experience head-height collisions at least once a year, with 15% experiencing such collisions monthly [2]. Another study found that individuals with visual impairment have a 46% increased risk of being involved in road traffic crashes compared to those without visual impairments [3]. While general pedestrian accident rates are concerning, the visually impaired face even greater challenges due to their inability to perceive and react to approaching hazards as effectively as sighted individuals. Such incidents underscore the critical need for advanced technologies that can augment the abilities of visually impaired individuals, providing them with timely alerts and enhancing their safety.
The ImpactAlert warning system aims to address this need. By utilizing LiDAR sensors and data to track incoming objects, the system’s algorithms determine when to alert the pedestrian to potential collisions, giving the pedestrian time to avoid or prepare for impact. This paper describes the algorithms and implementation of the ImpactAlert warning system, then evaluates the quality of its algorithm (accuracy, recall, precision, F1-score) through experiments on the streets of four urban areas with wide differences in traffic densities and speeds. The github link to the codebase used for ImpactAlert and the experiments can be found https://github.com/hwyuanzi/Impact-Alert-Lidar/, last accessed on 1 August 2025.

2. Related Work

The development of assistive technologies to detect vehicles has been an active area of research in recent years.
Autonomous vehicles use advanced LIDAR sensors and machine learning algorithms to detect pedestrians effectively. A study focused on the performance of algorithms like k-Nearest Neighbors, Naïve Bayes Classifier, and Support Vector Machine, applied to 3D LIDAR sensor data, demonstrated very high recall and high precision in real-world tests. These systems form a part of advanced driver assistance systems (ADAS), improving road safety [4].
Collision detection systems installed at static locations, such as parking lots or intersections, enhance safety by warning pedestrians and vehicle operators about potential collisions. These systems, like the Collision Sentry, use motion detection and sound alarms to mitigate accidents in high-risk areas [5].
Recent advancements in systems that warn drivers about pedestrians to avoid collision focus on detecting pedestrians from vehicles. Machine learning/computer vision algorithms, applied to LIDAR and camera data, improve overall pedestrian safety, particularly at pedestrian crossings and during road navigation [6].
Scalvini et al. introduced an outdoor navigation assistive system leveraging 3D spatialized sound and sonified obstacle information to guide blind individuals. The system combines inertial sensors, GPS data, and visual cues processed via deep learning to refine navigation trajectories in real-time. With low-latency processing on embedded GPUs, it operates independently of remote connections, providing an efficient and reliable navigation aid [7].
Real-time decision-making models are gaining prominence, incorporating pedestrian trajectory, speed, and environmental factors to provide early warnings. These systems often integrate vehicle-to-everything (V2X) communication technologies to enhance collision prevention in crowded urban environments [8].
Systems to avoid vehicle to vehicle collisions rely on radar, LIDAR, and cameras to predict potential collisions. Advanced systems employ object tracking and predictive modeling to enhance accuracy and reaction time. Such methods are embedded in fully autonomous vehicles [9].

2.1. Smart Canes for the Visually Impaired

Laser sensing technology has also emerged as a promising approach for smart canes. Bolgiano et al. first mounted a laser sensor on a blind cane in 1967 [10], while Benjamin et al. developed the C1–C5 series of laser smart canes in the early 1970s [11]. These early devices used laser sensors to detect obstacles and provide audio or vibration warnings. They were limited by the technology of the time, offering restricted detection accuracy and range.
Advances have focused on improving detection capabilities and integrating multiple sensors. Mai et al. proposed a smart cane system that combines a 2D LiDAR sensor with an RGB-D camera [12]. This fusion of laser and vision sensing technologies enables both navigation and stationary obstacle recognition functionalities. The system utilizes the Cartographer algorithm for laser SLAM (Simultaneous Localization and Mapping) and an improved YOLOv5 algorithm to detect and locate stationary obstacles and other pedestrians.
Other researchers have explored alternative sensor combinations. The Augmented Cane developed by Stanford University researchers incorporates a LiDAR sensor along with GPS, accelerometers, magnetometers, and gyroscopes [13]. This multi-sensor approach allows for comprehensive monitoring of the user’s position, speed, and direction, in addition to obstacle detection.
Commercial solutions have also emerged, such as the WeWALK smart cane. Initially launched with an upward-facing ultrasonic sensor, WeWALK has since partnered with Moovit to integrate urban mobility features [14]. This collaboration enables users to access real-time public transit information and receive step-by-step navigation guidance through voice assistance.
The SmartCane system developed by UCLA researchers takes a different approach, focusing on fall prevention for older individuals rather than visual impairment. This system incorporates a 3-axis accelerometer, three single-axis gyroscopes, and two pressure sensors to provide biomechanical support and fall detection [15].
While technologies such as LiDAR and laser rangefinders improve the precision of distance measurements in assistive devices [16], their primary application has been in navigating environments and avoiding fixed obstacles or slow-moving pedestrians.

2.2. Pedestrian-Carried Vehicle Alerting Systems

While the cane-mounted technologies can help visually impaired people to navigate and to avoid static obstacles, there remains a need for a system that can effectively detect and warn pedestrians about fast-moving objects like vehicles that approach them.
The closest system that we know of are AI-powered headphone systems designed to alert pedestrians of approaching vehicles. These systems use embedded microphones to detect vehicle sounds and warn users through audio cues. Such technologies have potential benefits for both visually impaired and general pedestrians [17], but, as the authors note, sounds in a crowded urban environment are ubiquitous, resulting in an overwhelming number of false positives. Further, electrically powered vehicles make very little noise. Finally, a vehicle that is not on a trajectory to hit the pedestrian is not a danger, so sound-based systems could lead to numerous false positives in urban environments.

3. Materials and Methods

ImpactAlert uses a LiDAR (Light Detection and Ranging) system embedded in a phone to sense threats and a variety of possible actuators to alert the pedestrian. The actuators we consider are a sound signal perhaps linked to headphones, a vibration of the phone itself, or a vibrating cane handle. Section 3.1 describes algorithms to identify threats. Section 4 describes the design of the smart cane handle actuator.

3.1. Threat Detection Technology and Thresholds

LiDAR is a remote sensing method that uses laser pulses to measure distances between the sensor and objects in the environment. The precision and speed of LiDAR make it ideal for applications requiring accurate depth perception.
Using LiDAR, the ImpactAlert software, (found at https://github.com/hwyuanzi/Impact-Alert-Lidar/, last accessed on 1 August 2025) implemented in Swift on top of iOS, uses the ARKit output to extract depth information from the central region of the screen. ImpactAlert performs depth calculations every 10 frames (roughly every 0.5 s) to achieve real-time performance without overloading the system. For our own testing purposes, the user interface on the phone sounds an alarm and changes the display color to red when an object is coming towards the pedestrian faster than 2.2 m/s and the time to impact is less than three seconds.
These values are reasonable, because several studies, e.g., [18], indicate that pedestrians won’t be fatally injured for vehicle speeds of 20 miles per hour (8.9 m/s) or less. However, some people could be hurt at much lower speeds. For that reason, we have set the threshold to roughly 1/4 of 8.9 m/s) in our experiments.
Moreover, the pedestrian users of ImpactAlert have the option to adjust these parameters as we discuss in Section 7. For example, a fragile elderly person may choose a lower speed threshold or a higher time to impact. Changing thresholds to make alerts more likely might result in more false positives. By contrast, a robust (or optimistic) person to allow higher speeds for example may eliminate all false positives while increasing the likelihood of being hit without being warned. We see the impact in terms of precision/recall/F1-score of changing the speed and time to impact thresholds as discussed in Section 6.3.
To engage the system, a user presses a start/stop button to control when depth analysis is active. The user interface provides real-time feedback, adjusting both the display color to red, sound from the phone, and (when deployed) the cane handle vibrates. These alerts occur when an object is moving towards the pedestrian faster than the speed threshold and when the time to impact is less than the corresponding threshold.

3.2. Algorithms

The Algorithm 1 finds the pixels in the center of the camera using the subroutine listed in Algorithm 2. For those central pixels, the subroutine Algorithm 3 (1) filters to those distances that are in the closest part of all distances (in our implementation, closer than half the distances) and (2) sees whether each such pixel’s distance since the last processed frame (0.5 s ago in our current implementation) has changed by a minimum amount (0.2 m in our current implementation).
The threatDistance is then computed to be the average distance of those close and changing pixels. The speed is the sum of the distance differences in those changing pixels divided by the time between processed frames (0.5 s). After that, the main routine (Algorithm 1) sets an alarm based on the threshold.
The intuitions behind this algorithm are that
  • Objects that are static with relative to the pedestrian should not influence the calculations of the threatDistance or speed, so we focus only on objects that have changed distances. Please note however that the pedestrian might walk towards fixed objects in which case the pedestrian should be alerted.
  • Further, if the pedestrian moves the camera and some pixels register static objects to have moved towards the pedestrian, approximately the same number of pixels will register that static objects have moved away from the pedestrian.
  • Approaching objects (or objects that the pedestrian approaches) will occupy more of the screen and therefore cause more pixels to register relative movement towards the pedestrian, reducing the threatDistance and therefore increasing the possibility of threat detection.
  • By contrast, objects moving to the side will occupy less of the screen and therefore cause more pixels to register movement away from the pedestrian, reducing the possibility of false alarms.
The reader may observe the constants used in Algorithms 2 and 3. We derived those constants empirically in the 60 experiments of our training set, where we adjusted parameters to obtain zero false negatives (no alarm when there should be one) while minimizing false positives. This includes the use of the horizontal center 10/12 of the screen, the half of the depth values, and the notion of focusing on pixels that show movement. These constants may be adjusted when using different devices. Having set these parameters, the empirical results we report are on the remaining experiments.
Algorithm 1 Main Routine: Process middle depth data from LiDAR frame. Look at the close points that are moving. Based on default thresholds, if the object is approaching faster than 2.2 m per second and the time to impact is less than 3 s, then an alert is sounded. The user has control over these thresholds.
1:
Obtain frame dimensions of the mobile device: width, height.
2:
depthValuesExtractDepth()▹ Extract depth values from the middle frame region
3:
(threatDistance, speed) ← FindThreatDistanceMoving(depthValues)▹ Calculate current threat distance and speed of moving points
4:
if speed  < 2.2 m/s AND timeToImpact < 3 s then
5:
   alert pedestrian (on phone, red writing on screen or sound alert; on cane, buzz the hand)
6:
end if
Algorithm 2 Subroutine: ExtractDepth. The most important screen grid points points are in the screen center because those points indicate objects that potentially approach the pedestrian. In our training experiments, objects not in the center of the screen were not a threat because they would go off to the side.
1:
Calculate bounds for the middle section of the depth data: s t a r t X = w i d t h 12 , e n d X = 11 · w i d t h 12 , s t a r t Y = h e i g h t 3 , e n d Y = 2 · h e i g h t 3 .
2:
Extract depth values within the middle section:
3:
for  y = s t a r t Y   to  e n d Y   do
4:
       for  x = s t a r t X  to  e n d X  do
5:
             append d e p t h D a t a [ y · w i d t h + x ] to depthValues
6:
       end for
7:
end for
8:
return  depthValues
Algorithm 3 Subroutine: FindThreatDistanceMove. Determine the distance of the close points in the center of the screen that have moved as well as their average net movement.
1:
d median value of the depth values
2:
Retain values d and that have moved (either towards pedestrian or away) by at least 0.2 m compared to the previous frame. Call these m o v i n g C l o s e P o i n t s and let c h a n g e be the sum of the differences in distance of these points
3:
t h r e a t D i s t a n c e m o v i n g C l o s e P o i n t s | m o v i n g C l o s e P o i n t s |         ▹ average distance of moving points
4:
d i f f e r e n c e c h a n g e | m o v i n g C l o s e P o i n t s |
5:
s p e e d d i f f e r e n c e / 0.5            ▹ assuming frames are processed every 0.5 s
6:
return  threatDistance, speed

4. HapticHandle: An Inexpensive Cane Handle for Visually Impared Pedestrians

While ImpactAlert currently works by causing a phone to vibrate or to make a sound, an alternative deployment for the visually impaired is a smart cane handle that will vibrate when the phone-embedded software detects danger. We describe the design and construction of such a cane handle, though our experiments do not use it. Our goal in this brief section is to suggest an inexpensive path forward to cane designers.
The custom-designed handle houses the electronics needed for this functionality. The handle is designed to fit securely onto the top of a standard walking cane. To create the handle, we first modeled the handle using AutoCad 2023 ensuring that it could accommodate the required electronics. Once finalized, we printed the model using Polylactic Acid (PLA) material, because of its durability and lightweight properties.
We placed an Adafruit microcontroller board inside the 3D-printed handle. This board is responsible for managing the inputs from the phone and controlling the haptic feedback and audio warnings that alert the pedestrian. The board was carefully fitted to avoid any movement during cane usage as shown in Figure 1. The total cost of the cane handle system falls between $30–40 U.S. in 2024.

5. Threat Types

Part of the inspiration for this work is that the rise of electric bicycles and scooters have led to pedestrians being hit at injury-causing speeds on sidewalks and streets. For this reason, we divide our experiments into threats from motorcycles, bicycles, pedestrians, as well as collisions with static objects. To avoid the delay and bureaucratic overhead of Institutional Review Board review, we have performed the video experiments ourselves by walking on city streets with our phone device.

5.1. Scooters/Motorcycles

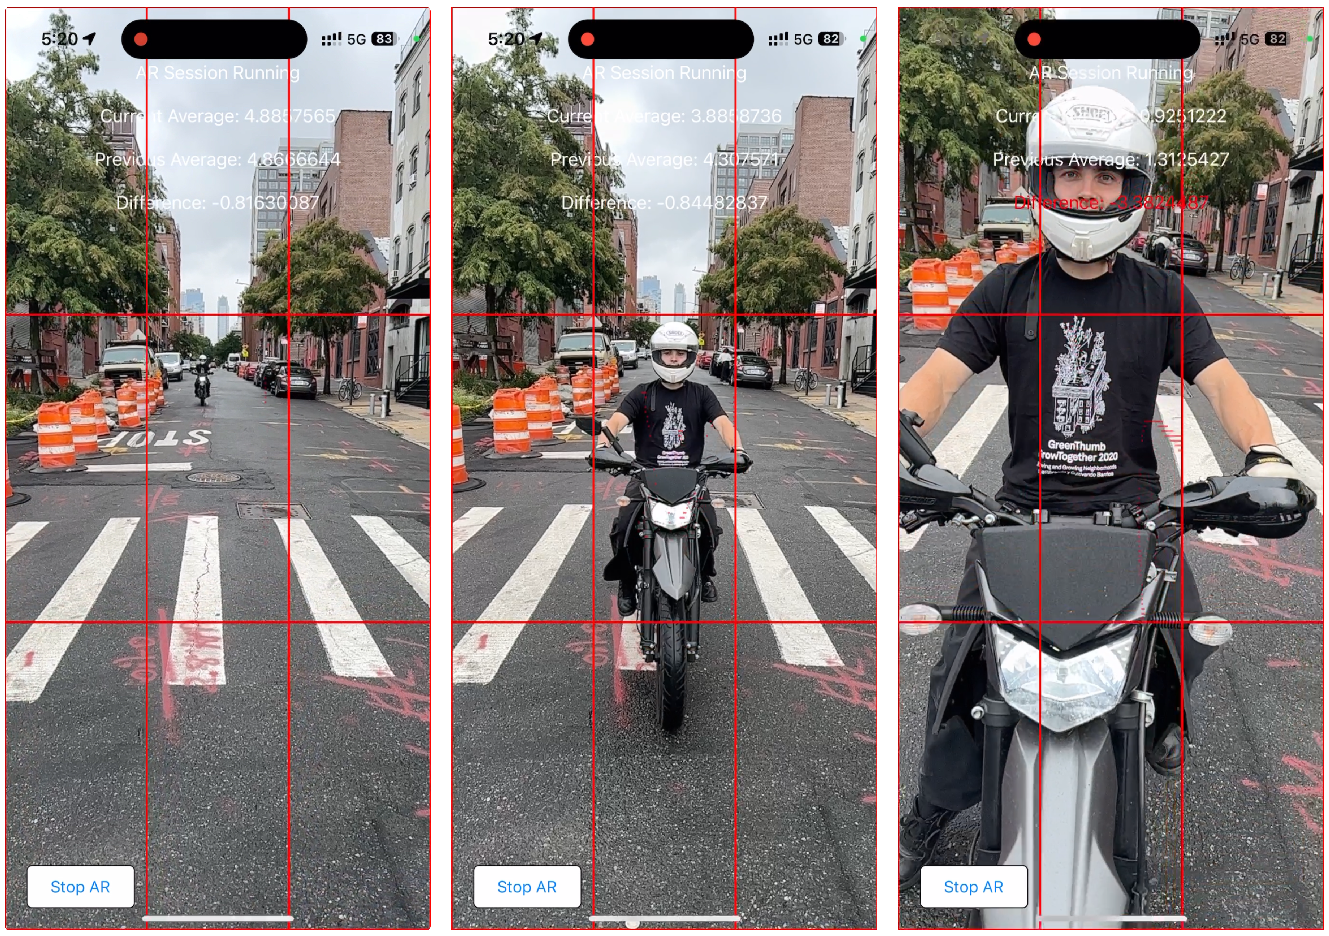
Scooters (which we treat interchangeably with motorcycles and trikes) move rapidly so the alert may occur when the scooter is several meters away (the middle frame of Figure 2).

5.2. Bicycle

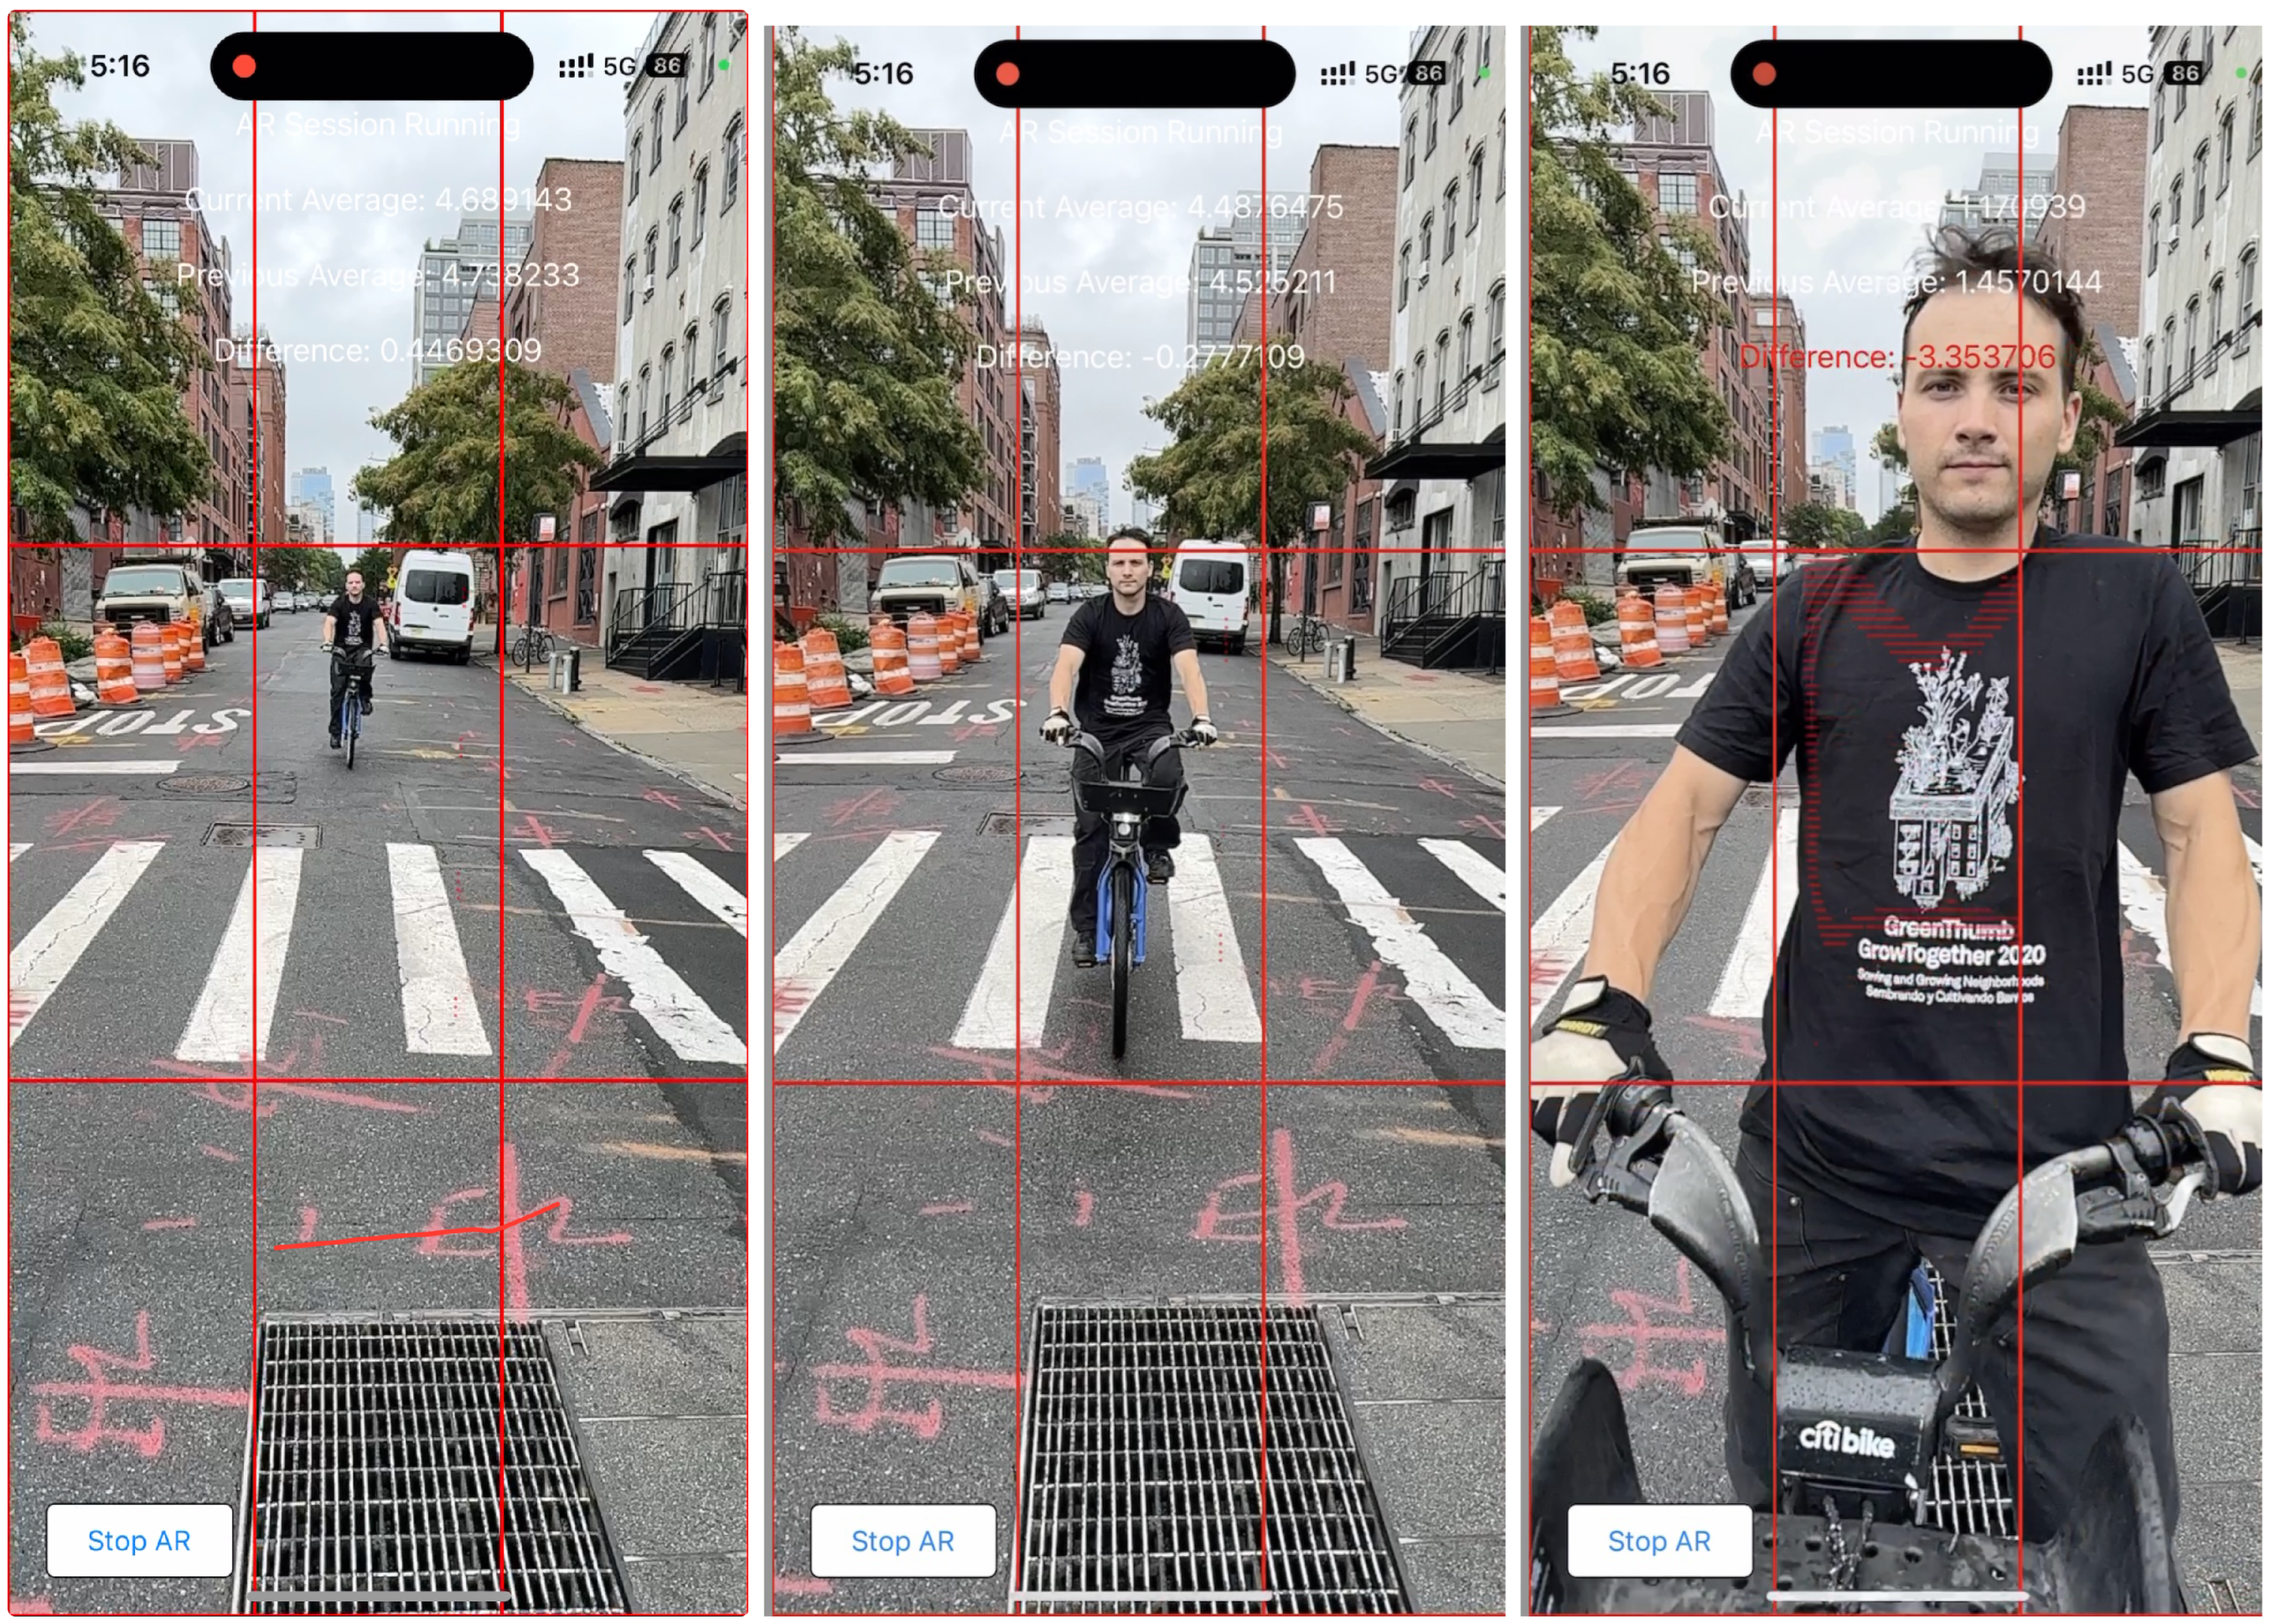
Bicycle threats are common on city sidewalks. Electric bikes are particularly dangerous because they make so little noise. When they move slowly, they will reach the time to impact threshold when they are quite close as shown in Figure 3.

5.3. Static Threats

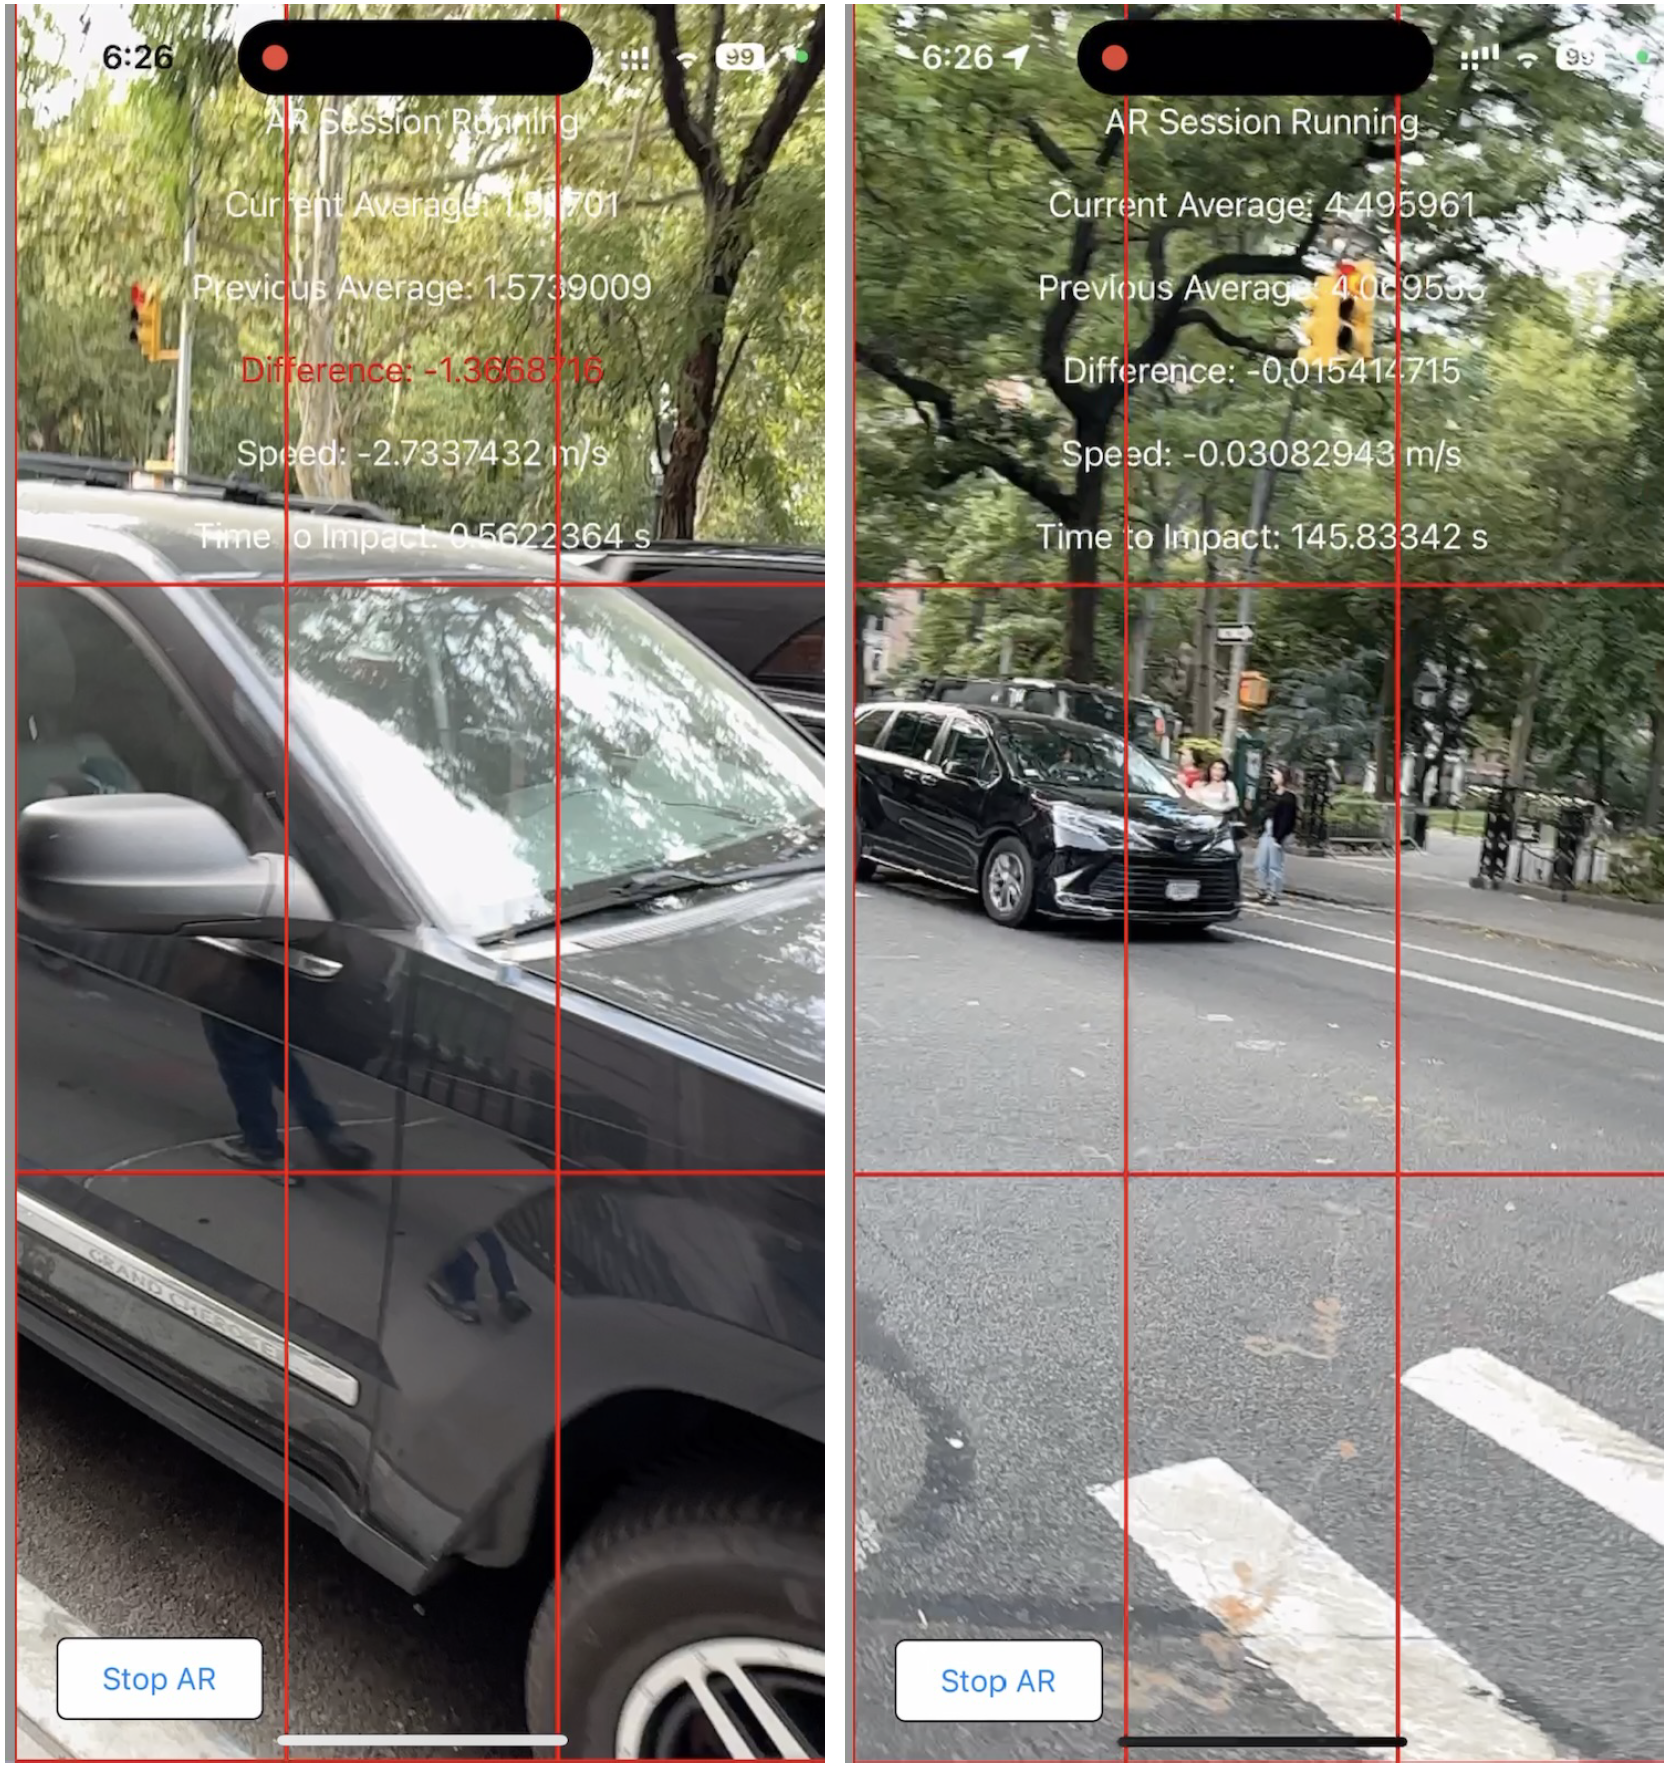
Though the primary use case of ImpactAlert is vehicles hitting a pedestrian, a fast-moving pedestrian could also cause injury to themselves by hitting a static object. The same thresholds of Time to Impact and Speed (in this case of the pedestrian) apply here as illustrated in Figure 4.

5.4. Pedestrian to Pedestrian Collisions

Just as for static threats, Time to Impact and speed thresholds also apply to Pedestrian to Pedestrian threats as illustrated in Figure 5.

6. Experimental Results

For every moving object, we want to alert the pedestrian only when the object is approaching the pedestrian fast and has a short Time to Impact. This leads to a set of confusion matrices dividing interactions into True Positives (the alarm occurs when it should), True Negatives (the alarm does not occur when it shouldn’t), and False Positives (the alarm occurs when it shouldn’t) and False Negatives (the alarm does not occur when it should). False Negatives are particularly bad, because they indicate a failure to alert the pedestrian when there is real danger. False Positives, while not posing a danger, might potentially lead the pedestrian to ignore the device’s alarm, as in the Aesop Fable The Boy Who Cried Wolf.

6.1. Precision, Recall, and F1-Score

From the values of True Positives (TP), True Negatives (TN), False Positives (FP), and False Negatives (FN), we derive precision, recall, and F1-score, according to the usual definitions [19]:
  • Precision:
    Precision = T P T P + F P
  • Recall:
    Recall = T P T P + F N
  • F1 Score:
    F 1 = 2 × Precision × Recall Precision + Recall

6.2. Vehicle-Based Confusion Matrix

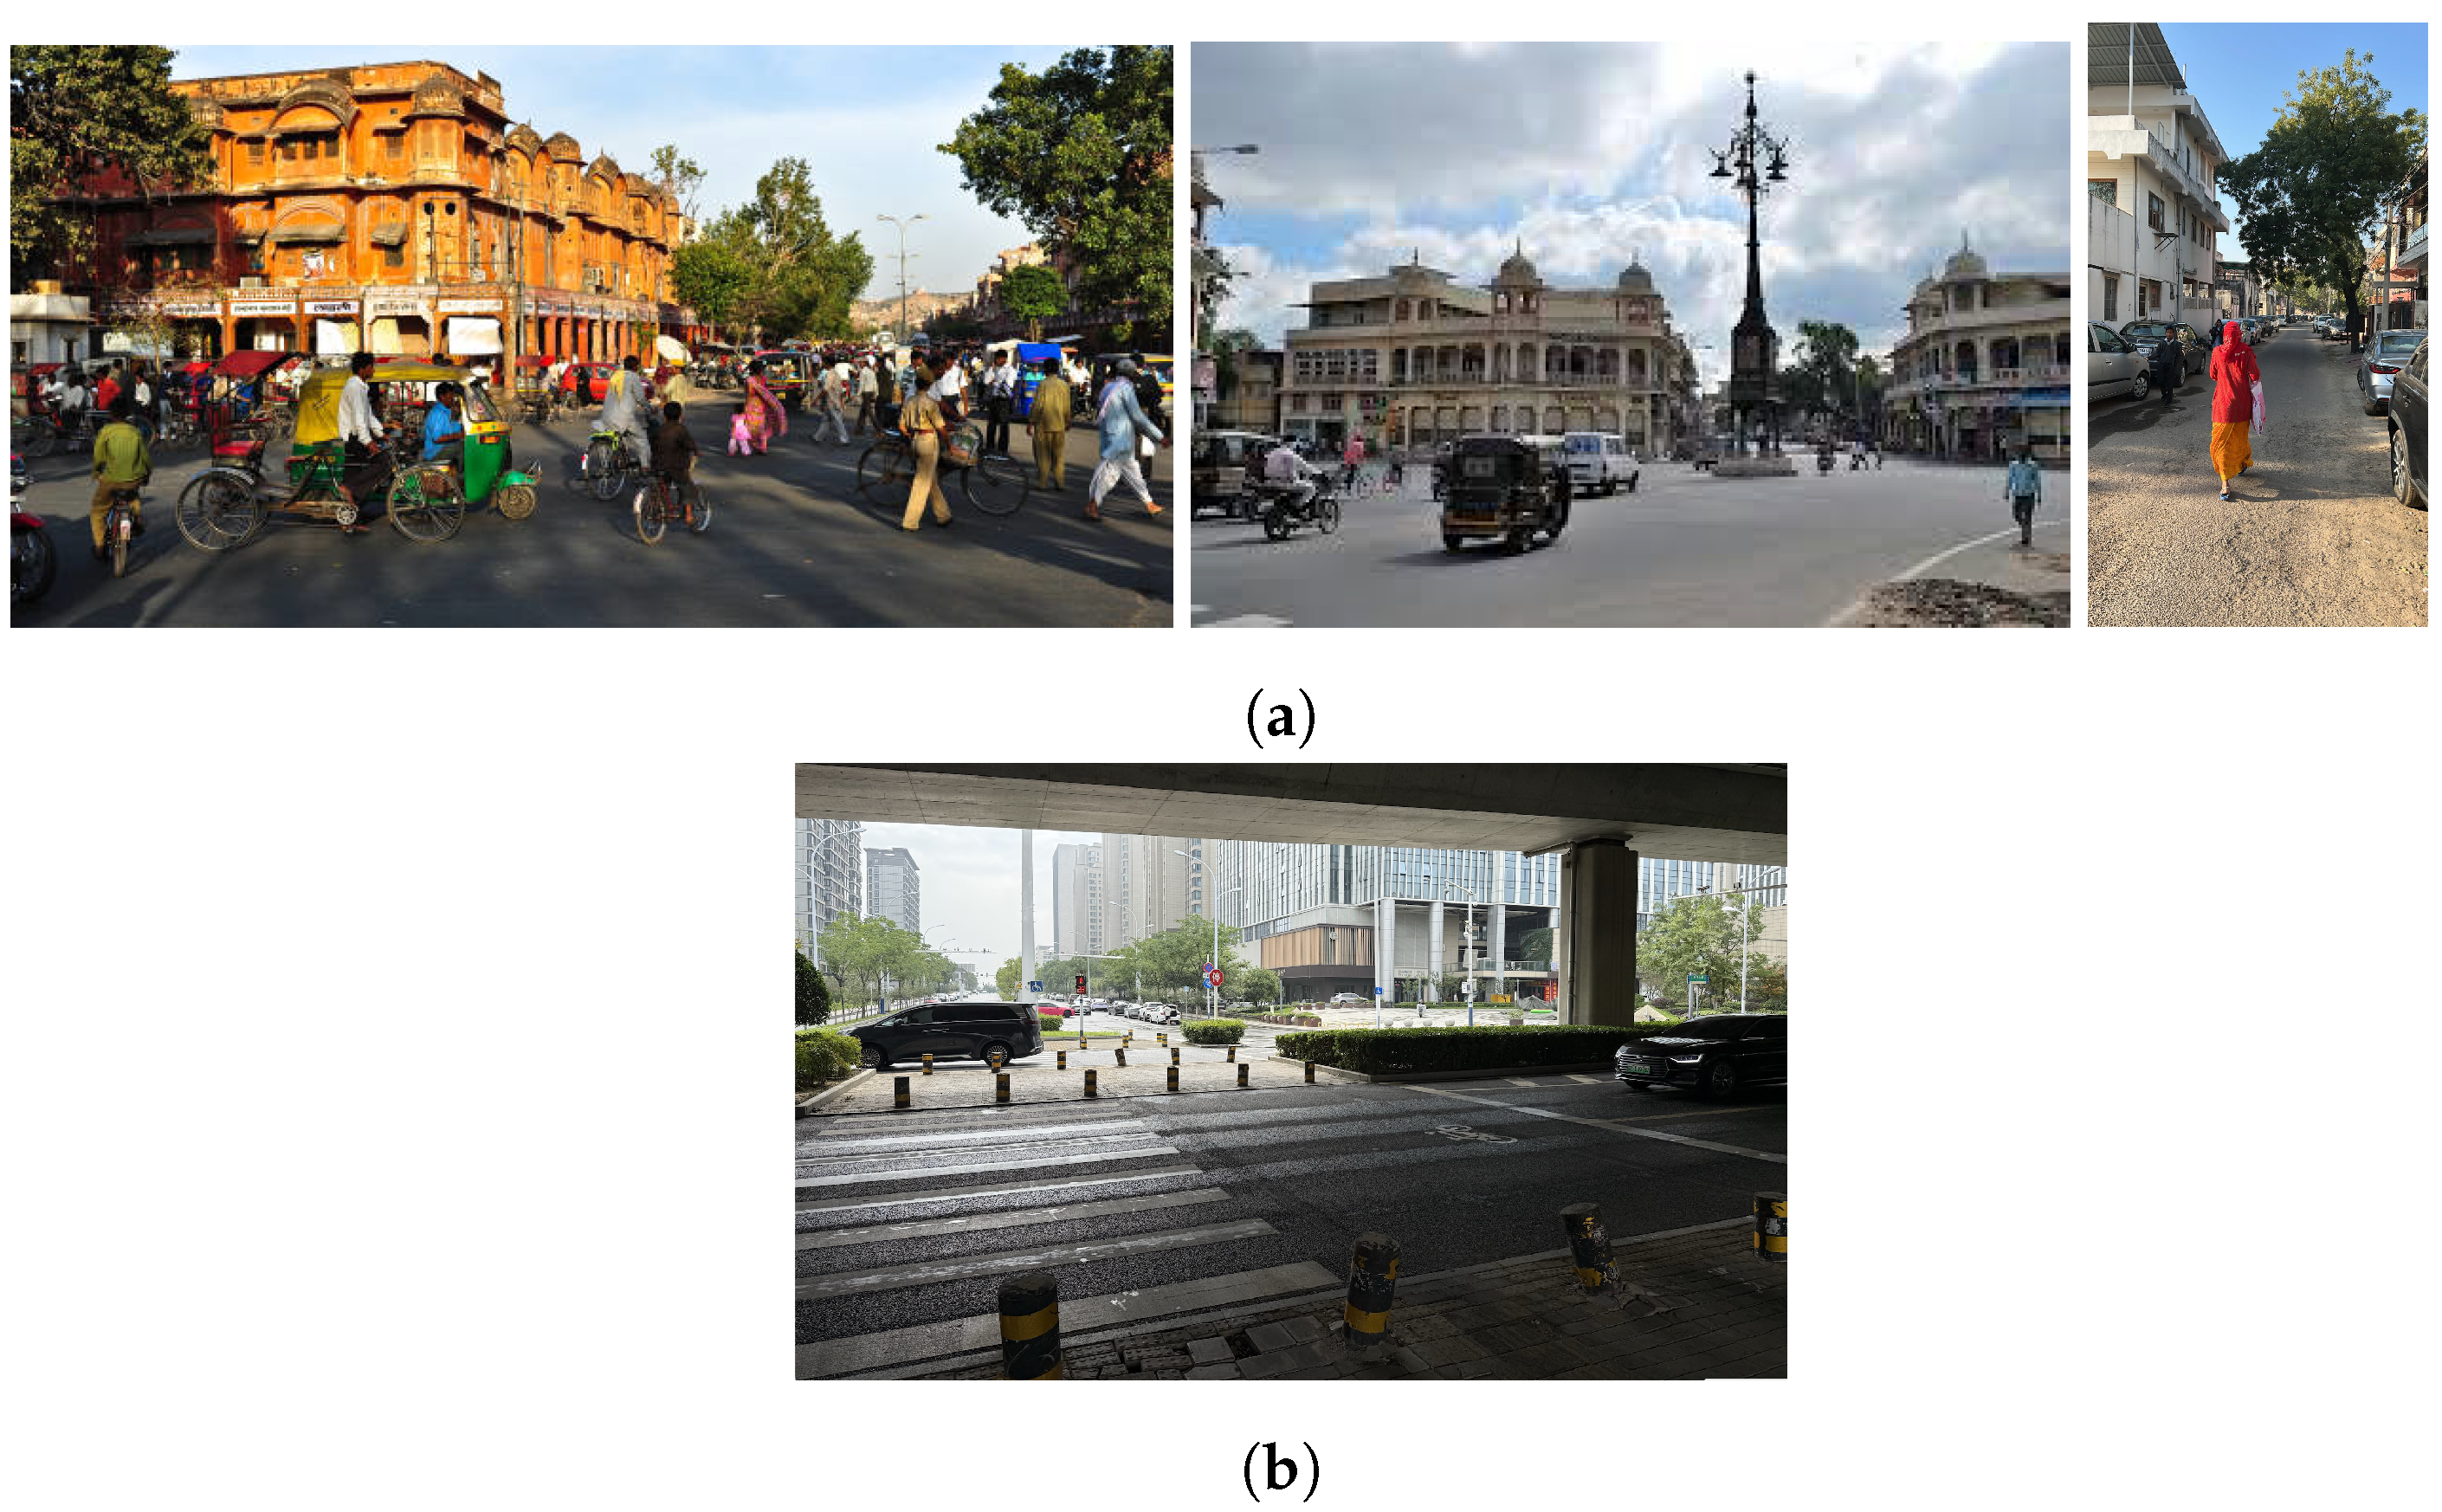
Our raw data comes from several videos showing different vehicles as well as pedestrians in different cities: Manhattan (New York City, United States), Brooklyn (New York City, United States), Jaipur India (please see Figure 6a), and Hefei China (please see Figure 6b).
The reader will find the videos of our experiments in the ImpactAlert urban setting video archive https://drive.google.com/drive/folders/18Z7METb5hzrKMy2FHidKbXn69YqB2So3?usp=sharing (last accessed on 1 August 2025).
We first present the True Positives, True Negatives, False Positives, and False Negatives for each vehicle type (Table 1), assuming a threshold of −2.2 m/s and a 3 s time to impact.

6.3. Quality Evaluations for Different Thresholds

As can be seen in Table 1, at the default threshold values, less than 8% of the alarms (positives) are false positives and there are only two false negatives. False Negatives are potentially dangerous because they correspond to situations in which an alarm does not go off when it should. Fortunately, at least in these experiments and as shown in Appendix A, within 0.2 s of a False Negative, there was a True Positive and therefore an alarm. So, the pedestrian would have been alerted in time.
The summary confusion matrix of Table 2 reflects this as well. The bolded values are from the default thresholds of −2.2 m/s speed and 3 s time to impact. Other rows show either variations in the Time to Impact threshold or the Speed Threshold. Table 2 shows, unsurprisingly, that less negative thresholds and greater Time to Impact thresholds leads to more false negatives, though not so many more. Conversely, when the thresholds allow lower speeds to set off an alarm, there are fewer false negatives but more false positives.

7. Sensitivity Slider

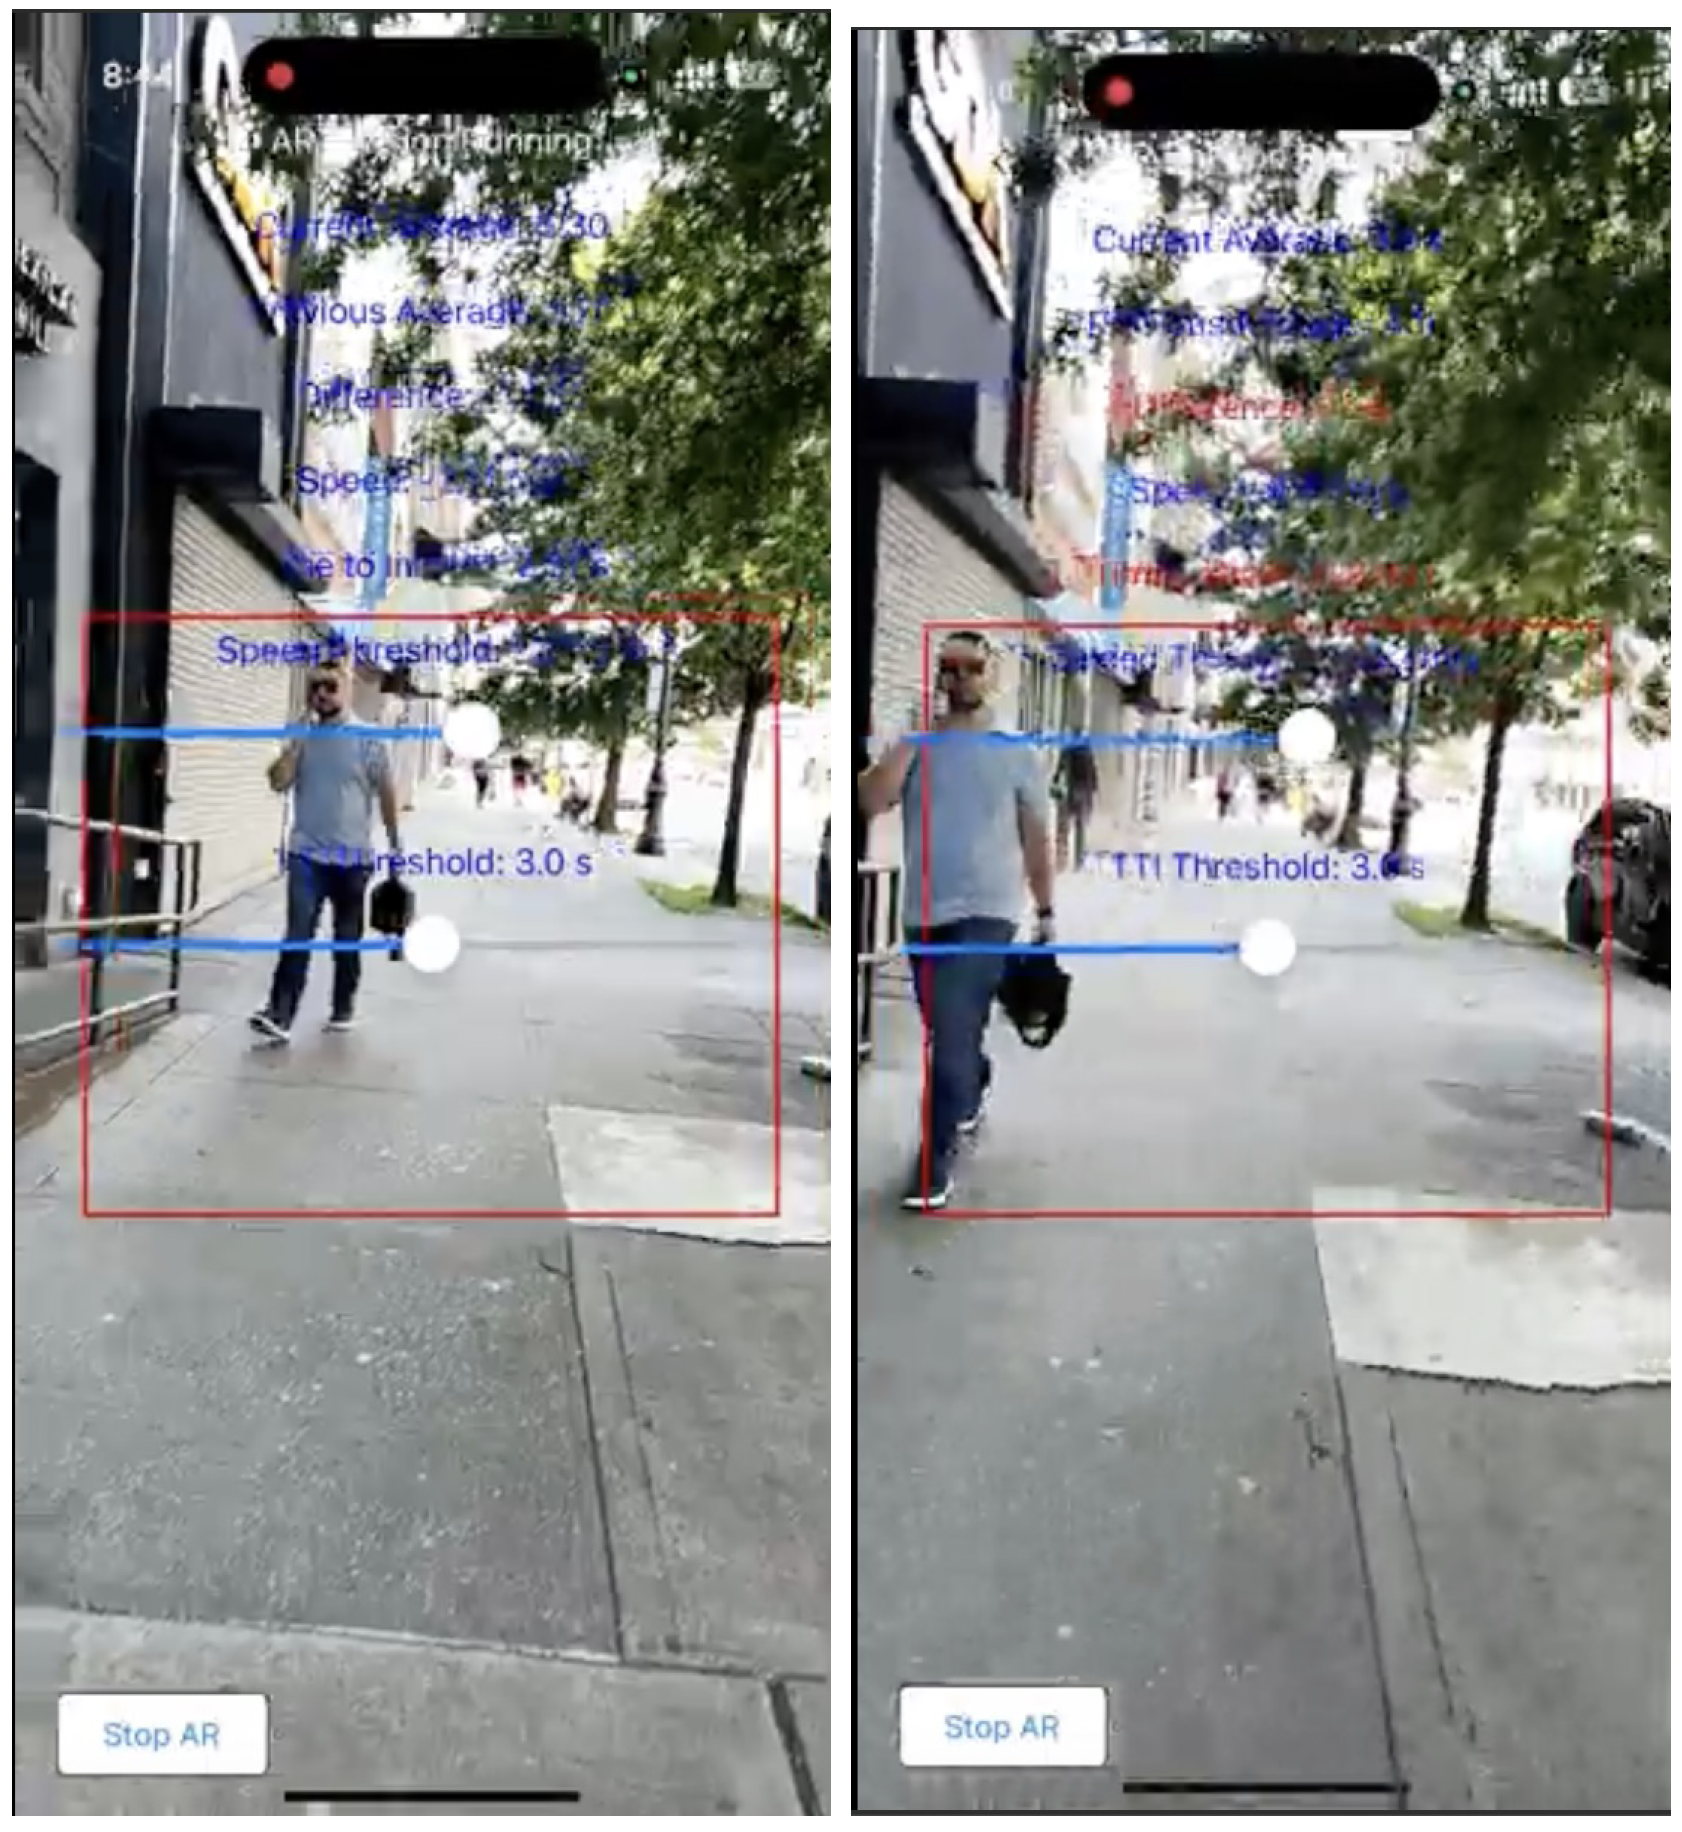
ImpactAlert provides a slider (see Figure 7) that allows users (or their helpers in the case of infirm users) to configure their alert threshold preferences (Time to Impact and Speed) based on their unique needs and circumstances. This flexibility allows ImpactAlert to adapt to a diverse range of users, such as the fragile individuals or those with slower reaction times. As Table 2 shows, even extending the Time To Impact to 5 s and making the Speed threshold −1.0 m/s does not radically increase the number of false positives.

8. Limitations

LiDAR, while powerful, doesn’t work well when there is fog or rain. Radar does work through inclement weather, but its spatial resolution becomes poor. A detection system with good spatial resolution that could see through fog would be ideal.
While we have tested our application in many settings (urban, suburban, United States, India, and China), more testing would of course be needed before serious deployment. Fortunately, it’s easy to gather data, so a commercial entity that wanted more data could acquire it easily.

9. Future Work

While the primary use case of ImpactAlert is to enhance safety for individuals with visual impairments, ImpactAlert also offers substantial benefits for sighted pedestrians. For instance, it can be used to detect threats coming from the pedestrian’s back, because each of several LiDAR instruments could alert a pedestrian of danger. Further, besides alerting the pedestrian, it could be useful to alert the vehicle driver of the presence of the pedestrian for example by setting off blinking lights to make the pedestrian more visible.
Another avenue for future development is to embed LiDAR technology into clothing. This holds the promise of promoting safety and awareness for individuals in various environments. Clothing equipped with LiDAR sensors could provide real-time feedback about the wearer’s surroundings, alerting them to nearby obstacles as well as approaching vehicles. This feature would be beneficial for individuals who are visually impaired but also for those participating in activities such as cycling or hiking, where awareness of surroundings is crucial.
Thus, the main future work regarding the device is expanding the set of platforms, incorporating multiple sensors, and specializing the parameters to various sensor platforms. The main future work regarding deployment is extensive user testing, particularly with vision-impaired pedestrians.

10. Conclusions

The ImpactAlert system is a software system making use of LiDAR sensors to detect moving objects, such as vehicles, that approach a pedestrian user. ImpactAlert provides timely warnings through vibrations in a smart cane or sounds if those objects are moving rapidly towards that user with a small time to impact. By incorporating technology commonly found in modern smartphones, ImpactAlert offers an accessible and practical solution for pedestrians in a variety of environments.
As LiDAR and related technologies become more widespread and affordable, the availability of such smart devices will increase, making them a viable option for a broader population both sighted and visually impaired.

Author Contributions

Conceptualization: R.R., C.L. and D.S.; Formal Analysis: R.R., C.L. and D.S.; Methodology: R.R., C.L. and D.S.; Software: R.R., C.L., H.Y. and D.S.; Supervision: D.S.; Validation: R.R., H.Y. and D.S.; Visualization: R.R., H.Y. and D.S.; Writing—Original Draft Preparation: R.R., C.L. and D.S.; Writing—Review and Editing: R.R., H.Y. and D.S. All authors have read and agreed to the published version of the manuscript.

Funding

This work was partially supported by NYU Wireless.

Data Availability Statement

The data can be found in the video repository (accessed on 1 August 2025). https://drive.google.com/drive/folders/18Z7METb5hzrKMy2FHidKbXn69YqB2So3.

Conflicts of Interest

The authors declare no conflicts of interest.The funders had no role in the design of the study; in the collection, analyses, or interpretation of data; in the writing of the manuscript; or in the decision to publish the results.

Appendix A. Raw Data Results

The tables below identify the video in question, the time in the video when the evaluation was done, the speed and time to impact as measured by our algorithm and whether there is a collision danger.
For pedestrians we measure the possibility of frontal collision as a collision danger.
For vehicles, the scoring is a bit more complicated. Because we took measurements from the safety of sidewalks or between parked cars, there was never any actual danger of collision. However, we adopted a “swerve danger” scoring system in which a collision was deemed possible if the vehicle could swerve to hit the experimenter. If so, then for vehicles, this results in a “Yes” score. Thus, we were somewhat overly alarmist in our scoring of collisions for vehicles because vehicles don’t in fact swerve very often.
We present the raw output of this analysis in Table A1.
Table A1. Speed and Time to Impact at various time points in various videos. Note that a Time to Impact of 9999 means that the potential threat is moving away. The lines that are highlighted in blue indicate false negatives, but in both cases those false negatives have either an alarm 0.2 s before or after or both.
Walking10:03:50−0.77 m/s5.48 sNo
Walking10:04:10−0.63 m/s6.33 sNo
Walking10:04:30−2.50 m/s1.75 sYes
Walking10:04:50−3.63 m/s1.12 sYes
Walking10:05:10−4.28 m/s0.91 sYes
Walking10:05:30−6.34 m/s0.58 sYes
Walking10:05:50−7.05 m/s0.47 sYes
Walking20:03:00−0.27 m/s21.38 sNo
Walking20:03:20−7.73 m/s0.73 sYes
Walking20:03:40−7.77 m/s0.62 sYes
Walking20:04:00−8.78 m/s0.52 sYes
Walking20:04:20−10.40 m/s0.39 sYes
Walking20:04:40−8.80 m/s0.41 sYes
Walking20:05:00−8.10 m/s0.37 sYes
Walking30:04:30−2.70 m/s1.64 sYes
Walking30:04:50−1.63 m/s2.59 sNo
Walking30:05:10−3.17 m/s1.04 sYes
Walking30:05:30−2.35 m/s1.46 sYes
Walking30:05:500.35 m/s9999.00 sNo
Walking30:06:100.14 m/s9999.00 sNo
Walking30:06:30−0.24 m/s22.47 sNo
Walking30:06:50−0.37 m/s1391.66 sNo
Walking30:16:55−6.08 m/s1.26 sYes
Walking30:17:15−3.18 m/s1.24 sYes
Walking30:17:35−2.99 m/s1.61 sYes
Walking30:17:55−4.23 m/s0.82 sYes
Walking40:05:00−2.11 m/s2.51 sNo
Walking40:05:20−2.45 m/s1.46 sNo
Walking40:06:00−4.09 m/s1.02 sNo
Walking40:06:20−0.20 m/s4.40 sNo
Walking50:02:20−6.76 m/s0.44 sYes
Walking50:03:10−4.13 m/s0.69 sYes
Walking60:04:30−5.67 m/s0.45 sYes
Walking60:04:50−9.66 m/s0.23 sYes
Walking60:05:10−11.32 m/s0.17 sYes
Walking60:05:30−10.38 m/s0.16 sYes
Walking70:17:40−2.69 m/s1.99 sYes
Walking70:18:00−3.31 m/s1.39 sYes
Walking70:18:20−7.09 m/s0.69 sYes
Walking70:18:40−2.09 m/s1.76 sYes (False Negative)
Walking70:19:00−4.44 m/s0.73 sYes
Walking80:05:00−3.39 m/s1.72 sYes
Walking80:05:20−3.73 m/s1.71 sYes
Walking80:05:40−0.14 m/s9999.00 sNo
Car10:01:15−1.67 m/s4.52 sNo
Car10:01:35−5.08 m/s1.58 sYes
Car10:01:55−6.02 m/s1.18 sYes
Car10:02:15−7.18 m/s0.94 sYes
Car10:02:35−10.58 m/s0.59 sYes
Car10:02:55−8.93 m/s0.7 sYes
Car10:03:15−0.11 m/s12.7 sNo
Car20:01:30−2.30 m/s4.18 sNo
Car20:01:50−3.78 m/s2.82 sYes
Car20:02:10−6.04 m/s1.56 sYes
Car20:02:30−7.54 m/s1.07 sYes
Car20:02:50−8.23 m/s0.36 sYes
Car20:03:10−4.05 m/s1.76 sYes
Car20:03:30−6.16 m/s1.18 sYes
Car20:03:50−0.08 m/s116.03 sNo
Car30:00:45−3.92 m/s9999.00 sNo
Car30:01:054.33 m/s9999.00 sNo
Car30:01:253.37 m/s9999.00 sNo
Car30:01:45−0.95 m/s8.92 sNo
Bus10:16:40−0.68 m/s24.91 sNo
Bus10:17:00−0.62 m/s21.24 sNo
Bus10:17:20−4.12 m/s3.44 sNo
Bus10:17:40−6.35 m/s1.57 sYes
Bus10:18:00−10.90 m/s0.76 sYes
Bus10:18:20−12.26 m/s0.62 sYes
Bus10:18:40−11.96 m/s0.70 sYes
Bus10:19:00−7.24 m/s1.40 sYes
Bus20:05:25−1.54 m/s7.62 sNo
Bus20:05:45−2.92 m/s3.71 sNo
Bus20:06:05−3.61 m/s3.00 sNo
Bus20:06:35−3.20 m/s3.57 sNo
Bus20:06:55−3.05 m/s3.54 sNo
Scooter10:00:22−4.50 m/s2.73 sYes
Scooter10:00:42−0.90 m/s11.81 sYes (False Neagtive)
Scooter10:01:05−0.53 m/s21.63 sNo
Scooter20:00:35−3.5 m/s1.03 sYes
Scooter20:00:55−4.86 m/s1.03 sNo
Scooter30:04:50−0.25 m/s45.90 sNo
Scooter30:05:10−6.03 m/s2.37 sYes
Scooter30:05:30−8.75 m/s1.39 sYes
Scooter30:05:50−7.97 m/s1.09 sYes

References

  1. Vision Australia, Guide Dogs Victoria and Blind Citizens Australia. New Report Reveals 1 in 12 Pedestrians Being Hit by Motor Vehicles and Cyclists. 2019. Available online: https://visionaustralia.org/news/2019-08-23/new-report-reveals-1-12-pedestrians-being-hit-motor-vehicles-and-cyclists (accessed on 5 March 2023).
  2. Prabhath, P.; Olvera-Herrera, V.O.; Chan, V.F.; Clarke, M.; Wright, D.M.; MacKenzie, G.; Virgili, G.; Congdon, N. Vision impairment and traffic safety outcomes in low-income and middle-income countries: A systematic review and meta-analysis. Lancet Glob. Health 2021, 9, e1411–e1422. [Google Scholar]
  3. Roberts, I.; Norton, R. Sensory deficit and the risk of pedestrian injury. Inj. Prev. 1995, 1, 12–14. [Google Scholar] [CrossRef] [PubMed]
  4. Navarro, P.J.; Fernández, C.; Borraz, R.; Alonso, D. A Machine Learning Approach to Pedestrian Detection for Autonomous Vehicles Using High-Definition 3D Range Data. Sensors 2017, 17, 18. [Google Scholar] [CrossRef] [PubMed]
  5. Traffic Safety Store. Collision Sentry Overview. 2021. Available online: https://www.trafficsafetywarehouse.com/collision-sentry (accessed on 5 March 2023).
  6. Li, Z.; Wang, K.; Li, L.; Wang, F.-Y. A Review on Vision-Based Pedestrian Detection for Intelligent Vehicles. In Proceedings of the 2006 IEEE International Conference on Intelligent Transportation Systems (ITSC), Toronto, ON, Canada, 17–20 September 2006; pp. 224–229. [Google Scholar] [CrossRef]
  7. Scalvini, F.; Bordeau, C.; Ambard, M.; Migniot, C.; Dubois, J. Outdoor Navigation Assistive System Based on Robust and Real-Time Visual-Auditory Substitution Approach. Sensors 2024, 24, 166. [Google Scholar] [CrossRef] [PubMed]
  8. Kim, S.; Lee, H. Real-Time Interaction Models for Vehicle and Pedestrian Safety. IEEE Trans. Intell. Transp. Syst. 2024, 8, 22–35. [Google Scholar]
  9. Hamidaoui, M.; Talhaoui, M.Z.; Li, M.; Midoun, M.A.; Haouassi, S.; Mekkaoui, D.E.; Smaili, A.; Cherraf, A.; Benyoub, F.Z. Survey of Autonomous Vehicles’ Collision Avoidance Algorithms. Sensors 2025, 25, 395. [Google Scholar] [CrossRef] [PubMed]
  10. Bolgiano, J.R. Laser Cane for the Blind. Proc. IEEE 1967, 55, 697–698. [Google Scholar] [CrossRef]
  11. Benjamin, J.M.; Ali, N.A.; Schepis, A.F. Laser Cane for the Blind. In Engineering in Biology and Medicine; Reivich, M., Ed.; University Park Press: Baltimore, MD, USA, 1973; pp. 63–70. [Google Scholar]
  12. Mai, X.; Zhang, L.; Li, Y.; Wang, H. Fusion of 2D LiDAR and RGB-D Camera for Smart Cane Navigation and Obstacle Detection. Sensors 2022, 24, 870. [Google Scholar] [CrossRef]
  13. Slade, P.; Tambe, A.; Kochenderfer, M.J. Multimodal sensing and intuitive steering assistance improve navigation and mobility for people with impaired vision. Sci. Robot. 2021, 6, eabg6594. [Google Scholar] [CrossRef] [PubMed]
  14. Moovit. Moovit and WeWALK Partner to Improve Transit Navigation for Blind and Partially Sighted. Mass Transit, 1 December 2021. Available online: https://www.masstransitmag.com/technology/article/21248474/\moovit-and-wewalk-partner-to-improve-transit-navigation-for-blind-and-partially-sighted (accessed on 5 March 2023).
  15. Lan, M.; Nahapetian, A.; Vahdatpour, A.; Au, L.; Kaiser, W.; Sarrafzadeh, M. SmartFall: An automatic fall detection system based on subsequence matching for the ImpactAlert. In Proceedings of the Fourth International Conference on Body Area Networks, Los Angeles, CA, USA, 1–3 April 2009; pp. 1–8. [Google Scholar]
  16. Gupta, A.; Patel, M.; Saini, M.; Sharma, R. A survey on assistive devices for visually impaired people. Sensors 2024, 24, 4834. [Google Scholar] [CrossRef]
  17. AI-Powered Headphones Alert Pedestrians to Incoming Cars. IEEE Spectrum. Available online: https://spectrum.ieee.org/ai-headphone-pedestrians-safety-warning-cars (accessed on 5 March 2023).
  18. Tefft, B.C. Impact Speed and a Pedestrian’s Risk of Severe Injury or Death; AAA Foundation for Traffic Safety: Washington, DC, USA, 2011. [Google Scholar]
  19. Deisenroth, M.P.; Faisal, A.A.; Ong, C.S. Mathematics for Machine Learning; Cambridge University Press: Cambridge, UK, 2020; Available online: https://mml-book.github.io/ (accessed on 5 March 2023).
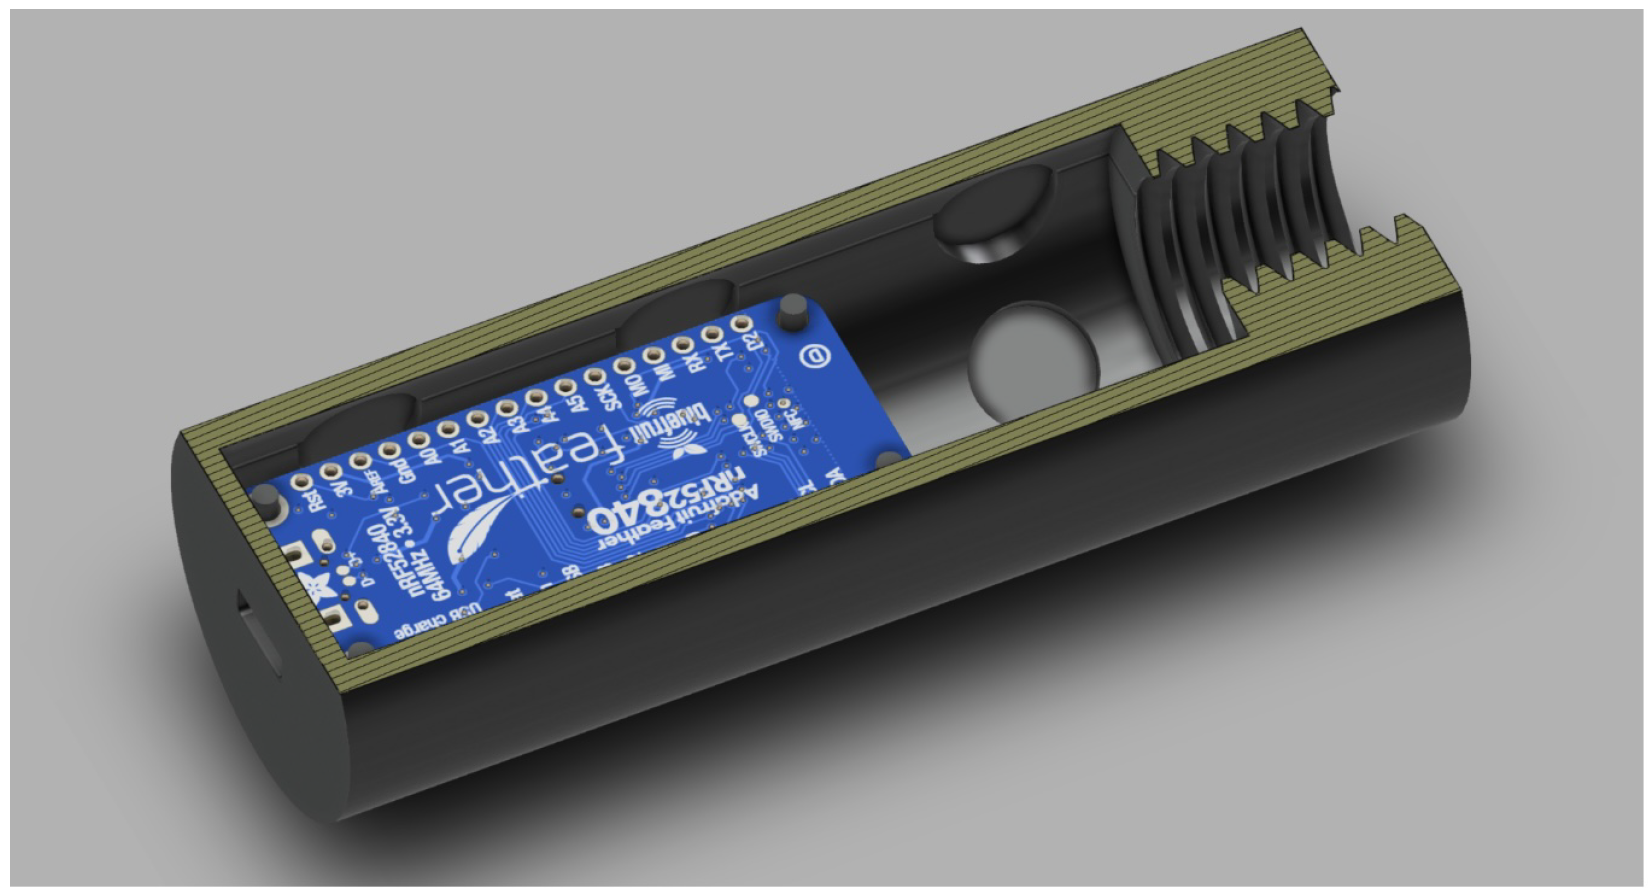
Figure 1. Cutout image of the 3D-printed smart cane handle containing an Adafruit microcontroller board and haptic actuators.
Electronics 14 03133 g001
Figure 2. Example of the approach of a motorcycle (ridden by the second author) about to impact the pedestrian. The alert sound will beep when the incoming speed is faster than the user-set threshold and the time to impact is less than the user-set threshold.
Electronics 14 03133 g002
Figure 3. Example of the approach of a bicycle. This will set off an alarm when the speed and time to impact thresholds are crossed. Because a bicycle moves slower than a scooter, the Time to Impact threshold will be reached when the bicycle is closer to the pedestrian.
Electronics 14 03133 g003
Figure 4. (Left panel) shows a static object that is close enough to set an alarm if the pedestrian moves fast enough towards the car. (Right panel) shows a static object that is far away, so poses no danger.
Electronics 14 03133 g004
Figure 5. Example of Person Approaching. Just as for static objects, the alarm will trigger only if the approach speed exceeds the threshold and the Time to Impact is low. This shows our current debugging interface. The text turns red in the second image, because the pedestrian in view might swerve to cause a collision. The writing in the image shows our debugging interface, built so we can evaluate ImpactAlert’s estimates of Time to Impact and Speed. From top to bottom, it shows current average distance, previous average distance, the difference, the speed, the TimeToImpact, the speed and Time to Impact thresholds. The interface for a pedestrian will be a sound when a collision becomes a significant danger. These two screenshots come from Walking4.mp4 in our video drive https://drive.google.com/drive/folders/18Z7METb5hzrKMy2FHidKbXn69YqB2So3 (last accessed on 1 August 2025).
Electronics 14 03133 g005
Figure 6. (a) A crowded and a quiet neighborhood in Jaipur, India. People often walk in the street. (b) A typical urban street in Hefei, China. Pedestrian, bicycle, and electric scooter lanes are separated for safety. Some streets are also located beneath elevated expressways.
Electronics 14 03133 g006
Figure 7. Sensitivity sliders for personalized alert times. It is the blue slider on the screen that enables (currently a sighted helper) to customize the alert threshold.
Electronics 14 03133 g007
Table 1. Performance metrics by vehicle type. With the threshold settings: speed < −2.2 m/s (negative speeds imply that the object is approaching the pedestrian or the pedestrian is approaching the object) and time to impact <3 s.
Vehicle
Type
True
Positives
(TP)
True
Negatives
(TN)
False
Positives
(FP)
False
Negatives
(FN)
Bus5800
Car11800
Scooter5211
Walking301121
Table 2. Quality Measures for different speed and Time to Impact (TTI) thresholds. TP means true positives (the system reports an object approaching that exceeds the threshold and there is a collision danger), FP is false positive, FN is false negative (there is a collision danger but with those thresholds, we don’t detect it), TN is true negative, followed by the derived quantities. The default thresholds and their quality values are shown in bold.
Speed
Thresh
Time To
Impact
Thresh
True
Pos
(TP)
False
Pos
(FP)
False
Neg
(FN)
True
Neg
(TN)
AccuracyPrecisionRecallF1
−5.0332021320.7531.0000.6040.753
−3.034627300.8940.9580.8680.911
−2.2125028320.6711.0000.4720.641
−2.235132290.9410.9440.9620.953
−2.255192230.8710.8500.9620.903
−1.035251270.9290.9120.9810.945
Disclaimer/Publisher’s Note: The statements, opinions and data contained in all publications are solely those of the individual author(s) and contributor(s) and not of MDPI and/or the editor(s). MDPI and/or the editor(s) disclaim responsibility for any injury to people or property resulting from any ideas, methods, instructions or products referred to in the content.