Article

Impact of Charge Carrier Trapping at the Ge/Si Interface on Charge Transport in Ge-on-Si Photodetectors

1
Beijing Smart-Chip Microelectronics Technology Company Ltd., Beijing 100192, China
2
College of Integrated Circuits, Zhejiang University, Hangzhou 311200, China
3
Innovative Institute of Electromagnetic Information and Electronic Engineering, College of Information and Electronic Engineering, Zhejiang University, Hangzhou 310027, China
*
Authors to whom correspondence should be addressed.
Electronics 2025, 14(15), 2982; https://doi.org/10.3390/electronics14152982 (registering DOI)
Submission received: 22 May 2025 / Revised: 23 July 2025 / Accepted: 24 July 2025 / Published: 26 July 2025
(This article belongs to the Section Optoelectronics)

Abstract

The performance of optoelectronic devices is affected by various noise sources. A notable factor is the 4.2% lattice mismatch at the Ge/Si interface, which significantly influences the efficiency of Ge-on-Si photodetectors. These noise sources can be analyzed by examining the impact of the Ge/Si interface and deep traps on dark and photocurrents. This study evaluates the impact of these charge traps on key photodetector performance metrics, including responsivity, photo-to-dark current ratio, noise equivalent power (NEP), and specific detectivity (D*). The trapping effects on charge transport under both forward and reverse bias conditions are monitored through hysteresis analysis. When illuminated with an unmodulated 1550 nm laser, all the key performance metrics exhibit maximum variations at a specific reverse bias. This critical bias marks the transition from saturated to exponential charge transport regimes, where intensified electric fields enhance trap-assisted recombination and thus maximize metric fluctuations.

1. Introduction

Germanium-on-silicon (Ge-on-Si) photodiodes (PDs) are crucial components in Si photonics-based applications, such as sensing, communication, and optical interconnections. These devices are highly valued due to their low cost and compatibility with complementary metal-oxide-semiconductor (CMOS) technology, making them suitable for integration into modern electronic systems [1,2,3,4,5,6,7,8,9]. Furthermore, Ge-on-Si PDs, as CMOS-compatible devices, play an essential role in photonically-enabled application-specific integrated circuits (ASICs). Leading industry players, such as Intel and IBM, have successfully fabricated monolithic photonic integration modules and products featuring Ge-on-Si PDs, demonstrating their practical applicability in cutting-edge technologies [10,11,12,13,14].
Despite their advantages, Ge-on-Si PDs face a significant challenge due to the 4.2% lattice mismatch between Ge and Si [15,16,17]. This mismatch leads to the formation of high-density misfit dislocations at the Ge/Si interface, as well as threading dislocations within the Ge epitaxial layers [18,19,20]. As a result, in the early stages of development, the silicon layer was primarily used as a substrate, while PDs were fabricated exclusively within the Ge material, avoiding the Ge/Si material interface [21]. However, advancements in Ge epitaxial technology have enabled the development of Ge-on-Si heterojunction PDs that utilize the Si layer as a substrate and contact layer. These advancements have led to extensive research and widespread use of Ge-on-Si PDs [22,23,24,25,26].
Among various Ge-on-Si heterojunction PDs, the vertical p+(Ge)-i(Ge)-n+(Si) heterojunction structure has garnered significant attention. This configuration has been extensively studied and utilized in the development of high-speed PDs, demonstrating promising performance characteristics [27,28,29,30]. However, due to the high density of misfit dislocations at the Ge/Si interface, trap-assisted tunneling at the interface (Jint) significantly elevates the generation-recombination current. Additionally, the narrower bandgap of Ge amplifies the bulk Shockley–Read–Hall (SRH) process, further increasing the SRH-dominated generation-recombination current (JSRH) in comparison with III–V PDs [31]. As a result, the dark current in a vertical p+(Ge)-i(Ge)-n+(Si) PD (44.1 mA/cm2) is significantly higher than that in commercial III–V PDs (15.2 µA/cm2) [32]. Similarly, the impact of interface effects on the dark current density has also been reported in vertical p+(Ge)-i(Ge)-n+(Si) PDs fabricated on silicon-on-insulator (SOI) substrates. To better understand the sources of dark current and identify major noise contributors, ideality factors and activation energies are employed in the analysis [33].
In Ge-on-Si PDs, trap activation is significantly influenced by the pulse rate of the applied electrical stress. Deep traps, located farther from the conduction and valence bands, contribute to recombination and dark current, degrading device performance, while shallow traps affect temporal response and efficiency. Higher pulsing rates increase the activation of deep traps, leading to reduced sensitivity and gain, whereas shallow traps introduce signal distortion and timing noise. Reverse bias alters the internal electric field, shifting trap energy levels and accelerating carriers, which can exacerbate trap-assisted recombination and dark current. The combined effects of pulsing rate and bias stress reduce device gain, linearity, and timing resolution, while increasing noise and jitter, underscoring the need for optimizing trap dynamics in Ge-on-Si PDs for high-speed, low-noise applications. Moreover, deep and surface traps in Ge-on-Si photodetectors can be purposefully utilized to improve performance in specific applications. Deep traps store charge for memory elements in neuromorphic computing, while surface traps modulate response time and sensitivity. Optimizing trap characteristics can enhance responsivity, reduce noise, and create novel architectures. However, careful engineering is required to avoid inefficiencies caused by excess traps. Applications include neuromorphic computing, high-speed imaging, and optical communication. Optimization methods involve trap engineering, surface passivation, temperature control, and tailored device geometries, supported by real-time feedback mechanisms. These affordable PDs can be integrated into silicon photonic platforms, making them ideal for applications needing high-sensitivity detectors at 1550 nm. These are adaptable for free-space sensing, LiDAR, adaptive optics, and imaging, and also meet the needs of autonomous driving and weak light detection.
This study focuses on the fabrication and characterization of a lateral Ge-on-Si PD with specific structural dimensions, namely, a multiplication width (WM) of 1 µm and an absorption width (WA) of 0.3 µm. This paper presents an experimental analysis of the effects of interface traps on charge transport within the device, while modelling of these effects has already been reported [34]. Key performance metrics such as responsivity, specific detectivity (D*), normalized photo-to-dark current ratios, and noise equivalent power (NEP) are evaluated. These metrics provide clear insights into how interface traps influence charge transport under both dark and unmodulated illumination conditions using a 1550 nm wavelength laser.
The structure of this paper is organized as follows. Section 2 describes the fabrication processes utilized in developing the devices. Section 3 provides a detailed explanation of the measurement scheme and discusses the physical mechanisms that influence the results obtained from our lateral Ge-on-Si PD. In Section 4, we present the current-voltage (I-V) characteristics of the devices under varying bias conditions and continuous 1550 nm illumination, alongside an evaluation of key performance metrics. Finally, the conclusions of our study are summarized in Section 5.

2. Experimental Details

The structure of the employed lateral Ge-on-Si PD is shown schematically in Figure 1. The device is designed using separate-absorption-charge-multiplication (SACM) configuration. This design builds upon previously developed P-I-N PDs integrated within Si photonics platforms [35]. A key advantage of this approach lies in the monolithic integration of the PD with other optoelectronic components on the platform, supporting complex chip-scale optical circuits.
A p-type charge layer with a doping concentration of 1.0 × 1018 cm−3 is implanted in the Si layer to isolate the multiplication region from the Ge-absorber, while maintaining a low electric field profile in the Ge layer to prevent breakdown. Selective epitaxy of the Ge absorber is performed on the underlying p-implanted Si charge layer in a non-overlapping configuration. The absorber receives optical input from a Si end-fire waveguide. The Ge contact is formed by boron difluoride (BF2) implantation, achieving a heavily doped p++ layer with a doping concentration of 1 × 1020 cm−3. The Si contact is fabricated via a heavily doped n++ layer, implanted prior to Ge epitaxial growth. The Si-based multiplication regions (doped at 1 × 1015 cm−3) have a width of 1 µm. The doping concentrations in the p-Si and i-Ge regions were specifically chosen to engineer a sharp drop in the electric field at their interface. This controlled field profile is essential for enhancing and isolating the charge carrier trapping effects at the Ge/Si interface—the primary focus of this study—as it creates a localized region where carrier motion is slowed and confined, enhancing their interaction with interface trap-states. In this study, the resulting trapping behaviour is then quantified in Section 4 through hysteresis analysis in charge transport measurements. The device employs a symmetrical design with bilateral metal–Si contacts, which is significant for the electric field configuration.
The electrical circuitry for measuring the current (I) through the SACM-configured PD is also shown. A Keithley 4200A-SCS Waveform Analyzer provides the AC input signal (V) and records the corresponding current through the device. Testing was performed under low-bias conditions (−2 V to 1 V) using unmodulated illumination from a 1550 nm laser at various intensities. The inset depicts the ready-for-testing packaged module, which is prepared after the device fabrication to facilitate electrical measurement.

3. Physical Mechanisms

In a PD, deep traps can increase carrier recombination rates, reducing photocurrent at higher bias voltages. Surface traps, on the other hand, can introduce additional energy levels within the bandgap, impeding carrier transport and resulting in hysteresis or shifts in the I-V curve, especially during reverse bias sweeps. The presence of these traps typically leads to non-ideal device characteristics, such as reduced efficiency and increased dark current, which can be analyzed with changes in the slope and shape of the I-V curve. To mitigate these effects, various strategies such as careful material selection, surface passivation, device structure optimization, doping density tailoring, thermal management, and electric field engineering can be implemented.
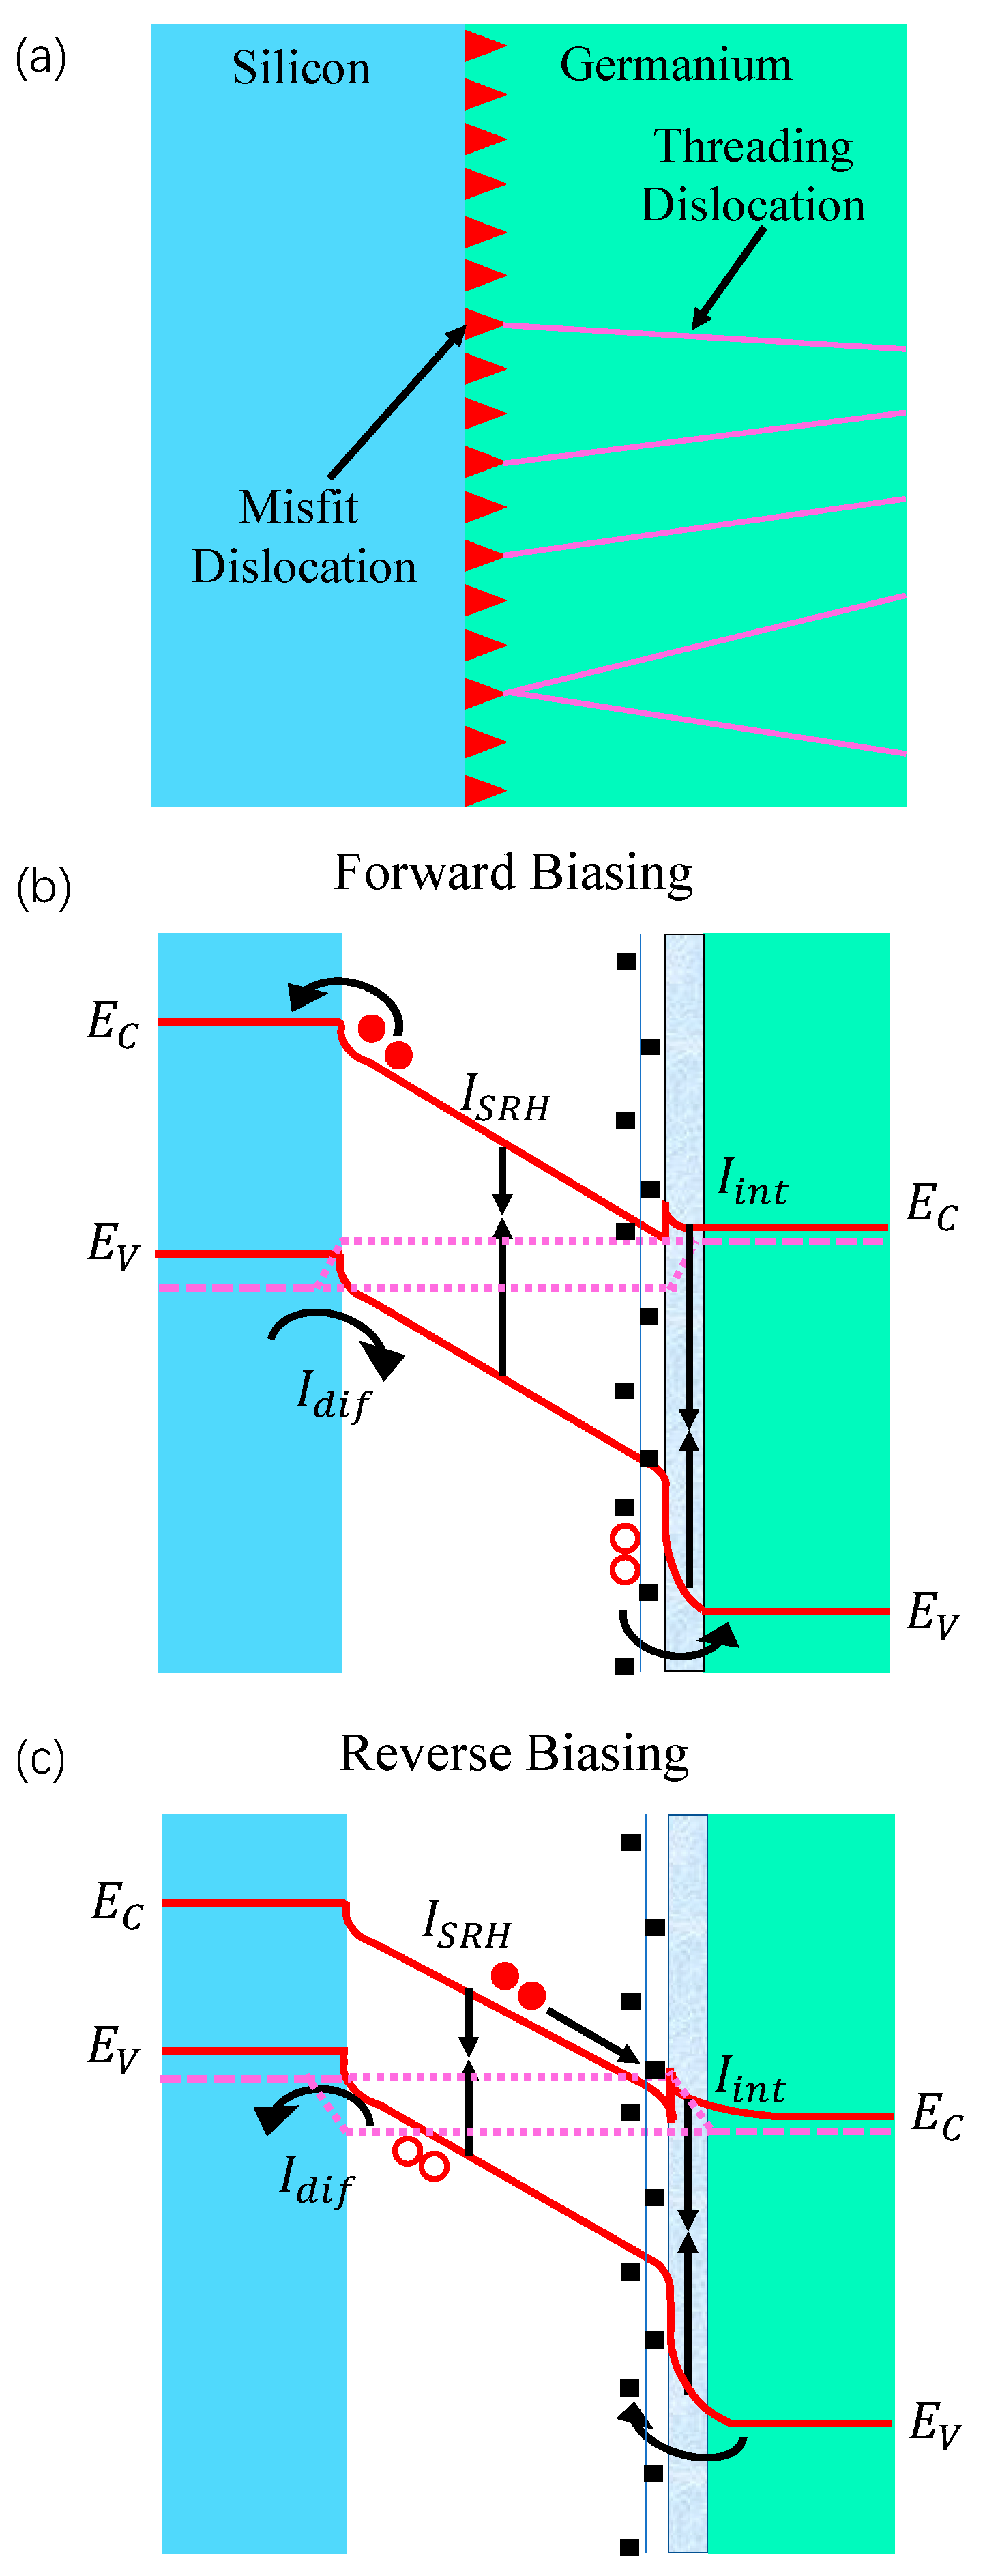
The trapping sources and sites examined in this study are generated during the fabrication of the employed lateral Ge-on-Si PD. To specifically probe the dynamic charge trapping/detrapping behaviour, our measurement protocol (detailed in Section 2) employs deliberate forward (from −2 V to 1 V) and reverse (from 1 V to −2 V) bias sweeps at multiple illumination intensities. This bidirectional voltage scanning is designed to: (i) induce hysteresis loops by altering the filling states of traps during voltage ramping; (ii) reveal trap-dependent charge transport asymmetries between increasing and decreasing electric field conditions, particularly near the critical transition bias between exponential and saturated regimes; and (iii) quantify trap influence through maximum variations in key performance metrics. The resulting hysteresis signatures directly correlate with the density and response times of interface and deep traps, as will be shown in the analysis of I-V characteristics and figures of merit under varying illumination (Section 4). The epitaxial growth of a thin Ge film on less expensive and readily available Si substrates, as exemplified in this study, is primarily motivated by the need for a cost-effective solution for the integration of Ge into electronic devices. This Ge-on-Si solution is particularly crucial for enhancing the spectral performance of Si, especially given the anticipated co-integration of additional Si-based components—such as dynamic random-access memory and non-volatile memory—on the same chips. However, a major challenge in integrating Ge with Si is the significant lattice mismatch between the two materials, compounded by discrepancies in their thermal expansion coefficients. This lattice mismatch induces substantial strain energy accumulation within the Ge layers epitaxially grown on Si, which is primarily relieved through two mechanisms: (i) the formation of interfacial lattice dislocations (misfit dislocations) and (ii) elastic deformation of both the substrate and Ge islands formed on the surface during the initial growth stages, following the Stranski–Krastanow growth mode [36]. Typically, elastic deformation alone cannot fully accommodate the induced strain, leading to the nucleation of misfit dislocations at island edges [37]. Many of these dislocations tend to bend towards the growth direction, and propagate (or thread) to the surface during the growth process as illustrated in Figure 2a. The existence of these threading dislocations substantially degrades charge transport properties by reducing carrier mobility and shortening carrier lifetime. Consequently, it is necessary to develop strategies that can more effectively align the lattice constants of Ge and Si. Graded SiGe buffer layers effectively transition lattice constants, while thermal annealing promotes dislocation glide and annihilation. Optimizing epitaxial growth processes, such as low-temperature initiation and advanced techniques like molecular beam epitaxy, further improves crystal quality. Techniques like aspect ratio trapping confine dislocations within patterned trenches, and defect etching with passivation reduces active recombination centers. Multi-step growth processes and strain relaxation layers minimize defect propagation, while hydrogenation passivates threading-dislocation-related dangling bonds. Moreover, high-Ge-content virtual substrates or thick relaxed Ge buffers serve as pseudo-substrates, reducing threading dislocations density in the active layer. Combining these approaches can enhance PD performance while balancing application requirements and fabrication constraints [38,39,40,41,42,43,44,45,46,47].
For a specific APD, the total current (I) flowing through it comprises the dark current (Idark) and the photocurrent (Ipc), so it can be expressed as I = Idark + Ipc. Here, Ipc is attributed to photogenerated carriers, while Idark is the cumulative result of six primary current components [33]: (i) diffusion current (Idif), (ii) generation-recombination current governed by SRH (ISRH), involving recombination within the bulk semiconductor, (iii) generation-recombination current enhanced by trap-assisted tunnelling at the Ge/Si layer interface (Iint), (iv) band-to-band tunnelling current (Ibtb), (v) avalanche multiplication current (Iava), occurring under high electric fields, and (vi) parasitic shunt resistance current (Ishunt).
It is important to note that Ibtb and Iava are generated at electric fields >3 × 10⁵ V/cm, which corresponds to a working voltage exceeding −21 V for the studied devices. Meanwhile, Ishunt is defined as Ishunt = V/Rs, where the shunt resistance (Rs) is typically around 1011 Ω, rendering Ishunt negligible in this context [48]. Consequently, the dominant dark current components are Idif, ISRH, and Iint, as illustrated in Figure 2b,c. The principle of dissipative transition energy conservation further suggests that the electron capture rate into neutral electron traps increases for trap energy levels closer to the conduction band edge. Similarly, the hole capture rate into neutral hole traps is expected to be higher for trap energy levels closer to the valence band edge [49].

4. Results and Discussion

Threading dislocations and Ge/Si interface traps degrade the performance of Ge-on-Si PDs by impairing carrier generation, transport, and collection. Threading dislocations act as non-radiative recombination centers, reducing carrier lifetime and generation efficiency, while Ge/Si interface traps capture carriers, facilitating SRH recombination. Both defects impede carrier transport and collection through scattering, trap-state assisted leakage, and electric field distortion, leading to reduced quantum efficiency and increased dark current.
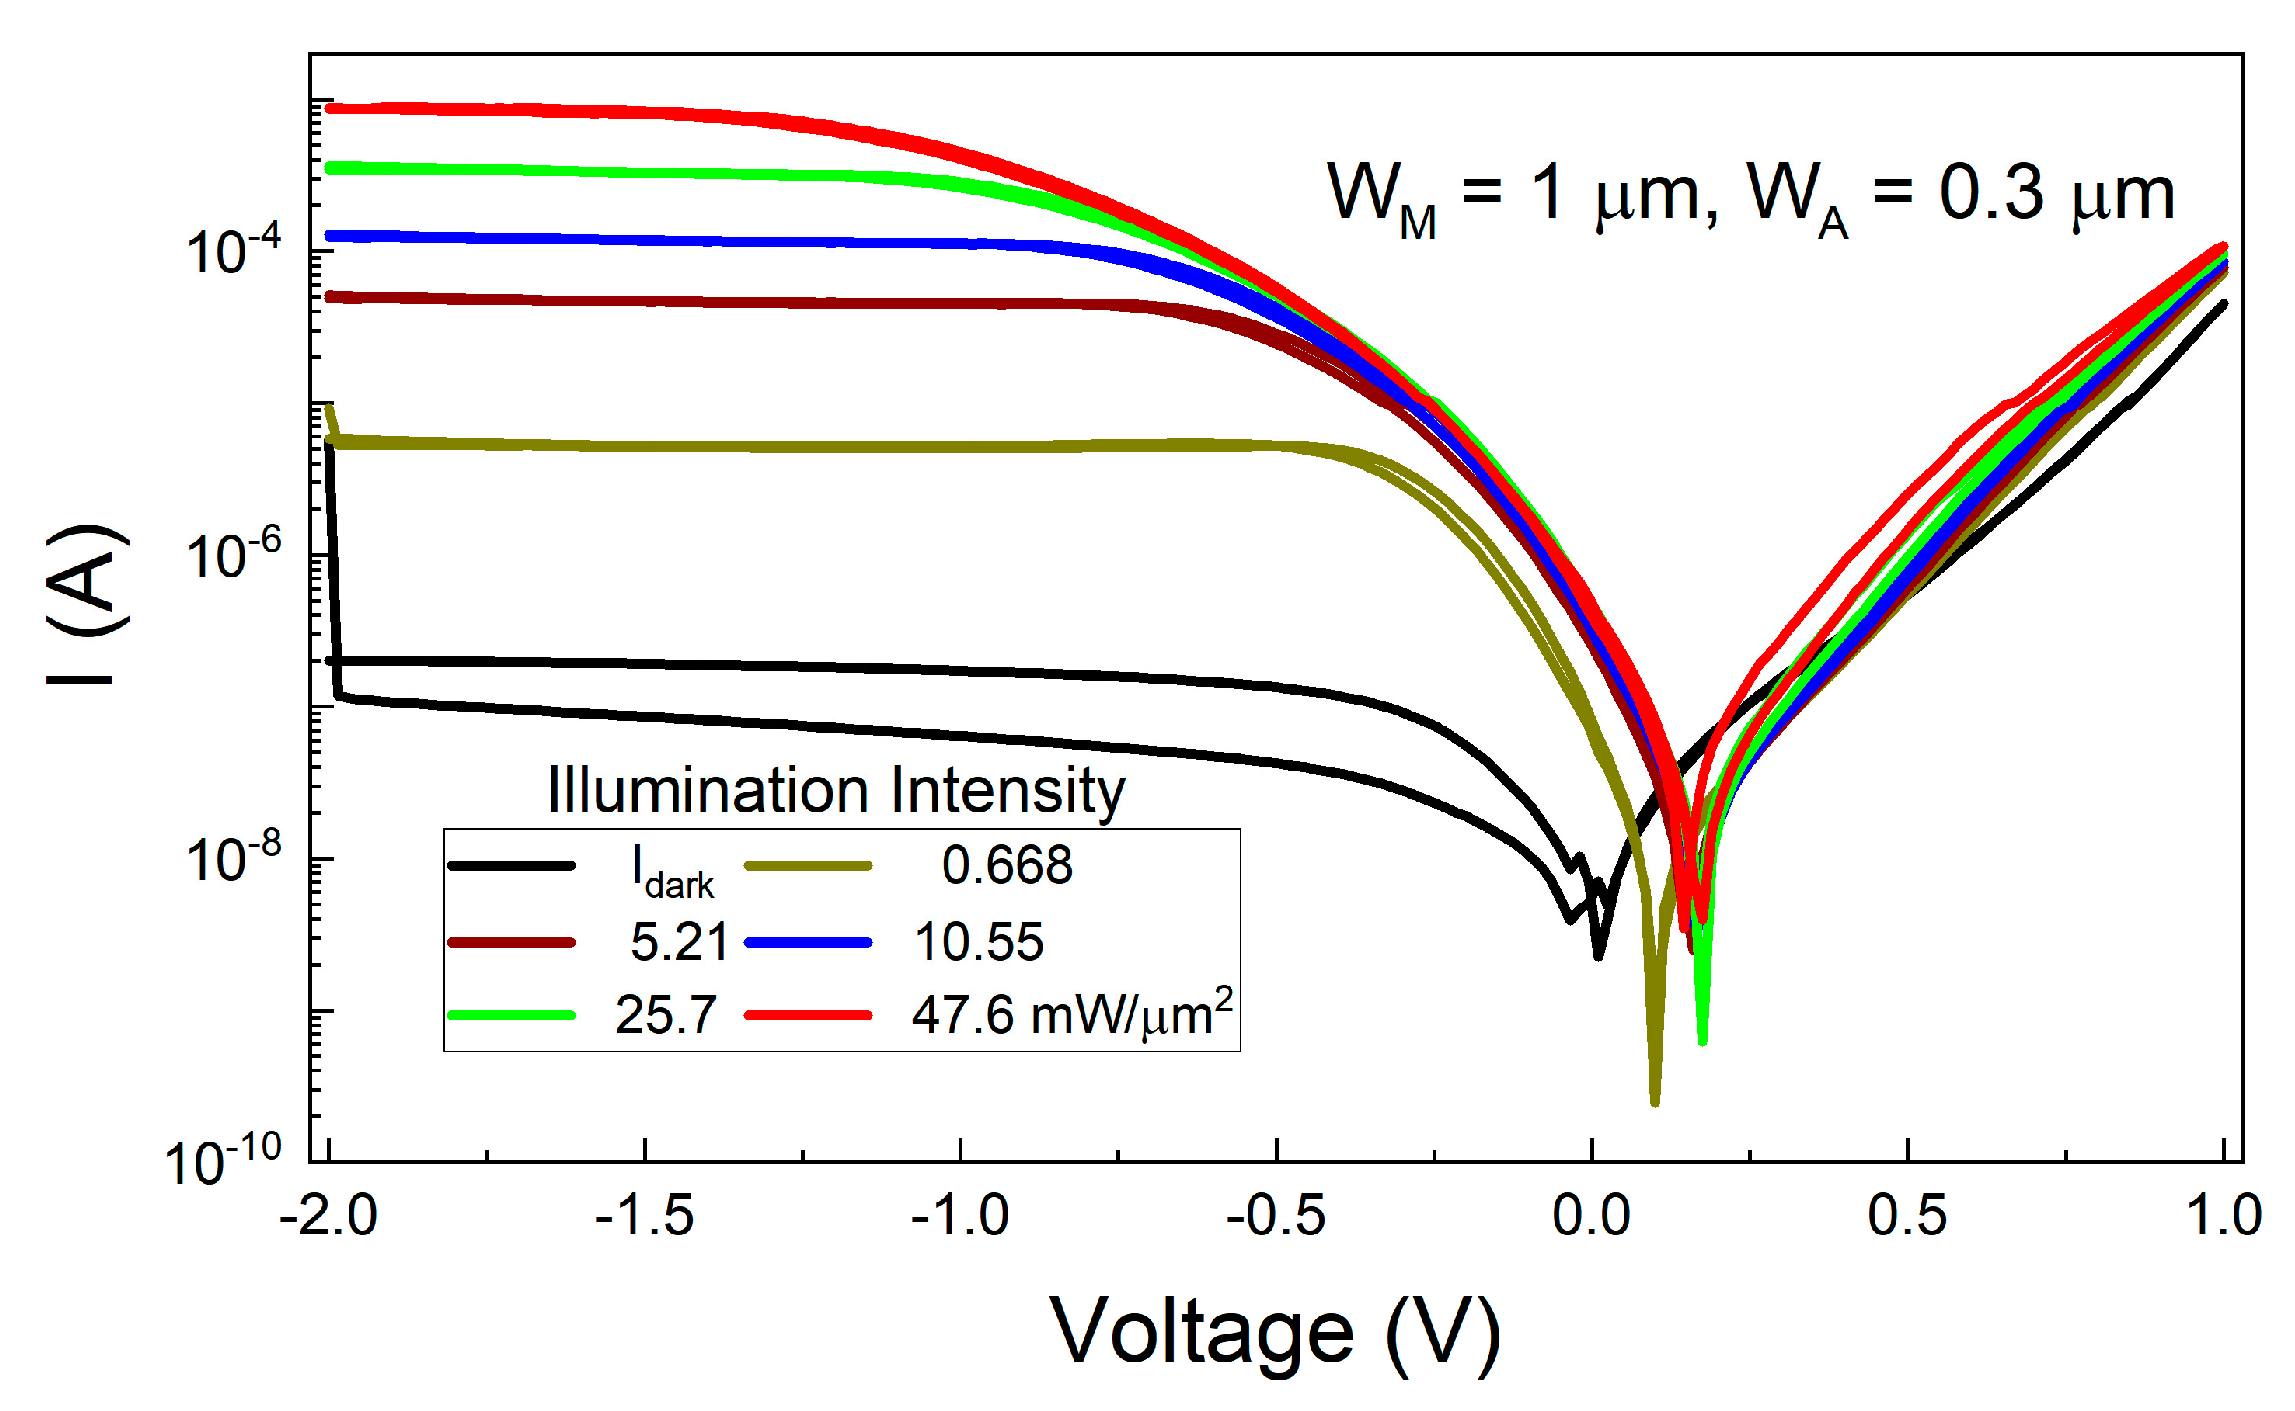
Figure 3 displays the dark and photocurrent characteristics of a lateral Ge-on-Si PD under unmodulated 1550 nm illumination. In low biasing regimes, the carrier multiplication is absent, and therefore responsivity is always less than 1. Across all illumination conditions, the I-V curves exhibit an open-circuit voltage (Voc), a signature characteristic commonly observed in PDs and often enabling photovoltaic applications. Distinct hysteresis effects appear in both dark and photocurrent measurements during forward (−2 to 1 V) and reverse (1 to −2 V) bias sweeps, recorded at illumination powers of (0.668, 5.21, 10.55, 25.7, 47.6) mW/µm2. These non-overlapping current signatures directly reflect the impact of traps on charge transport within the device, which is the core focus of this study. Specifically, the hysteresis arises from (i) asymmetric filling/emptying of interface trap states during voltage ramp directions, (ii) trap-induced delays in carrier release under reverse-bias conditions, and (iii) field-dependent modulation of trap occupancy at the interface. Although hysteresis persists throughout the entire bias range, the maximum current deviation occurs at specific reverse potentials, beyond which the photocurrent approaches saturation. The figures of merit presented in the subsequent discussions also show maximum changes at these potentials. The observed reverse potentials of −(0.32, 0.56, 0.71, 0.935, 1.235) V are inherently determined by the photogenerated charge density, electric field intensity, and charge release/trapping concentrations.
Another notable observation is the distinguishable photo-response in the forward-biased regime. Typically, PDs are probed under reverse bias to establish a space charge (depletion) region, which is essential for drifting photogenerated carriers and suppressing electron-hole recombination during charge transport. In this study, the forward-biased photo-response is attributed to the interaction between light-assisted carrier trapping/release (detrapping) and recombination rates. On one hand, photon energy promotes carriers trapped at interface states back into bands, increasing available charge carriers. On the other hand, the collapsed depletion region allows higher carrier density, accelerating SRH recombination via trap defects, reducing net photocurrent. Although the forward-biased photo-response exhibits both a direct correlation with illumination power (P) and hysteresis behaviour, it will not be utilized for quantifying changes in the PD’s figures of merit.
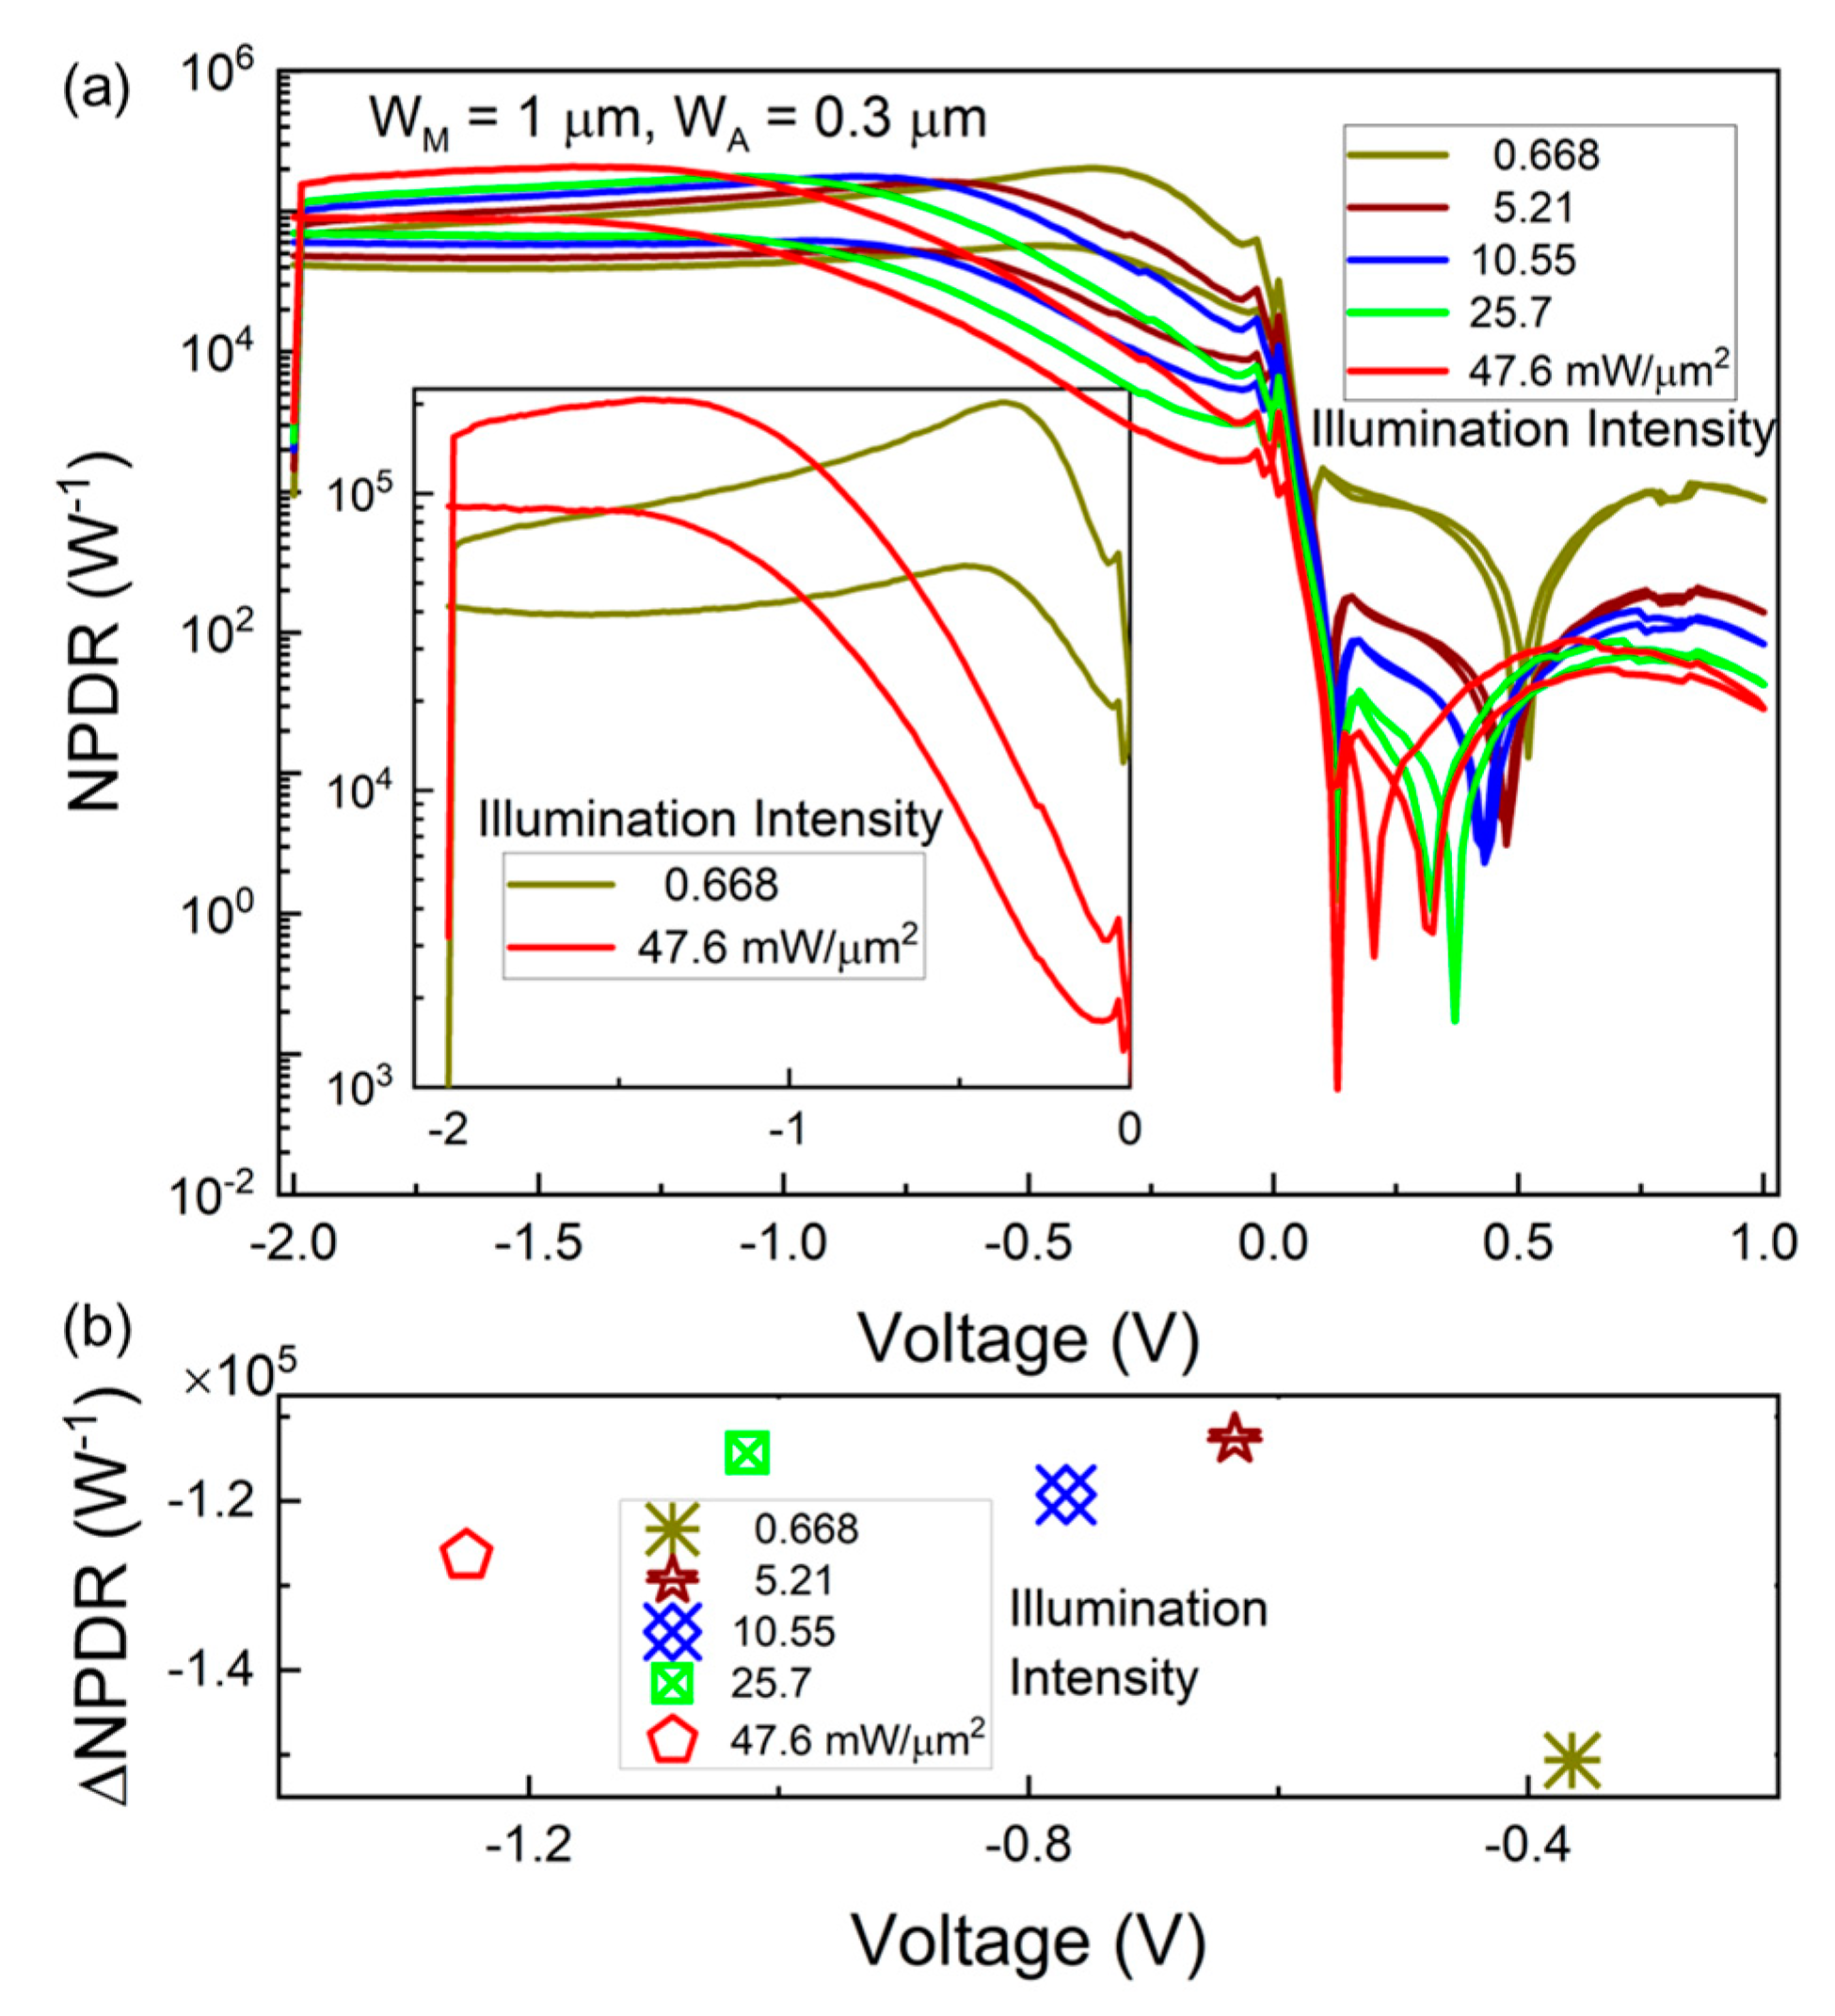
Figure 4 presents another important figure of merit, the normalized photo-to-dark current ratio (NPDR), which is obtained by normalizing the Ipc/Idark ratio with respect to the input P. The NPDR is valuable for enabling direct comparison of responsivity and external quantum efficiency among different detectors under a given Idark. Figure 4a plots the NPDR as a function bias voltage for both forward (−2 to 1 V) and reverse (1 to −2 V) sweeps, while the inset presents a closer view of the NPDR curves at minimum (0.668 mW/µm2) and maximum (47.6 mW/µm2) illumination intensities. The curves display hysteresis effects similar to those in responsivity and current. Figure 4b quantifies the maximum variations in NPDRNPDR), with values of (1.5, 1.126, 1.19, 1.14, 1.26) × 105 W−1 occurring at reverse bias voltages of −(0.365, 0.635, 0.77, 1.025, 1.25) V. Here, the maximum variation is defined as the maximum distance between forward and reverse biasing curves at identical voltage points, and the corresponding voltage at which this maximum occurs for the reverse bias points we mentioned above. It is the same way to define the maximum variations and the corresponding bias potentials for the other figures-of-merit with hysteresis in the subsequent contents. This hysteresis-induced ΔNPDR originates from the dynamic interplay among trap density, photogenerated carrier concentration, and established electric field distribution, which can be leveraged to modulate PD sensitivity for specific applications.
It is found that the NPDR curves at illumination intensities of (0.668, 5.21, 10.55, 25.7, 47.6) mW/µm2 closely resemble the corresponding Ipc/Idark curves in Figure 5. This similarity essentially stems from NPDR being the scaled form of Ipc/Idark by P or equivalently, the transformation of R scaled by Idark, as demonstrated by the following relationship:
N P D R = I p c / I d a r k P = I p c / P I d a r k = R I d a r k
This metric quantifies the device sensitivity per unit dark current, and it enables direct comparison of responsivity between devices with different Idark levels, isolating the impact of Idark on signal-to-noise performance. Additionally, it provides a fundamental efficiency measure where higher NPDR values indicate superior ability to convert optical input into useful signal despite trap-induced dark current limitations.
In addition, we evaluate the noise-equivalent power (NEP) via N E P =   2 e I d a r k R . This formulation assumes dark current shot noise is the dominant noise source in a 1 Hz noise-equivalent bandwidth, which holds for our low-bias conditions where Ibtb, Iava, and Ishunt are negligible. NEP defines the minimum detectable optical power for SNR = 1, with lower values indicating higher sensitivity. It is the reciprocal of detectivity and typically exhibits an inverse relationship with the other figures of merit analyzed in this study. Here, the NEP value is defined per unit bandwidth, and this normalization allows direct comparison of sensitivity across different detectors.
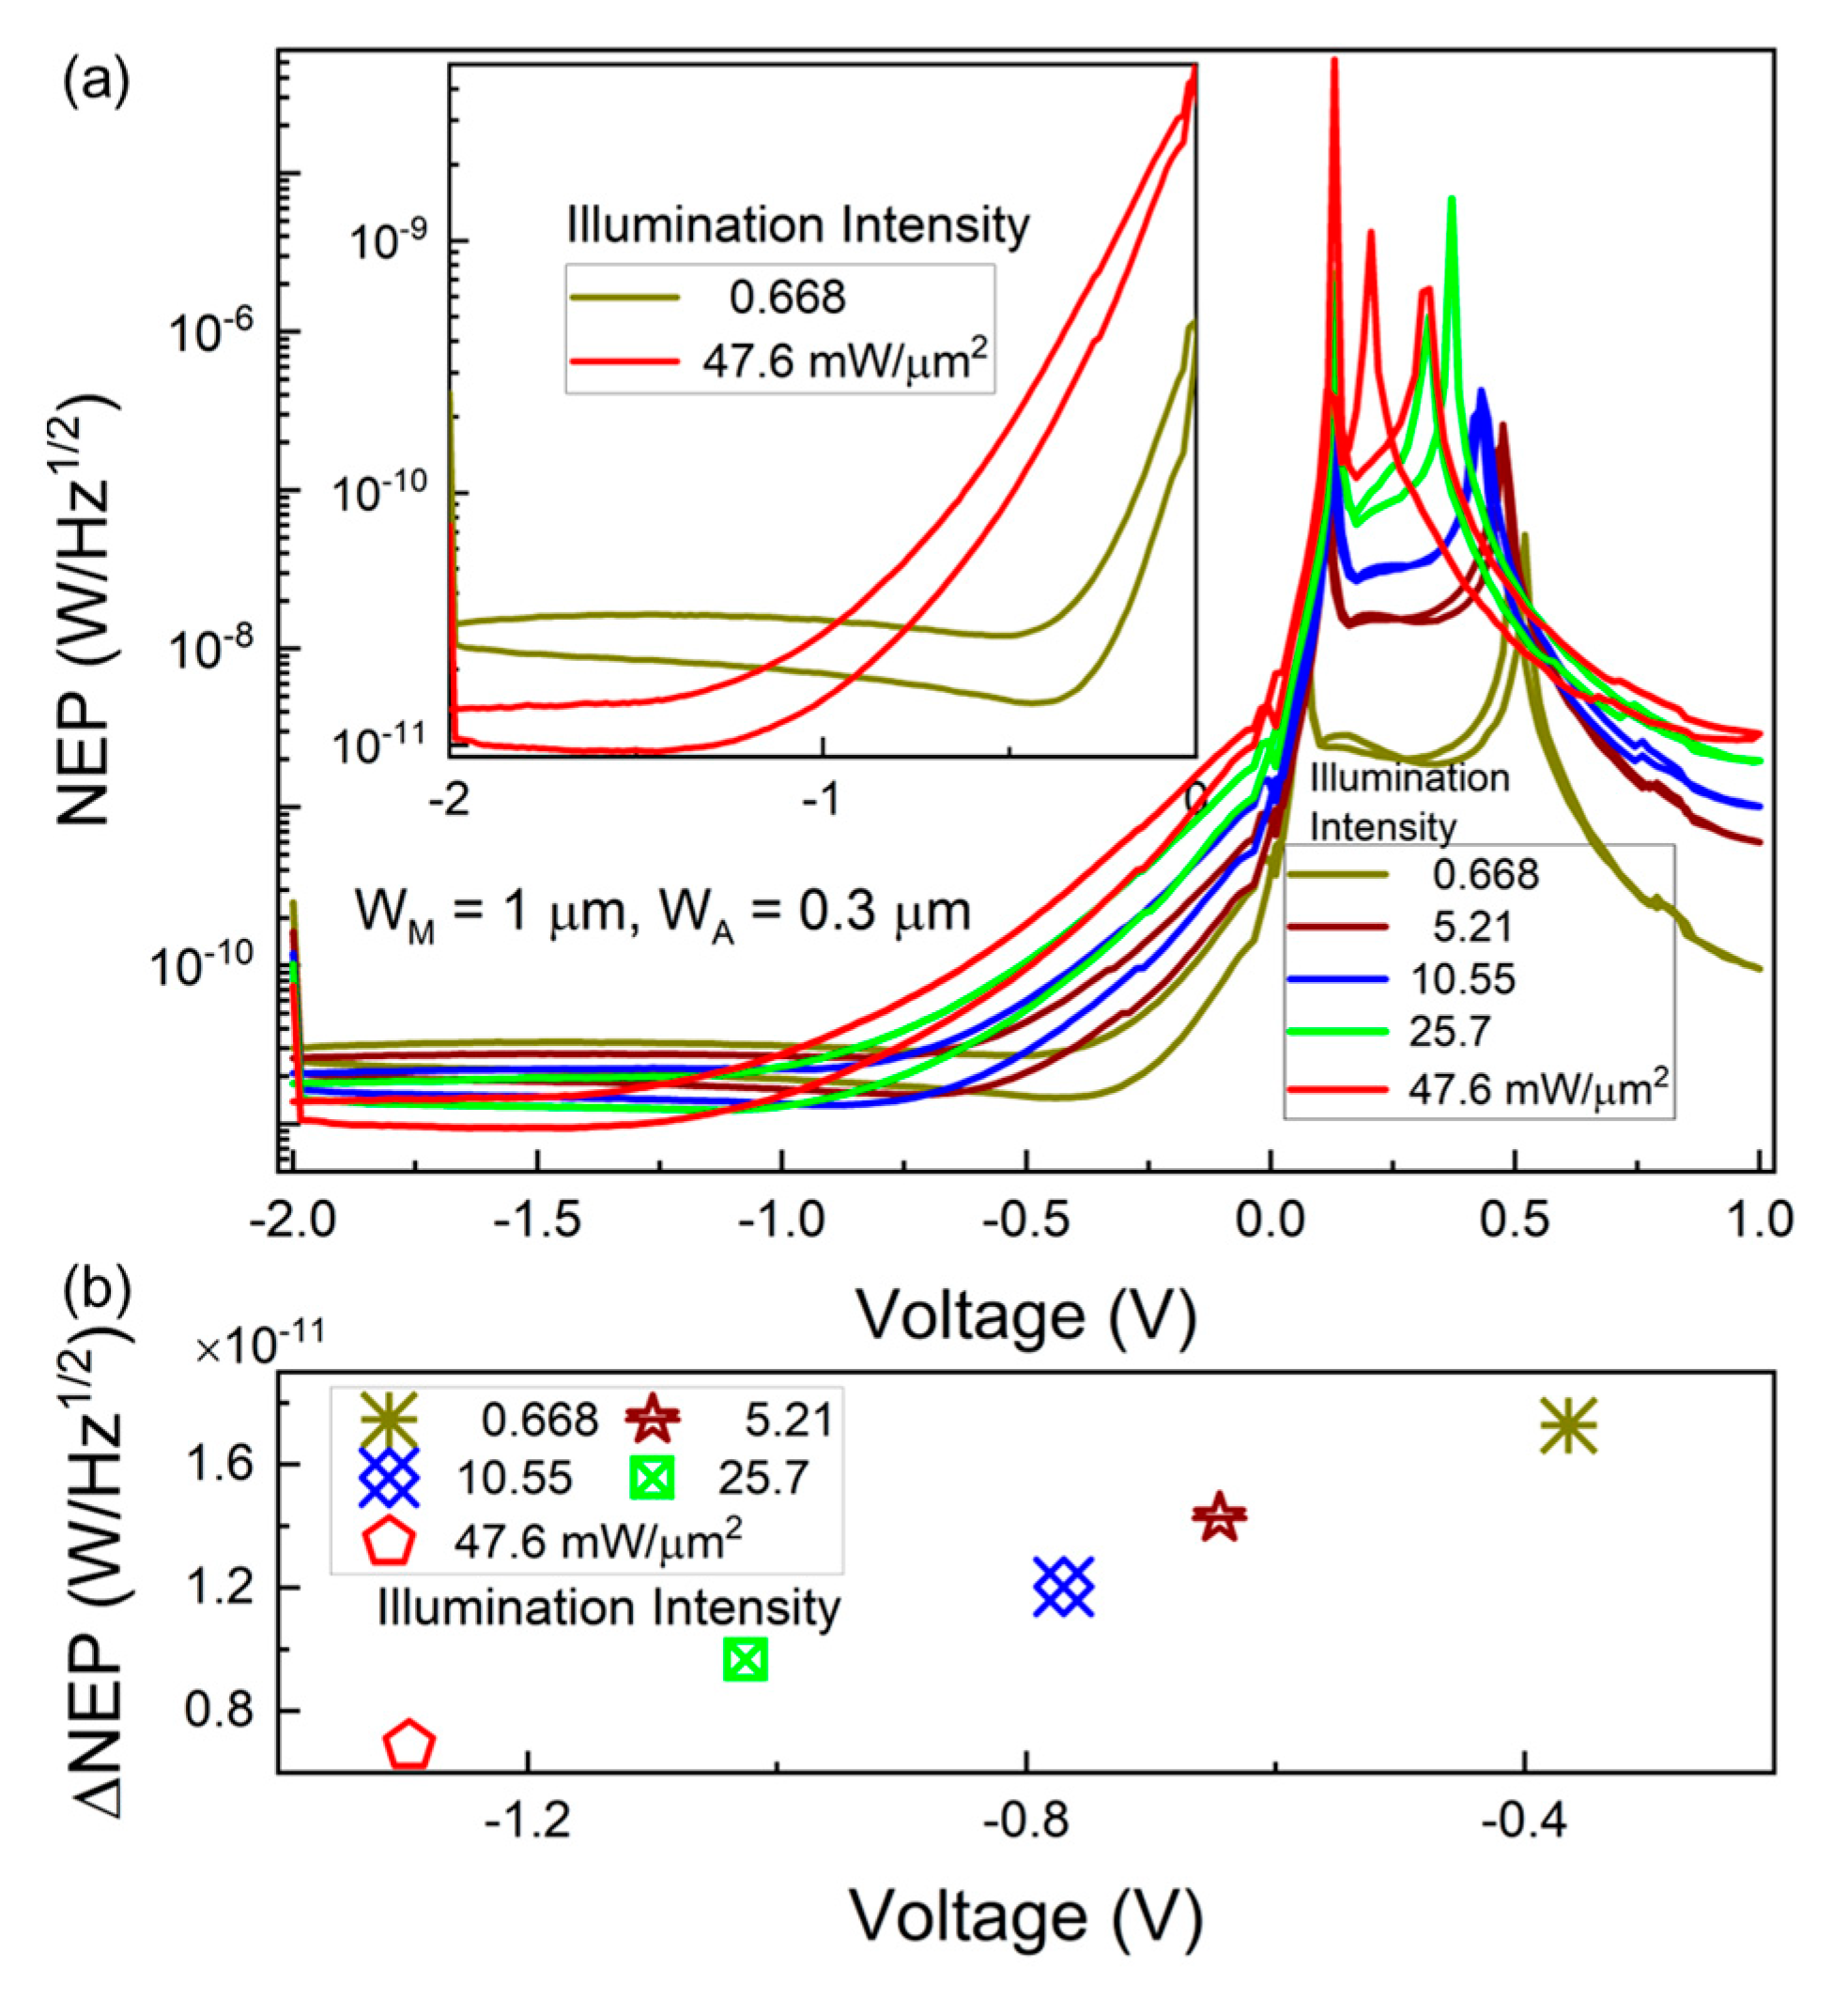
Figure 5a illustrates the NEP values under forward (−2 to 1 V) and reverse (1 to −2 V) bias sweeps. The inset provides a closer view of the NEP curves under 0.668 mW/µm2 and 47.6 mW/µm2 illumination intensities. The forward and reverse sweep curves display the same type of hysteresis observed in previous sections. The maximum variations in ΔNEP, occurring at reverse bias potentials of −(0.365, 0.645, 0.77, 1.025, 1.295) V, are shown in Figure 5b, with corresponding values of (1.727, 1.426, 1.204, 0.967, 0.687) × 10−11  W / H z .
For the studied Ge-on-Si PD, although the NEP decreases (i.e., improves) with enhanced illumination—indicating an increase in the SNR—the minimum NEP of ~10−11  W / H z , achieved at a maximum illumination of 47.6 mW/µm2, remains higher than contemporary state-of-the-art PDs. This elevated NEP can be attributed to the presence of excessive noise sources, particularly deep-level and interface traps, which induce hysteresis in the charge transport dynamics showing non-overlapping current curves during the forward and reverse bias sweeps.
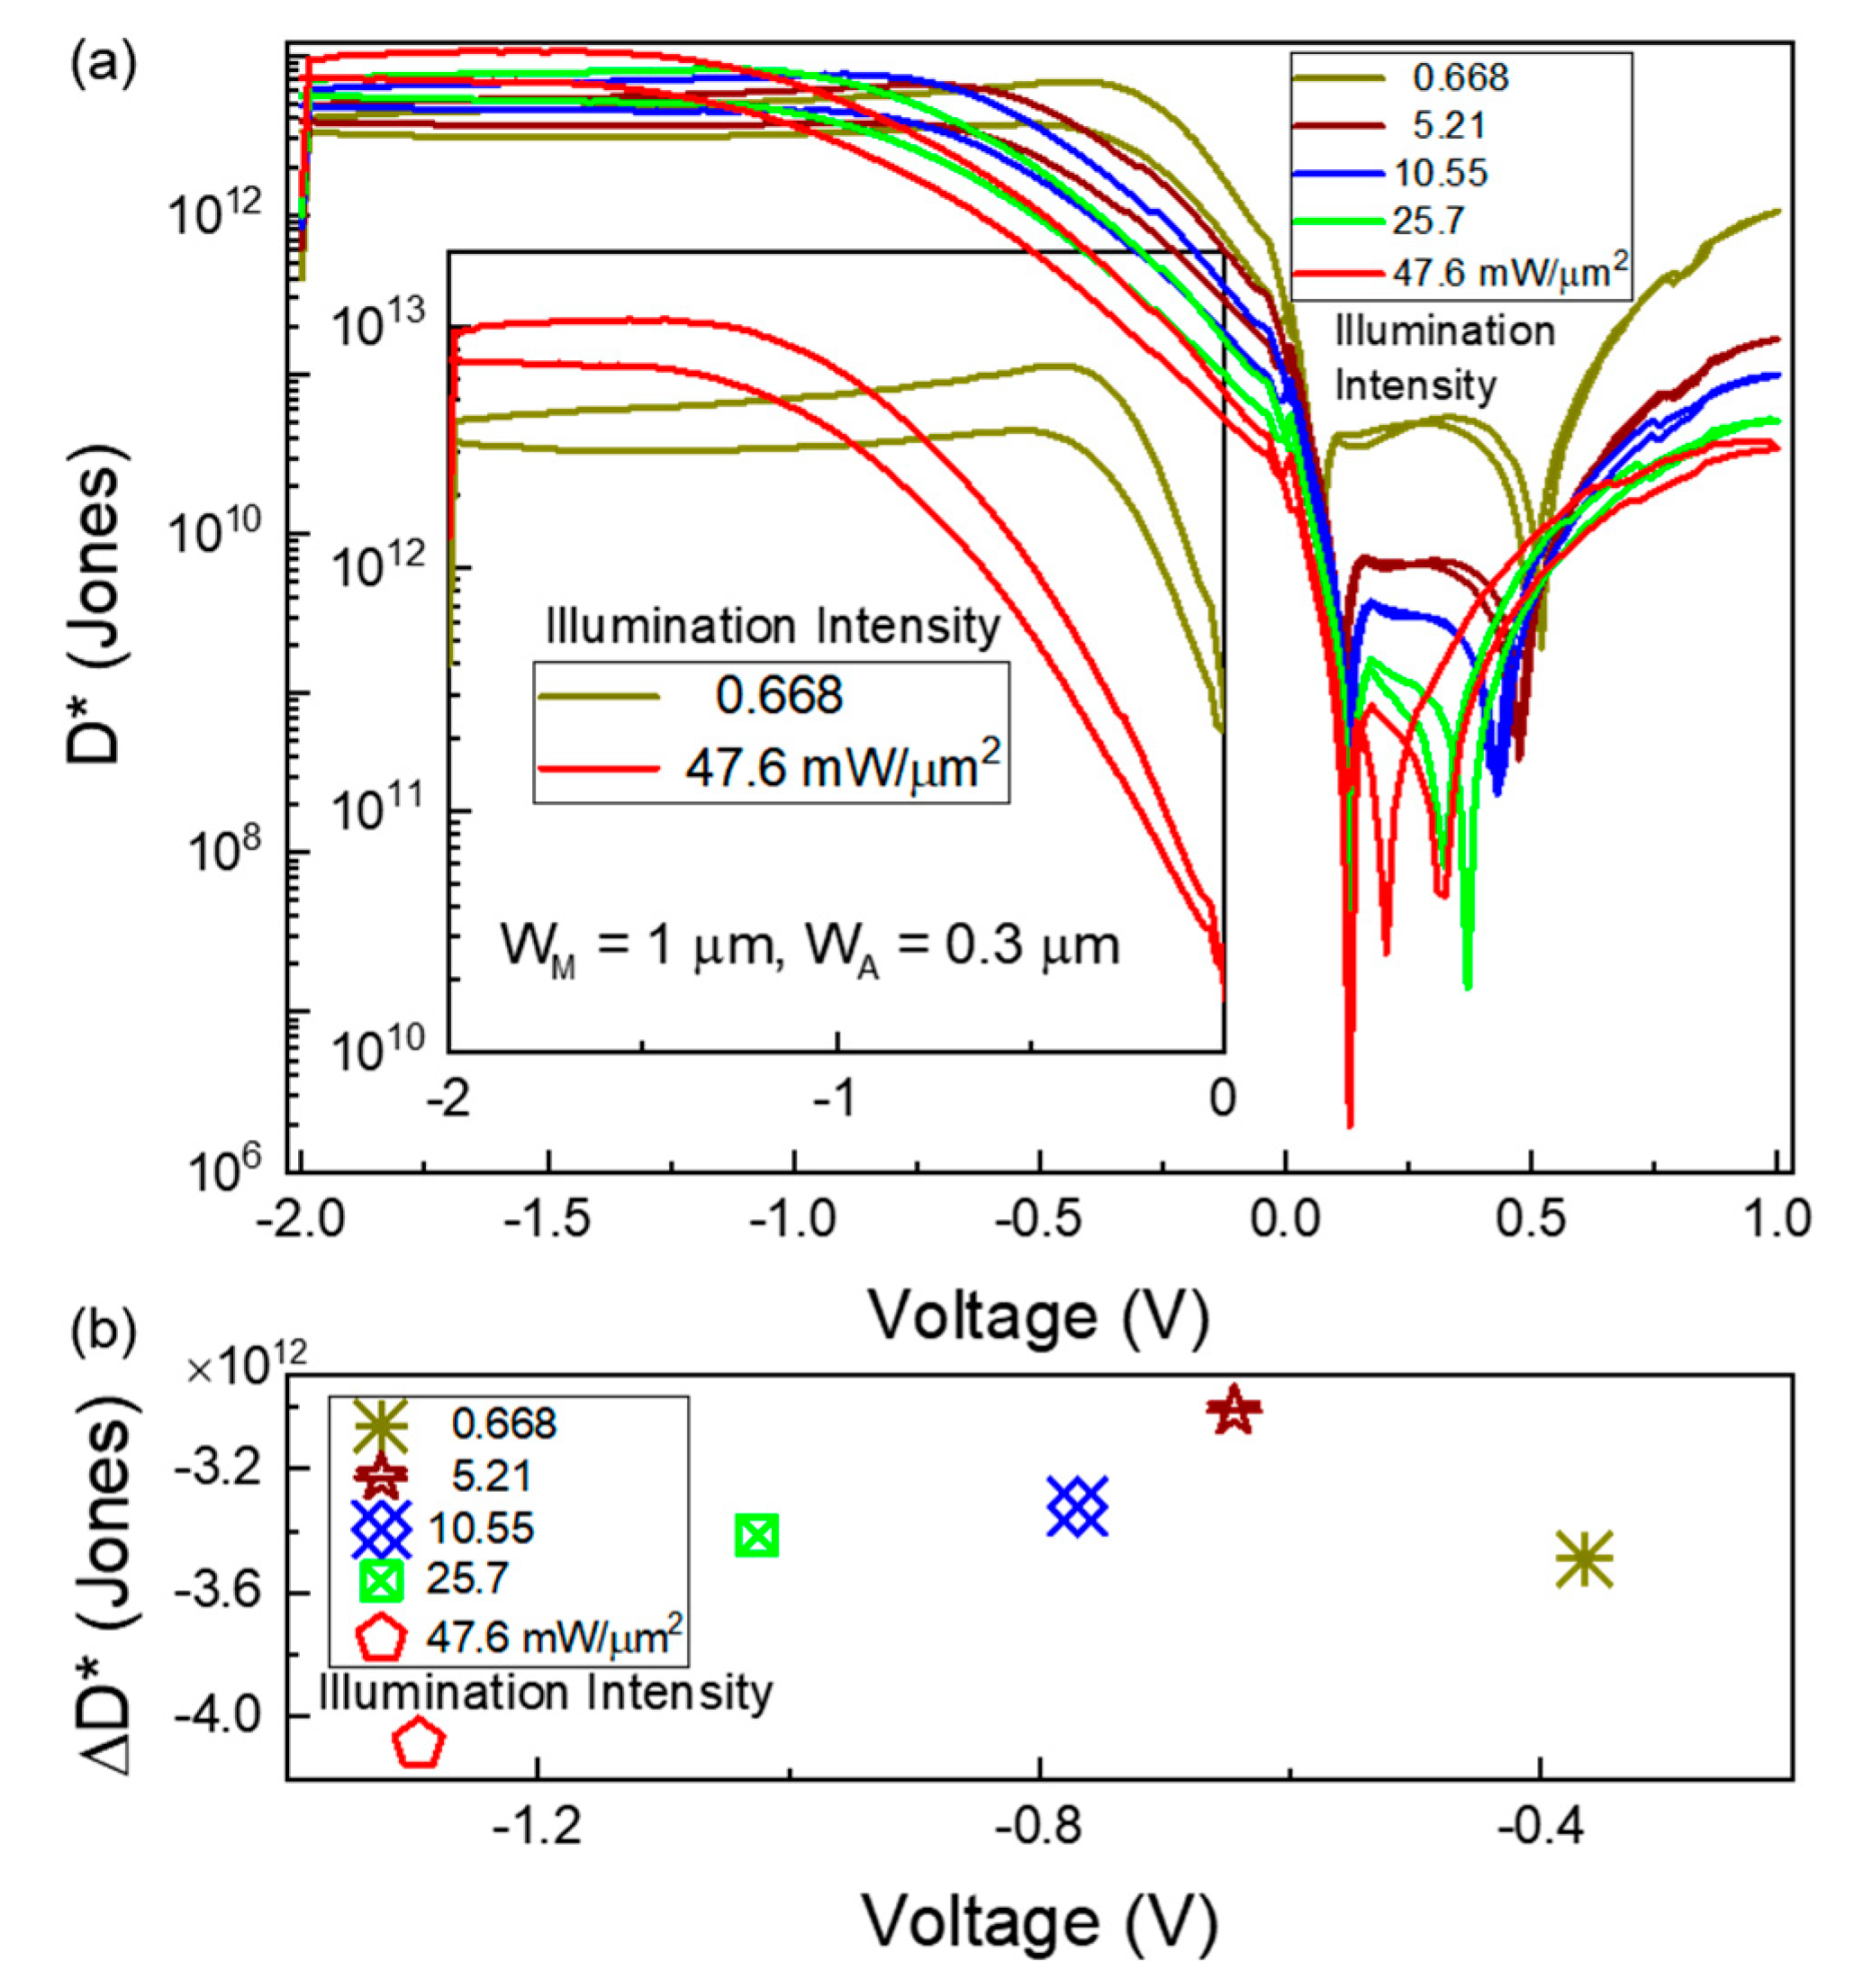
A high specific detectivity (D*) is desirable for an effective PD, and it is plotted in Figure 6. For a specific Idark, D* is calculated using the formula D * = A f D = A f R 2 e I d a r k = A f N E P , where A is the PD area (50 μm × 50 μm). The unnormalized detectivity D is directly related to other figures of merit such as R, NPDR, and Ipc/Idark. Particularly, it can be derived by scaling the NPDR with I d a r k 2 e or translating R through 1 2 e I d a r k . In Figure 6, specific detectivity exhibits a sub-linear direct relationship with P. This behaviour is attributed to the saturation effects and the lack of internal gain (carrier multiplication) owing to the low biasing condition of our lateral Ge-on-Si PD. Furthermore, internal trapping mechanisms show impact on D*, as evidenced by the hysteresis observed in both forward and reverse bias sweeps in Figure 6a. The maximum variations in specific detectivity (ΔD*) achieved under unmodulated illumination intensities of (0.668, 5.21, 10.55, 25.7, 47.6) mW/µm2 are presented in Figure 6b, with values of (3.49, 3.014, 3.322, 3.415, 4.08) × 1012 Jones measured at reverse bias potentials of −(0.365, 0.645, 0.77, 1.025, 1.295) V. The interplay between the electric field and photocharge density defines the voltage range within which the charge transport exhibits saturation in current values.
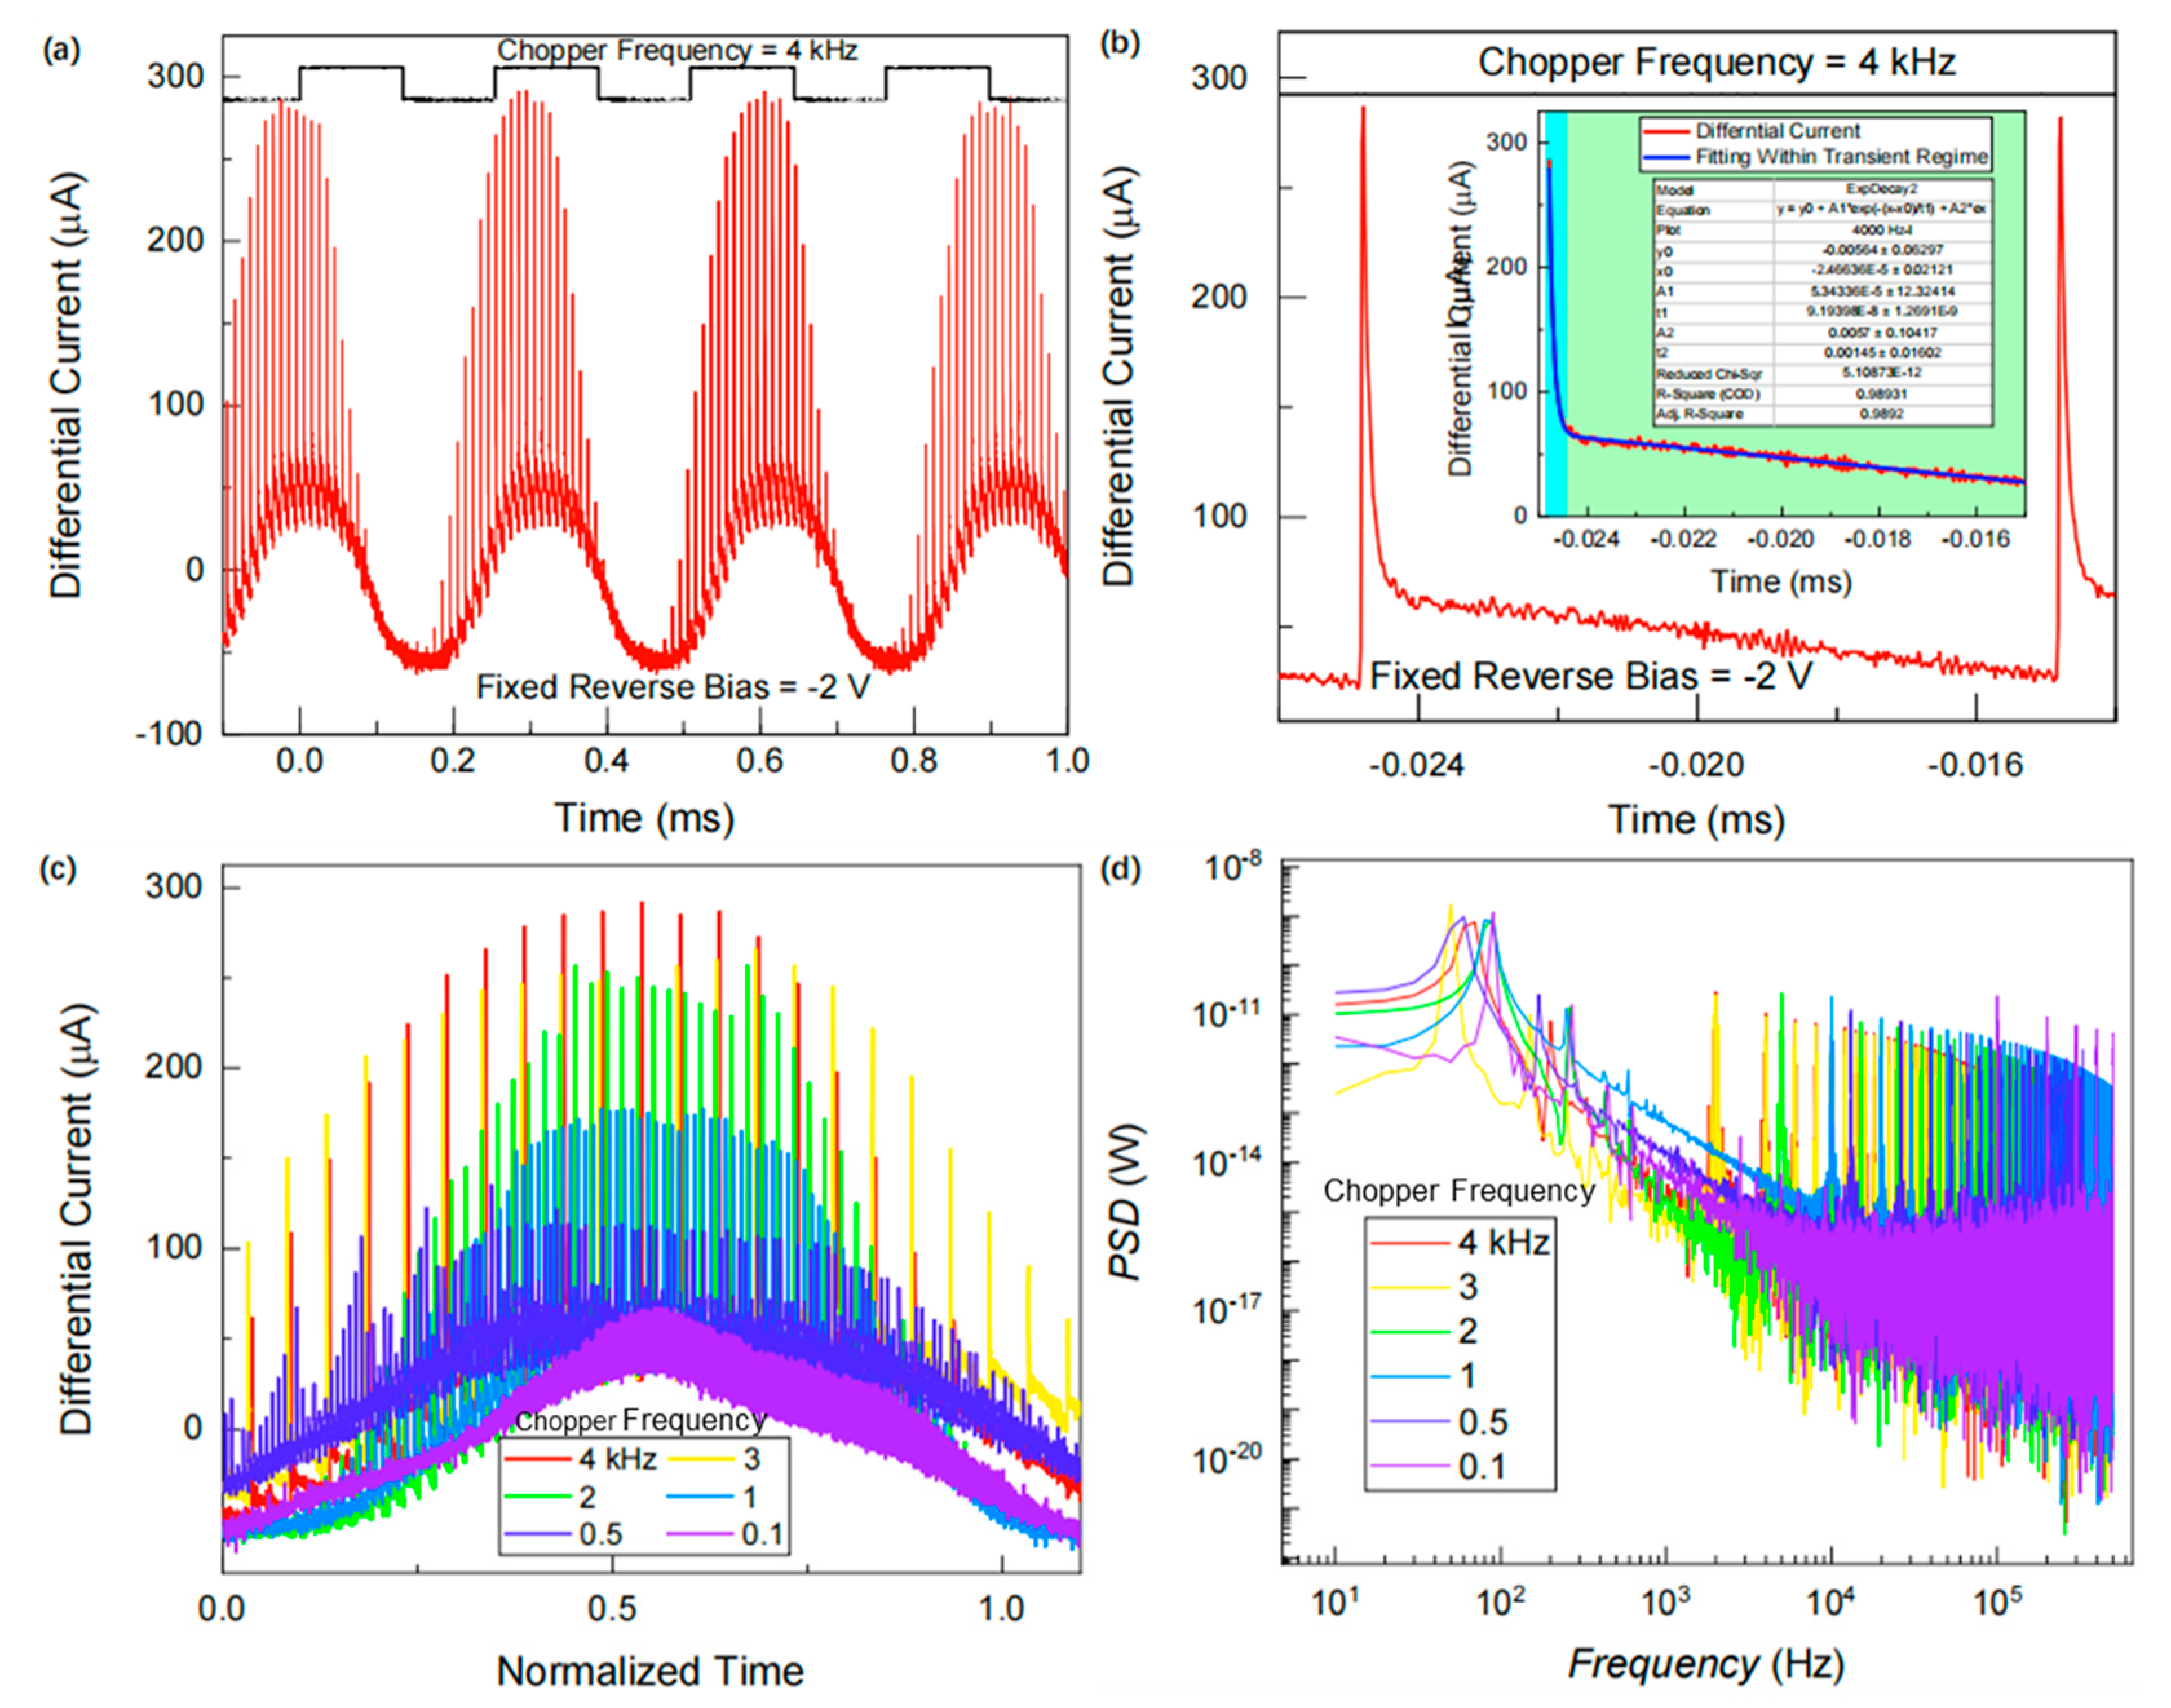
Finally, Figure 7 illustrates the interplay between deep and interface trap effects on the overall photo-response of the studied Ge-on-Si PD. Figure 7a shows the differential current (evaluated by subtracting the dark current from the total measured current) under a fixed reverse bias of −2 V and pulsed 1550 nm laser illumination (intensity = 1 mW/µm2, on/off frequency = 100 kHz). A mechanical chopper modulating (blocking or allowing) the laser beam was maintained at 4 kHz for these measurements. The laser pulses were separated by a duration of 10 µs for all the implemented chopper frequencies (0.1, 0.5, 1, 2, 3, and 4 kHz).
The decay rate of the fast component (cyan background) can be expressed as a function of intrinsic device parameters, while the slower decay trend (green background) is attributed to interface traps. These traps cause signal jitter and noise due to their relatively rapid trapping and detrapping dynamics. The inset depicts a good fitting of the device transient photo-response during the laser off-time, employing a double exponential decay function:
y = y 0 + A 1 e x p ( ( x x 0 ) / t 1 ) + A 2 e x p ( ( x x 1 ) / t 2 )
The transient differential photo-response obtained from the device against all chopper frequencies follows the same curve fitting formulation, with fitting parameters (y0, A1, A2, t1, and t2) showing clear dependence on chopper frequency. Based on the fitting results and the observation in Figure 7b, the surface traps stochastically capture and release carriers on microsecond timescales, introducing uncertainty in carrier transit time; this fluctuation in trap occupancy delay carrier collection, causing temporal variations in photocurrent rise/fall edges (signal time jitter), is also shown by Figure 7c. Meanwhile, the continuous and random capture/release process via interface traps generates generation-recombination noise, especially at higher chopper frequencies. The differential current trace in Figure 7a exhibits a quasi-sinusoidal modulation, originating from the activation of deep traps that perturb the current signature over timescales longer than the individual laser pulses. This behaviour arises because the pulsed illumination duration is shorter than the time required for the device to reach full saturation after each pulse.
Figure 7c shows the differential current as a function of normalized time across various chopper frequencies. The slow transient decay region (highlighted by green background in the inset of Figure 7b) is crucial for evaluating the contribution of interface traps, which influence both the speed and frequency response of the device. The interface (surface) traps with their faster (μs timescale) trapping/detrapping dynamics act as the shot noise source. On the other hand, deep traps exhibit much slower response due to long carrier emission times (ms timescale). The quasi-sinusoidal modulation observed in Figure 7a,c corresponds to the effect of deep traps, which reduce the photocurrent through enhanced electron-hole recombination, thereby compromising the device photosensitivity. Notably, the differential current at 0.1 kHz chopper frequency is three to four times smaller than that observed at 4 kHz. This difference arises because deep traps, characterized by slower detrapping dynamics, become increasingly significant at lower chopper frequencies.
Figure 7d presents the power spectral density (PSD) derived by applying a fast Fourier transform (FFT) to the curves of differential current versus time. The observed increase in PSD with increasing chopper frequency stems primarily from the growing contribution of interface traps. At higher chopper frequencies (>1 kHz), the short laser pulse intervals prevent the device from reaching saturation due to insufficient time, and suppresses the effects of deep traps that require longer timescales to fully activate. Therefore, the interface (surface) traps are the primary noise source, generating high-frequency noise via random carrier capture/release, directly increasing PSD. Conversely, at lower frequencies (<0.5 kHz), the activation of deep traps enhances the non-radiative SRH recombination and depletes photogenerated carriers, degrading the overall device photo-response. Interface traps contribute less to integrated noise as their fast dynamics are averaged out over low-frequency cycles. Therefore, the decreased current activity and associated scattering result in lower PSD values.

5. Conclusions

The Ge/Si interface traps are incorporated into the Ge-on-Si PD during the Ge absorber’s epitaxial growth onto the Si substrate, requiring mitigation via implementation of various techniques. These are fundamentally activated via electrical bias stress applied in the form of sharp transient pulses. In this study, we alternatively observe the reflection of these trapping sources via hysteresis in the current-voltage characteristics of the device. This involves probing the impact of trap-induced effects on charge transport under low-bias conditions. When exposed to an unmodulated 1550 nm laser, the most significant variations in performance metrics are observed at a specific reverse bias, marking the transition between saturated and exponential charge transport regimes.

Author Contributions

Conceptualization, D.Z. and S.D.; methodology, S.D.; software, S.Z.; validation, T.L., B.C. and S.Z.; formal analysis, Y.S. and S.Z.; investigation, Y.S., Y.Z. and F.L.; resources, D.Z. and Y.L.; data curation, Y.Z.; writing—original draft preparation, Y.S., T.L. and S.D.; writing—review and editing, S.Z. and S.D.; visualization, F.L.; supervision, D.Z. and S.D.; project administration, Y.S. and D.Z.; funding acquisition, D.Z. All authors have read and agreed to the published version of the manuscript.

Funding

This research was supporteded by Laboratory Specialized Scientific Research Projects of Beijing Smart-Chip Microelectronics Technology Co., Ltd., grant number SGSC0000YFQT2401307.

Data Availability Statement

The data presented in this study are available on request from the corresponding author due to restrictions related to participant confidentiality.

Conflicts of Interest

Authors Dongyan Zhao, Yali Shao, Boming Chi, Yaxing Zhu, Fang Liu, and Yingzong Liang are employed by the company Beijing Smart-Chip Microelectronics Technology Company Ltd. The remaining authors declare that the research was conducted in the absence of any commercial or financial relationships that could be construed as a potential conflict of interest.

References

  1. Fleming, F.; Yi, X.; Mirza, M.M.A.; Jin, X.; Kirdoda, J.; Dumas, D.C.S.; Saalbach, L.; Modak, M.; Muir, D.A.S.; Smith, C.; et al. Surface-normal illuminated pseudo-planar Ge-on-Si avalanche photodiodes with high gain and low noise. Opt. Express 2024, 32, 19449–19457. [Google Scholar] [CrossRef]
  2. Yuan, Y.; Tossoun, B.; Huang, Z.; Zeng, X.; Kurczveil, G.; Fiorentino, M.; Liang, D.; Beausoleil, R.G. Avalanche photodiodes on silicon photonics. J. Semicond. 2022, 43, 021301. [Google Scholar] [CrossRef]
  3. Liu, X.; Li, X.; Li, Y.; Li, Y.; Zhi, Z.; Tao, M.; Chen, B.; Zhang, L.; Guo, P.; Lo, G.; et al. Three-terminal germanium-on-silicon avalanche photodiode with extended p-charge layer for dark current reduction. Photonics Res. 2022, 10, 1956. [Google Scholar] [CrossRef]
  4. Li, Y.; Liu, X.; Li, X.; Wang, S.; Ye, H.; Zhang, L.; Li, Y.; Sun, S.; Chen, B.; Ma, Y.; et al. Surface illuminated interdigitated Ge-on-Si photodetector with high responsivity. Opt. Express 2021, 29, 16346–16361. [Google Scholar] [CrossRef]
  5. Yi, X.; Greener, Z.; Fleming, F.; Kirdoda, J.; Dumas, D.C.S.; Saalbach, L.; Muir, D.A.S.; Ferre-Llin, L.; Millar, R.W.; Paul, D.J.; et al. After pulsing in Ge-on-Si single-photon avalanche diodes. IEEE Photonics Technol. Lett. 2023, 35, 959–962. [Google Scholar] [CrossRef]
  6. Jang, K.-S.; Kim, S.; Kim, I.G.; Oh, J.H.; Kim, S.A.; Joo, J.; Kim, G. High performance Ge-on-Si avalanche photodetector. In Proceedings of the Optical Interconnects XVI, San Francisco, CA, USA, 13–18 February 2016; Volume 9753, pp. 227–232. [Google Scholar]
  7. Kang, Y.; Liu, H.-D.; Morse, M.; Paniccia, M.J.; Zadka, M.; Litski, S.; Sarid, G.; Pauchard, A.; Kuo, Y.-H.; Chen, H.-W.; et al. Monolithic germanium/silicon avalanche photodiodes with 340 GHz gain–bandwidth product. Nat. Photonics 2009, 3, 59–63. [Google Scholar] [CrossRef]
  8. Li, Y.; Liu, X.; Li, X.; Zhang, L.; Chen, B.; Zhi, Z.; Li, X.; Zhang, G.; Ye, P.; Huang, G.; et al. Germanium-on-silicon avalanche photodiode for 1550 nm weak light signal detection at room temperature. Chinese Opt. Lett. 2022, 20, 062501. [Google Scholar] [CrossRef]
  9. Shi, B.; Qi, F.; Cai, P.; Chen, X.; He, Z.; Duan, Y.; Hou, G.; Su, T.; Li, S.; Chen, W.; et al. 106 Gb/s normal-incidence Ge/Si avalanche photodiode with high sensitivity. In Proceedings of the 2020 Optical Fiber Communications Conference and Exhibition (OFC), San Diego, CA, USA, 8–12 March 2020; pp. 1–3. [Google Scholar]
  10. Royo, S.; Ballesta-Garcia, M. An overview of LiDAR imaging systems for autonomous vehicles. Appl. Sci. 2019, 9, 4093. [Google Scholar] [CrossRef]
  11. Hadfield, R.H.; Leach, J.; Fleming, F.; Paul, D.J.; Tan, C.H.; Ng, J.S.; Henderson, R.K.; Buller, G.S. Single-photon detection for long-range imaging and sensing. Optica 2023, 10, 1124–1141. [Google Scholar] [CrossRef]
  12. Wallace, A.M.; Halimi, A.; Buller, G.S. Full waveform LiDAR for adverse weather conditions. IEEE Trans. Veh. Technol. 2020, 69, 7064–7077. [Google Scholar] [CrossRef]
  13. Srinivasan, S.A.; Lambrecht, J.; Guermandi, D.; Lardenois, S.; Berciano, M.; Absil, P.; Bauwelinck, J.; Yin, X.; Pantouvaki, M.; Campenhout, J.V. 56 Gb/s NRZ O-band hybrid BiCMOS-silicon photonics receiver using Ge/Si avalanche photodiode. J. Lightwave Technol. 2021, 39, 1409–1415. [Google Scholar] [CrossRef]
  14. Yuan, Y.; Huang, Z.; Zeng, X.; Liang, D.; Sorin, W.V.; Fiorentino, M.; Beausoleil, R.G. High responsivity Si-Ge waveguide avalanche photodiodes enhanced by loop reflector. IEEE J. Sel. Top. Quant. 2022, 28, 1–8. [Google Scholar] [CrossRef]
  15. Osten, H.J. Modification of growth modes in lattice-mismatched epitaxial systems: Si/Ge. Phys. Status Solidi A 1994, 145, 235–245. [Google Scholar] [CrossRef]
  16. Roland, C.; Gilmer, G.H. Growth of germanium films on Si(001) substrates. Phys. Rev. B 1993, 47, 16286–16298. [Google Scholar] [CrossRef]
  17. Lee, K.H.; Bao, S.; Wang, B.; Wang, C.; Yoon, S.F.; Michel, J.; Fitzgerald, E.A.; Tan, C.S. Reduction of threading dislocation density in Ge/Si using a heavily As-doped Ge seed layer. AIP Adv. 2016, 6, 025028. [Google Scholar] [CrossRef]
  18. Ye, H.; Yu, J. Germanium epitaxy on silicon. Sci. Technol. Adv. Mater. 2014, 15, 024601. [Google Scholar] [CrossRef]
  19. Endres, J.; Daniš, S.; Bauer, G. The misfit dislocation density profile in graded SiGe/Si(001) layers prepared at different temperatures. J. Phys. Condens. Matter. 2013, 25, 175802. [Google Scholar] [CrossRef]
  20. Langdo, T.A.; Leitz, C.W.; Currie, M.T.; Fitzgerald, E.A.; Lochtefeld, A.; Antoniadis, D.A. High quality Ge on Si by epitaxial necking. Appl. Phys. Lett. 2000, 76, 3700–3702. [Google Scholar] [CrossRef]
  21. Klinger, S.; Berroth, M.; Kaschel, M.; Oehme, M.; Kasper, E. Ge-on-Si p-i-n photodiodes with a 3-dB bandwidth of 49 GHz. IEEE Photonics Technol. Lett. 2009, 21, 920–922. [Google Scholar] [CrossRef]
  22. Yi, L.; Liu, D.; Li, D.; Zhang, P.; Tang, B.; Li, B.; Wang, W.; Yang, Y.; Li, Z. Waveguide-integrated Ge/Si avalanche photodiode with vertical multiplication region for 1310 nm detection. Photonics 2023, 10, 750. [Google Scholar] [CrossRef]
  23. Hong, C.; Shi, B.; Qi, F.; Cai, P.; Duan, Y.; Hou, G.; Su, T.; Chiu, T.; Li, S.; Chen, W.; et al. High speed Ge/Si avalanche photodiode with high sensitivity for 50Gbit/s and 100Gbit/s optical access systems. In Proceedings of the 2022 Optical Fiber Communications Conference and Exhibition (OFC), San Diego, CA, USA, 6–10 March 2022; pp. 1–3. [Google Scholar]
  24. Li, Y.; Liu, X.; Li, X.; Zhang, L.; Li, Y.; Chen, B.; Zhi, Z.; Gao, F.; Li, X.; Guo, P.; et al. Lateral separate absorption charge multiplication Ge-on-Si avalanche photodiode with low dark current in linear mode. Opt. Commun. 2022, 518, 128343. [Google Scholar] [CrossRef]
  25. Deeb, H.; Khomyakova, K.; Kokhanenko, A.; Douhan, R.; Lozovoy, K. Dependence of Ge/Si avalanche photodiode performance on the thickness and doping concentration of the multiplication and absorption layers. Inorganics 2023, 11, 303. [Google Scholar] [CrossRef]
  26. Song, J.; Bin, S.; Zhou, C.; Qin, B. High-performance normal-incidence Ge/Si meta-structure avalanche photodetector. Photonics 2023, 10, 780. [Google Scholar] [CrossRef]
  27. Chen, H.; Verheyen, P.; De Heyn, P.; Lepage, G.; De Coster, J.; Balakrishnan, S.; Absil, P.; Yao, W.; Shen, L.; Roelkens, G.; et al. −1 V bias 67 GHz bandwidth Si-contacted germanium waveguide p-i-n photodetector for optical links at 56 Gbps and beyond. Opt. Express 2016, 24, 4622–4631. [Google Scholar] [CrossRef]
  28. Zhang, D.; Xue, C.; Cheng, B.; Su, S.; Liu, Z.; Zhang, X.; Zhang, G.; Li, C.; Wang, Q. High-responsivity GeSn short-wave infrared p-i-n photodetectors. Appl. Phys. Lett. 2013, 102, 141111. [Google Scholar] [CrossRef]
  29. Shim, J.; Kang, D.H.; Yoo, G.; Hong, S.T.; Jung, W.S.; Kuh, B.J.; Lee, B.; Shin, D.; Ha, K.; Kim, G.S.; et al. Germanium p-i-n avalanche photodetector fabricated by point defect healing process. Opt. Lett. 2014, 39, 4204–4207. [Google Scholar] [CrossRef]
  30. Kim, I.G.; Jang, K.-S.; Joo, J.; Kim, S.; Kim, S.; Choi, K.-S.; Oh, J.H.; Kim, S.A.; Kim, G. High-performance photoreceivers based on vertical-illumination type Ge-on-Si photodetectors operating up to 43 Gb/s at λ~1550nm. Opt. Express 2013, 21, 30716–30723. [Google Scholar] [CrossRef]
  31. Alam, M.S.; Rahman, M.S.; Islam, M.R.; Bhuiyan, A.G.; Yamada, M. Refractive index, absorption coefficient, and photoelastic constant: Key parameters of ingaas material relevant to ingaas-based device performance. In Proceedings of the 2007 IEEE 19th International Conference on Indium Phosphide & Related Materials, Matsue, Japan, 14–18 May 2007; pp. 343–346. [Google Scholar]
  32. Li, C.; Xue, C.; Li, C.; Liu, Z.; Cheng, B.; Wang, Q. High bandwidth surface-illuminated InGaAs/InP uni-travelling-carrier photodetector. Chin. Phys. B 2013, 22, 118503. [Google Scholar] [CrossRef]
  33. Li, C.; Li, B.; Qin, S.; Su, J.; He, X.; Guo, X. Effects of interface states on Ge-On-SOI photodiodes. IEEE J. Electron Devices Soc. 2019, 7, 7–12. [Google Scholar] [CrossRef]
  34. Gity, F.; Hayes, J.M.; Corbett, B.; Morrison, A.P. Modeling the effects of interface traps on the static and dynamic characteristics of Ge/Si avalanche photodiodes. IEEE J. Quantum Electron. 2011, 47, 849–857. [Google Scholar] [CrossRef]
  35. DeRose, C.T.; Trotter, D.C.; Zortman, W.A.; Starbuck, A.L.; Fisher, M.; Watts, M.R.; Davids, P.S. Ultra compact 45 GHz CMOS compatible Germanium waveguide photodiode with low dark current. Opt. Express 2011, 19, 24897–24904. [Google Scholar] [CrossRef]
  36. Eaglesham, D.J.; Cerullo, M. Dislocation-free Stranski-Krastanow growth of Ge on Si(100). Phys. Rev. Lett. 1990, 64, 1943–1946. [Google Scholar] [CrossRef]
  37. LeGoues, F.K.; Copel, M.; Tromp, R.M. Microstructure and strain relief of Ge films grown layer by layer on Si(001). Phys. Rev. B 1990, 42, 11690–11700. [Google Scholar] [CrossRef]
  38. Forrest, S.R.; Leheny, R.F.; Nahory, R.E.; Pollack, M.A. In0.53Ga0.47As photodiodes with dark current limited by generation-recombination and tunneling. Appl. Phys. Lett. 1980, 37, 322–325. [Google Scholar] [CrossRef]
  39. Chen, Z.; Jie, B.B.; Sah, C.-T. Effects of energy distribution of interface traps on recombination dc current-voltage line shape. J. Appl. Phys. 2006, 100, 114511. [Google Scholar] [CrossRef]
  40. Miyasaka, Y.; Hiraki, T.; Okazaki, K.; Takeda, K.; Tsuchizawa, T.; Yamada, K.; Wada, K.; Ishikawa, Y. Ge/graded-SiGe multiplication layers for low-voltage and low-noise Ge avalanche photodiodes on Si. Jpn. J. Appl. Phys. 2016, 55, 04EH10. [Google Scholar] [CrossRef]
  41. Hsin, C.-L.; Chou, C.-H. Buffer-free Ge/Si by rapid melting growth technique for separate absorption and multiplication avalanche photodetectors. IEEE Electron Device Lett. 2019, 40, 945–948. [Google Scholar] [CrossRef]
  42. Wanitzek, M.; Schulze, J.; Oehme, M. Ge-on-Si single-photon avalanche diode using a double mesa structure. Opt. Lett. 2024, 49, 6345–6348. [Google Scholar] [CrossRef]
  43. Lee, K.; Jandl, A.; Tan, Y.; Fitzgerald, E.; Tan, C. Growth and characterization of germanium epitaxial film on silicon (001) with germane precursor in metal organic chemical vapour deposition (MOCVD) chamber. AIP Adv. 2013, 3, 092123. [Google Scholar] [CrossRef]
  44. Lee, K.H.; Tan, Y.H.; Jandl, A.; Fitzgerald, E.A.; Tan, C.S. Comparative studies of the growth and characterization of germanium epitaxial film on silicon (001) with 0° and 6° offcut. J. Electron. Mater. 2013, 42, 1133–1139. [Google Scholar] [CrossRef]
  45. Michel, J.; Camacho-Aguilera, R.E.; Cai, Y.; Patel, N.; Bessette, J.T.; Romagnoli, M.; Dutt, B.; Kimerling, L.C. An Electrically pumped Ge-on-Si laser. In Proceedings of the OFC/NFOEC, Angeles, CA, USA, 4–8 March 2012; pp. 1–3. [Google Scholar]
  46. Marković, L.; Knežević, T.; Nanver, L.K.; Attariabad, A.; Azizur-Rahman, K.M.; Mah, J.J.; Wang, K.L.; Suligoj, T. Impact of the Ge-Si interfacial barrier on the temperature-dependent performance of pureGaB Ge-on-Si p + n photodiodes. Opt. Express 2024, 32, 35542–35550. [Google Scholar] [CrossRef]
  47. Pan, R.; Yuan, Z.; Zhang, K.; Yao, J.; Li, C.; Lu, M.; Lu, H.; Chen, Y.-F. Annealing induced carrier activation and PL enhancement in Ge-on-Si grown by low temperature MBE. J. Cryst. Growth 2022, 588, 126668. [Google Scholar] [CrossRef]
  48. Wei, Y.; Cai, X.; Ran, J.; Yang, J. Analysis of dark current dependent upon threading dislocations in Ge/Si heterojunction photodetectors. Microelectron. Int. 2012, 29, 136–140. [Google Scholar] [CrossRef]
  49. Huang, Z.; Oh, J.; Banerjee, S.K.; Campbell, J.C. Effectiveness of SiGe buffer layers in reducing dark currents of Ge-on-Si photodetectors. IEEE J. Quantum Electron. 2007, 43, 238–242. [Google Scholar] [CrossRef]
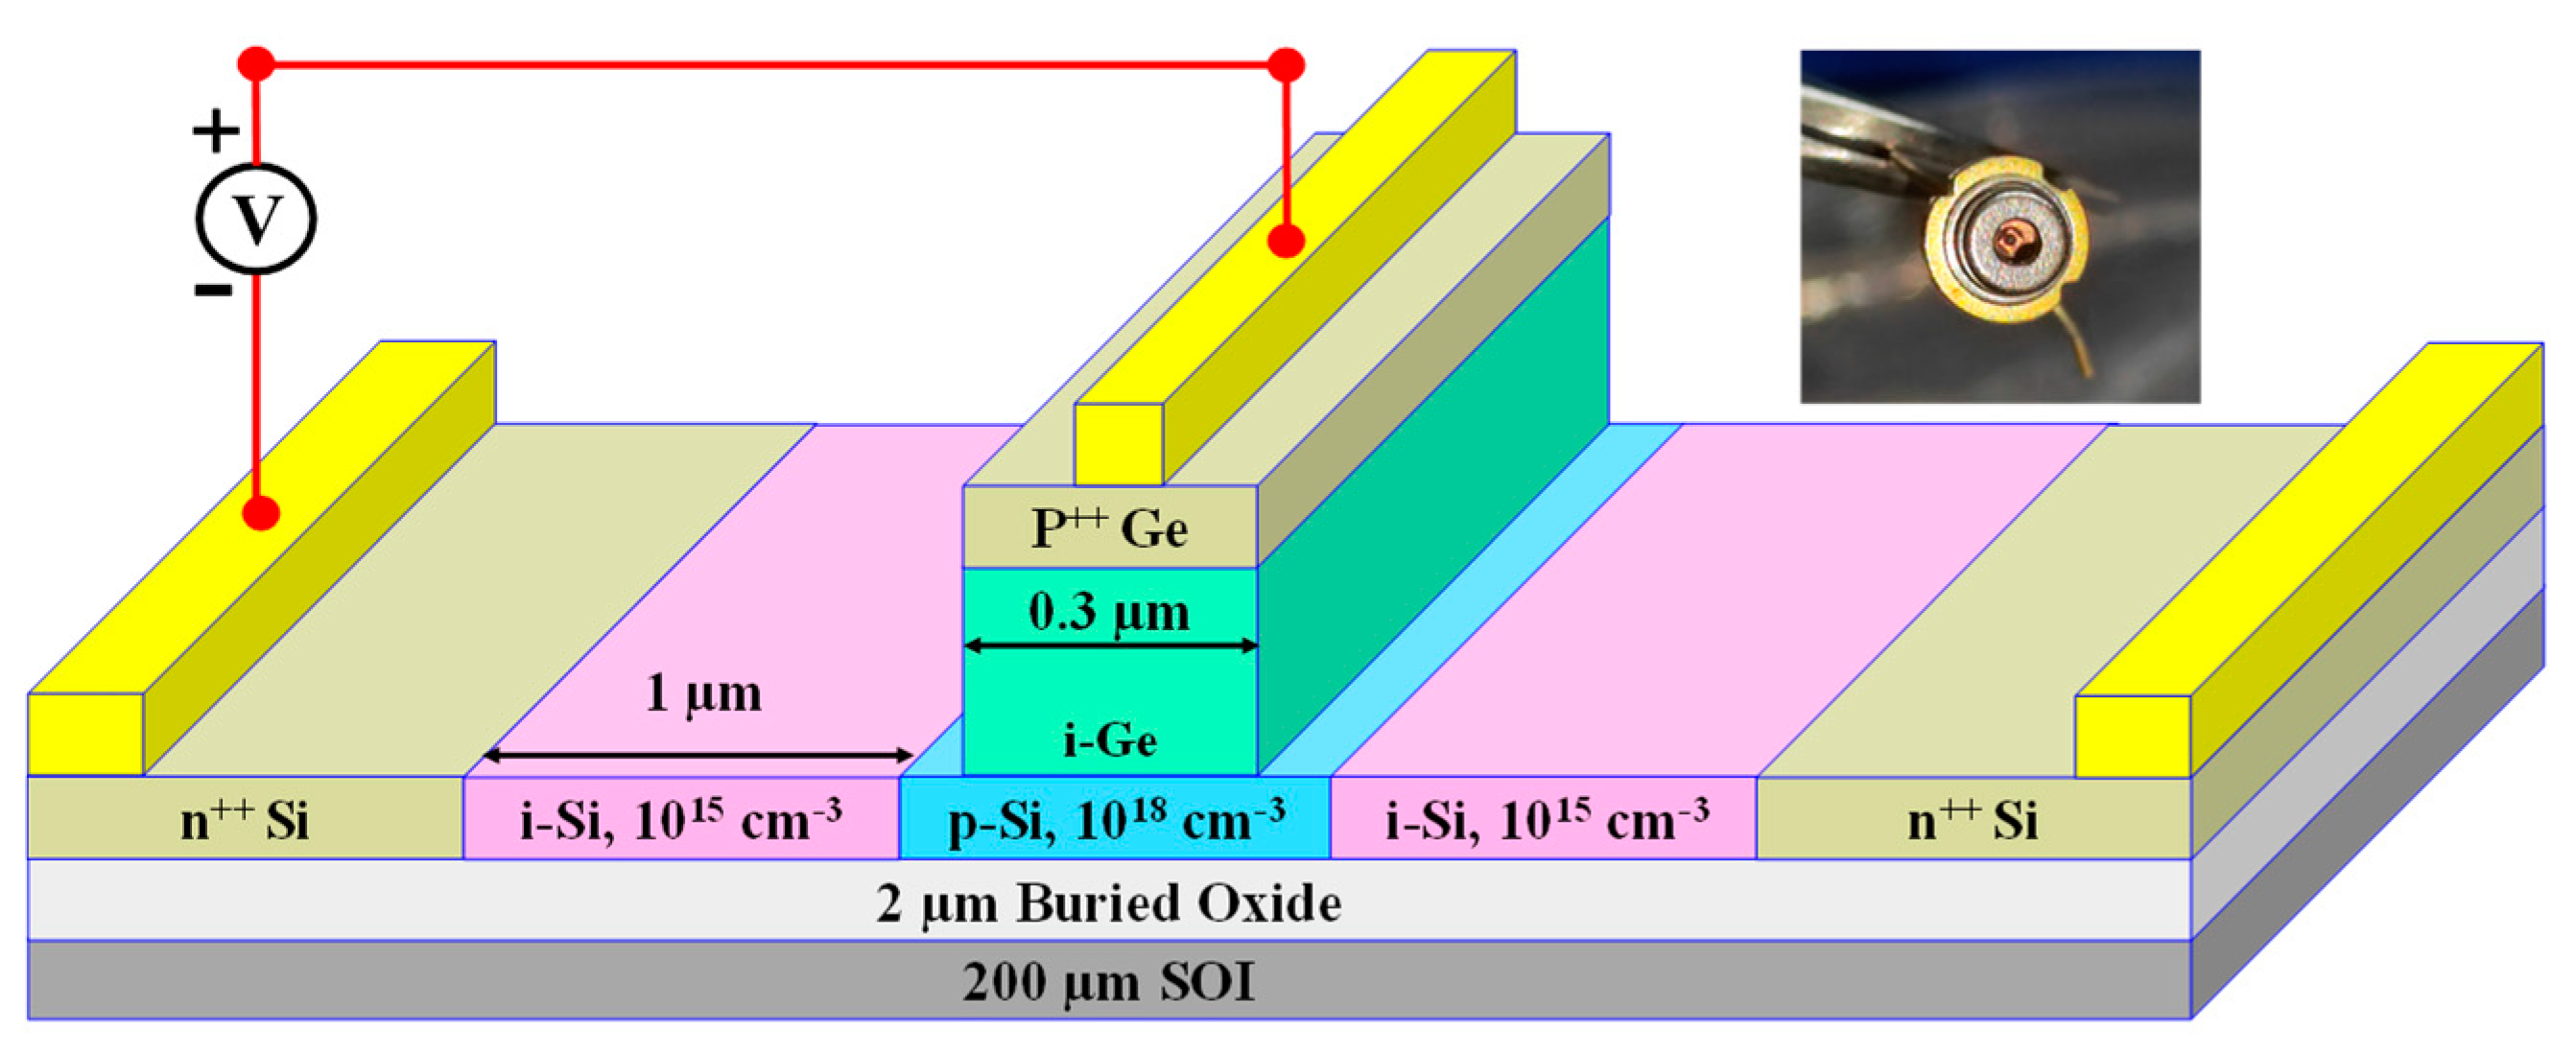
Figure 1. A 3D schematic showing doping of various regions in the Si layer, and epitaxial growth of Ge layers onto the charge layer in the implemented Ge-on-Si PD structure. The inset refers to the ready-for-testing packaged module, prepared after the device fabrication to facilitate electrical measurement.
Electronics 14 02982 g001
Figure 2. (a) Schematic diagram illustrating the dislocation distribution. Band diagrams (b) under forward and (c) reverse voltage bias, showing the possible dark current sources: the diffusion current (Idif), the generation-recombination current governed by the SRH process (ISRH), and the generation-recombination current enhanced by trap-assisted-tunneling (Iint) [33].
Electronics 14 02982 g002
Figure 3. For the employed lateral Ge-on-Si PD characterized by WM = 1 µm and WA = 0.3 µm, the current signatures under unmodulated illumination of 1550 nm wavelength laser are plotted simultaneously for intensities of 0.668, 5.21, 10.55, 25.7, and 47.6 mW/µm2.
Electronics 14 02982 g003
Figure 4. For the lateral Ge-on-Si PD, characterized by a WM of 1 µm and a WA of 0.3 µm, (a) the normalized photo-to-dark current ratio (NPDR) signatures are plotted under unmodulated illumination from a 1550 nm laser with intensities of 0.668, 5.21, 10.55, 25.7, and 47.6 mW/µm2. The inset shows the zoomed-in NPDR curves at the minimum and maximum illumination intensities. (b) The maximum variation of NPDRNPDR) with effects of the involved traps under employed illumination intensities is plotted against reverse bias p of −(0.365, 0.635, 0.77, 1.025, 1.25) V.
Electronics 14 02982 g004
Figure 5. For the lateral Ge-on-Si PD, characterized by a WM of 1 µm and a WA of 0.3 µm, (a) the noise-equivalent-power (NEP) signatures are plotted under unmodulated illumination from a 1550 nm laser with intensities of 0.668, 5.21, 10.55, 25.7, and 47.6 mW/µm2. The inset shows the zoomed-in NEP curves at the minimum and maximum illumination intensities. (b) The maximum variation of NEPNEP) with effects of the involved traps under employed illumination intensities are plotted against reverse bias of −(0.365, 0.645, 0.77, 1.025, 1.295) V.
Electronics 14 02982 g005
Figure 6. For the lateral Ge-on-Si PD, characterized by a WM of 1 µm and a WA of 0.3 µm, (a) the specific detectivity (D*) signatures are plotted under unmodulated illumination from a 1550 nm laser with intensities of 0.668, 5.21, 10.55, 25.7, and 47.6 mW/µm2. The inset provides a zoomed-in view of the D* curves corresponding to the minimum and maximum illumination power levels. (b) The maximum variation of D*D*) with effects of the involved traps under employed illumination intensities is plotted against reverse bias potentials of −(0.365, 0.645, 0.77, 1.025, 1.295) V.
Electronics 14 02982 g006
Figure 7. For the lateral Ge-on-Si PD, characterized by a WM of 1 µm and a WA of 0.3 µm, (a) the differential current response is plotted under pulsed illumination with an intensity of 1 mW/µm2 from a 1550 nm laser. The reverse bias is maintained at −2 V, while consecutive pulsed illumination events (ON duration of 10 ns) are uniformly spaced by 10 µs, corresponding to a repetition frequency of 100 kHz. (b) A zoomed-in view of the transient and pulsed photo-response is presented, with the inset showing curve fitting of the transient photo-response during the laser-off duration. (c) Differential current responses obtained under various chopper frequencies and a 100 kHz pulsed laser frequency are plotted against normalized time at a reverse bias of −2 V. (d) Power spectral densities (PSDs) are plotted as a function of frequency, which is evaluated by applying fast Fourier transform (FFT) on the curves of differential current versus time.
Electronics 14 02982 g007
Disclaimer/Publisher’s Note: The statements, opinions and data contained in all publications are solely those of the individual author(s) and contributor(s) and not of MDPI and/or the editor(s). MDPI and/or the editor(s) disclaim responsibility for any injury to people or property resulting from any ideas, methods, instructions or products referred to in the content.