Article

Research of 110 kV High-Voltage Measurement Method Based on Rydberg Atoms

1
School of Computer Science, Northeast Electric Power University, Jilin City 132012, China
2
China Electric Power Research Institute, Beijing 100192, China
3
State Grid Nanjing Power Supply Company, Nanjing 210000, China
4
Beijing Institute of Aerospace Control Devices, Beijing 100192, China
*
Author to whom correspondence should be addressed.
Electronics 2025, 14(15), 2932; https://doi.org/10.3390/electronics14152932
Submission received: 28 April 2025 / Revised: 20 June 2025 / Accepted: 7 July 2025 / Published: 23 July 2025

Abstract

Accurate measurement of high voltages is required to guarantee the safe and stable operation of power systems. Modern power systems, which are mainly based on new energy sources, require high-voltage measurement instruments and equipment with characteristics such as high accuracy, wide frequency bandwidth, broad operating ranges, and ease of operation and maintenance. However, it is difficult for traditional electromagnetic measurement transformers to meet these requirements. To address the limitations of conventional Rydberg atomic measurement methods in low-frequency applications, this paper proposes an enhanced Rydberg measurement approach featuring high sensitivity and strong traceability, thereby enabling the application of Rydberg-based measurement methodologies under power frequency conditions. In this paper, a 110 kV high-voltage measurement method based on Rydberg atoms is studied. A power-frequency electric field measurement device is designed using Rydberg atoms, and its internal electric field distribution is analyzed. Additionally, a decoupling method is proposed to facilitate voltage measurements under multi-phase overhead lines in field conditions. The feasibility of the proposed method is confirmed, providing support for the future development of practical measurement devices.

1. Introduction

The development of ultra-high voltage (UHV) transmission projects in China has significantly increased the demand for electric field monitoring around transmission lines and substations [1,2]. While traditional DC/power frequency measurement methods [3,4] face challenges in terms of stability and accuracy [5], Rydberg atom-based sensors demonstrate prominent advantages—including strong traceability, high stability, and superior precision—making them highly promising for measuring electric fields from electrostatic to microwave frequencies, highlighting their significant research potential and practical application value.
Currently, numerous studies have been conducted on the interaction between Rydberg electromagnetically induced transparency (EIT) and microwave fields in the field of Rydberg atomic detection. Scholars from both domestic and international communities have proposed various microwave electric field measurement techniques, such as the superheterodyne method [6], optical repumping technique [7], ultracold atomic system approach [8], and cavity-enhanced detection method [9], which have achieved outstanding experimental results. But there have been few studies of Rydberg atoms in the fields of DC and power frequency voltage measurements worldwide. In terms of DC/power frequency electric field strength and frequency measurement, Ref. [10] first analyzed the relationship between EIT and the amplitude and frequency of the power frequency electric field and then completed preparation of the 20S1/2 Rydberg state of cesium atoms using two-photon excitation. Finally, they completed measurement of the Rydberg state under a power frequency electric field based on EIT theory. Ref. [11] also used the two-photon excitation method to prepare the 53S1/2 Rydberg state of cesium atoms and then changed the amplitude of the radio frequency electric field to determine the relationship between EIT and the electric field amplitude. The experimental results demonstrate that the measured field strength sensitivity reaches 0.37 V/cm, the measurement dynamic range achieves 37.2 dB, and precise measurement of the power frequency electric field is simultaneously obtained with a measurement uncertainty better than 0.1%. Ref. [12] presented a study of atomic displacement based on the principle of EIT. The results of this study indicated that the atomic displacement can be applied to the measurement and calibration of both DC and AC voltages. Ref. [13] employed electromagnetically induced transparency (EIT) as an all-optical readout to perform spectroscopic analysis of Rydberg atoms in strong microwave electric fields. The microwave two-photon transition achieved a field strength of 230 V/m, with experimental results demonstrating an absolute measurement accuracy of 6% for strong-field measurements. Ref. [14] utilized the Rydberg resonance principle in atomic vapor cells to measure high-intensity VHF-band radio-frequency electric fields. The measurement process achieved frequency and electric field amplitude accuracies of 1.0% and 1.5%, respectively. Ref. [15] developed an atomic Stark shift-based method for measuring both DC and 60 Hz AC voltages, which was subsequently applied to the calibration of voltage measurement instruments. The paper also discussed the essential steps for developing Rydberg atom-based voltage measurements as a supplementary method for direct dissemination of voltage standards to end-users, demonstrating significant practical relevance. Ref. [16] prepared Rydberg state atoms using three-photon electromagnetically induced transparency and radio frequency fields. By generating localized DC electric fields on the inner walls of a vapor cell through laser irradiation and photoelectric effects, DC field strength measurements in the range of 8 ± 2 V/m to 50 ± 8 V/m were ultimately achieved. Ref. [17] measured a DC electric field of approximately 5 V/cm in a rubidium atomic vapor cell using the Stark effect, with a relative uncertainty of 10%. By comparing the measurement results with calculated DC field values, this method enabled the quantification of electric field attenuation caused by free surface charges within the vapor cell.
In terms of optimizing system architecture and measurement methodologies, Ref. [18] conducted simulation analyses on calcium fluoride (CaF2) vapor cells. The results demonstrated that even after cesium atom adsorption, the CaF2 material retains excellent insulating properties, making it suitable for electric field measurements in the tens of hertz frequency range while significantly reducing the vapor cell’s shielding effects on low-frequency electric fields. Using the stepped EIT three-level structure of Rydberg atoms, Ref. [19] explained the frequency shift mechanism of the energy levels of Rydberg atoms under the action of an electric field. Then, based on this mechanism, they developed a miniature all-fiber-structured electric field sensor without metal intervention that was immune to temperature changes. Experimental results showed that their sensor could measure the frequency shift in the EIT accurately. Ref. [20] described the principle of power frequency electric field measurement modulated in the radio frequency field and then built a two-photon system and a power frequency electric field measurement device on this basis. In their experiment, the cesium atomic vapor cell was wrapped in magnetic shielding material and equipped with a temperature control device, minimizing interference from external magnetic fields and temperature fluctuations. By adopting a design featuring both experimental and reference optical paths, they obtained reference EIT spectra free from external field disturbances, enabling precise calibration of the resonance frequency in the EIT spectrum. Additionally, differential detection was implemented in the experimental optical path to enhance the signal-to-noise ratio, further improving the accuracy of the experiment. Ref. [11] established a Rydberg model under the action of a radio frequency field and then measured the power frequency electric field using a quantum measurement method. Simulation results showed that their proposed method provided high measurement accuracy and a broad measurement range, enabling plasticity measurement of the power frequency electric field. This capability was experimentally demonstrated by the setup, which achieved traceable measurement of power-frequency electric field strength with a sensitivity reaching 0.37 V/cm and an amplitude measurement dynamic range of up to 37.2 dB while simultaneously attaining precise measurement of the field frequency with uncertainty better than 0.1%.The techniques discussed above all used the external electromagnetic sensitivity of the Rydberg atoms to measure the DC and power frequency electric fields accurately, but the measured voltage levels were all low: for example, the electric field intensities tested in Ref. [19] were 0.4 V/cm and 0.6 V/cm, which would be difficult to adapt to meet the requirements of DC and power frequency electric field measurements performed at voltage levels of 110 kV and above.

2. Measurement Principle of Power Frequency Electric Field Based on Rydberg Atoms

The electric field sensing principle of Rydberg atoms is mainly based on the EIT effect and the Stark effect [21]. The EIT effect is a type of nonlinear quantum coherence optical effect that is manifested by the interaction between laser light and atoms. Specifically, a weak detection light beam with a specific resonance frequency is introduced to excite at-oms from the ground state to the first excited state, and these atoms absorb the photons to cause the spectrum to appear to be in a “dark state”; a strongly coupled light beam at another frequency is then introduced to excite these atoms further to the Rydberg state. At the same time, because of the quantum interference cancelation effect, the optical absorption characteristics of these atoms change significantly, and a narrow transparent window is formed near the resonance frequency of the detected light field as a result.
The Stark effect refers to the fine energy level splitting within the atoms that is caused by the coherent interaction between the Rydberg atoms and the non-resonant outer field, and it is manifested as a frequency shift in the EIT spectrum. Before an avoided crossing of the energy levels occurs, the quadratic relationship between the electric field intensity E and the Stark frequency shift Δ is as shown in Equation (1), and a schematic diagram of this relationship is shown in Figure 1.
Δ = E 2 2 [ α 0 + α 2 3 m j 2 j ( j + 1 ) j ( 2 j + 1 ) ] = 1 2 α E 2
where α 0 and α 2 are the scalar and tensor polarizabilities of the Rydberg atoms, respectively; j and m j are the total angular and magnetic quantum numbers, respectively; and α 0 and α 2 are the atomic polarizabilities; and α is the Atomic polarizability.
The atomic polarizability is a physical quantity that describes the response of an atomic energy level to an applied electric field intensity, which can be expressed as follows:
α = 2 e 2 n l R n l n l W n l W n l
where α is the Atomic polarizability, and e is the elemental charge; W n l and W n l are the atomic energies in the n l and n l states, respectively; and R n l n l = n l r n l is the dipolar transition matrix element.
In Equation (2), the error for α mainly comes from the theoretical calculation of R n l n l , and it is possible to solve for the atomic energy states W n l and W n l in the denominator accurately using numerical methods in a quantum mechanics framework. According to Boer theory, the difference between the two states is equal to the energy absorbed or radiated by their photons with frequency v, i.e.,
W n l W n l = h v ,
where h is the Planck constant, h = 6.626070150 ( 69 ) × 10 34   J s ; and v is strictly equal to the transition frequency of n l n l .
When Equations (1)–(3) are combined, the results show that the key factor that enables self-calibration measurements of the electric field intensity using Rydberg atoms is that the quadratic of the electric field intensity is related directly to the atomic polarizability, and the atomic polarizability is related to fundamental physical constants such as e and h. In other words, the atomic polarizability is dependent on its own fixed properties, and it does not change with variations in the external environment. This demonstrates that measuring the magnitude of the EIT spectral frequency shift caused by the Stark effect of Rydberg atoms under the action of an external field allows the electric field intensity to be traced directly to these fundamental physical constants.

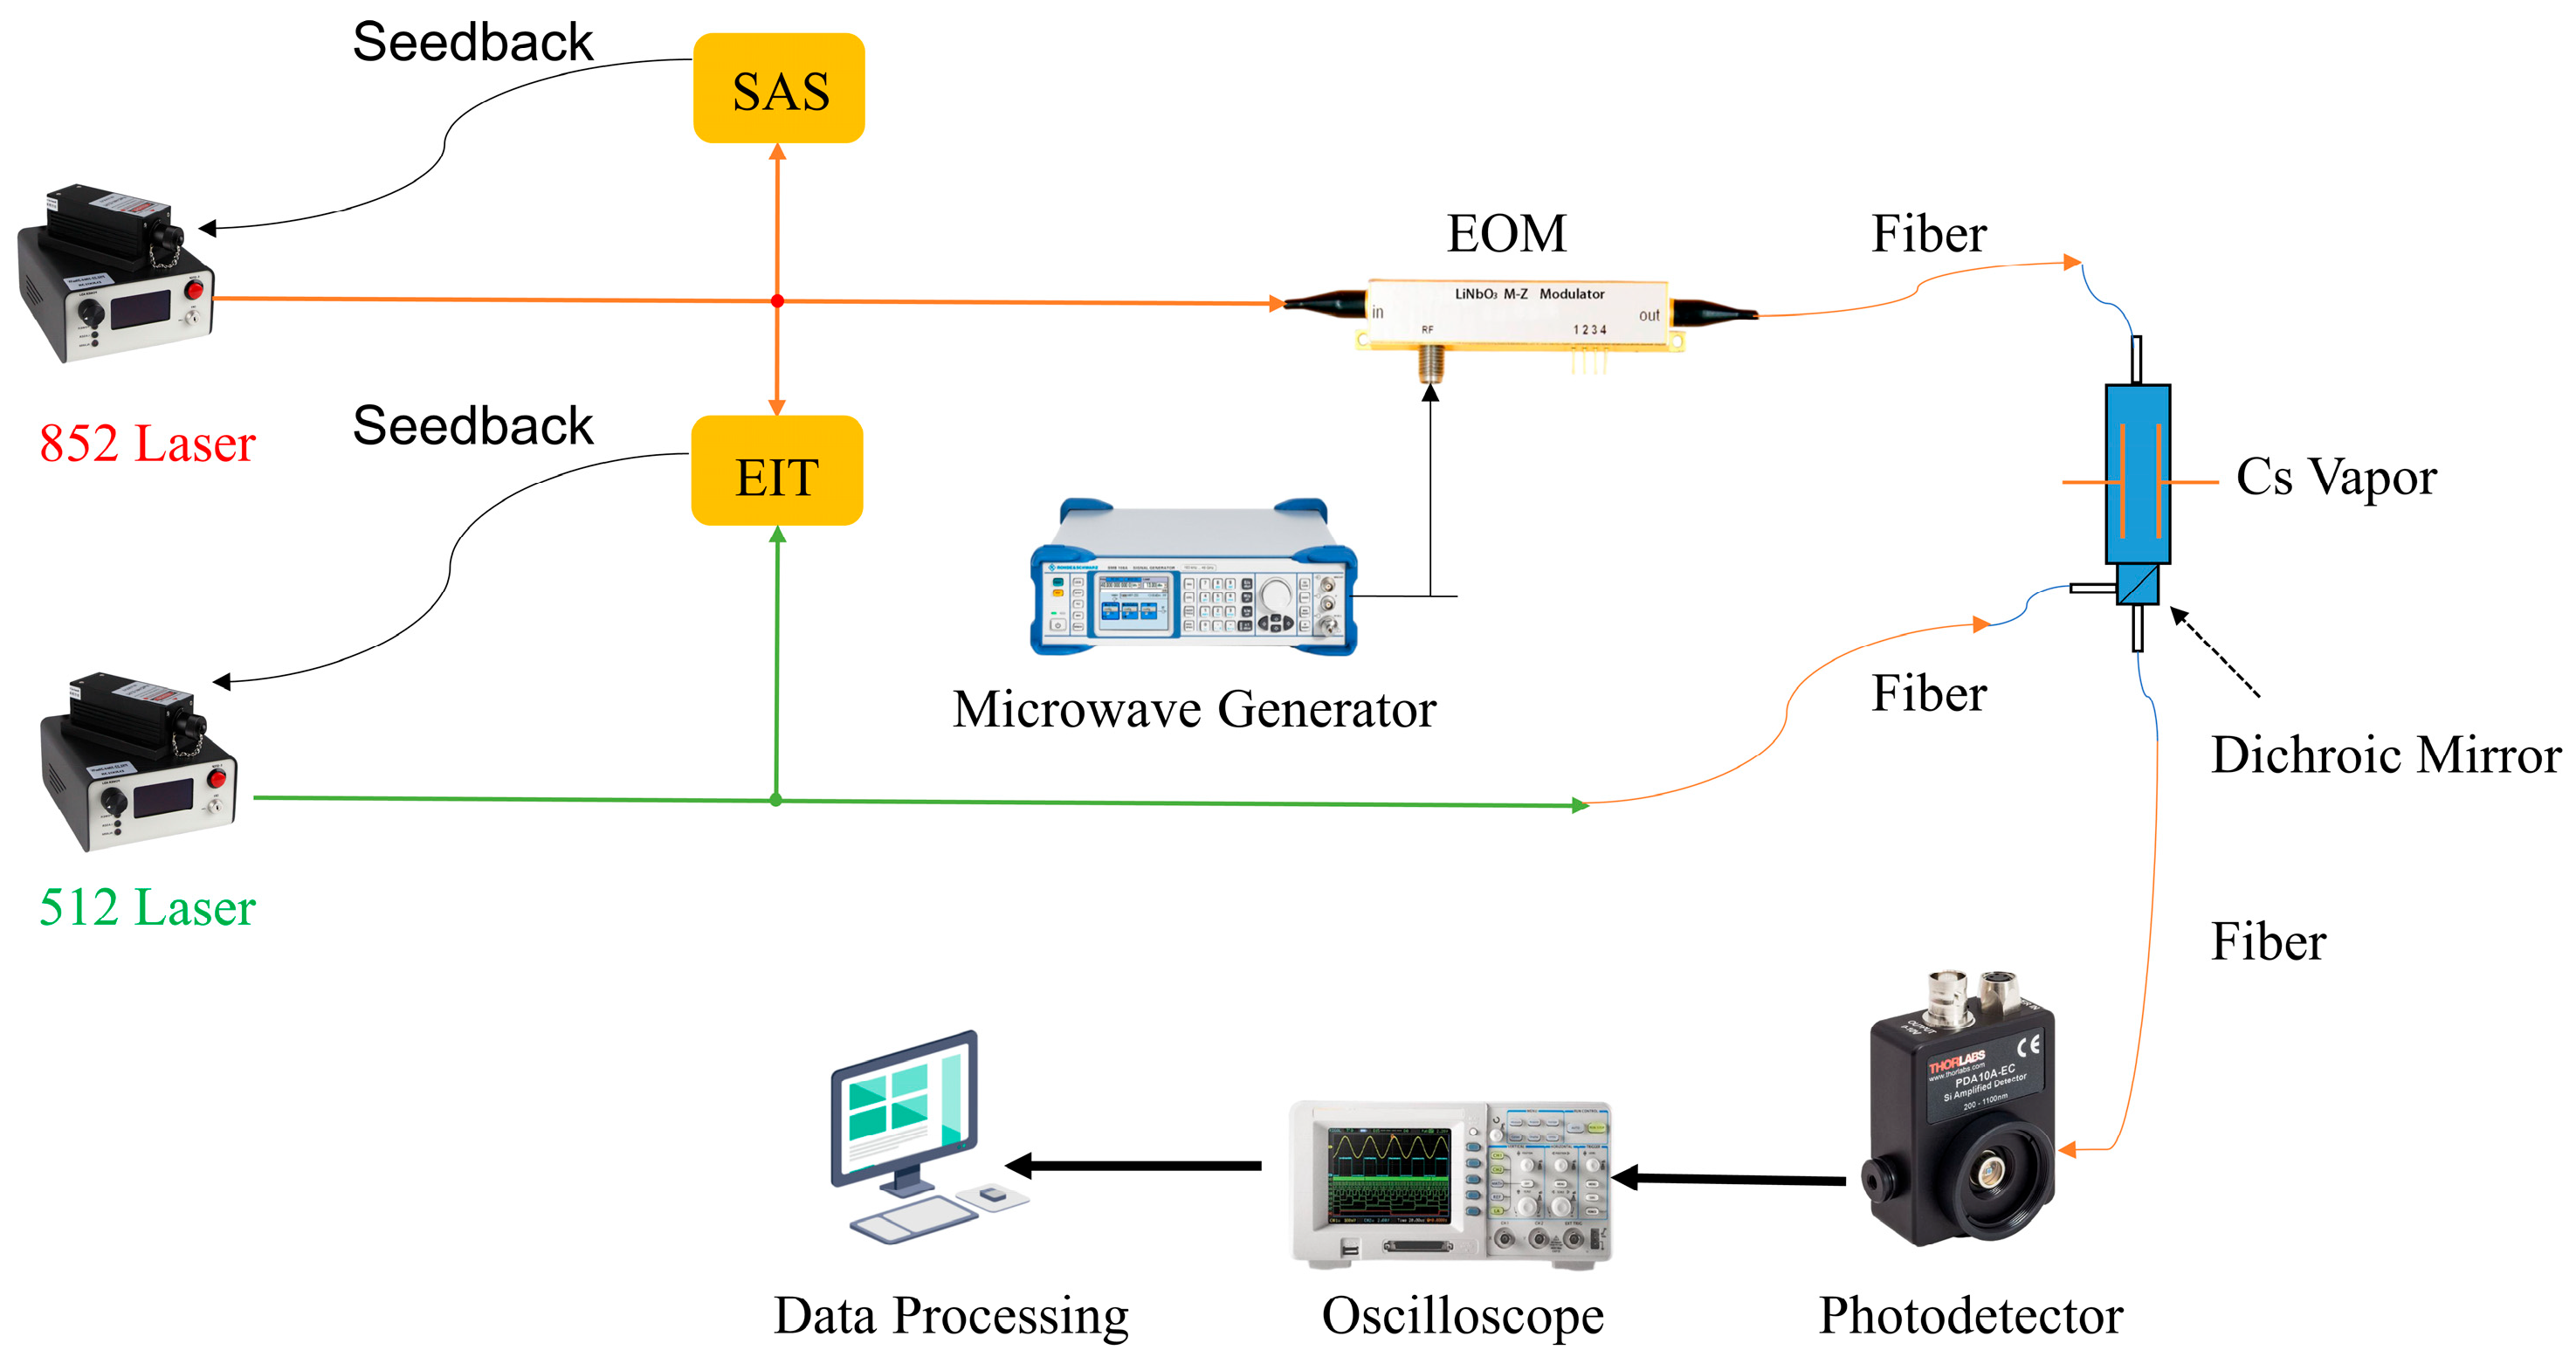
3. Experimental Device

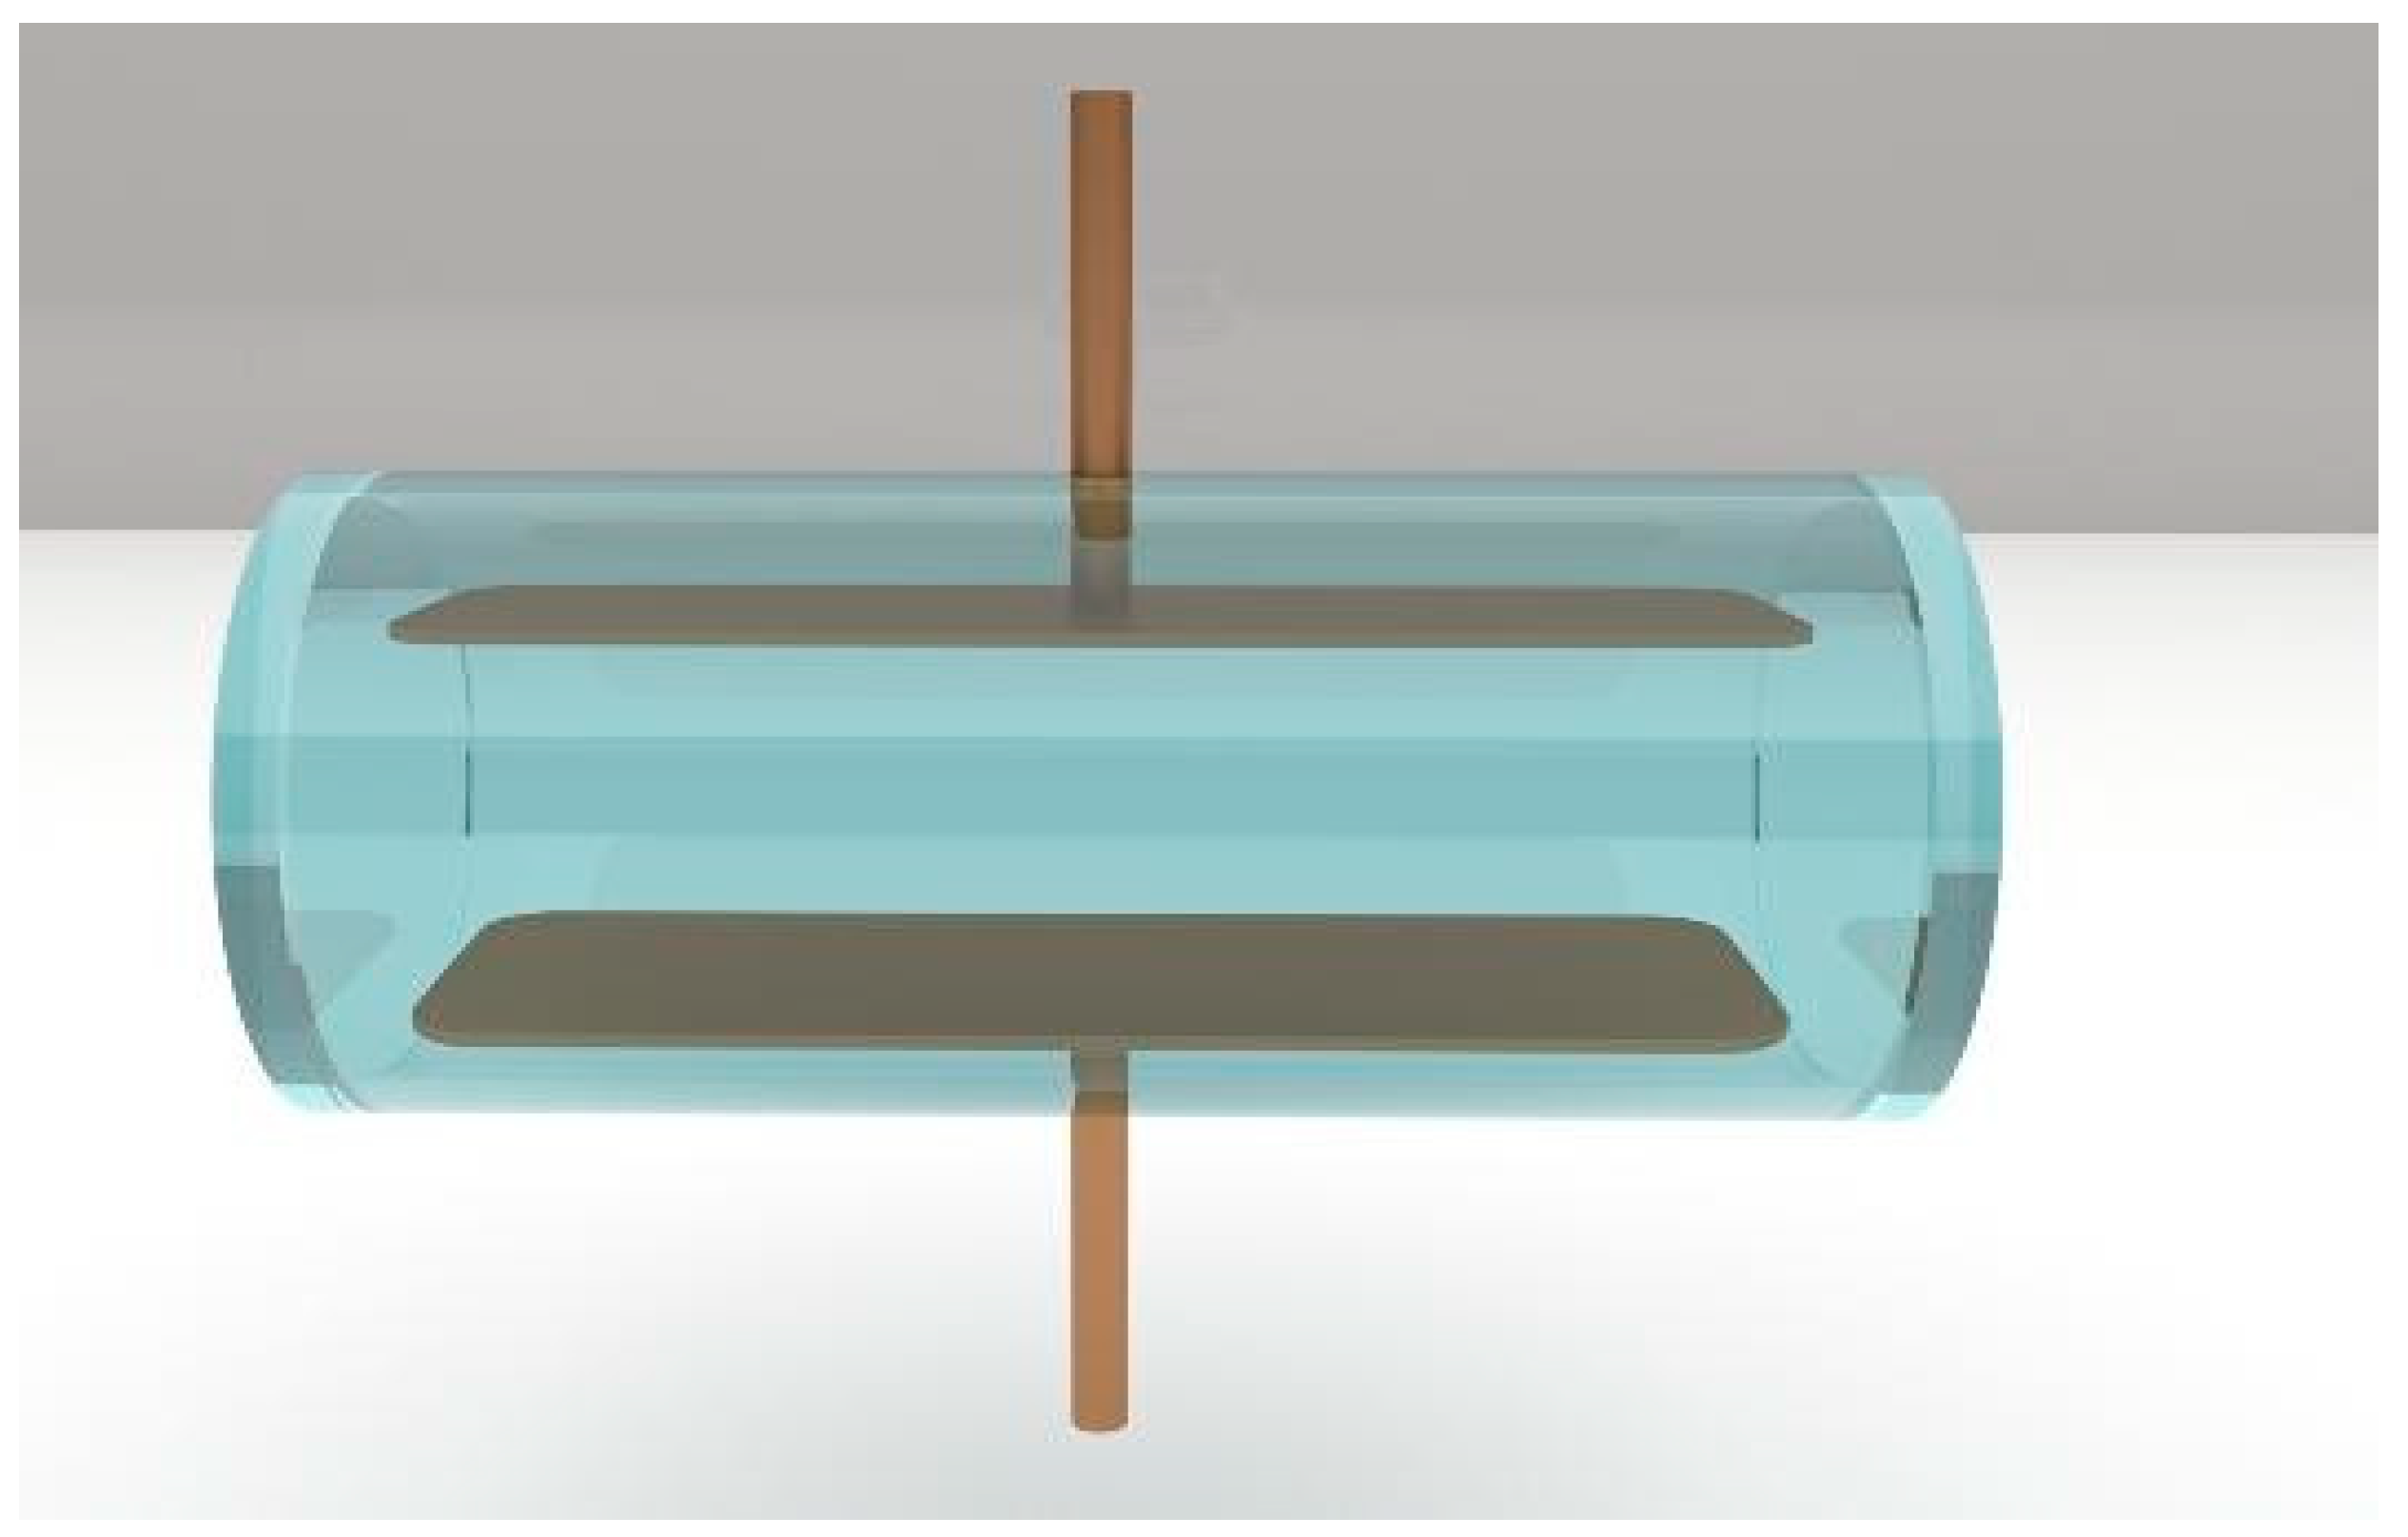
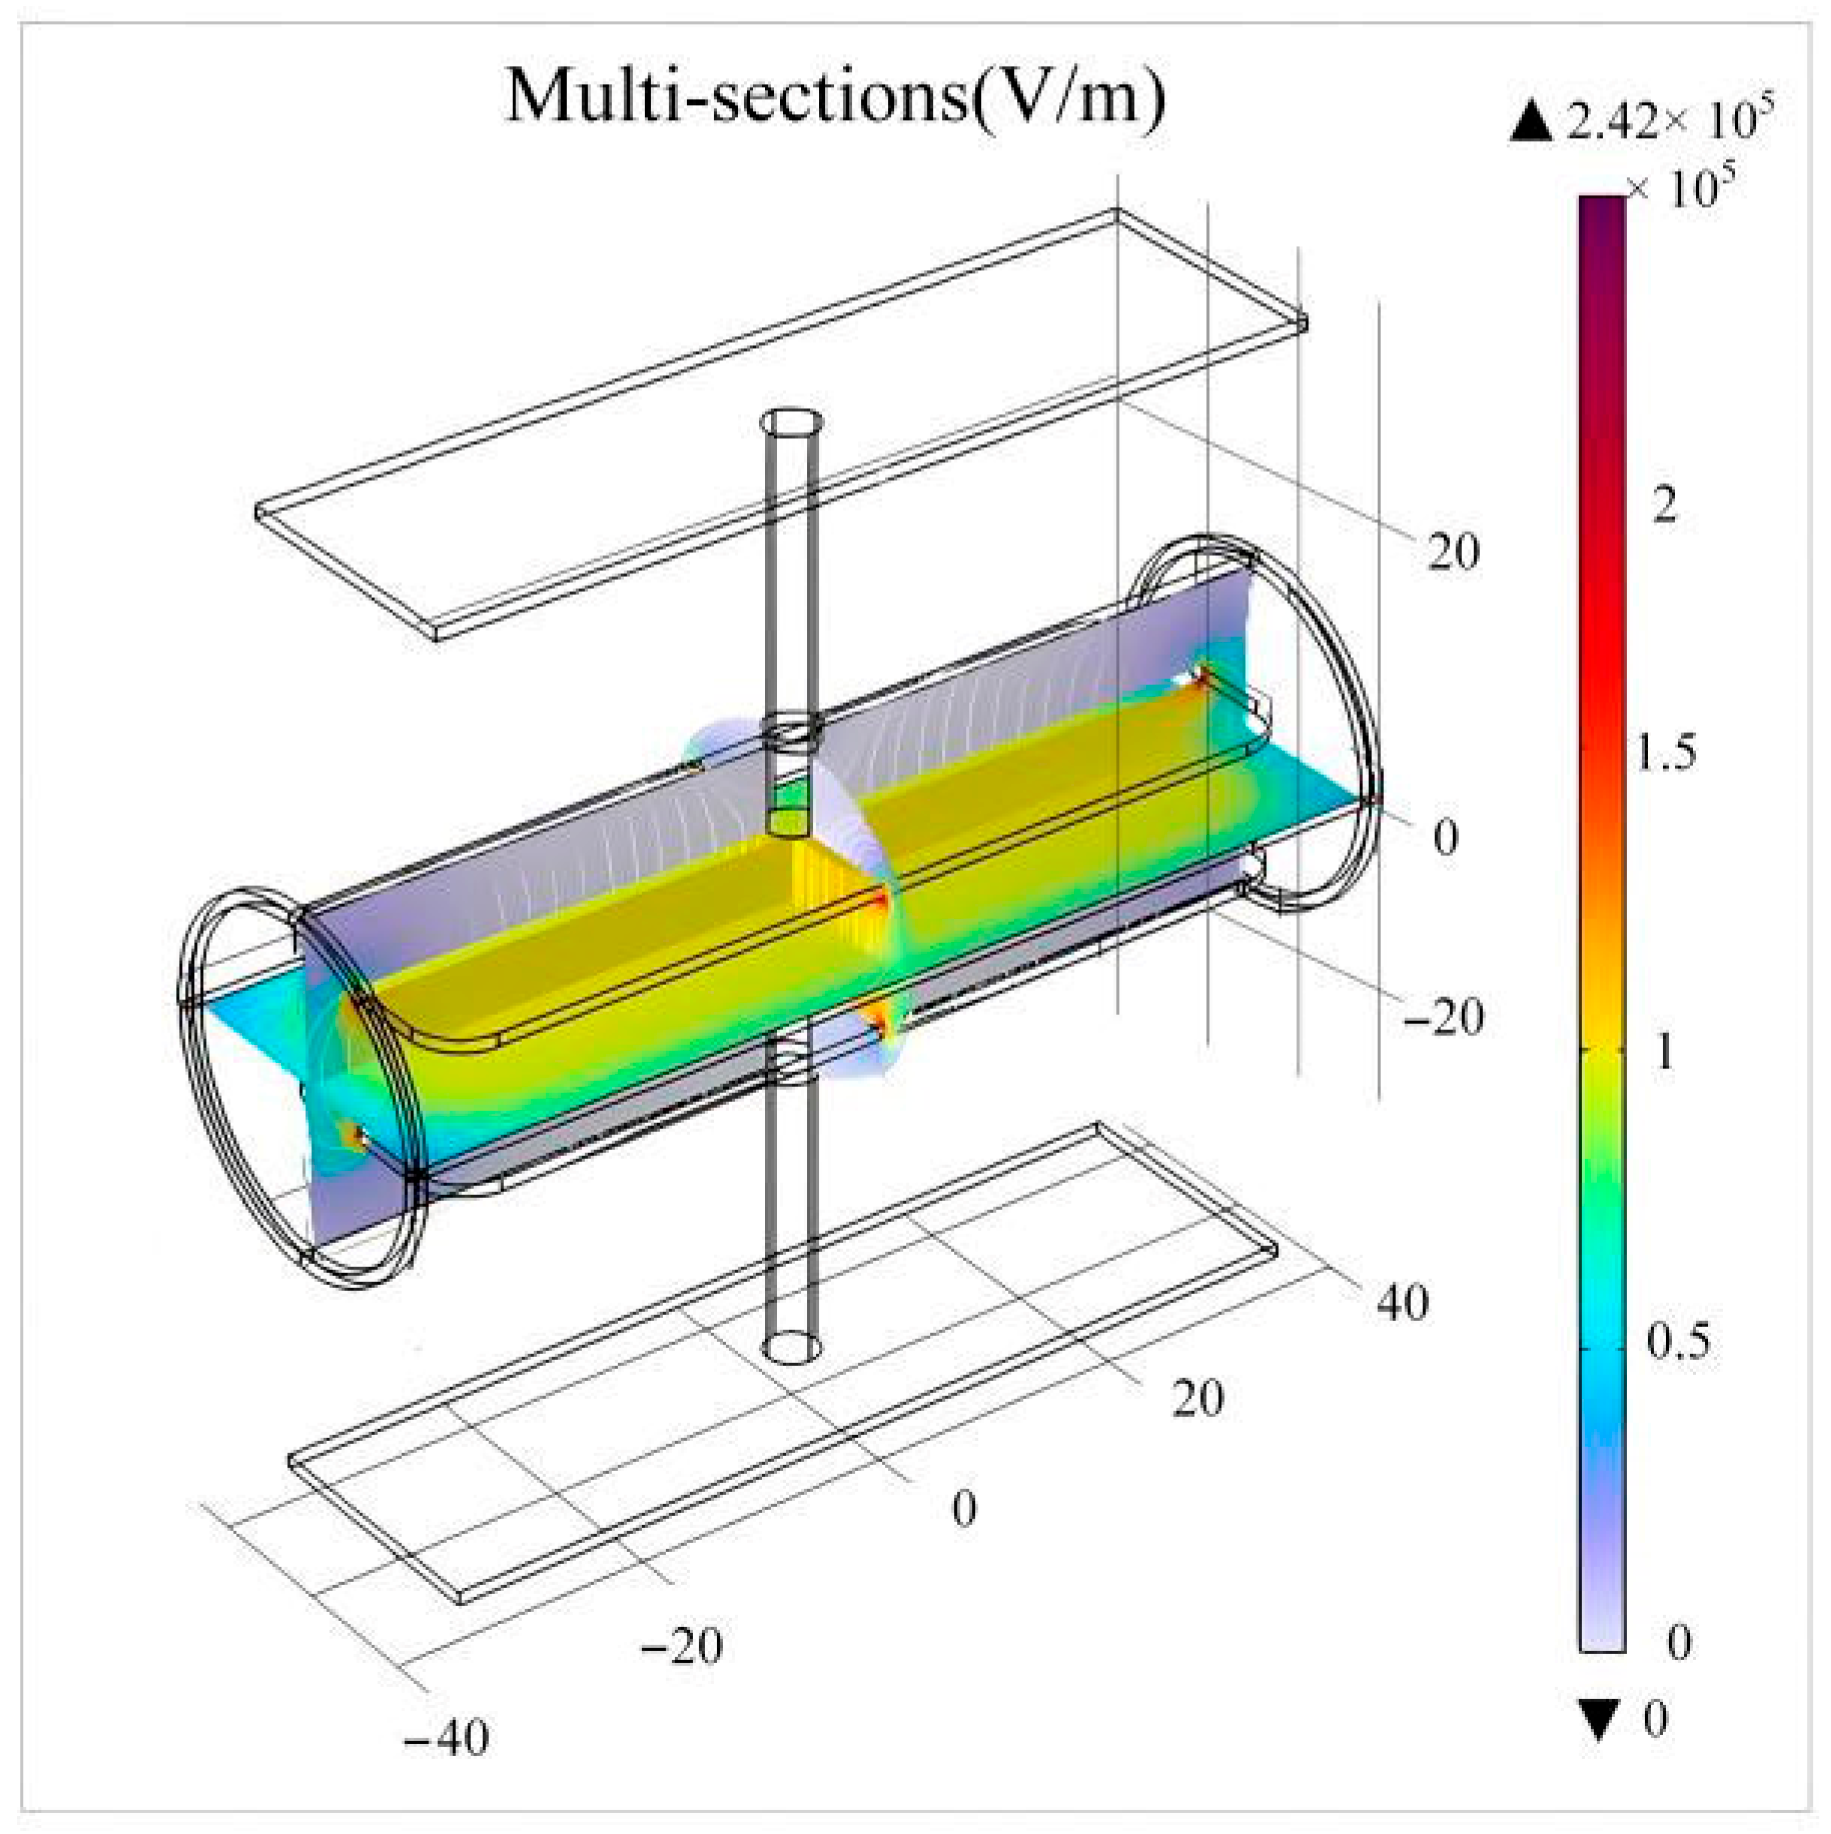
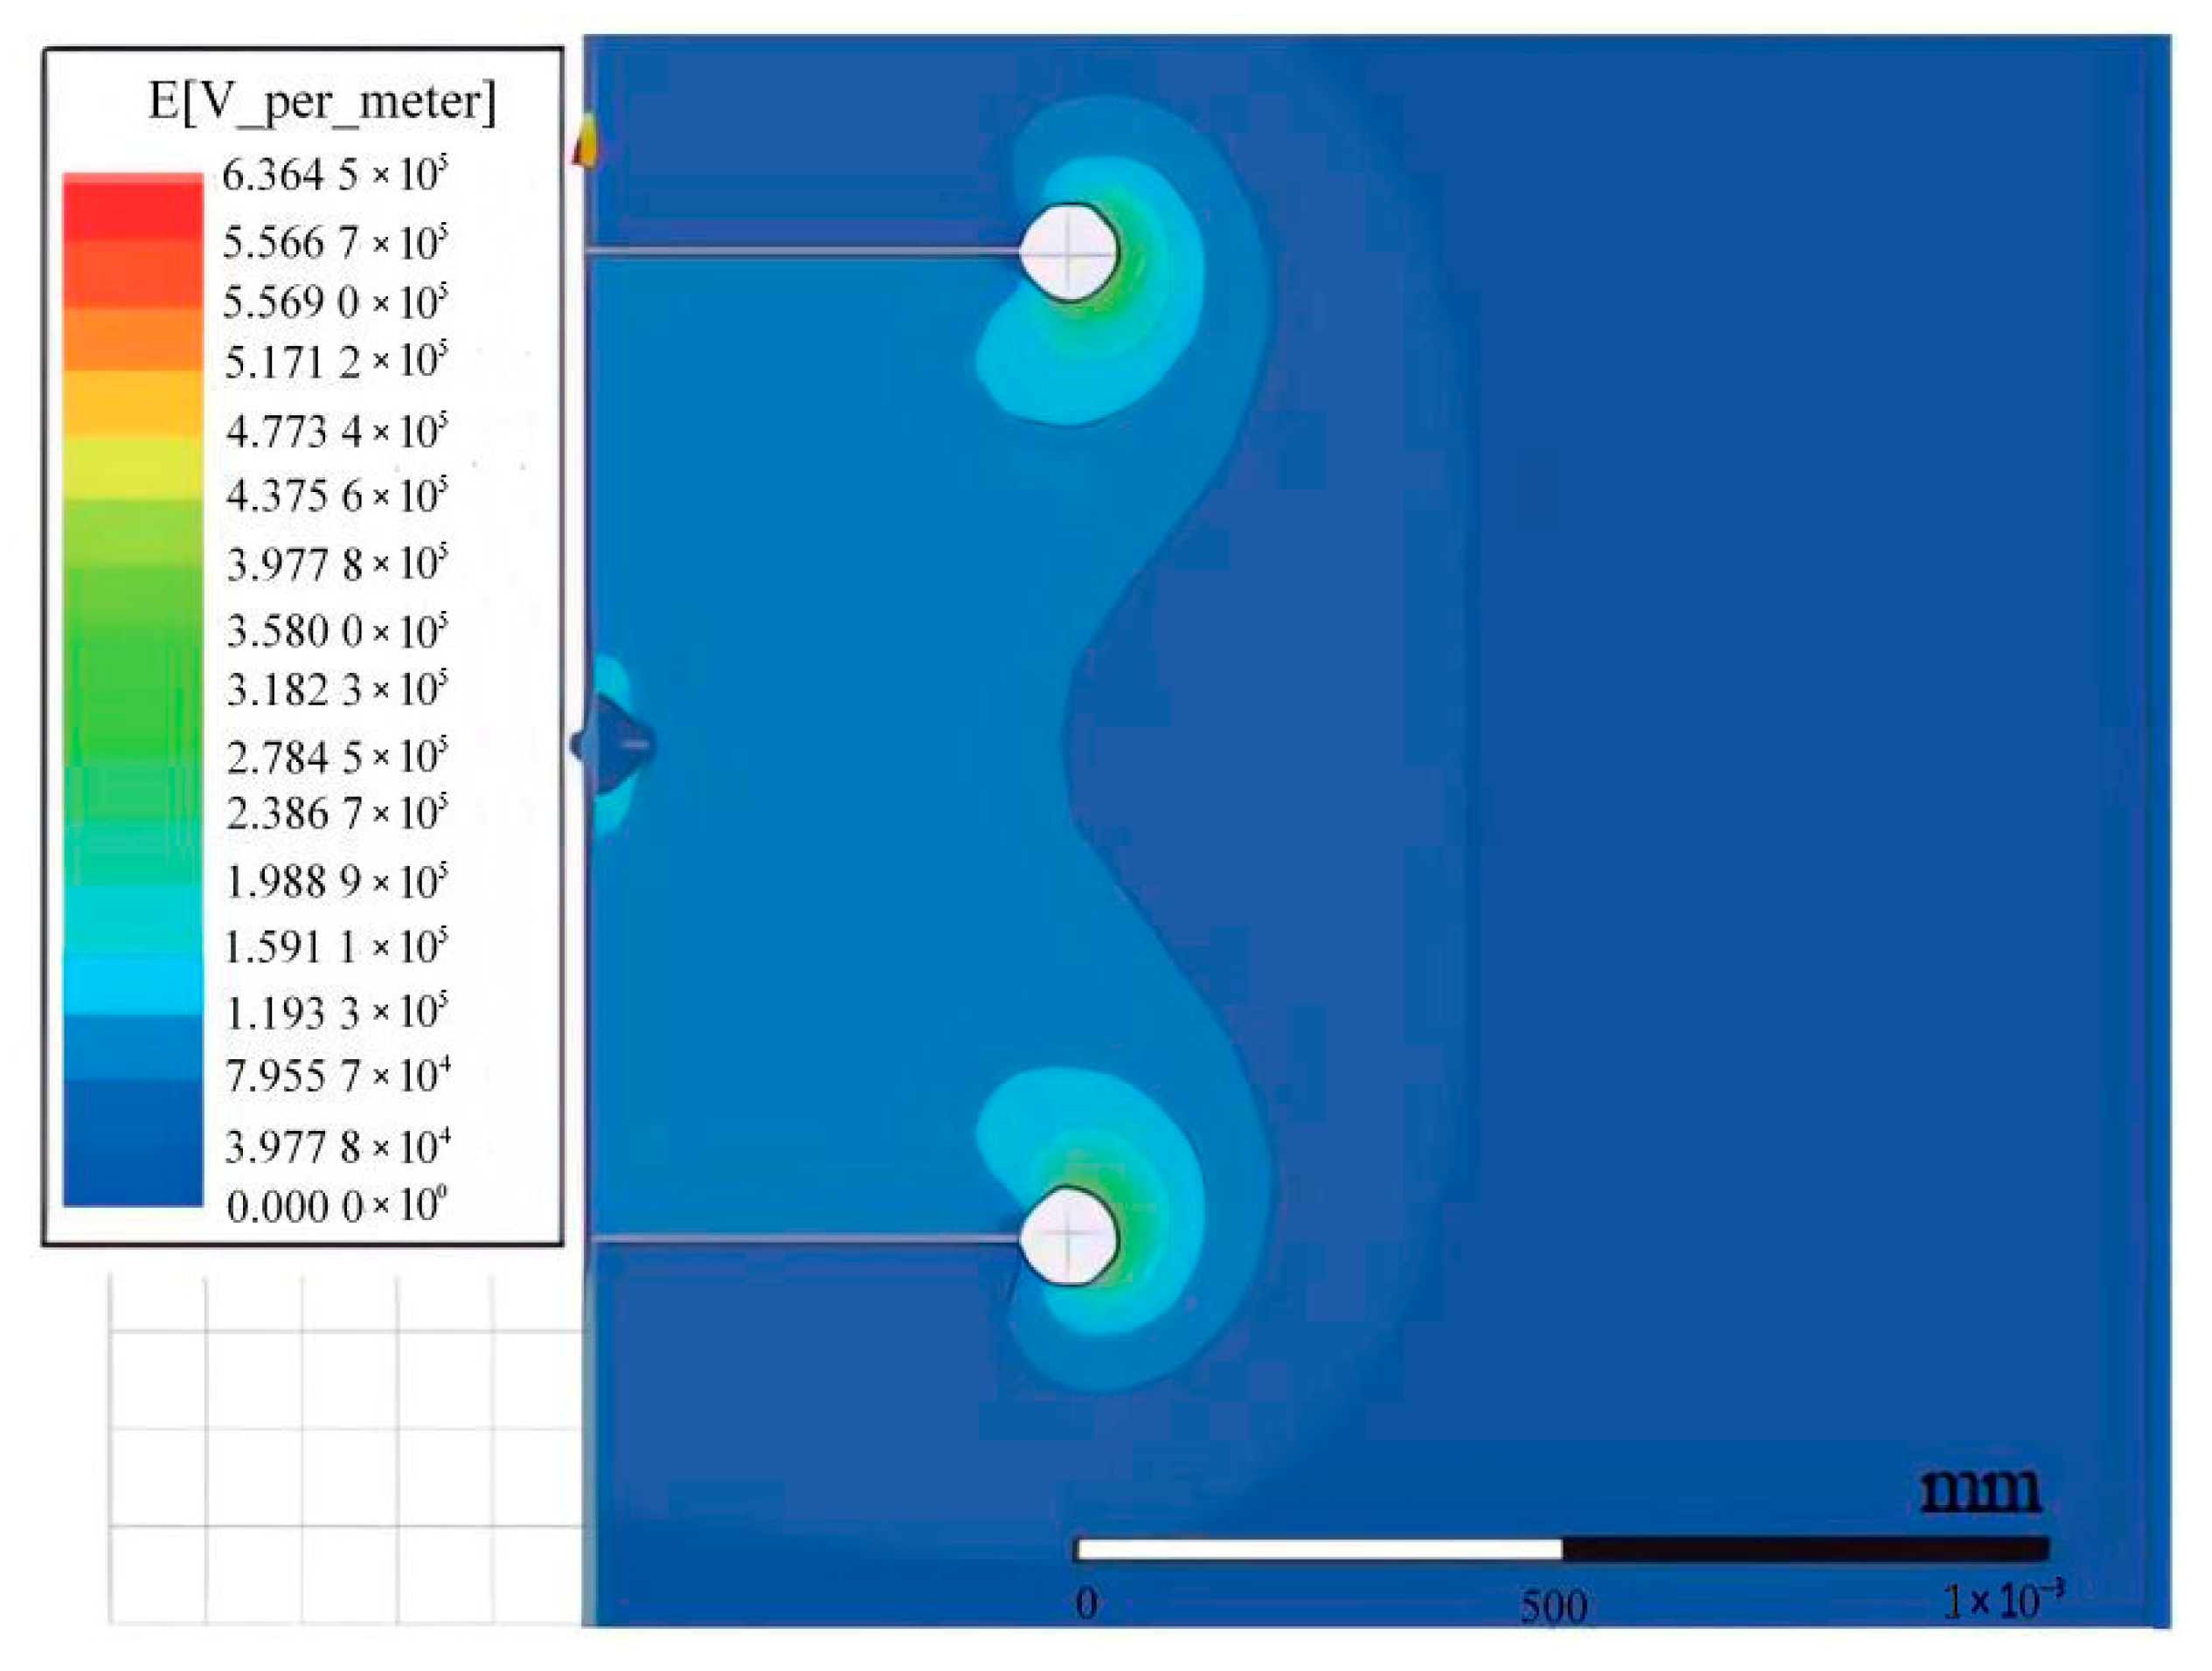
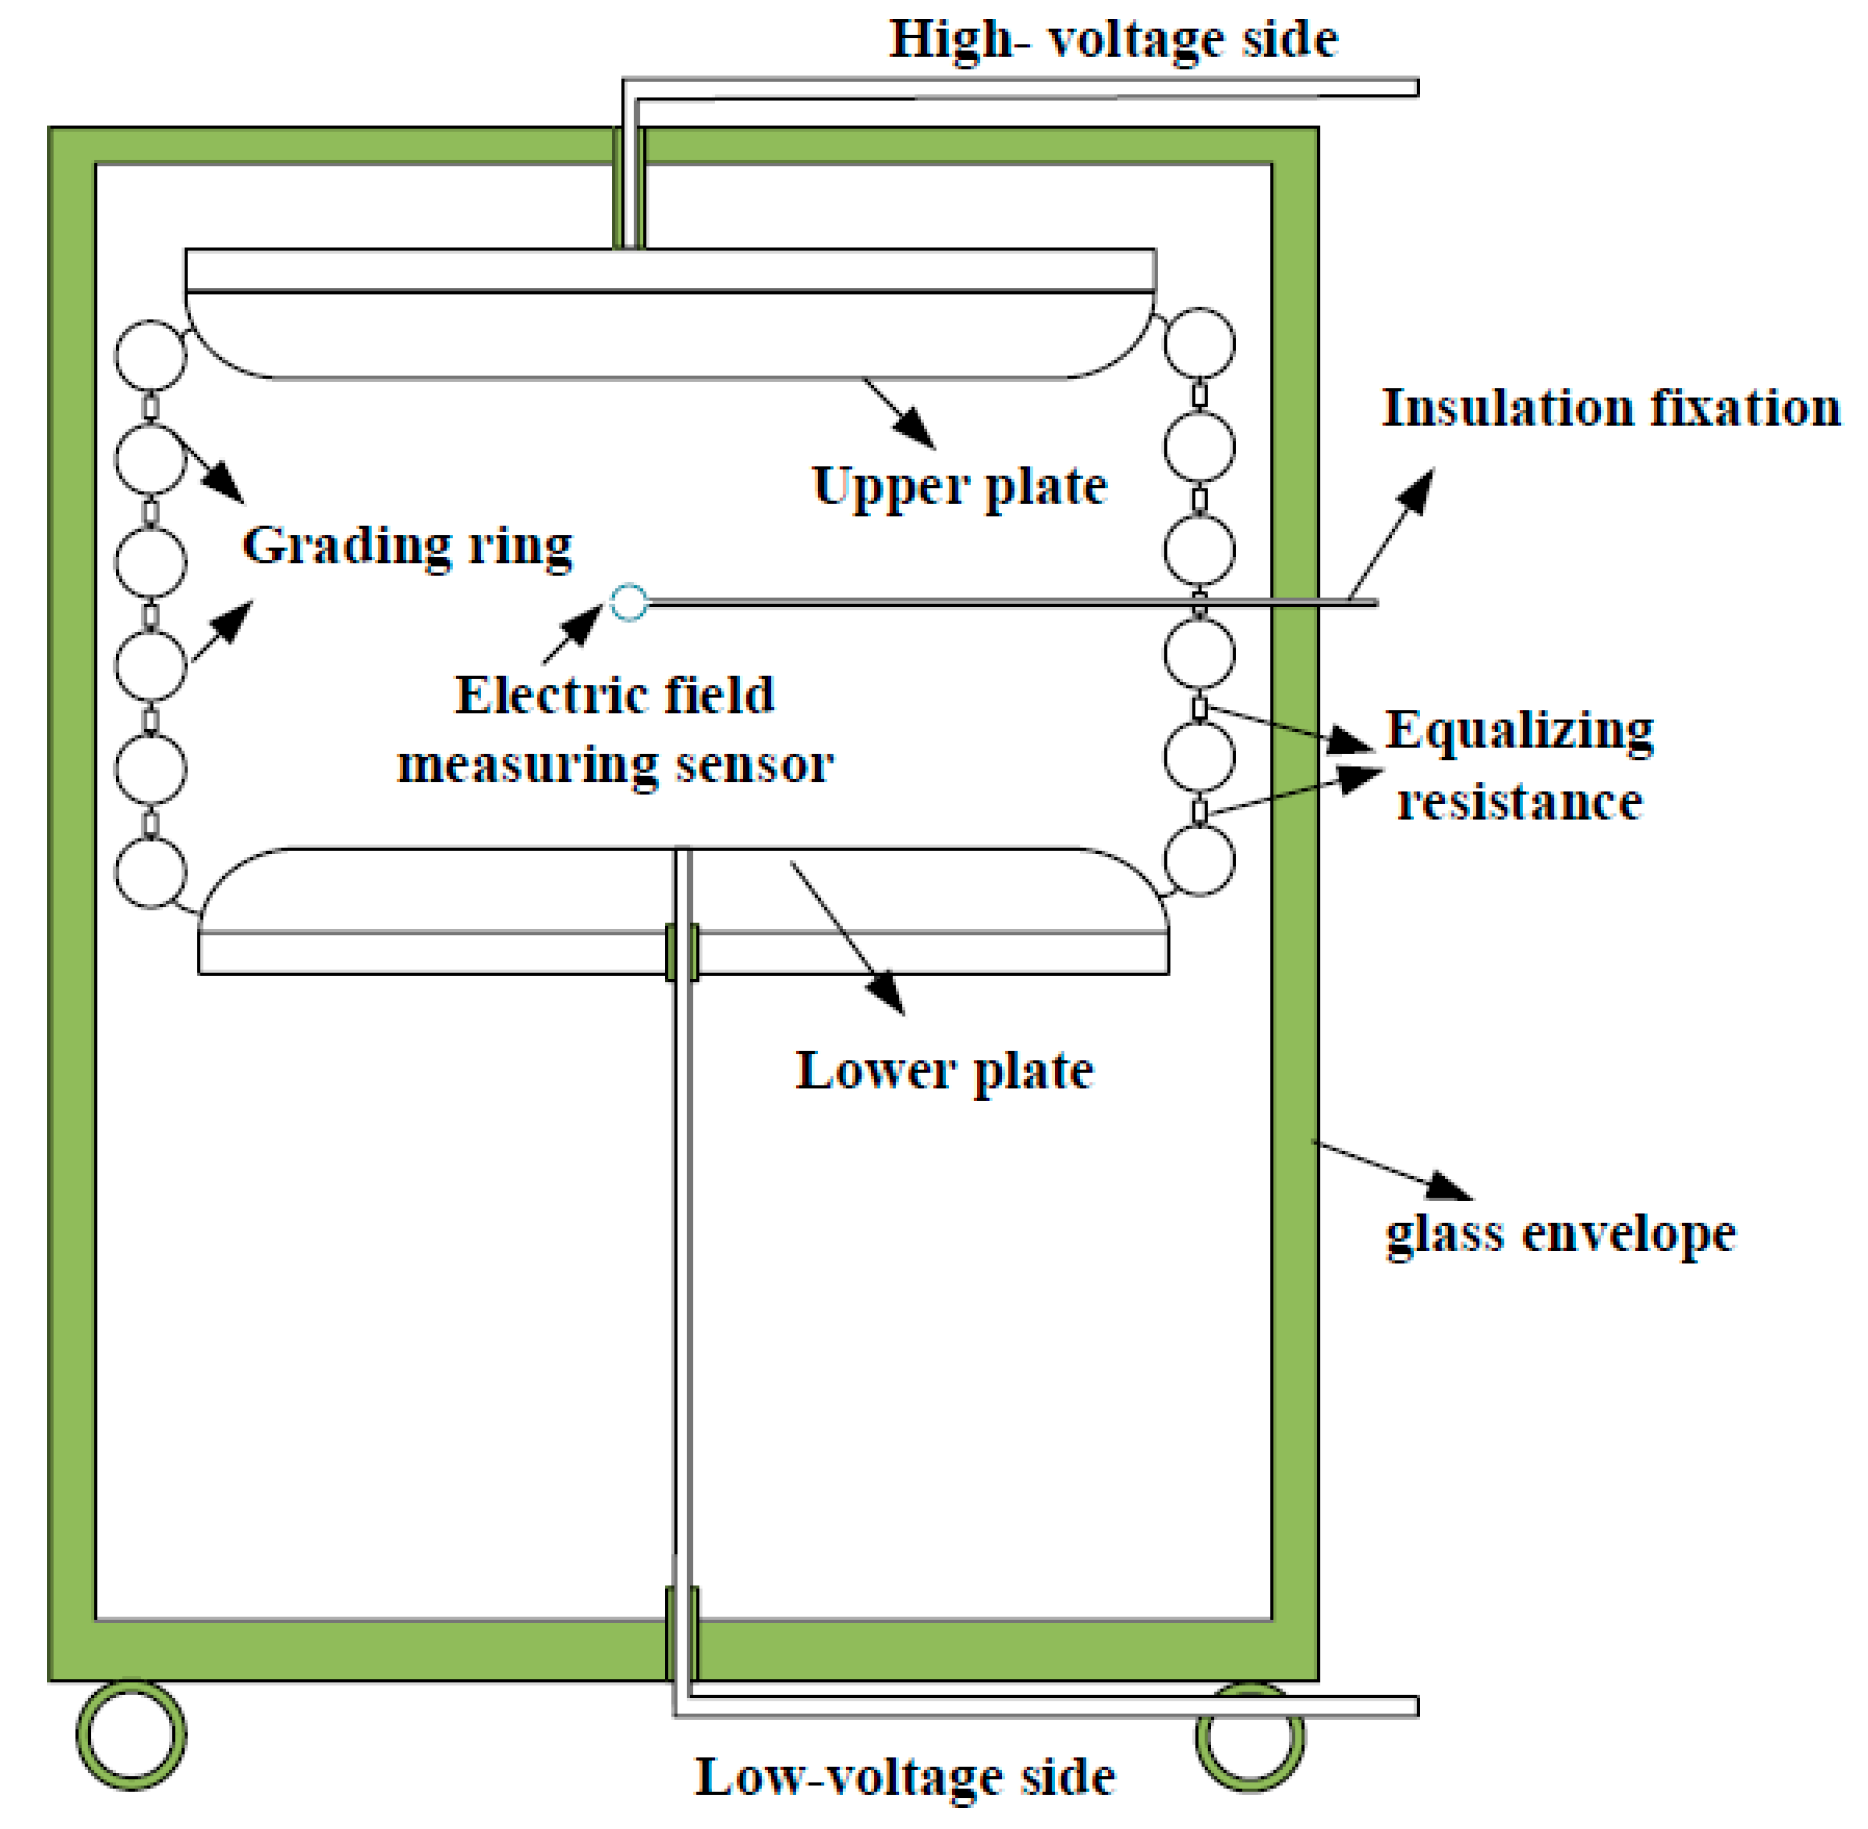
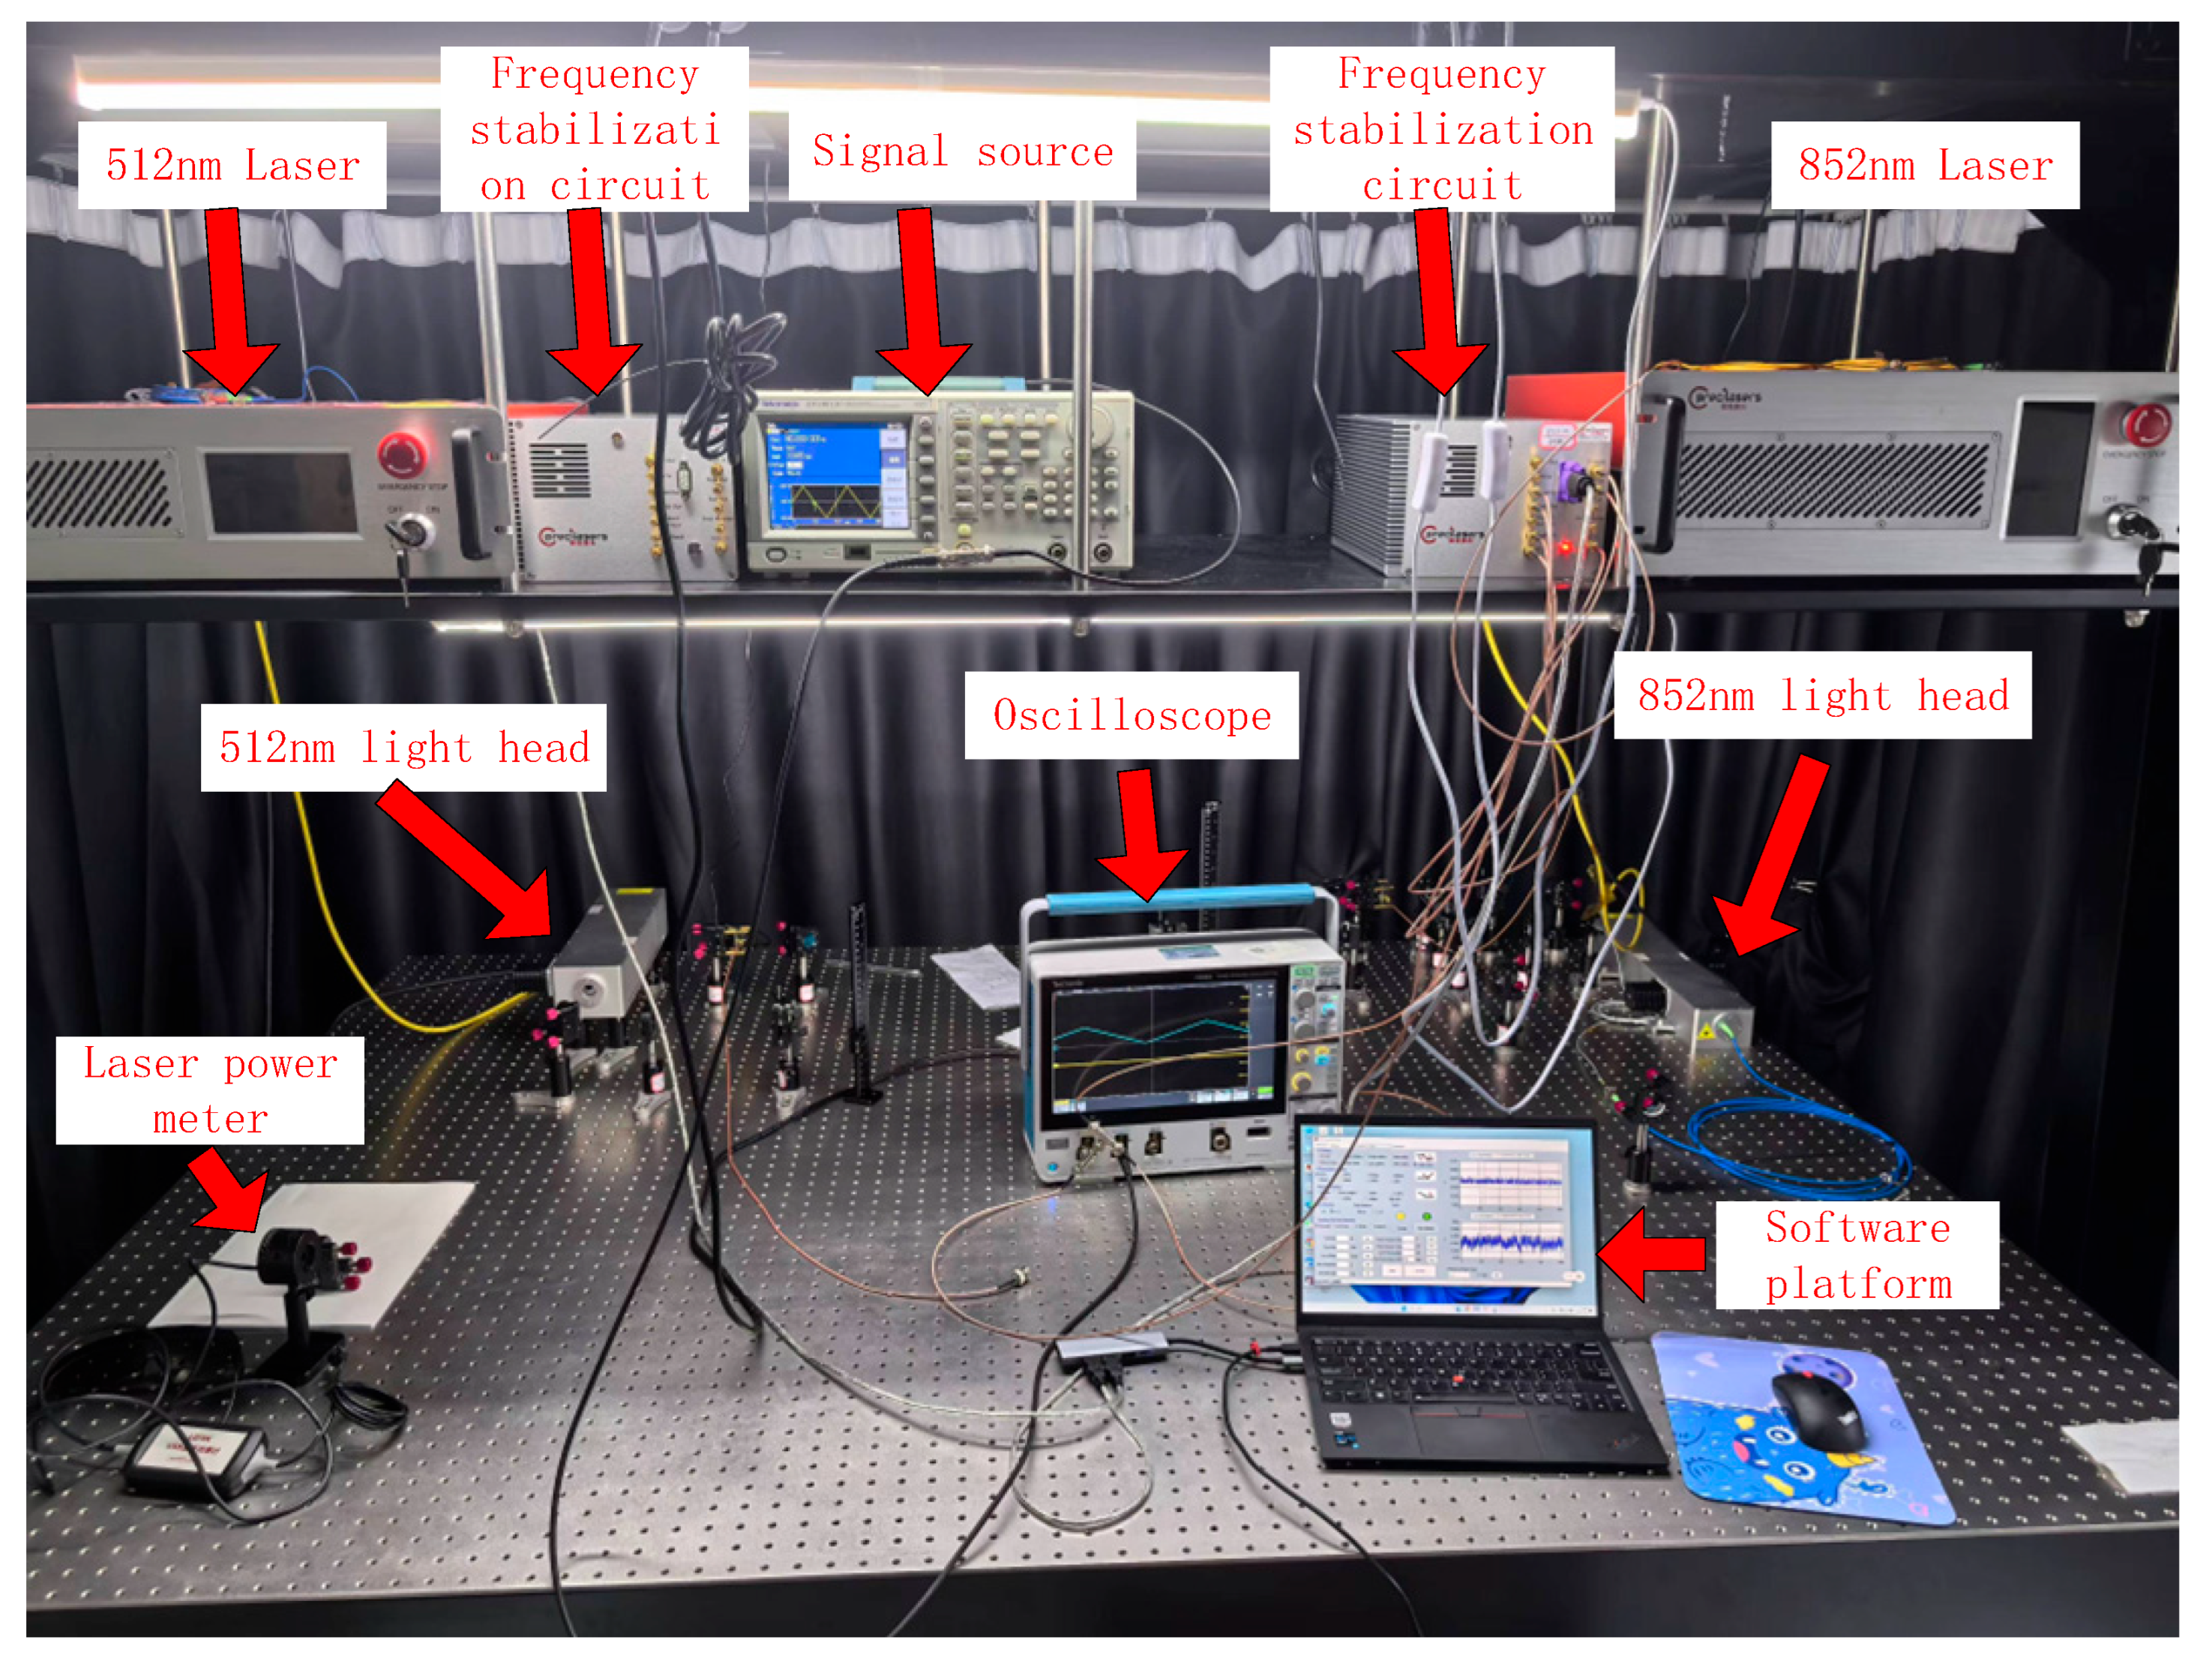
3.1. Rydberg Atom-Based Voltage Measurement Device

This paper studies a power frequency voltage measurement device based on Rydberg atoms, which is composed of a laser system, a sensing unit, and a data acquisition system, as illustrated in Figure 2. The output from the 852 nm fiber laser is divided into three channels. The first beam is used to construct the saturated absorption spectrum (SAS) of Cs atoms, thus providing a reference frequency for frequency stabilization of the 852 nm laser. The second beam is used to construct a stepped Rydberg EIT spectrum in combination with the 512 nm laser, thus providing a frequency reference for frequency stabilization of the 512 nm laser. The final beam enters the main optical path of the sensing unit after it passes through the Electric-optical modulator (EOM). Similarly, the 512 nm fiber laser is divided into two channels after output, with one beam being used to construct the EIT spectrum and the other being transmitted directly into the main optical path. When the 852 nm laser pumps the Cs atoms from 6S1/2 to 6P3/2, the laser power is 1 mW and the waist diameter of the laser beam is 1 mm; when the 512 nm laser excites the Cs atoms from 6P3/2 to the Rydberg state at 30D5/2, the laser power is 300 mW and the waist diameter of the laser beam is 0.8 mm.
The core of the sensing unit is a Cs atomic vapor cell that is embedded with a parallel electrode plate, as shown in Figure 3, which allows it to avoid shielding of the external electric field being caused by alkali metal atoms that are adsorbed into the inner glass wall under the low frequency electric field. The 852 nm laser is split into three beams via a beam splitter. One beam is directed into a SAS module 9.4 to eliminate Doppler broadening in the spectrum, using the frequency intervals of atomic resonance peaks as references for stabilizing the laser’s frequency. Another beam enters an EIT module. The third 852 nm beam undergoes phase modulation through an EOM, serving as a weak probe light with reduced optical power, which is coupled into a fiber-based sensing vapor cell via a C-lens collimator. The 512 nm laser is divided into two paths using a beam splitter. One path is directed into the EIT module, where it cooperates with the 852 nm laser to induce destructive interference between quantum states in a cesium atomic medium, forming a central transparency window. Combined with high-precision feedback control, this achieves frequency stabilization of the 512 nm laser. The other path functions as a strong coupling light, which is refracted by a dichroic mirror to become counter-propagating and collinear with the weak probe light, exciting cesium atoms from the ground state to the Rydberg state, thereby enabling interaction with external fields to produce the Stark effect. Finally, the probe light transmitted through the dichroic mirror is received by a photodetector, where the optical intensity signal is converted into an electrical signal for subsequent data acquisition and processing.
Measurement of the voltage requires the electric field in the vapor cell to be almost uniform. To verify the electric field distribution inside the structure, a verification simulation was performed for the vapor cell structure of the voltage measurement device based on Rydberg atoms studied in this paper.
The model of the vapor cell based on Rydberg atoms was established using COMSOL software 6.3. The vapor cell length was 80 mm; the diameter was 27 mm; the cell thickness was 1 mm; the electrode length was 70 mm; the electrode width was 4 mm; the electrode thickness was 1 mm; and the distance between the upper and lower electrodes was 10 mm, as shown in Figure 4. Here, the vapor cell material is glass, and the electrode material is brass.
A 1 kV voltage was applied between the upper and lower electrodes, and the electric field distribution between the two electrode plates was studied using the COMSOL; the results are shown in Figure 5. The electric field distributions in the vapor cell on the three sections denoted by xy, xz, and yz are shown in Figure 6.
The results in the figure indicate that the electric field distribution between the two electrodes in the vapor cell is relatively uniform, and the relationship between the electric field intensity between the plates and the spatial position under application of the 1 kV voltage was analyzed further. After a coordinate system was established with the center point between the two electrode plates acting as the origin, the variations in the spatial electric field along the three directions of the x, y, and z axes are shown in Figure 7. The results in Figure 7 show that the x-axis and y-axis coordinates have a particular influence on the electric field intensity, whereas the z-axis coordinates have almost no influence on the electric field intensity. These results confirm that the electric field distribution in the vapor cell is uniform and thus meets the requirements for use in voltage measurement.

3.2. Voltage Measurement Calibrator

The Rydberg voltage sensor is located in the space scope close to the high voltage conductor to be measured, and it outputs the induced voltage by inducing a space electric field. There is a specific proportional coefficient between the induced voltage output by the sensor and the spatial conductor to be measured. Accurate calibration of the proportional coefficient is the premise used to ensure measurement accuracy for the proposed voltage measurement instrument. In laboratory measurements of the voltage measurement instrument, an almost uniform field is usually constructed to achieve accurate measurement of the proportional coefficient.
Before the calibration work, we must first ensure that the almost uniform electric field environment that was constructed is suitable for use in sensor calibration, and that the introduction of the sensor does not distort the original electric field to be measured significantly. However, the existence of metal electrodes in the electric field measurement instrument may also affect the distribution of the original electric field to be measured. To ensure measurement accuracy, the distortion and the effects of the electrode structure, shape, size, and other parameters of the voltage measurement instrument on the original electric field to be measured should be analyzed, and the sensor size parameters should then be designed reasonably with reference to the research results.
Figure 8 shows the electric field distribution to be measured when the Rydberg voltage sensor is placed between the plates with the uniform electric field. The simulation results indicate that when the designed electrode size of the Rydberg sensor meets the measurement requirements, it can then ensure that the electric field in the measured space remains basically unaffected.
A structural diagram of the voltage measurement calibrator is shown in Figure 9. The generator’s voltage output value is monitored using the standard high voltage divider, and the waveform and the characteristic parameters of the measured waveform are recorded using a supporting digital recorder to calibrate the measured device.

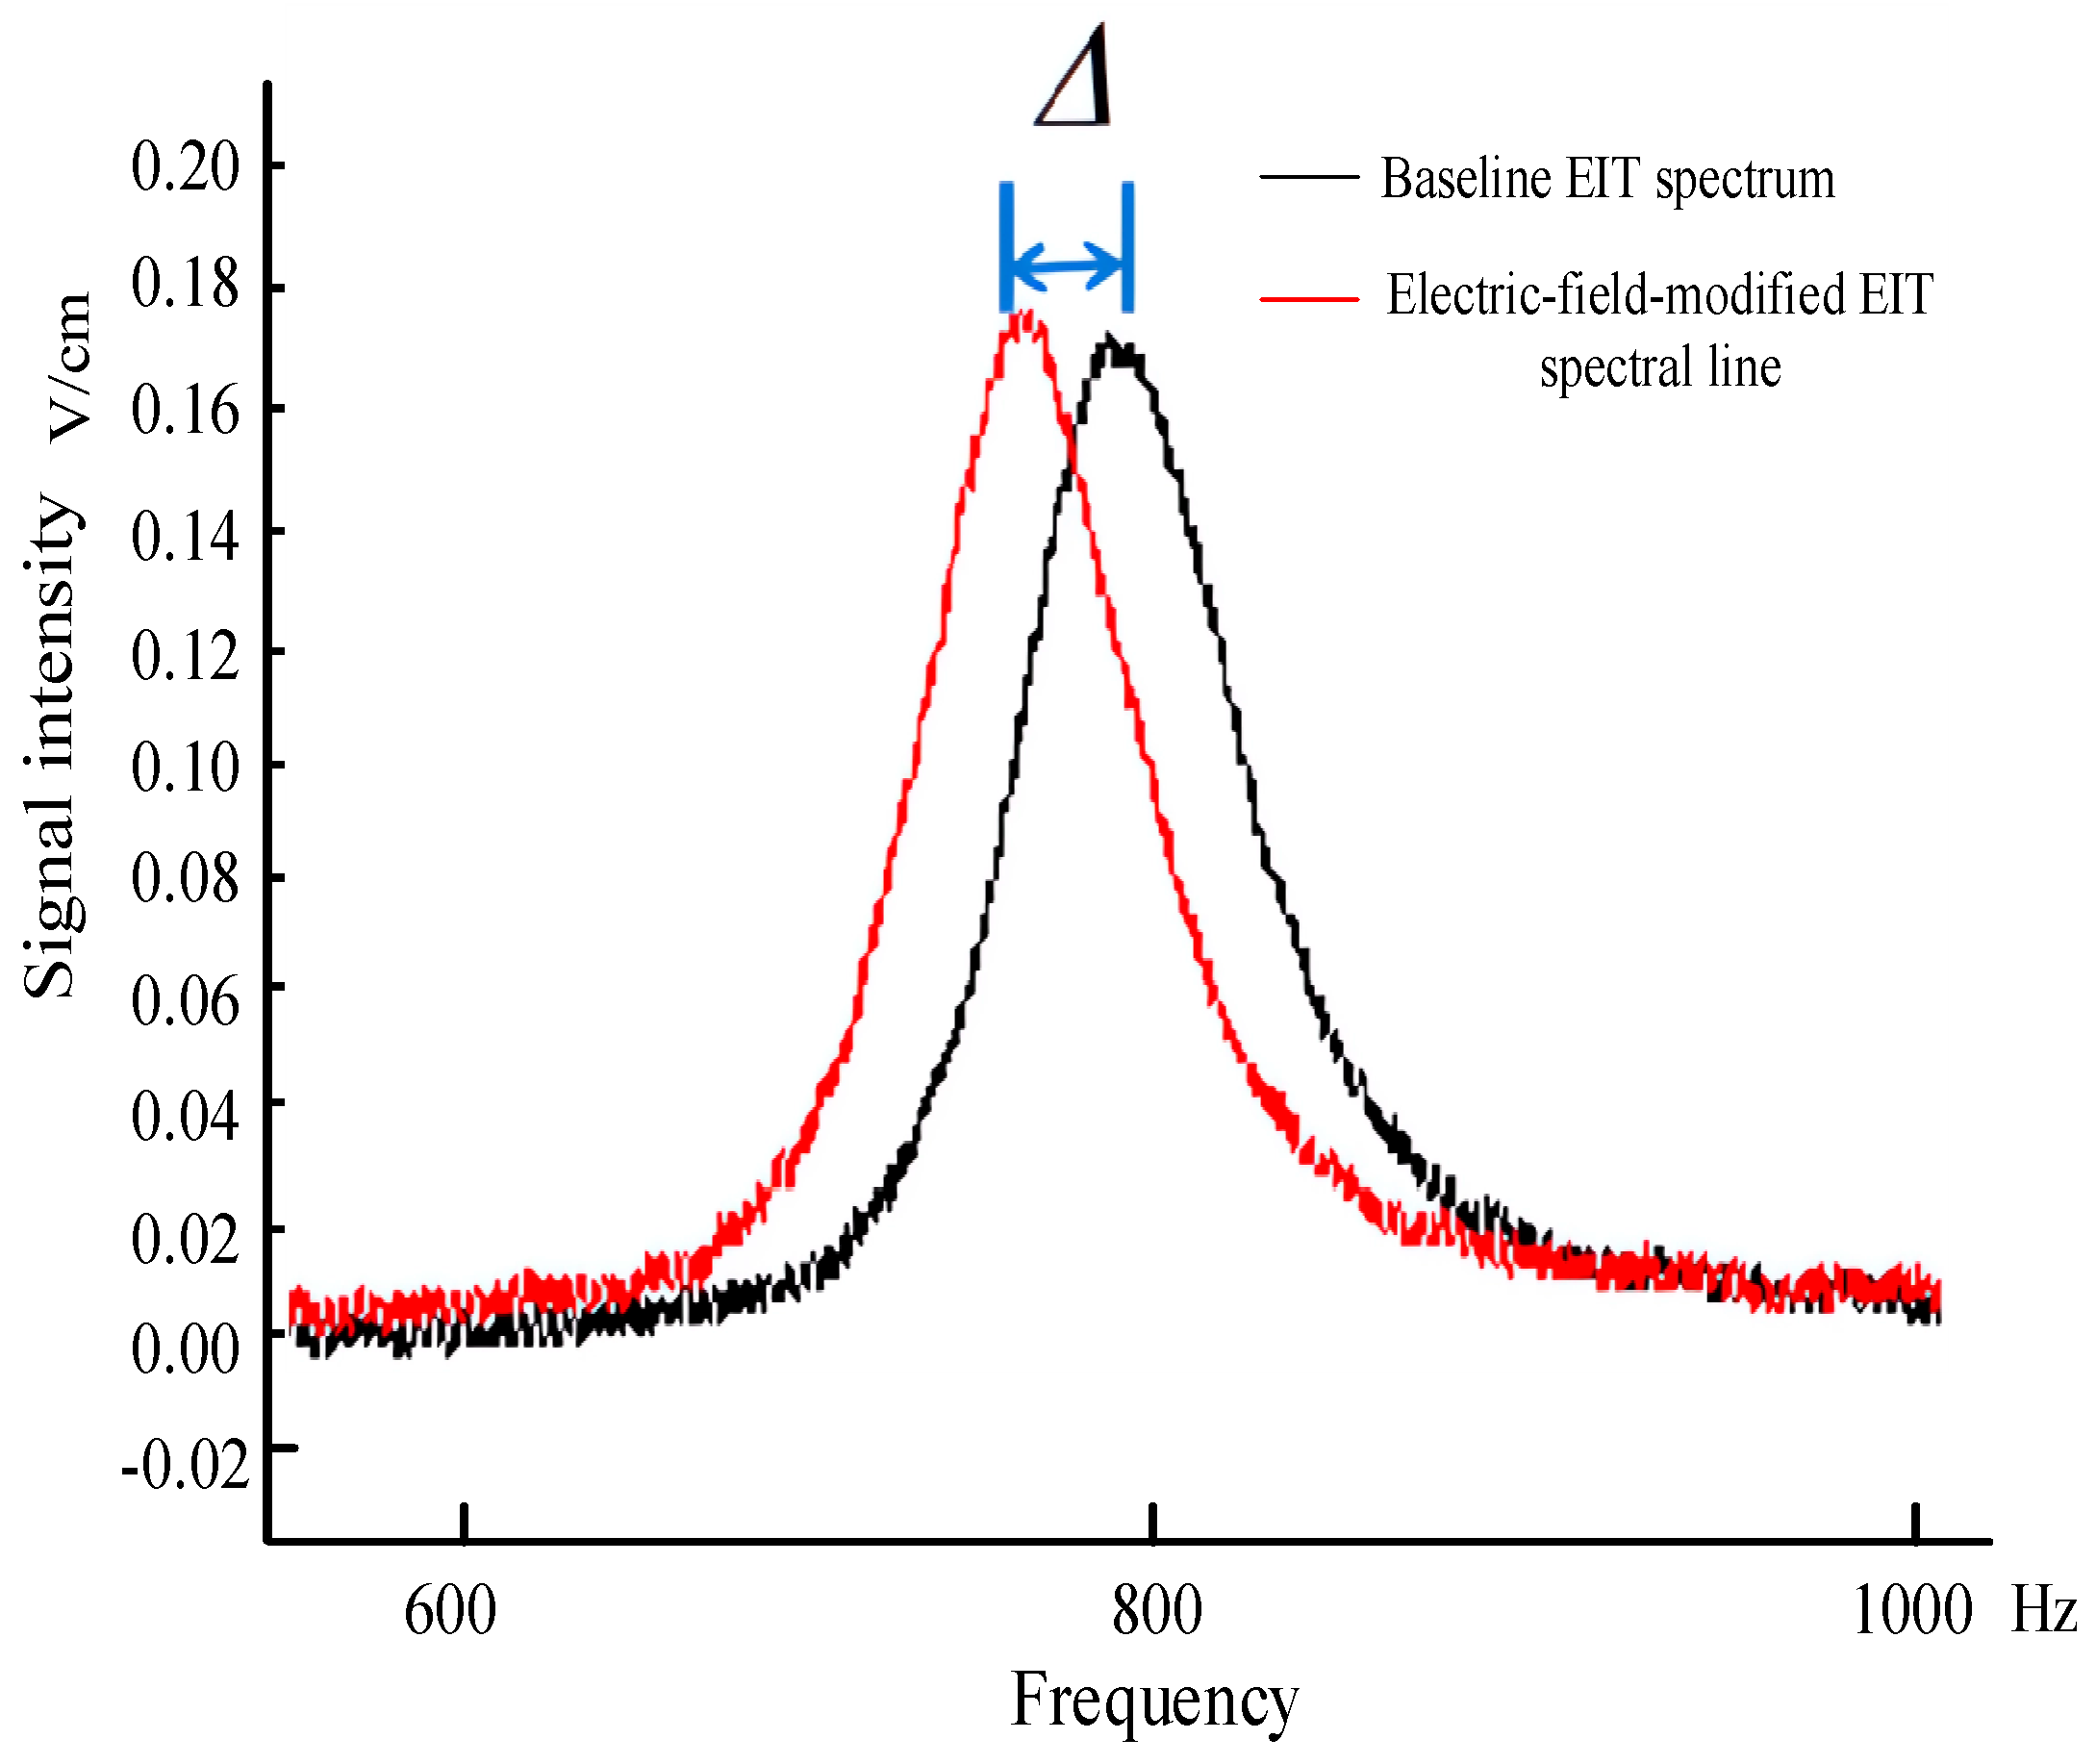
4. Results and Discussion

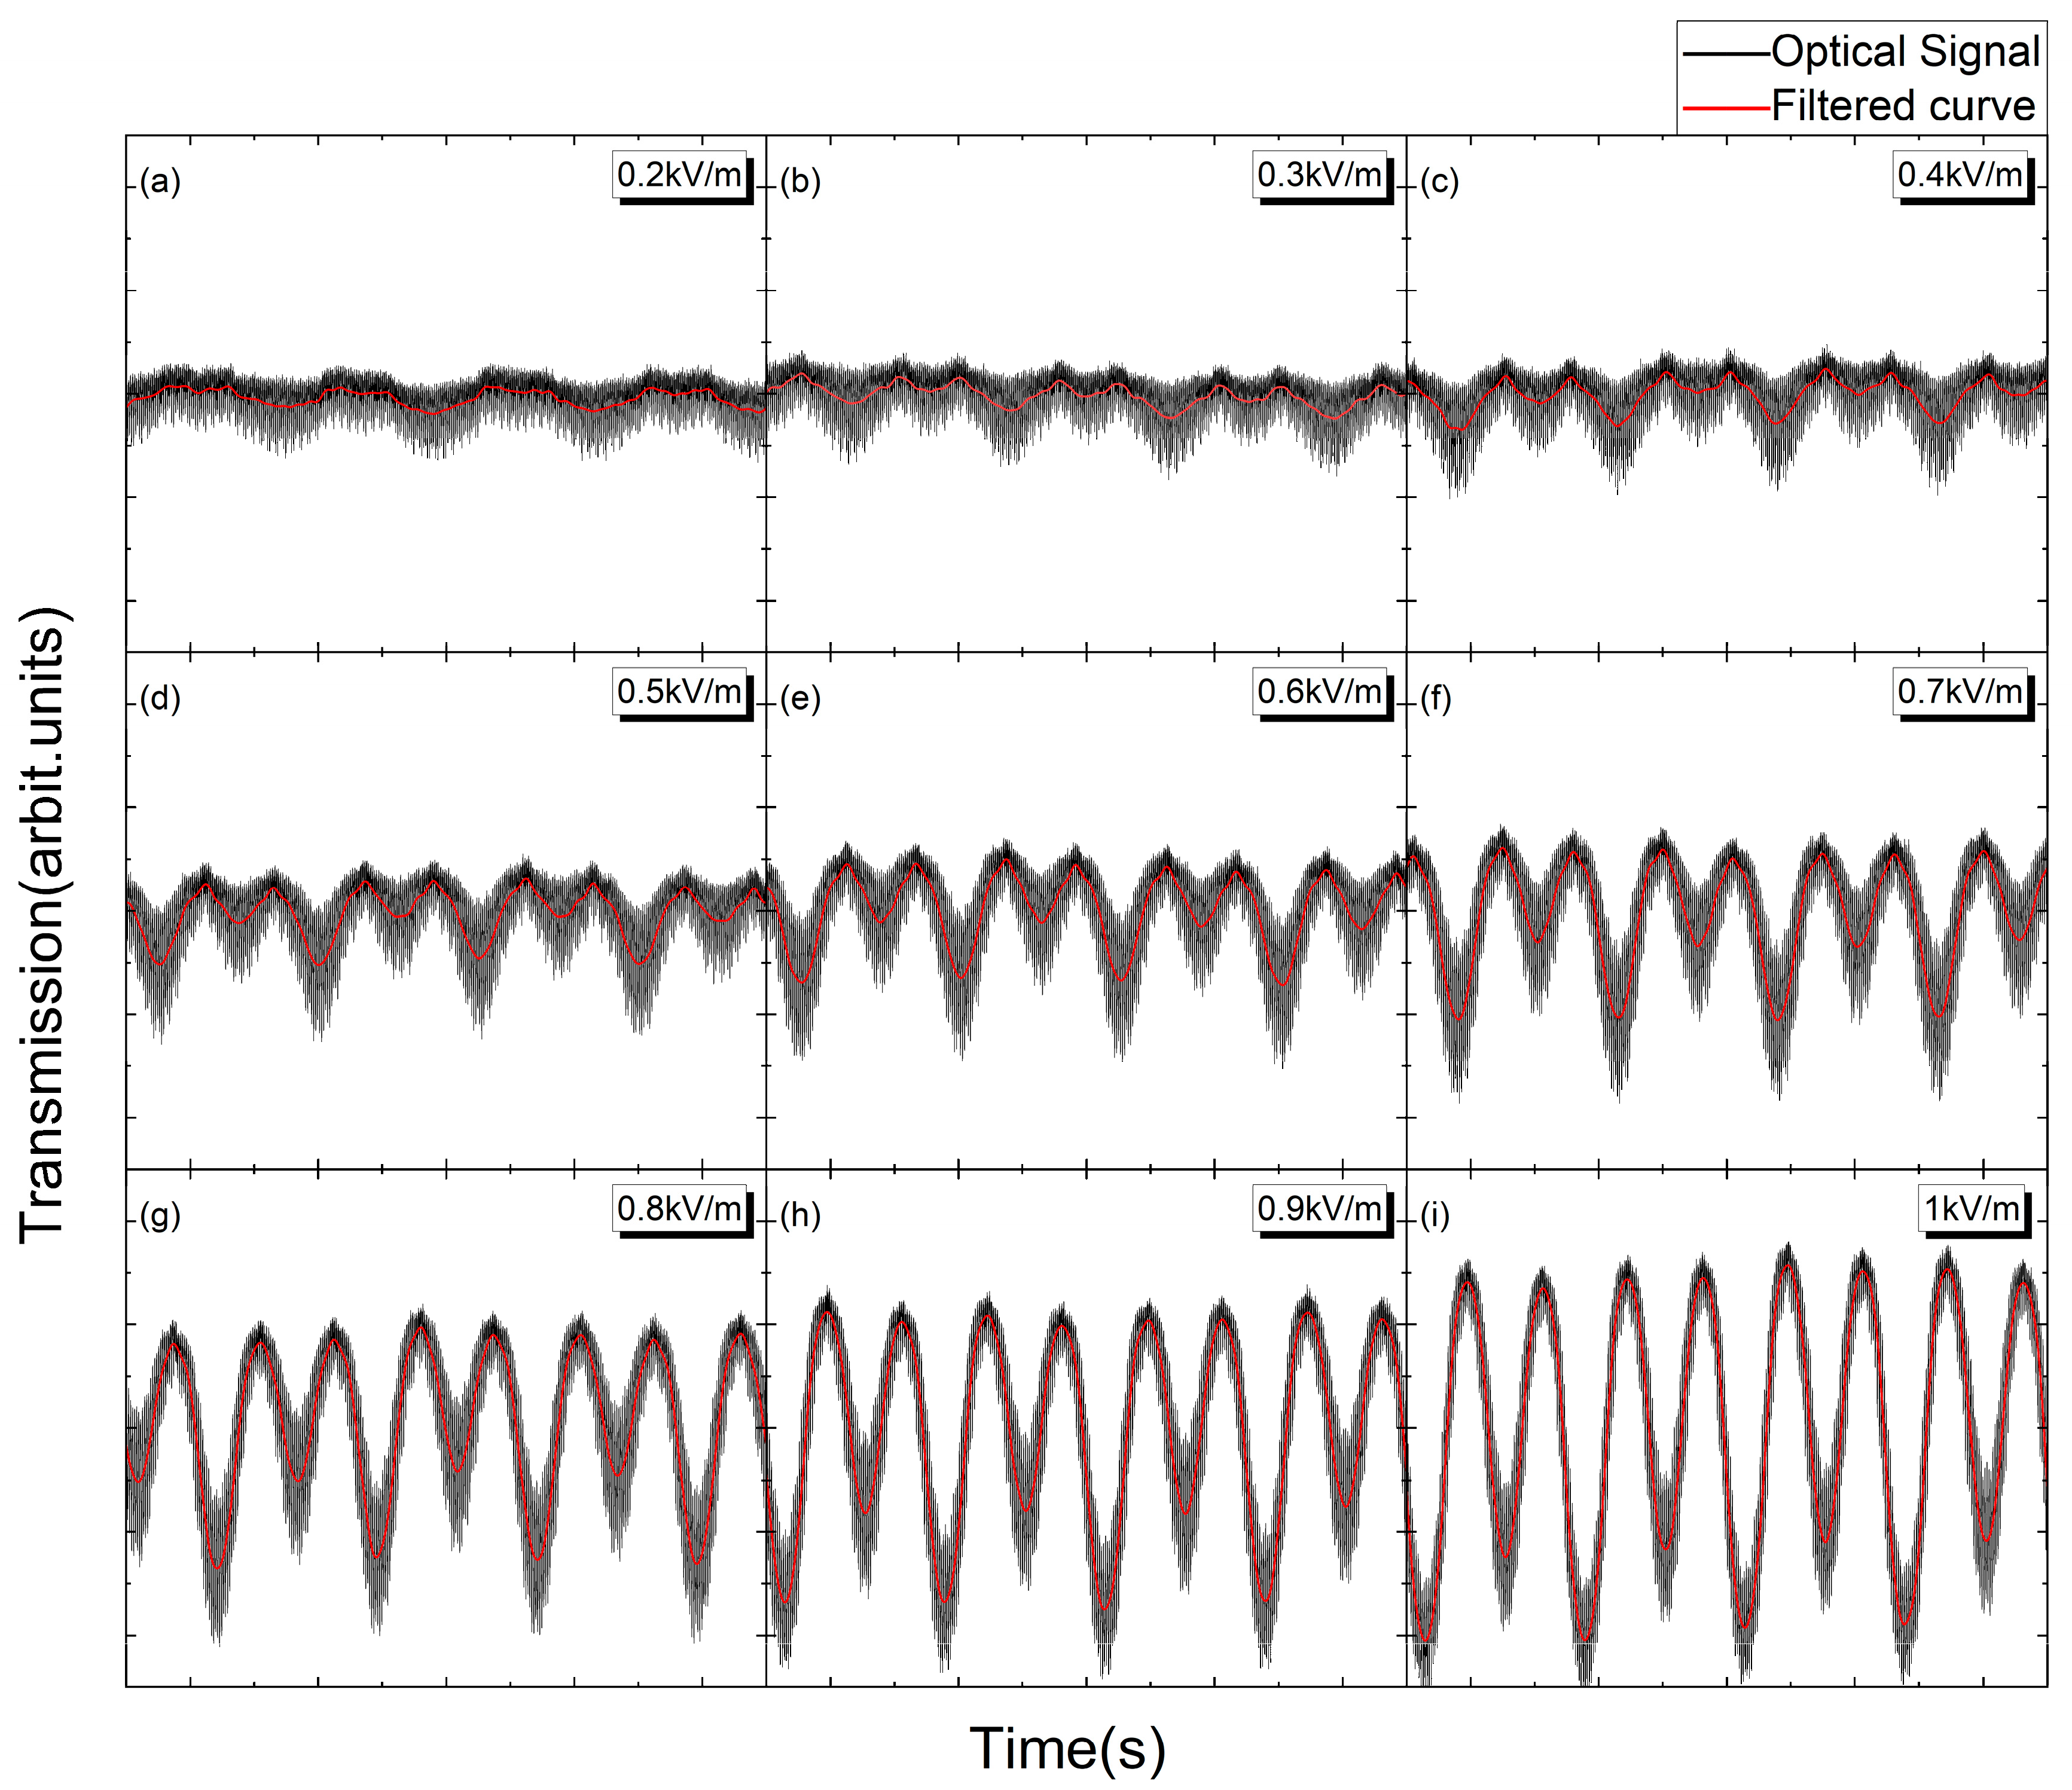
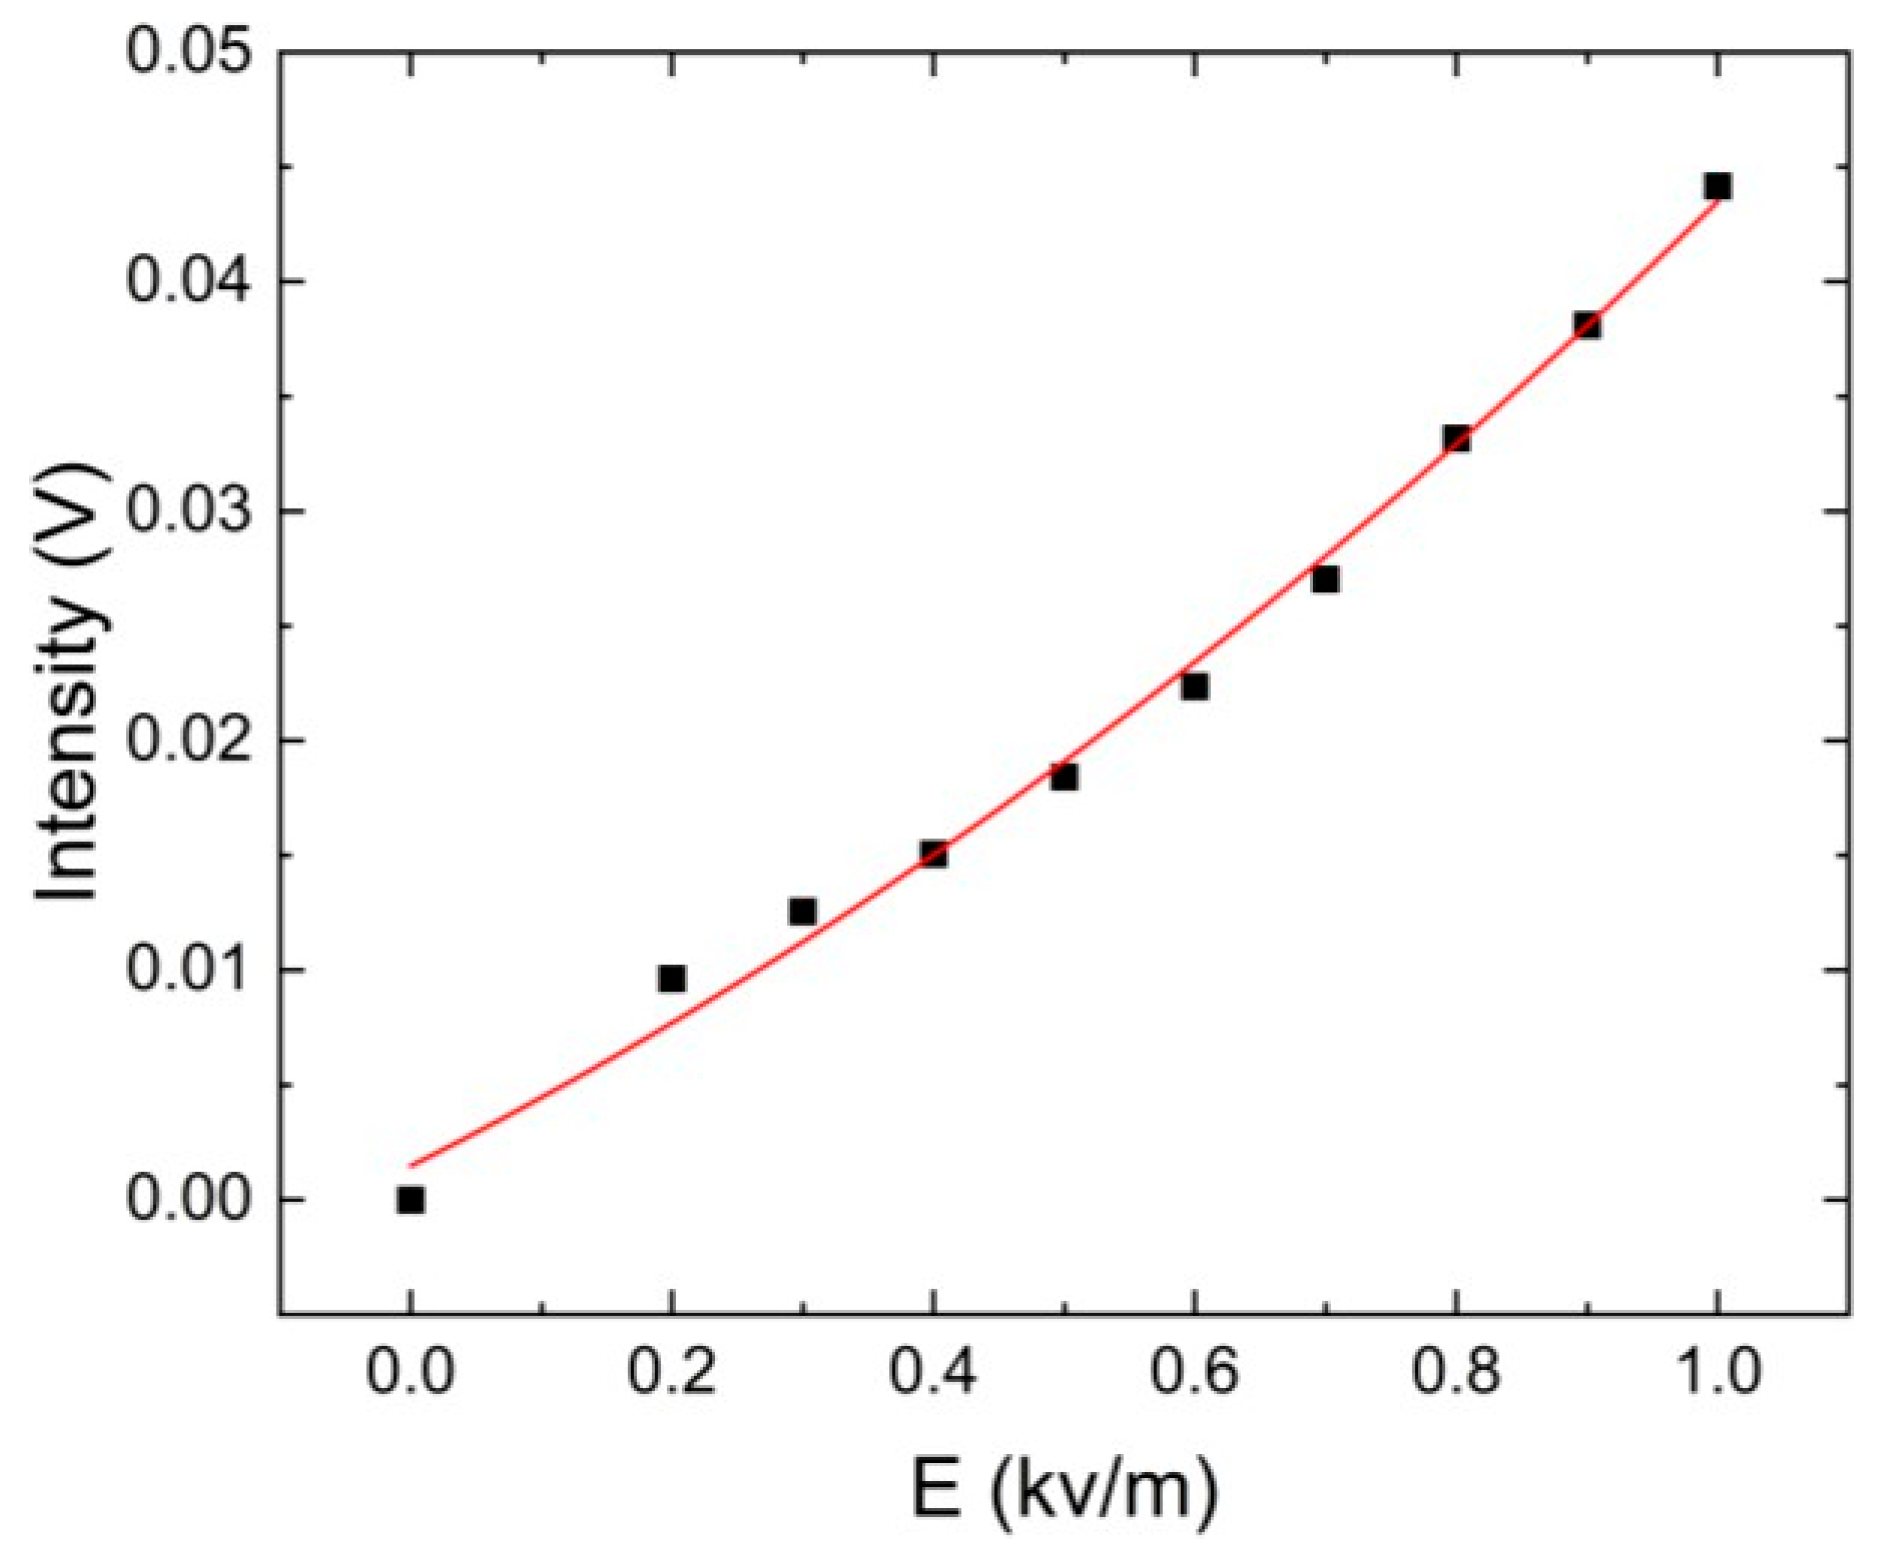
4.1. Power Frequency Voltage Measurement Results

To test and verify the feasibility of the proposed method, a test device was designed as shown in Figure 10. In this paper, power frequency voltages with different intensities are added between the two plates, the 852 nm laser is locked on the saturation absorption spectrum, and the 512 nm laser is locked on the 30D5/2 EIT spectral line. At this time, the light intensity changes for the 852 nm laser are as shown in Figure 11. The electric field intensity curve from 0.2 to 1 kV/m is used as an example, where the black curve represents the experimental data and the red curve represents the filtered waveform. When the field intensity increases, the signal amplitude shows an obvious increase. This experimental phenomenon means that the Rydberg atoms are able to measure the power frequency voltage using the framework proposed in this experiment.
The experimental data indicate that the intensity noise of the unfiltered data is high and that the phase is inconsistent. In this experiment, the intensity noise is due to the internal piezoelectric transducer (PZT) modulation frequency stabilization used by the 852 nm laser. This frequency stabilization method adds extremely significant noise to the 852 nm laser intensity. Therefore, it is planned to replace this method in the future with external modulation transfer frequency stabilization, which will significantly reduce the intensity noise problem. There are two main reasons for the phase inconsistencies. The first is that the data acquisition system is based on trigger acquisition, and the trigger phase may be inconsistent each time that data are collected. Another reason is that the signal generator’s phase is inconsistent when the electric field intensity changes, which can provide a clock reference signal to the signal source to keep ensure that the initial phase of the signal is consistent.
Figure 12 shows the relationship curve between the signal amplitude and the electric field intensity, where the black squares represent the experimental data points and the red curve is the quadratic function fitting curve, where the fitting degree r2 is 0.9936. The experimental results are consistent with Equation (1), which confirms that the proposed method is able to measure the voltage.

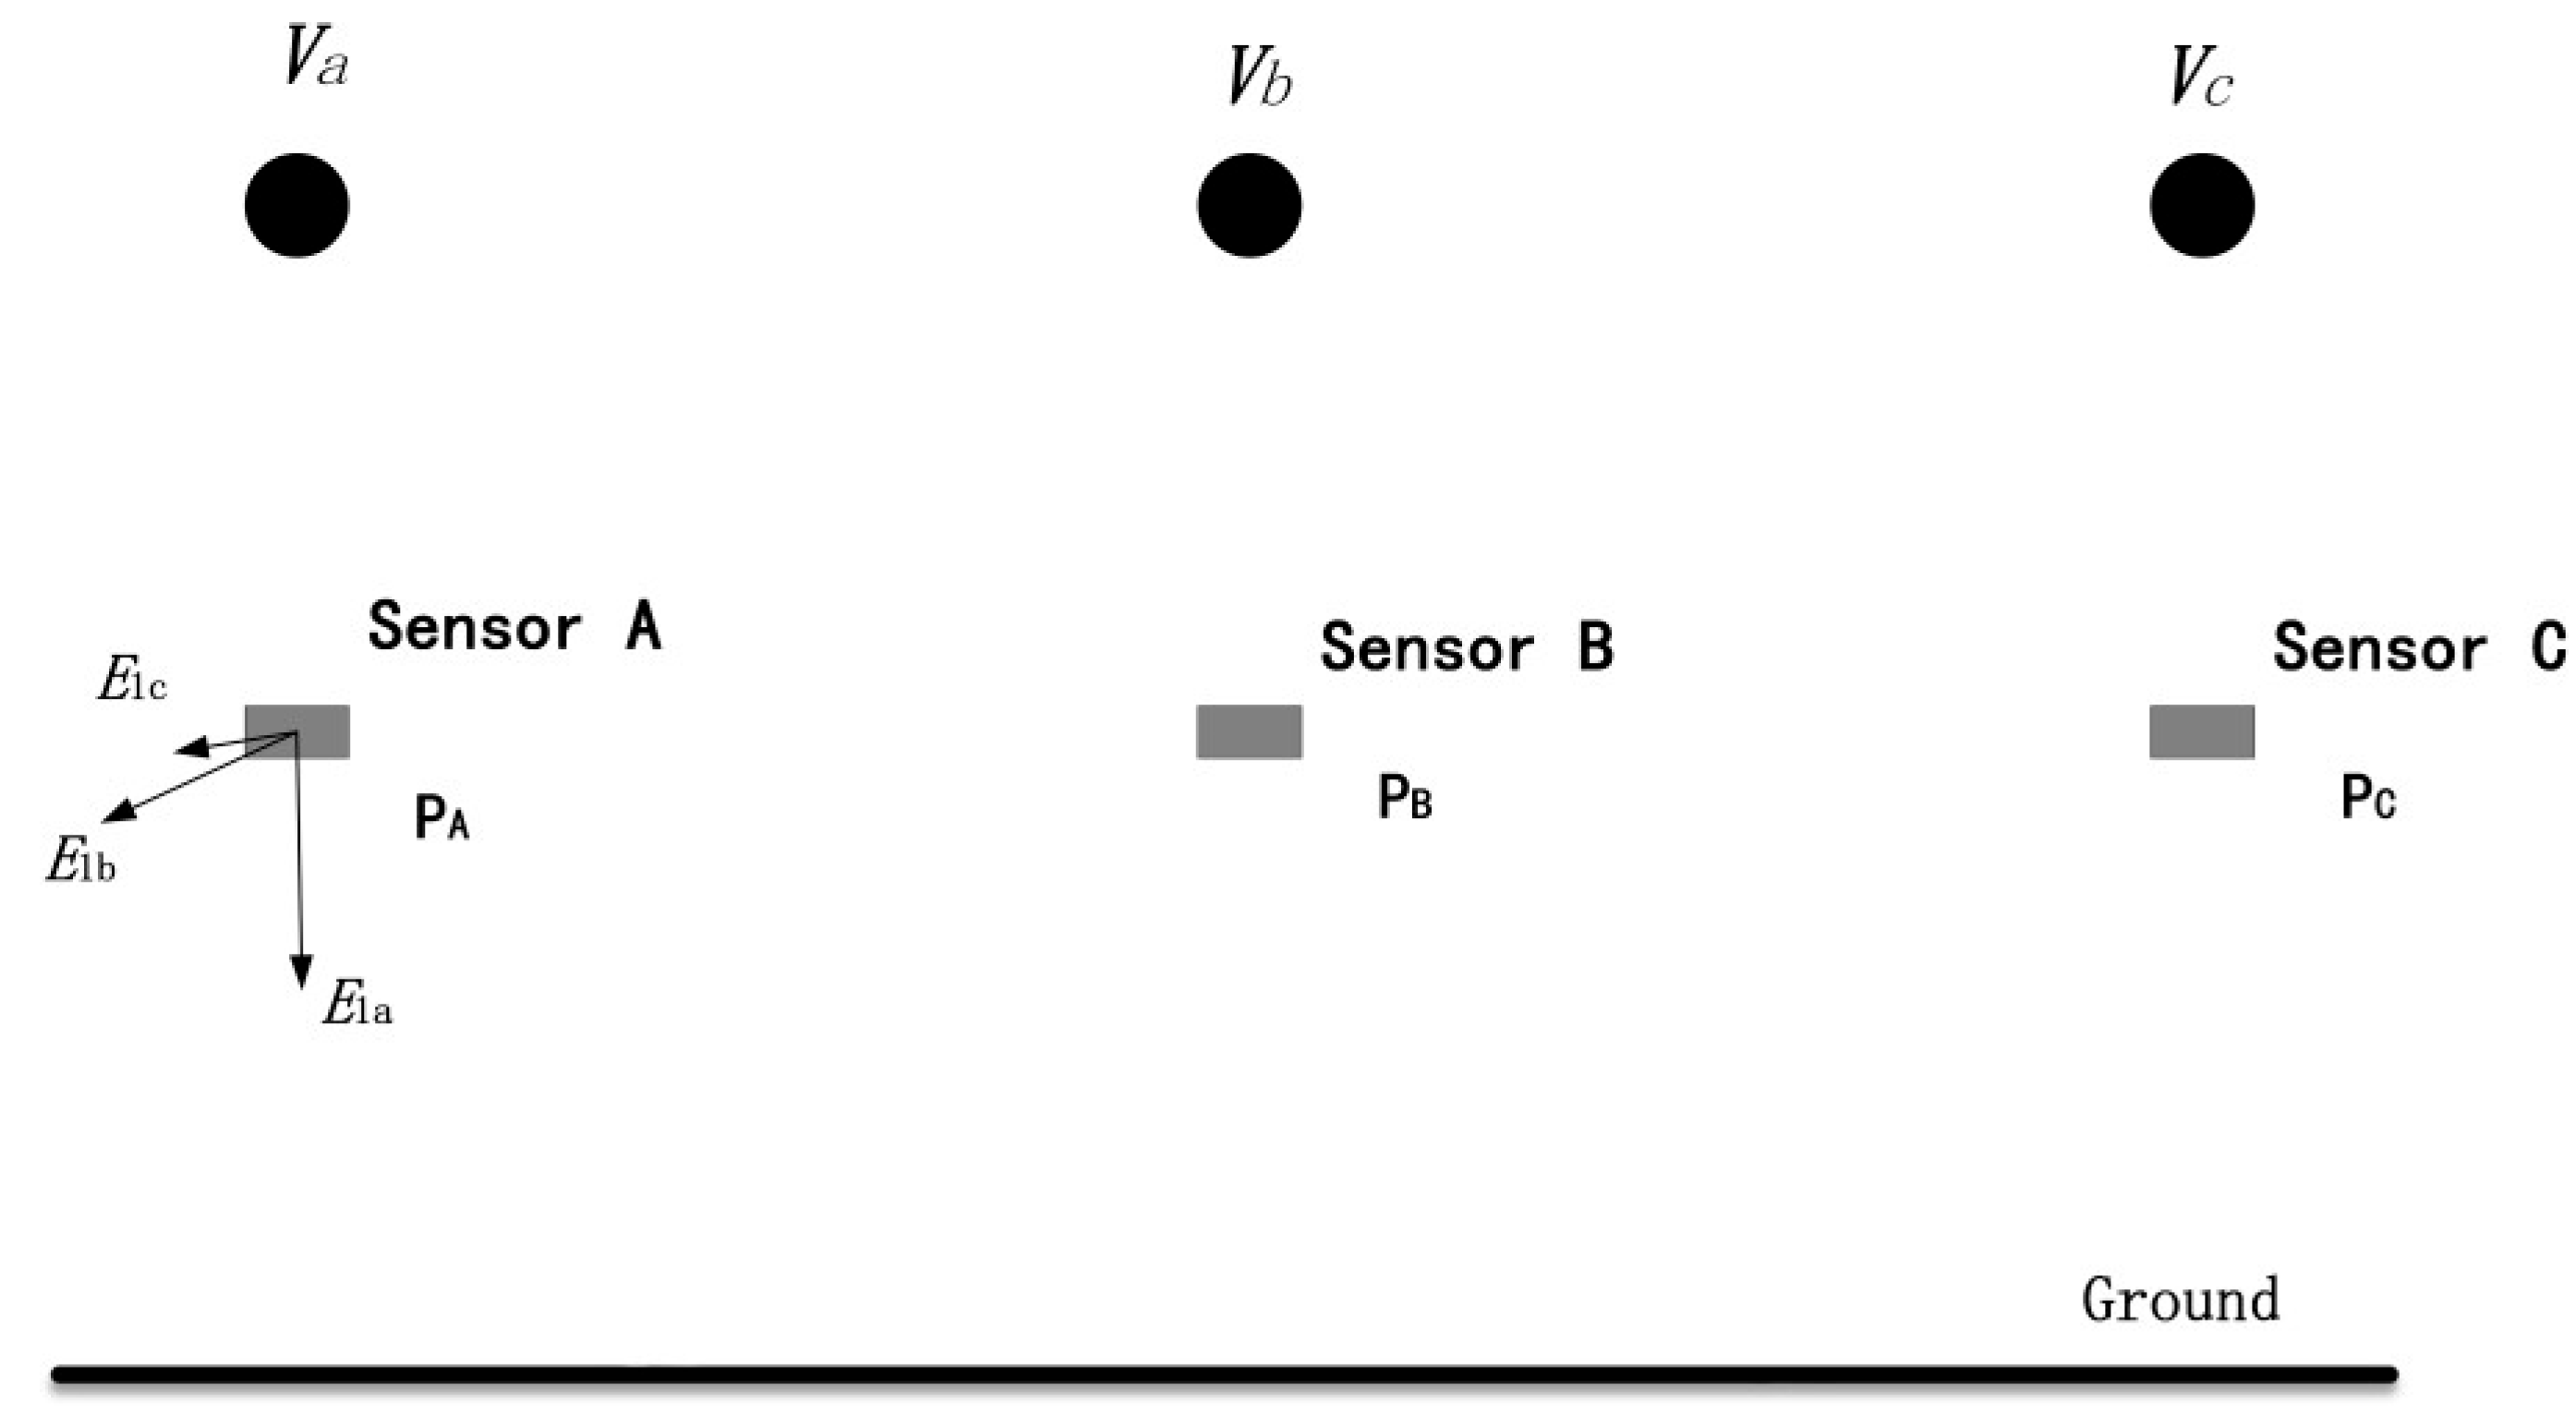
4.2. On-Site Measurement Decoupling of Multi-Phase Overhead Lines

After the electric field has been measured, the corresponding voltage value can be calculated through an electric field inversion process. When the voltage measurement instrument is used to measure the space electric field/voltage characteristics of the on-site substation, the electric field generated by the multi-phase transmission line will inevitably overlap at the voltage measurement instrument in the environments of AC and DC transmission lines, particularly in low-voltage systems with relatively small inter-phase gaps; this coupling effect will then reduce the measurement accuracy significantly [22]. Therefore, a suitable decoupling method should be used to eliminate this coupling effect on the measurement results.
Figure 13 shows a schematic diagram of the coupling effects that occur in a typical three-phase system. Three electric field sensors are installed under the three-phase conducting wire. Va, Vb, and Vc are the voltages of the phase conductor to be measured. For example, at sensor A, the electric field at the position of sensor A is composed of EaA, EbA, and EcA, which correspond to Va, Vb, and Vc, respectively. Because most electric field sensors have inherently good orientation, EaA, EbA, and EcA can be simplified as scalar quantities that represent the electric fields along the induction directions of the sensor. Therefore, the output from sensor A (UA) can be expressed as follows:
U A = m A × ( E aA + E bA + E cA ) = m A [ k aA k bA k cA ] V a V b V c ,
where mA is the conversion coefficient from the electric field to the output voltage for sensor A; and kaA, kbA, and kcA represent the coupling coefficients, which are defined as the ratios of the electric fields to the corresponding voltages.
The output voltages of sensor B and sensor C are known, and thus the following function can be established:
U A U B U C = m A k aA m A k bA m A k cA m B k aB m B k bA m B k cB m C k aC m C k bC m C k cC V a V b V c = N V a V b V c ,
where N is the coupling coefficient matrix. If all coefficients in the matrix N are known, the voltage to be measured can be calculated by the following decoupling function:
V a V b V c = N 1 U A U B U C ,
Therefore, the key step to enable the decoupling process to be realized is to obtain the coefficients in matrix N, and two methods are available to determine these coefficients.

4.2.1. Field Test Method

Field testing provides a more direct method for obtaining the coefficients of matrix N; however, it is also t the most challenging approach to implement. According to the definitions of these coefficients, the voltage source is applied to the conducting wire phase by phase, and the coefficients are then determined based on the columns of the matrix.
Here, taking phase A as an example, when a pulse voltage with amplitude Va is applied to the phase A conducting wire, Equation (7) can be expressed as follows:
U A U B U C = m A k aA m A k bA m A k cA m B k aB m B k bA m B k cB m C k aC m C k bC m C k cC V a 0 0 = m A k aA V a m B k aB V a m C k aC V a ,
where UA, UB, and UC represent the signal amplitudes of sensors A, B, and C, respectively, under Va.
Therefore, the coefficients of the first column of the matrix N can be determined in the following way:
m A k aA m B k aB m C k aC = U A / V a U B / V a U C / V a ,

4.2.2. Asynchronous Transient Voltage Method

In most cases, although the transient processes may be caused by the same event, the transient processes on the three conducting wires are not completely synchronized. For example, during the opening operation of the circuit breaker, even if the three-phase circuit breakers all receive the instruction simultaneously, differences in the action performances may cause the actual conduction times to be different. Because permissible action time deviations can range in scale from microseconds to milliseconds, it is possible to distinguish transient processes caused by different phases in the measurement results. At the instant when the circuit breaker of one phase has just closed, the other two phases are considered assumed not to contribute to these sensors.
Using phase A as an example, when a transient pulse (ΔVa) is formed on phase A, the three sensors that measure the transient voltage are named ΔUA, ΔUB, and ΔUC. Because the other two phases do not contribute to the measurement results at this point, we obtain the following equation:
Δ U A Δ U B Δ U C = m A k aA m A k bA m A k cA m B k aB m B k bA m B k cB m C k aC m C k bC m C k cC Δ V a 0 0 = m A k aA Δ V a m B k aB Δ V a m C k aC Δ V a
Solving for the coefficient values of the first column in the matrix means that the ratio between any two coefficients in the first column can be obtained using Equation (10).
m B k aB m A k aA = Δ U B Δ U A m C k aC m A k aA = Δ U C Δ U A ,
The same method can also be used to obtain the ratios between the coefficients in the other two columns of the matrix. In addition, Equation (7) can be converted into the following:
U A U B U C = 1 m A k bA m B k bA m A k cA m C k cC m B k aB m A k aA 1 m B k cB m C k cC m C k aC m A k aA m C k bC m B k bA 1 m A k aA 0 0 0 m B k bA 0 0 0 m C k cC V a V b V c ,
1 m A k bA m B k bA m A k cA m C k cC m B k aB m A k aA 1 m B k cB m C k cC m C k aC m A k aA m C k bC m B k bA 1 1 U A U B U C = m A k aA V a m B k bA V b m C k cC V c ,
Note here that the left coefficient matrix and the measured signal are known, and thus Equation (11) can be rewritten as follows:
U A U B U C = m A k aA V a m B k bA V b m C k cC V c ,
where UA, UB, and UC represent the decoupled measurement data.
The residual coefficient on the right side of Equation (13) can be estimated based on the measurement results for the voltage frequency, because the voltage frequency and the voltage amplitude are known during operation. Because the asynchronous transient voltage method is based on the measurement data itself and does not require any additional operation, it is easy to implement in a field environment.

5. Conclusions

This paper presents research results for a 110 kV high voltage measurement method based on Rydberg atoms. Using a combination of modeling and simulation, structural design, and device testing, the paper shows that the ability to measure the power frequency voltage level through the electric field can be realized by using a vapor cell with a specific structure, and the technical feasibility of measuring the high power frequency voltage using the Rydberg atoms is verified. The Rydberg atom measurement method proposed in this study addresses the limitations of traditional Rydberg atom-based techniques in low-frequency measurement applications, offering advantages such as high sensitivity and excellent traceability. Meanwhile, the technical solution developed in this research enables the conversion of field measurements into frequency determinations, which can be directly traced to fundamental physical constants. Given that frequency measurement represents the most precise metrological approach currently available, this methodology achieves high-precision quantification and demonstrates significant potential for advancement in precision measurement science, holding promising research prospects for future developments. The next step in this work will be to optimize the device structure of the voltage measurement instrument and then conduct field tests to achieve accurate three-phase conductor voltage measurements. This measurement method does not require direct contact with the line, enabling non-contact high-voltage measurements, and has broad application prospects in the fields of live detection and condition monitoring of power equipment.

Author Contributions

Methodology, N.Q. and X.X.; Software, X.L.; Validation, J.C.; Formal analysis, S.Y.; Writing—original draft, Y.D.; Writing—review & editing, Z.Q. All authors have read and agreed to the published version of the manuscript.

Funding

This research was supported by the State Grid science and technology project (5700-202355839A-4-3-WL).

Data Availability Statement

Data are contained within the article.

Conflicts of Interest

Author Nan Qu was employed by the company State Grid Nanjing Power Supply Company. The remaining authors declare that the research was conducted in the absence of any commercial or financial relationships that could be construed as a potential conflict of interest.

References

  1. Li, Q.Q.; Liu, J.; Li, Y.M. Spherical sensor for the measuring transient electric fields based on optical fibre. J. Transducer Technol. 2002, 21, 14–16. [Google Scholar]
  2. Xiao, D.; Ma, Q.; Xie, Y.; Zheng, Q.; Zhang, Z. A power-frequency electric field sensor for portable measurement. Sensors 2018, 18, 1053. [Google Scholar] [CrossRef] [PubMed]
  3. Hidaka, K.; Fujita, H. A new method of electric field measurements in corona discharge using Pockels device. J. Appl. Phys. 1982, 53, 5999–6003. [Google Scholar] [CrossRef]
  4. Niu, B.; Zeng, R.; Li, H.; Wang, B. Design of non-electrode power frequency electric field sensor. Zhongguo Dianji Gongcheng Xuebao/Proc. Chin. Soc. Electr. Eng. 2008, 28, 101–107. [Google Scholar]
  5. Zhou, F.; Chai, Z.; Diao, Y.; Long, Z. Research on Measurement Techniques for Integrated Optical Waveguide-Based Electric Field Sensors. IEEE Access 2025, 13, 90983–90990. [Google Scholar] [CrossRef]
  6. Jing, M.Y. Microwave Precision Measurement Based on Rydberg-Atom Superhet; Shanxi University: Taiyuan, China, 2020. [Google Scholar]
  7. Prajapati, N.; Robinson, A.K.; Berweger, S.; Simons, M.T.; Artusio-Glimpse, A.B.; Holloway, C.L. Enhancement of electromagnetically induced transparency based Rydberg-atom electrometry through population repumping. Appl. Phys. Lett. 2021, 119, 214001. [Google Scholar] [CrossRef]
  8. Zhang, L.J.; Jing, M.Y.; Zhang, H. Quantum Sensing of Microwave Electric Fields Based on Rydberg Atoms. J. Shanxi Univ. (Nat. Sci. Ed.) 2022, 45, 712–722. [Google Scholar]
  9. Holloway, C.L.; Prajapati, N.; Artusio-Glimpse, A.B.; Berweger, S.; Simons, M.T.; Kasahara, Y.; Alu, A.; Ziolkowski, R.W. Rydberg atom-based field sensing enhancement using a split-ring resonator. Appl. Phys. Lett. 2022, 120, 204001. [Google Scholar] [CrossRef]
  10. Cui, S.W. Power Frequency Electric Field Measurement Based on the Spectral Properties of the Rydberg Atom; Shanxi University: Taiyuan, China, 2023. [Google Scholar]
  11. Zhang, C.G.; Li, W.; Zhang, H.; Jing, M.; Zhang, L. Power Frequency Electric Field Measurement Based on Electromagnetic Induced Transparent Spectrum under Radio Frequency Field. Acta Photonica Sin.-CA 2021, 50, 162–168. [Google Scholar]
  12. Jau, Y.Y.; Carter, T. Vapor-cell-based atomic electrometry for detection frequencies below 1 kHz. Phys. Rev. Appl. 2020, 13, 054034. [Google Scholar] [CrossRef]
  13. Anderson, D.A.; Miller, S.A.; Raithel, G.; Gordon, J.A.; Butler, M.L.; Holloway, C.L. Optical Measurements of Strong Microwave Fields with Rydberg Atoms in a Vapor Cell. Phys. Rev. Appl. 2016, 5, 034003. [Google Scholar] [CrossRef]
  14. Paradis, E.; Raithel, G.; Anderson, D.A. Atomic measurements of high-intensity VHF-band radio-frequency fields with a Rydberg vapor-cell detector. Phys. Rev. A 2019, 100, 013420. [Google Scholar] [CrossRef]
  15. Holloway, C.L.; Prajapati, N.; Sherman, J.A.; Rüfenacht, A.; Artusio-Glimpse, A.B.; Simons, M.T.; Robinson, A.K.; La Mantia, D.S.; Norrgard, E.B. Electromagnetically induced transparency based Rydberg-atom sensor for traceable voltage measurements. AVS Quantum Sci. 2022, 4, 034401. [Google Scholar] [CrossRef]
  16. Duspayev, A.; Cardman, R.; Anderson, D.A.; Raithel, G. High-angular-momentum Rydberg states in a room-temperature vapor cell for dc electric-field sensing. Phys. Rev. Res. 2024, 6, 023138. [Google Scholar] [CrossRef]
  17. Ma, L.; Viray, M.A.; Anderson, D.A.; Raithel, G. Measurement of dc and ac electric fields inside an atomic vapor cell with wall-integrated electrodes. Phys. Rev. Appl. 2022, 18, 024001. [Google Scholar] [CrossRef]
  18. Ma, K.; Xiao, D.; Zhang, H.; Wang, X.; Wei, X. Study on electric field shielding in SiO2 and CaF2 vapor cell for Rydberg atom electric field sensors. J. Phys. D Appl. Phys. 2025, 58, 135113. [Google Scholar] [CrossRef]
  19. Cui, S.W.; Peng, W.X.; Li, S.N. Power Frequency Electric Field Measurement Based on Rydberg Atoms. High Volt. Eng. 2023, 49, 644–650. [Google Scholar]
  20. Li, W. Power-Frequency Electric Field Measurement Based on AC-Stark Effect of Rydberg Atoms. Shanxi University, Taiyuan, China. 2021. Available online: https://m.researching.cn/articles/OJ7f6d339f901f011f/referenceandcitations (accessed on 20 June 2025).
  21. Adams, C.S.; Pritchard, J.D.; Shaffer, J.P. Rydberg atom quantum technologies. J. Phys. B At. Mol. Opt. Phys. 2019, 53, 012002. [Google Scholar] [CrossRef]
  22. Zhao, Z.; Li, Y.; Yang, X.; Luo, C. Three-dimensional electric field sensor with low inter-axis coupling. J. Meas. Sci. Instrum. 2024, 15, 95–104. [Google Scholar] [CrossRef]
Figure 1. Relationship between the electric field intensity E and the Stark frequency shift Δ .
Electronics 14 02932 g001
Figure 2. Structural diagram of the Rydberg atom-based device.
Electronics 14 02932 g002
Figure 3. Structural diagram of the vapor cell with embedded electrode plates.
Electronics 14 02932 g003
Figure 4. Vapor cell model.
Electronics 14 02932 g004
Figure 5. Cloud chart of the electric field distribution.
Electronics 14 02932 g005
Figure 6. Electric field distribution from multiple viewpoints.
Electronics 14 02932 g006aElectronics 14 02932 g006b
Figure 7. Variations in the electric field with spatial position.
Electronics 14 02932 g007aElectronics 14 02932 g007b
Figure 8. Influence of the voltage measurement instrument on the space electric field.
Electronics 14 02932 g008
Figure 9. Calibration test diagram for the voltage measurement instrument under an almost uniform electric field in the laboratory.
Electronics 14 02932 g009
Figure 10. Test device diagram.
Electronics 14 02932 g010
Figure 11. Experimental results for the power frequency voltage of the Rydberg atom-based sensing device.
Electronics 14 02932 g011
Figure 12. Relationship between signal amplitude and electric field intensity.
Electronics 14 02932 g012
Figure 13. Schematic diagram showing the coupling effect of the electric field sensor.
Electronics 14 02932 g013
Disclaimer/Publisher’s Note: The statements, opinions and data contained in all publications are solely those of the individual author(s) and contributor(s) and not of MDPI and/or the editor(s). MDPI and/or the editor(s) disclaim responsibility for any injury to people or property resulting from any ideas, methods, instructions or products referred to in the content.

