Article

Insulator Defect Detection Based on Improved YOLO11n Algorithm Under Complex Environmental Conditions

1
College of Electrical Engineering and Information, Northeast Agricultural University, Harbin 150030, China
2
Key Laboratory of Northeast Smart Agricultural Technology of Ministry of Agriculture and Rural Affairs, Harbin 150030, China
*
Author to whom correspondence should be addressed.
Electronics 2025, 14(14), 2898; https://doi.org/10.3390/electronics14142898 (registering DOI)
Submission received: 13 June 2025 / Revised: 10 July 2025 / Accepted: 16 July 2025 / Published: 20 July 2025
(This article belongs to the Section Artificial Intelligence)

Abstract

Detecting defects in transmission line insulators is crucial to prevent power grid failures as power systems continue to expand. This study introduces YOL011n-SSA, an enhanced insulator defect detection technique method that addresses the challenges of effectively identifying flaws in complex environments. First, this study incorporates the StarNet network into the backbone of the model. By stacking multiple layers of star operations, the model reduces both parameter count and model size, improving its adaptability to real-time object detection tasks. Secondly, the SOPN feature pyramid network is introduced into the neck part of the model. By optimizing the multi-scale feature fusion of the richer information obtained after expanding the channel dimension, the detection efficiency for low-resolution images and small objects is improved. Then, the ADown module was adopted to improve the backbone and neck parts of the model. It effectively reduces parameter count and significantly lowers the computational cost by implementing downsampling operations between different layers of the feature map, thereby enhancing the practicality of the model. Meanwhile, by introducing the NWD to improve the evaluation index of the loss function, the detection model’s capability in assessing the similarities among various small-object defects is enhanced. Experimental results were obtained using an expanded dataset based on a public dataset, incorporating three types of insulator defects under complex environmental conditions. The results demonstrate that the YOLO11n-SSA algorithm achieved an mAP@0.5 of 0.919, an mAP@0.5:0.95 of 70.7%, a precision of 0.95, and a recall of 0.875, representing improvements of 3.9%, 5.5%, 2%, and 5.7%, respectively, when compared to the original YOLO1ln method. The detection time per image is 0.0134 s. Compared to other mainstream algorithms, the YOLO11n-SSA algorithm demonstrates superior detection accuracy and real-time performance.

1. Introduction

As power systems continue to expand in scale, the coverage of transmission line installation has also increased accordingly. They are predominantly distributed across diverse geographical landscapes, including mountains, forests, cities, farmlands, and plains [1]. Insulators, as key components of transmission lines, have the functions of mechanically supporting the transmission lines [2] and providing electrical insulation performance, which are crucial for the reliable operation of the power system. However, transmission line insulators experience prolonged exposure to natural environmental conditions and operational stresses, making them prone to various degrees of defects. Typical failure modes include self-explosion, damage, and flashover. If not repaired or replaced in time, in severe cases, insulator faults may cause the power grid to stop operating, resulting in significant economic losses [3]. Accordingly, to ensure the long-term stability and reliability of the power system, it is especially critical to timely detect and accurately identify the defect states of insulators [4,5]. Traditional insulator defect detection mainly relies on manual or robotic on-site inspection [6]. This inspection method not only demands substantial human resources but is also susceptible to omissions and misjudgments [7,8]. Moreover, the surrounding areas of high-voltage transmission lines have harsh environmental conditions, making it difficult to meet the requirements of UAV inspection.
In recent years, deep learning [9] and smart grid technologies [10] have advanced rapidly. Driven by these advancements, Unmanned Aerial Vehicle (UAV) inspection methods have emerged. These methods utilize image recognition technology for object detection on transmission lines. Consequently, UAV-based inspections have become mainstream [11,12]. This approach significantly enhances detection efficiency, accuracy, and flexibility. Currently, the most prevalent insulator detection method in UAV inspections is the object detection approach based on Faster R-CNN [13] and You Only Look Once (YOLO) [14] networks. However, due to the complex overall structure and large parameter count of the Faster R-CNN algorithm, its efficiency and accuracy in object detection are relatively low, making it difficult to achieve real-time object detection. In contrast, the YOLO series of algorithms proposed by Redmon et al. directly transform the object detection task into a regression problem [15]. This significantly reduces model complexity and makes it more suitable for edge computing scenarios [16]. In the study [17] published by Kang et al. in 2023, a new CNN structure based on the YOLOv7 network was introduced. This approach slightly enhances the average detection accuracy of various insulator defects by using a weighted bidirectional feature pyramid with an intra-unit skip structure to replace the PANet. In the study published by Wang et al. in 2024 [18], they proposed an improved algorithm based on YOLOv8m. In this algorithm, they introduced the CAM and feature CSO [19], reducing model parameters while improving the detection accuracy [18]. These methods are of great significance for insulator and defect detection, but also face problems: (1) These methods achieve relatively high detection accuracy for larger defects such as insulator damage and self-explosion; however, their performance on smaller target defects like flashover tends to be less accurate. (2) Most existing methods struggle to achieve a balance between model complexity, inference speed, and detection accuracy. (3) In actual inspection scenarios, the lighting conditions are complex, and low light or local overexposure may occur, affecting the accuracy of defect detection. (4) During inspections in mountainous or urban areas, UAVs typically take off under clear weather conditions. However, local cloudiness or fog may emerge during the detection process. This situation can result in false detections or missed defects.
With the ongoing optimization and iterative improvement of the YOLO series, architectures such as YOLOv8 [20], YOLOv9 [21], YOLOv10 [22], YOLOv12 [23], and YOLOv13 [24] have been successively released. As this study focuses on the inspection of small Unmanned Aerial Vehicle (UAV) equipment and scene applications [25], a more practical and lightweight algorithm is required. The primary contributions of this paper are summarized as follows:
Based on public datasets, an expanded dataset containing four different insulator detection categories is constructed for insulator defect detection and classification [26]. The four insulator detection categories in this dataset are insulator self-explosion, insulator flashover, insulator damage, and normal insulator. The imgaug library is employed to simulate and generate insulator defect datasets under conditions of low light, local overexposure, local cloudiness, and local fog, enhancing the robustness of the insulator defect detection algorithm.
By taking the YOLO11n network architecture as a basis, this study introduces StarNet, the SOPN feature pyramid network, the ADown module, and the NWD (Normalized Wasserstein Distance). We propose an improved multi-class insulator defect detection algorithm, YOLO11n-SSA, which substantially enhances the capability of the detection algorithm in complex inspection scenarios.
Experimental results based on the expanded dataset show that compared with algorithms such as YOLOv12n and YOLOv13n, YOLO11n-SSA has superior performance.

2. Methods

2.1. YOLO11n Object Detection Algorithm

YOLO11 [27] is a new algorithm launched by Ultralytics on 30 September 2024. Compared with the latest YOLOv12 and YOLOv13 in the YOLO series, YOLO11 demonstrates more mature and superior performance. It not only enhances detection accuracy but also accelerates inference speed, making it suitable for deployment on UAV inspection platforms [28] with constrained computational resources. The architecture of its network is illustrated in Figure 1.

2.2. Improved YOLO11n Method: YOLO11n-SSA

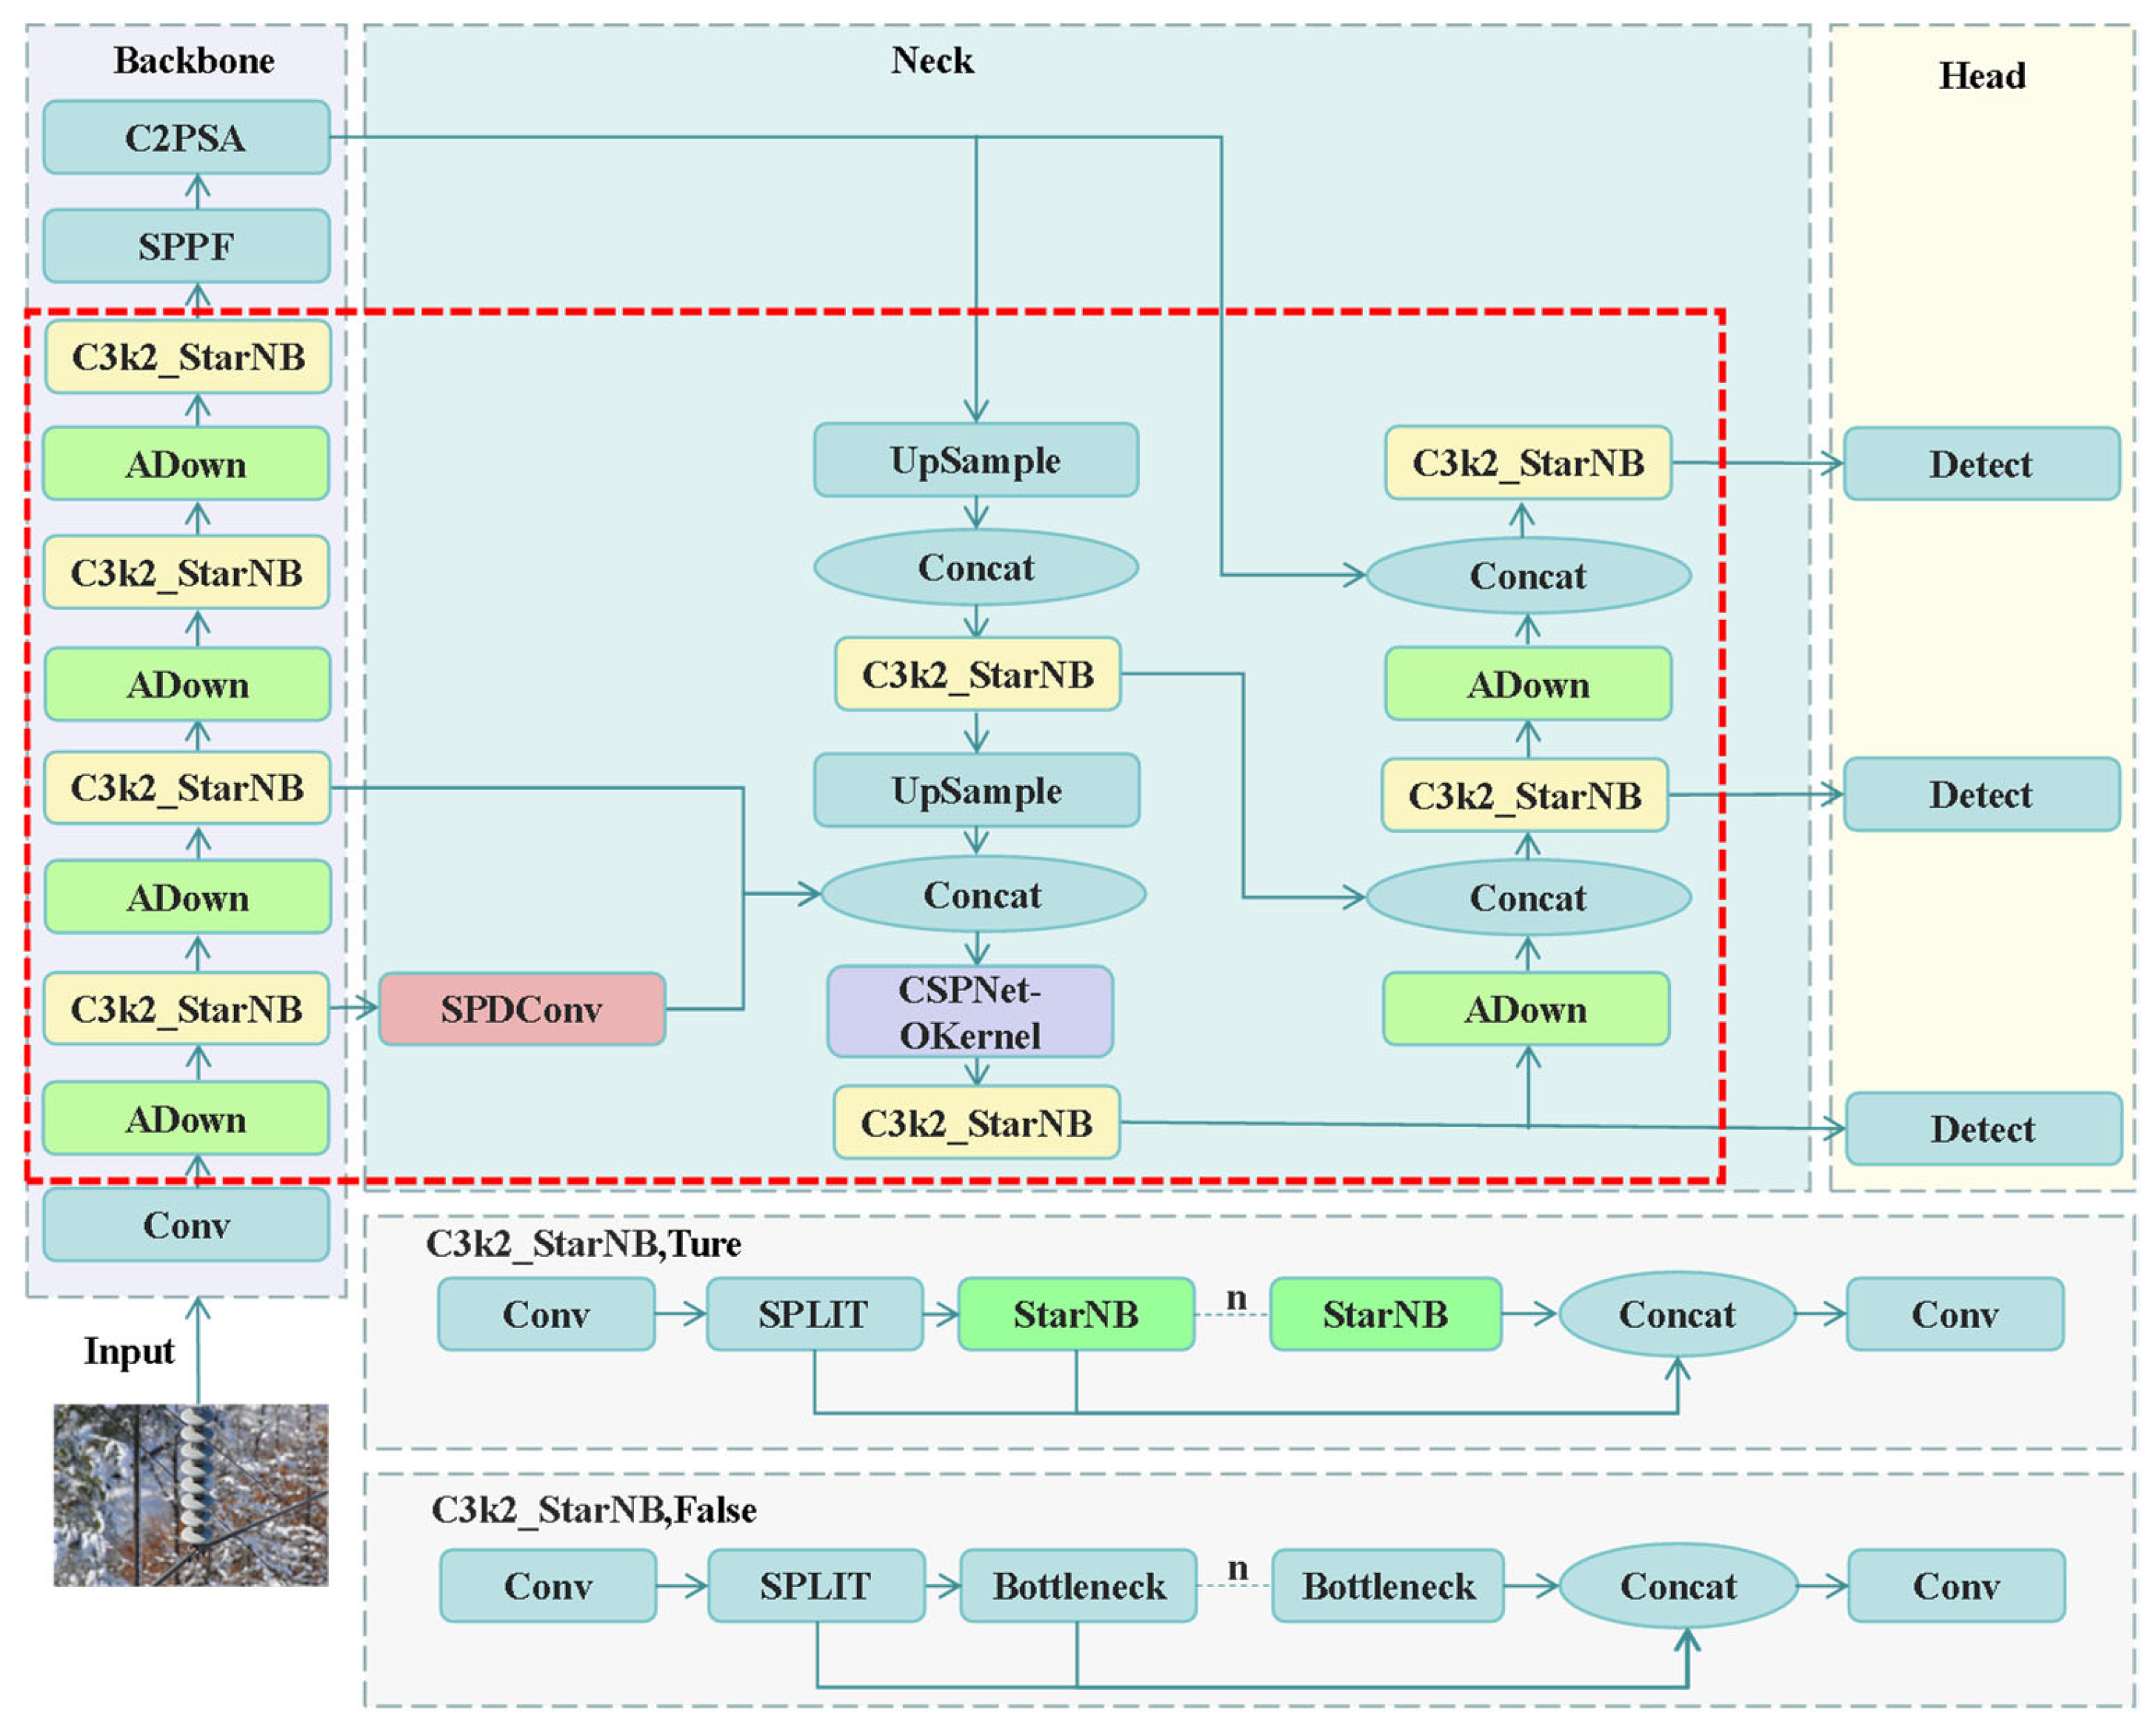
Figure 2 illustrates the network architecture diagram of the enhanced YOLO11n. Owing to the complex environmental conditions during actual inspections and the diversity in fault types, shapes, and sizes that need to be detected, the detection accuracy for small-object defects, such as flashover and damage, remains excessively low. This study first introduced the StarNet network structure to improve the C3k2 module in the backbone. It enhances the model’s inference speed while concurrently reducing its model size and parameter count [29]; then, the feature pyramid network SOPN is adopted to improve the neck part of the model. It effectively improves the model’s detection performance for small-object defects in insulators that are difficult to recognize; the ADown module is introduced to replace the convolutional modules in the model’s backbone and neck sections. This modification improves the model’s capability to capture image features. Additionally, the architecture is further simplified, resulting in a more compact and efficient structure [30]; in addition, by introducing the NWD to improve the evaluation index of the model’s loss function, the probability of missed detections for small-object insulator defects during UAV inspections has been effectively reduced. The improved algorithm is named YOLO11n-SSA.
1.
StarNet Network Structure
To enhance the inference speed and operational efficiency of the insulator defect detection model on embedded devices, the StarNet network structure [31] is introduced in this experiment. StarNet is a lightweight neural network architecture that achieves remarkable performance despite its compact design and limited computational resources. StarNet utilizes the star operation to map input data into a highly nonlinear feature space of extremely high dimension [32] without increasing computational complexity. By stacking multiple layers of star operations, StarNet can significantly increase the hidden feature dimension at each stage. This process achieves rich feature representation while maintaining a compact model.
In this implementation, StarNet enhances the inference speed of the YOLO11n network and compresses it. The star operation recursively increases the hidden dimension of the YOLO11n network. Assuming that the initial width of the YOLO11n network is c , the expression for one star operation is as follows:
i = 1 c + 1 i = 1 c + 1 w 1 i w 2 j x i x j
Suppose the width of an initial network is c , and * represents element-wise multiplication. Let O 1 denotes the output obtained after the l-th star operation; then, we have the following:
O 1 = i = 1 c + 1 i = 1 c + 1 w 1 , 1 i w 1 , 2 j x i x j c 2 2 1 O 2 = W 2 , 1 T O 1 W 2 , 2 T O 1 c 2 2 2 O 3 = W 3 , 1 T O 2 W 3 , 2 T O 2 c 2 2 3 O l = W l , 1 T O l 1 W l , 2 T O l 1 c 2 2 l
Let W 1 , W 2 c + 1 × c + 1 denote the weight matrices, where X c + 1 × 1 denotes the input feature tensor with c input channels. By stacking multiple neural network layers that incorporate star operations, the hidden dimensionality of the YOLO11n network can be exponentially expanded.
In this experiment, the C3k2 module of the model was improved by using the StarNet blocks. As shown in Figure 3, each star block is mainly composed of deep convolution and fully connected layers. Batch normalization is introduced after deep convolution to promote information fusion. After the element-wise multiplication operation, deep convolution is used for merging to further enhance the feature extraction capability.
By integrating StarNet into the YOLO11n algorithm, both parameter count and algorithm size are reduced while preserving high detection efficiency, thereby rendering the algorithm more compact. Simultaneously, this architecture accelerates the inference speed of the object detection algorithm by minimizing redundant computations and optimizing operations. This improvement enhances its adaptability to edge computing devices.
2.
Feature Pyramid Network of SOPN
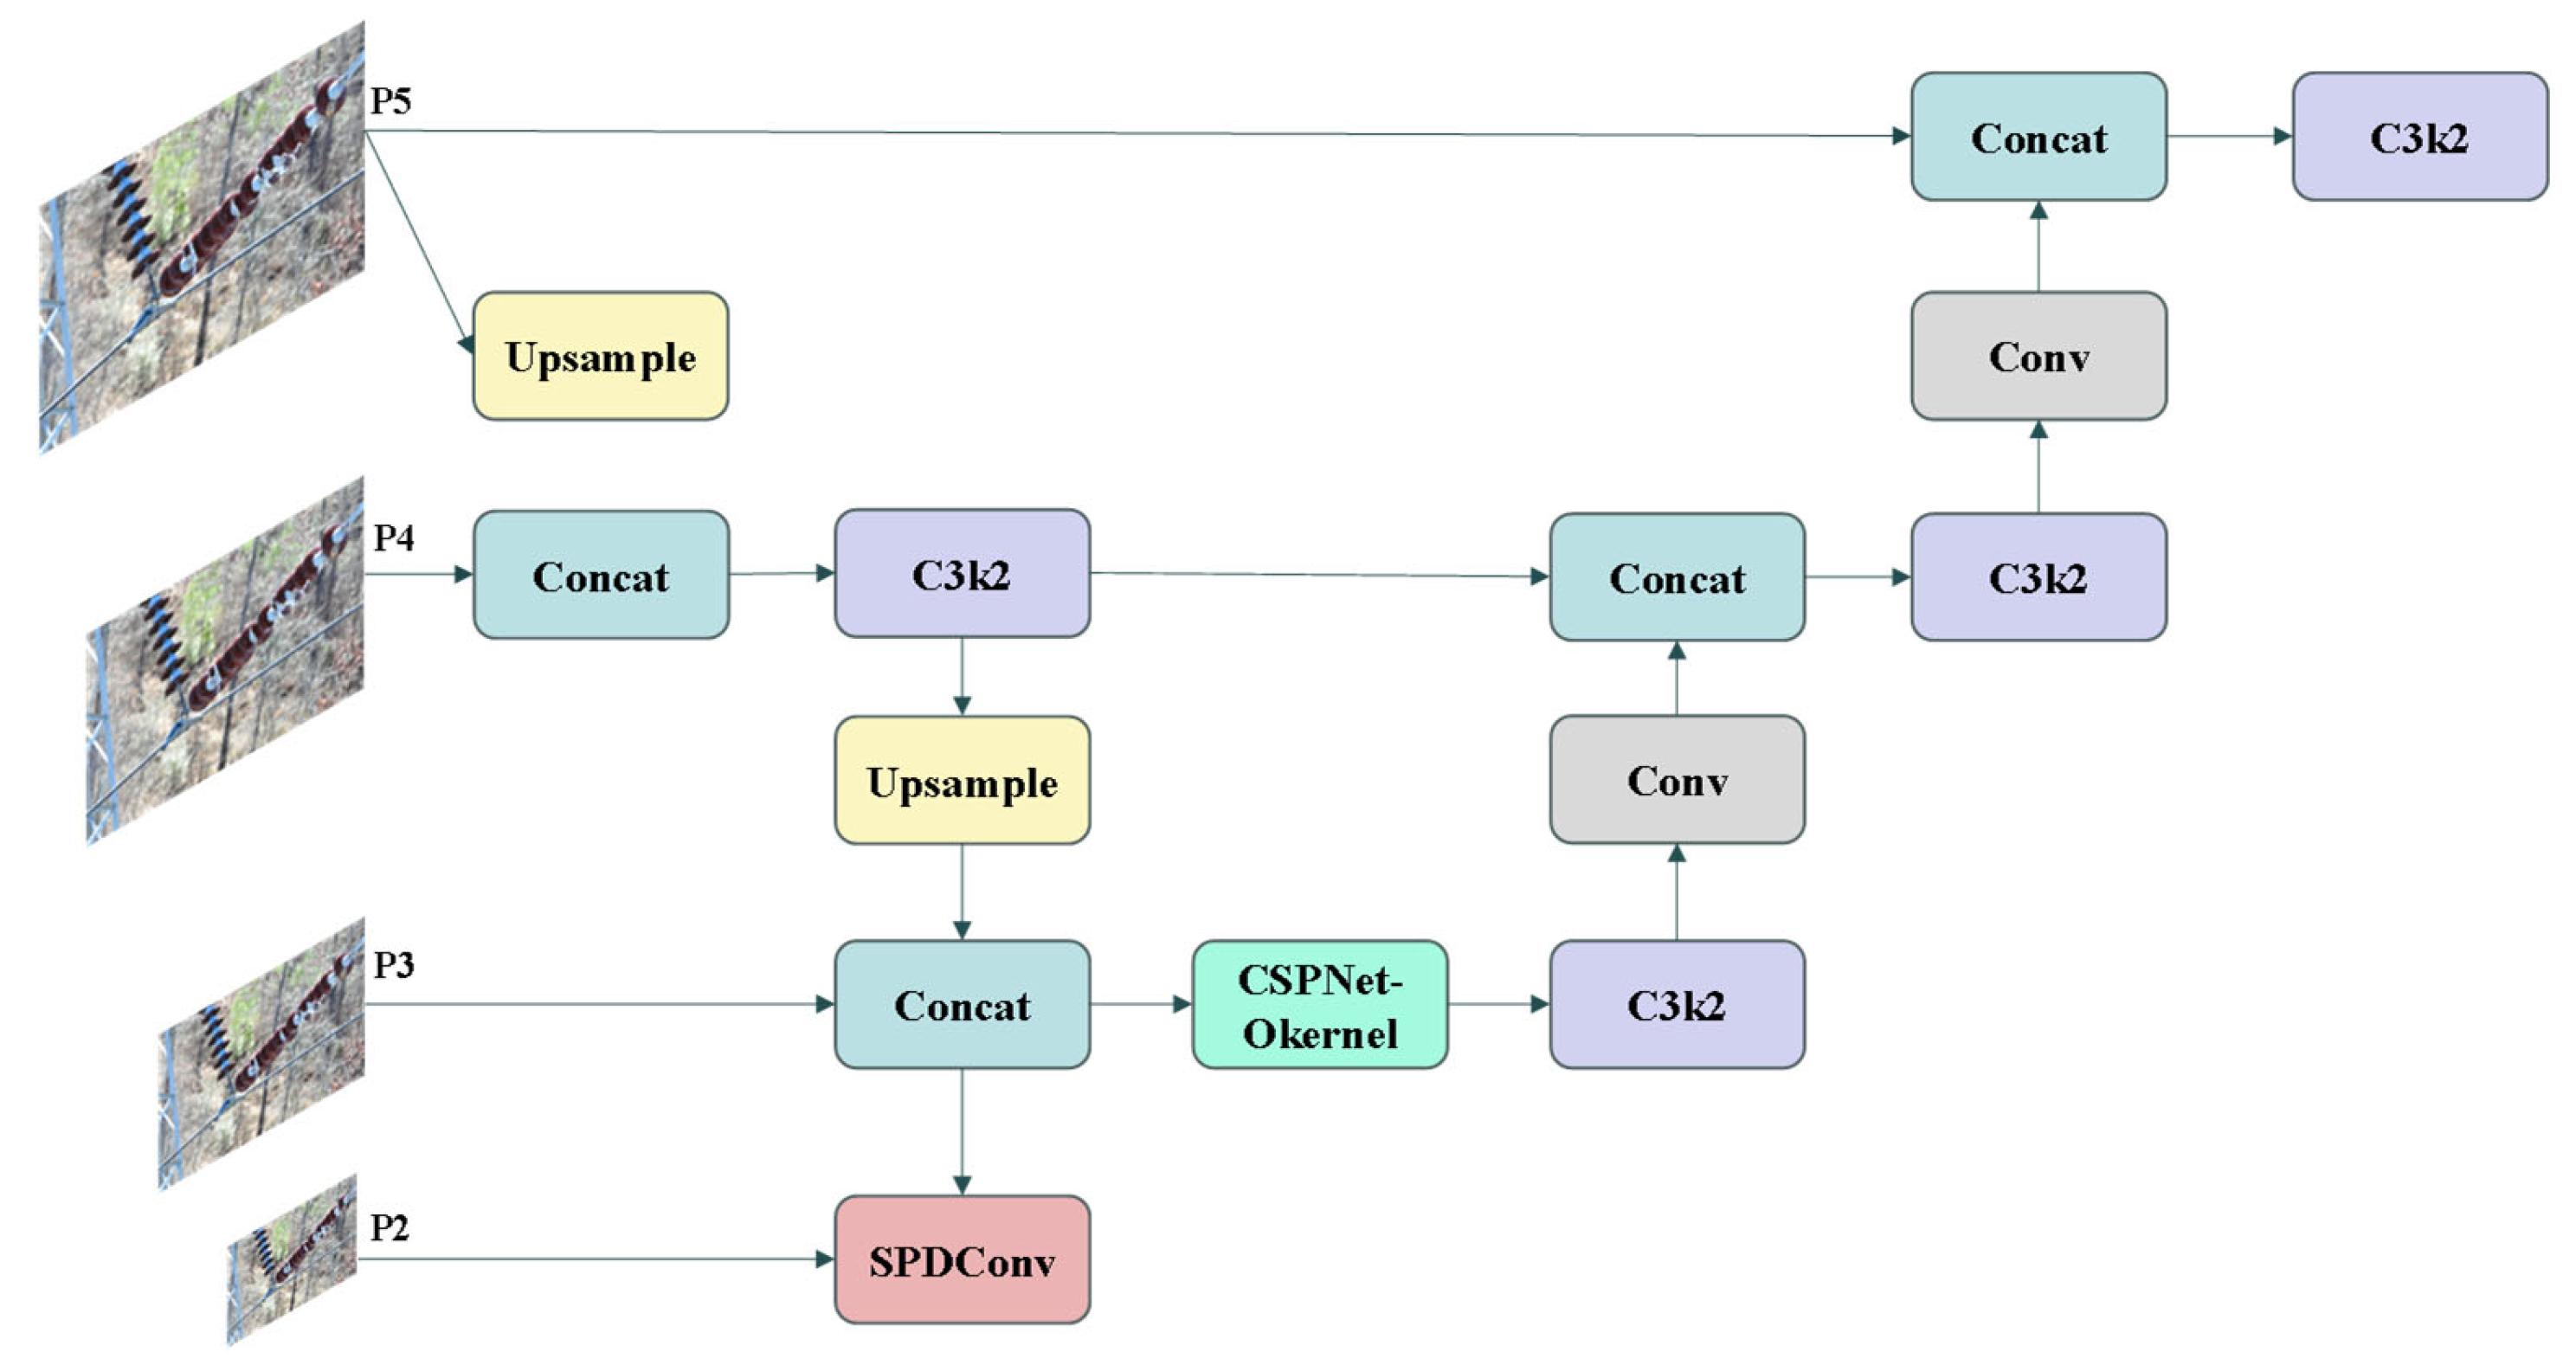
This study addresses the challenge of low detection accuracy for small-object defects in insulator inspection, particularly flashover phenomena. To enhance detection capability, we implement a feature pyramid network within the backbone architecture. The proposed module is designated as an SOPN (Small-Object Pyramid Network). The structural configuration is visually detailed in Figure 4. Traditional research methods optimize the detection capability of small objects by incorporating a P2 feature detection layer. In this study, the feature information output by the P2 feature detection layer is input into the SPDConv layer. SPDConv acquires the feature information of small objects through convolution operations and fuses it with the features obtained from the P3 feature detection layer. Subsequently, the fused features are fed into the CSPNet-OKernel module for feature integration, ultimately obtaining a more comprehensive object feature representation. The structure primarily consists of two key components: SPDConv and CSPNet-OKernel.
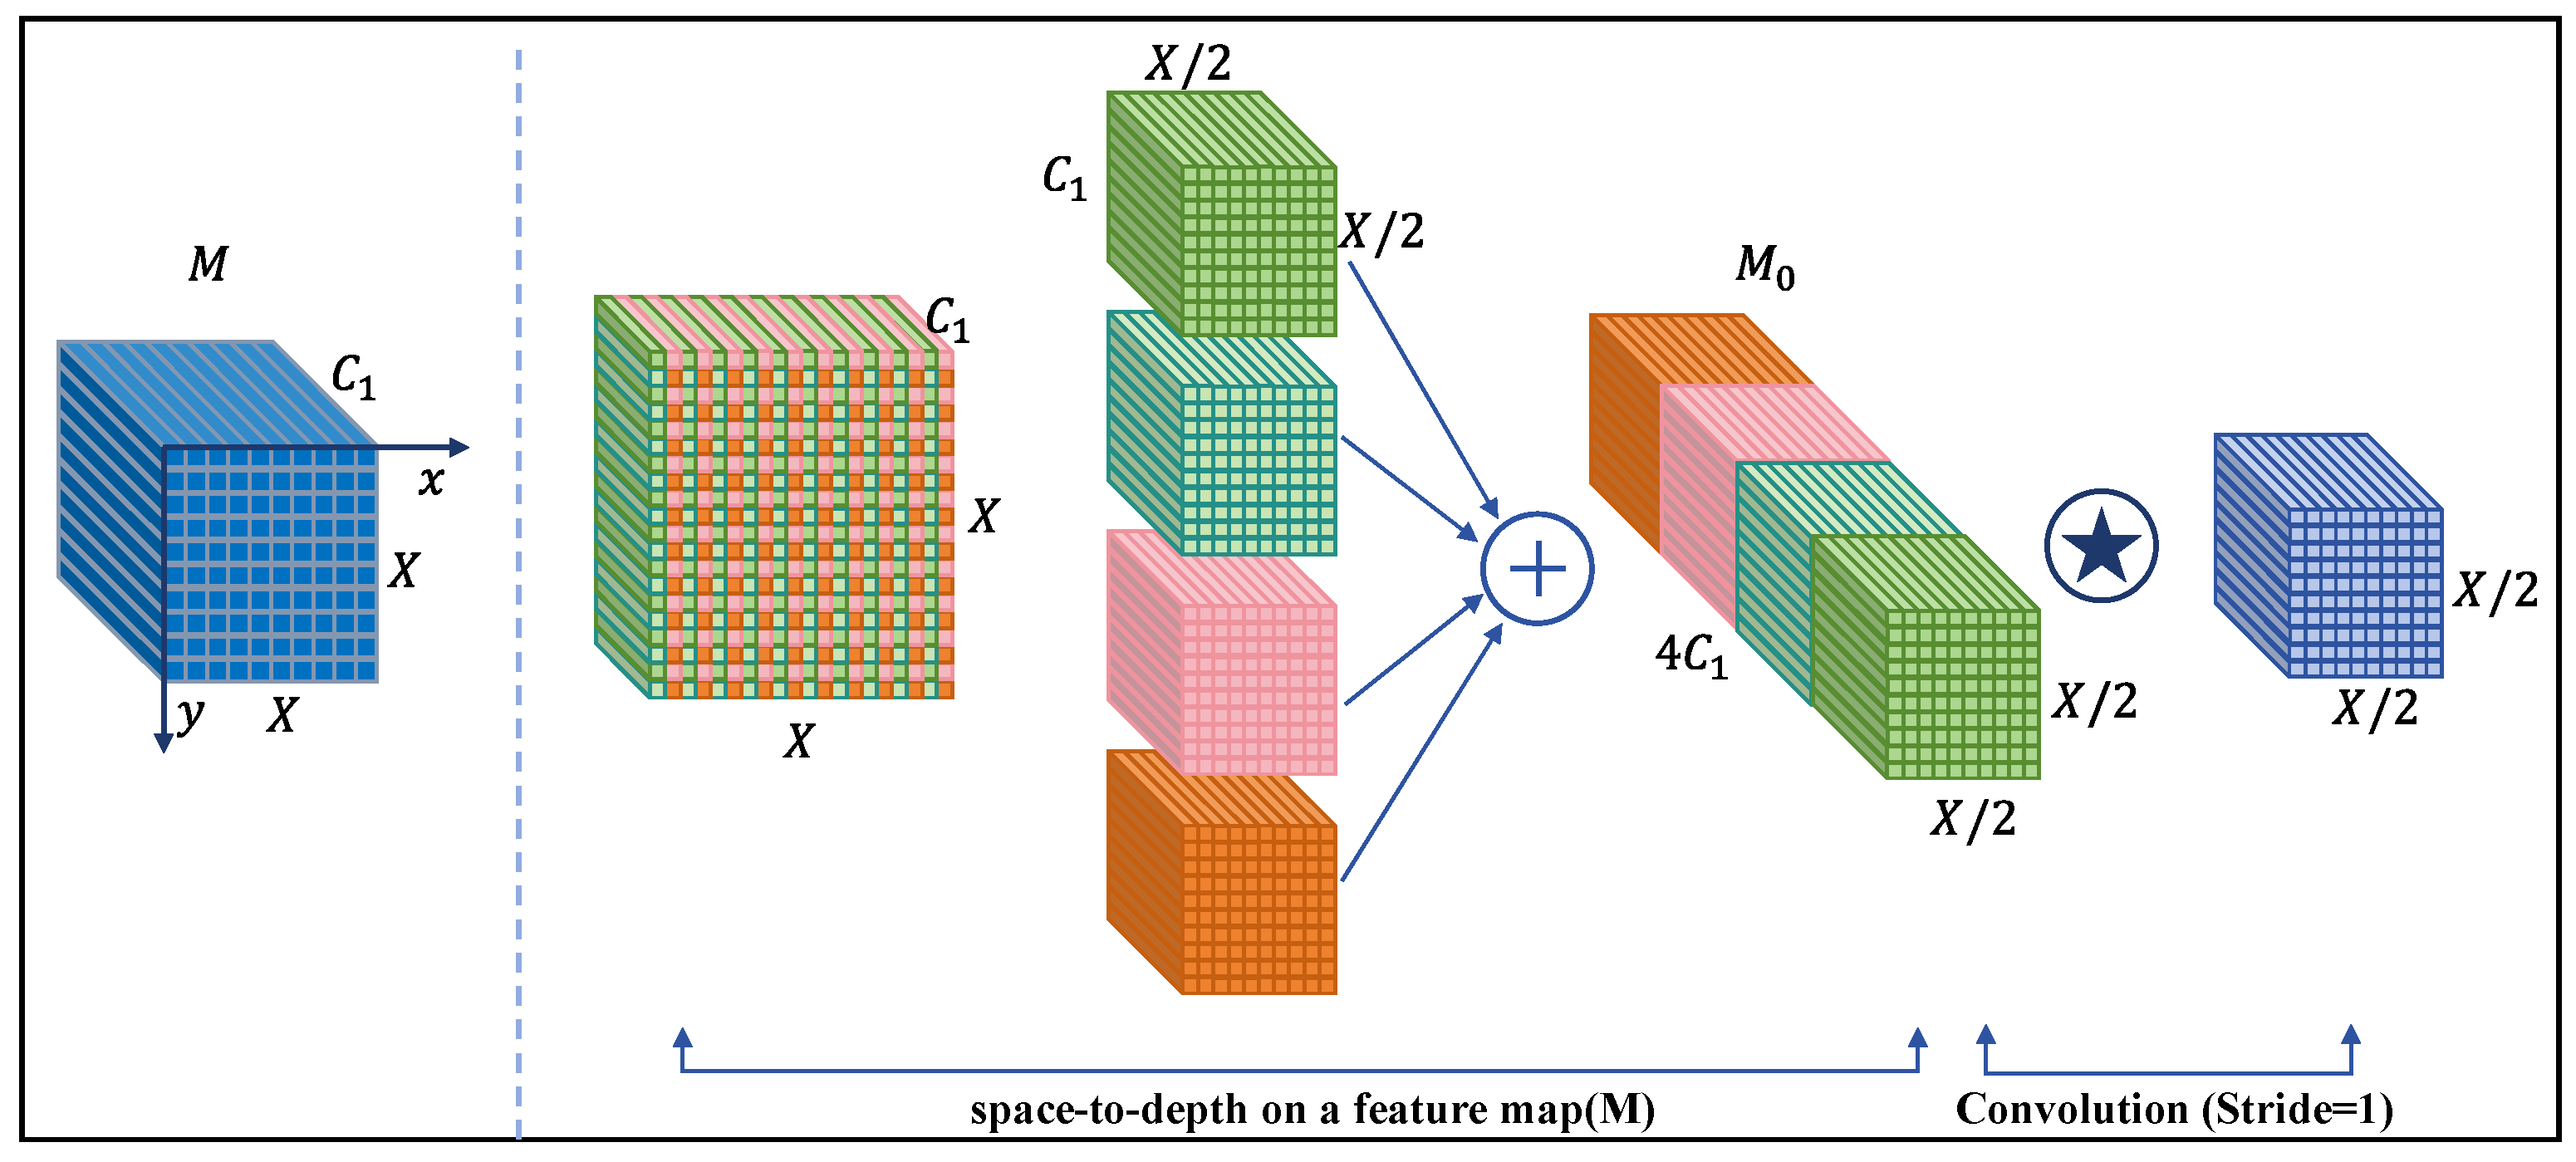
Unlike traditional convolution operations, the SPDConv layer downsamples the feature map M in the spatial dimension and expands its channel dimension, not only introducing more feature maps but also fully retaining key feature information [33]. That is to say, an arbitrary-sized feature map M has a size of X × X × C 1 . The SPDConv layer partitions the feature map into multiple sub-feature maps, each of which is formed by sampling every F pixel, thereby achieving downsampling. This is shown in Formula (3):
f 0 , 0 = M 0 : X : F , 0 : X : F , f 1 , 0 = M 1 : X : F , 0 : X : F , f F 1 , 0 = M F 1 : X : F , 0 : X : F , f 0 , F 1 = M 0 : X : F , F 1 : X : F , f 1 , F 1 = M 1 : X : F , F 1 : X : F , f F 1 , F 1 = M F 1 : X : F , F 1 : X : F
For instance, when F = 2 , the SPDConv structure is shown in Figure 5. The input feature map is divided into four sub-feature maps, namely f 0 , 0 , f 1 , 0 , f 0 , 1 , and f 1 , 1 , each with a size of X 2 , X 2 , C 1 . After concatenating these four sub-feature maps along the channel dimension, a new feature map M 0 X 2 , X 2 , C 1 is obtained.
After performing channel-wise concatenation of the sub-feature maps, the SPD transforms the original feature map M X , X , C 1 into an intermediate feature map M X F , X F , F 2 C 1 . Then, it is input into a convolutional layer with a stride of 1 and C 2 number of filters for channel dimension integration. When C 2 < F 2 C 1 , the intermediate feature map M X F , X F , F 2 C 1 is transformed into M X F , X F , C 2 . In this way, the SPD layer effectively retains key features while expanding the number of channels, thereby providing richer information for subsequent feature extraction.
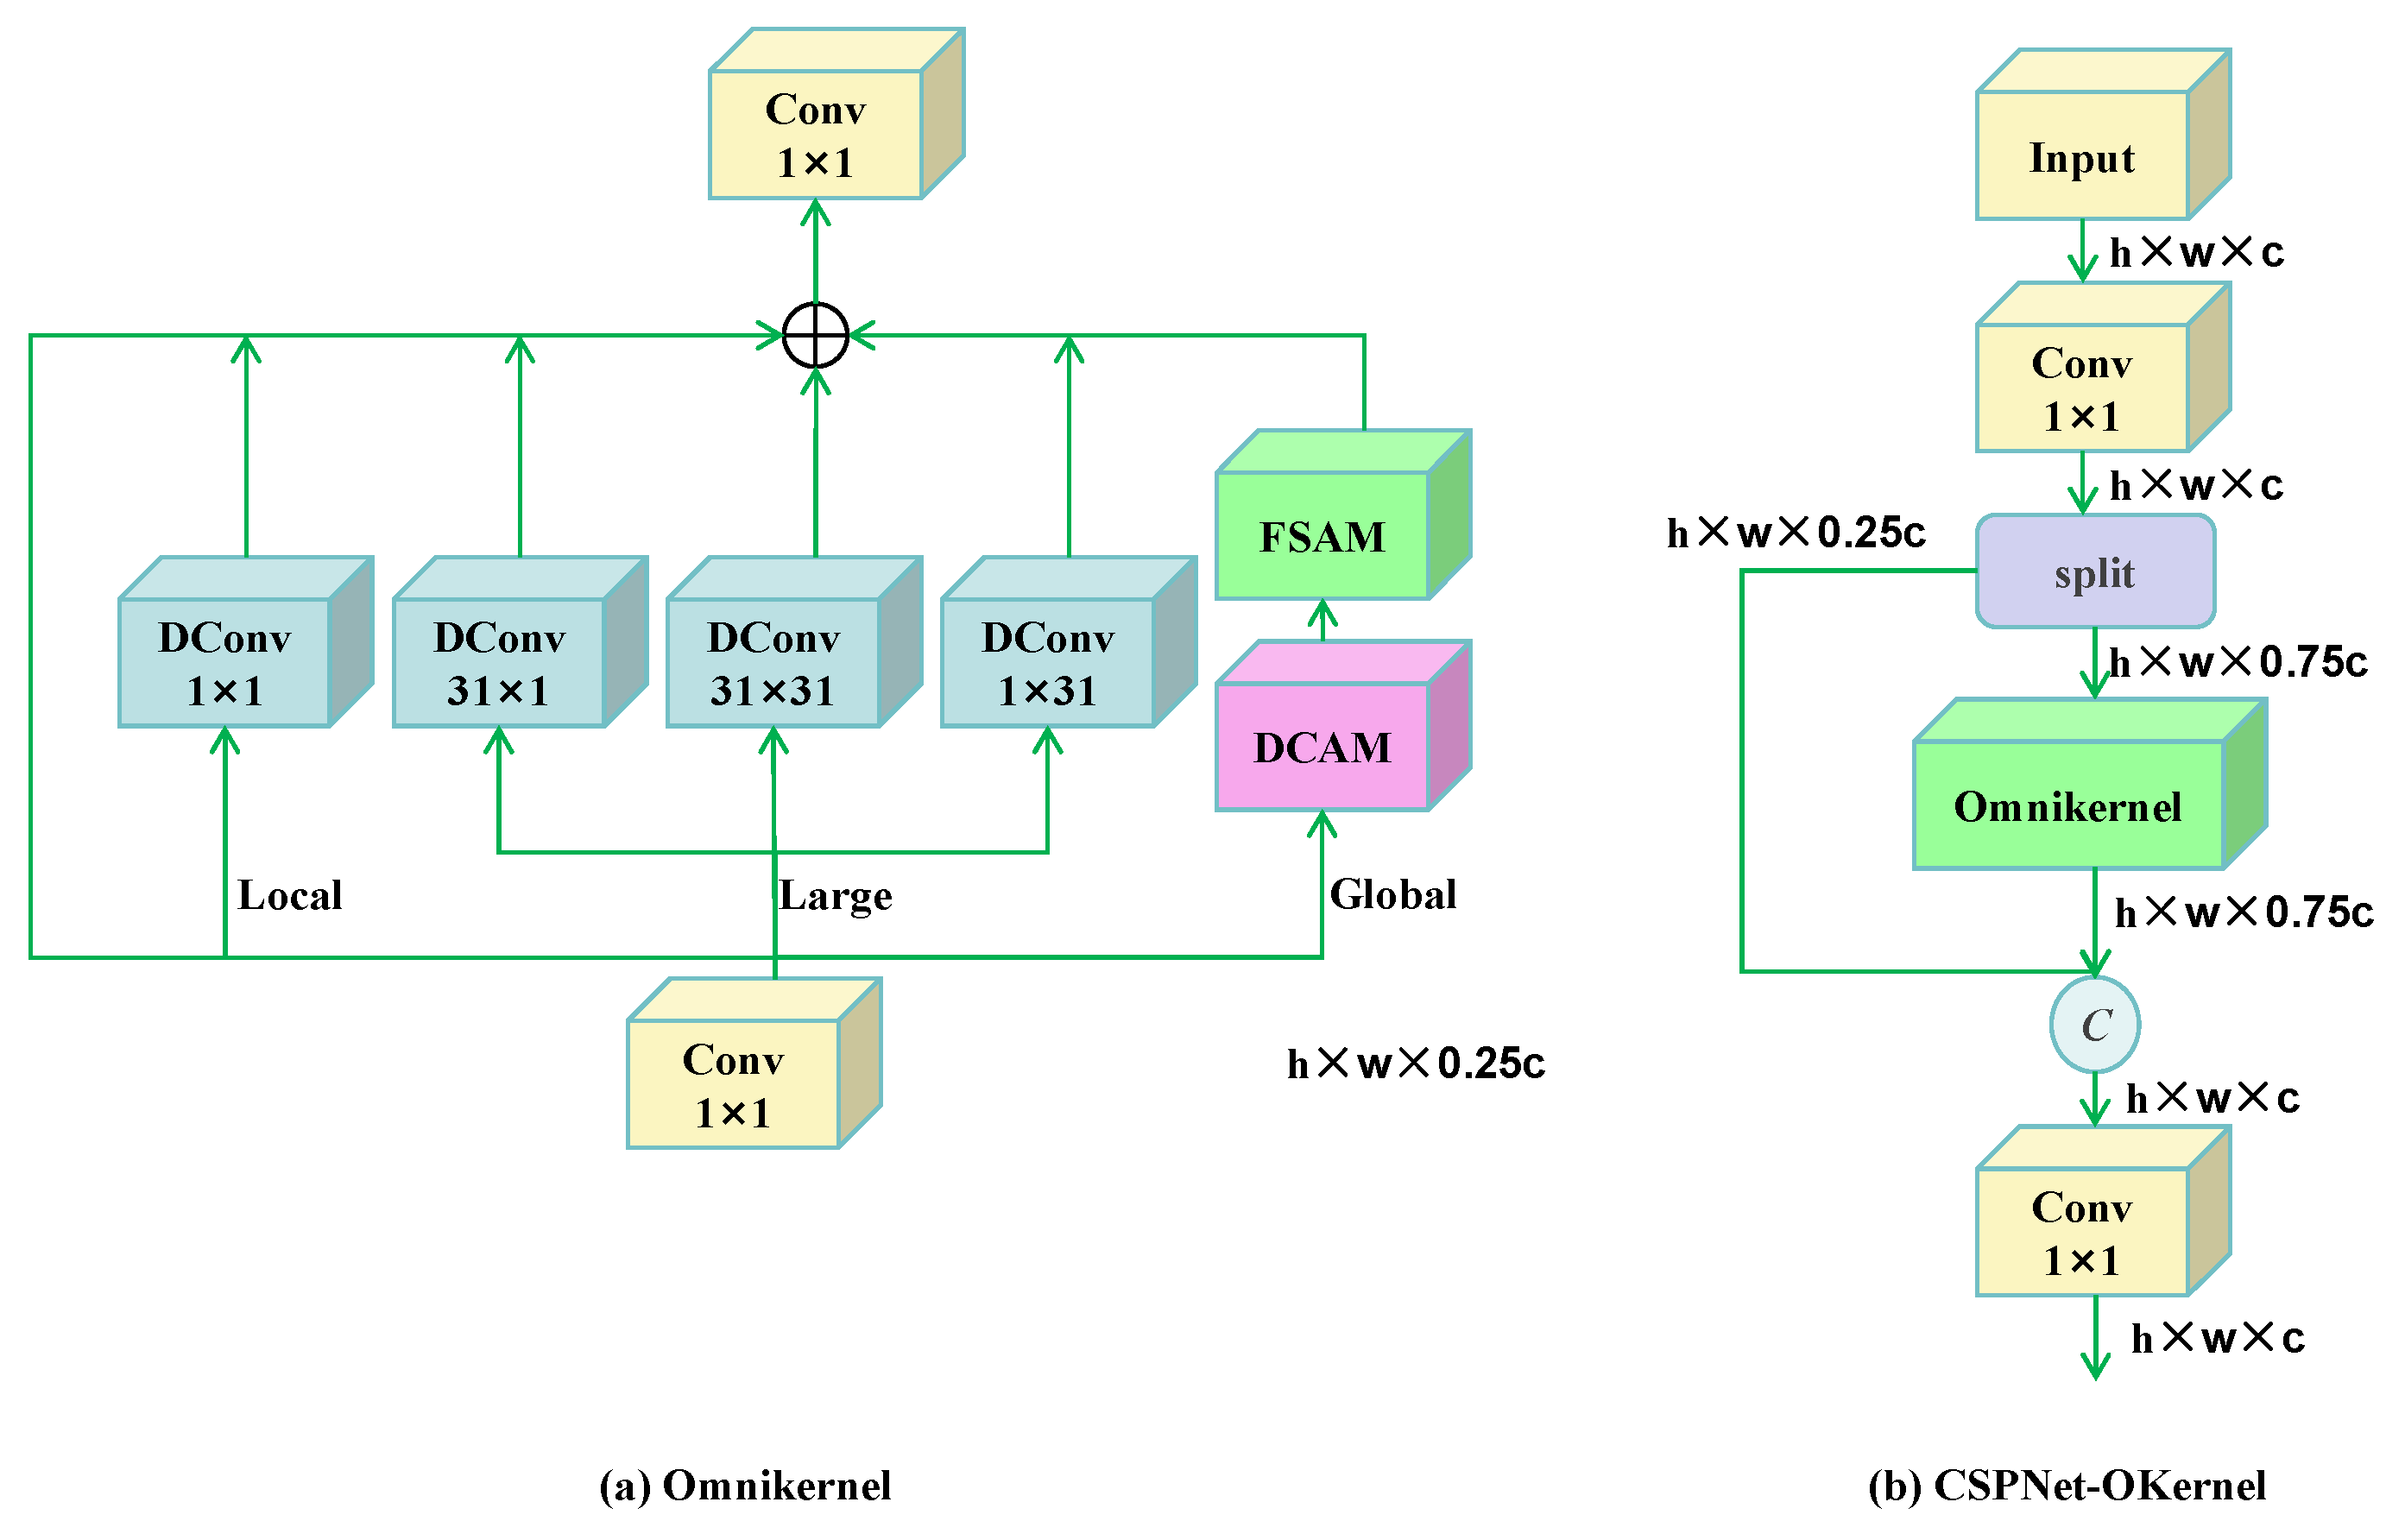
CSPNet-OKernel is a feature module developed by integrating CSPNet and OmniKernel, as illustrated in Figure 6. First, the original feature tensor is fed into a 1 × 1 convolutional layer to adjust the dimensionality of the feature map and apply a nonlinear transformation. Then, the split function is used to perform tensor splitting on the feature tensor, and the split feature tensors are allocated to different processing branches according to the predefined rules. Among these, a subset of feature tensors are fed into the OmniKernel module to achieve optimized multi-scale feature fusion. As shown in Figure 6a, the OmniKernel module comprises three branches: the global branch, the large branch, and the local branch. The global branch dynamically adjusts the feature weights of different channels through the DCAM (Dual-domain Channel Attention Mechanism), enhancing the ability to obtain key features, and improves the feature screening capabilities through the FSAM (Frequency-Selective Attention Mechanism). The large branch utilizes deep convolutional layers to expand the receptive field, enriching the extracted feature information. The local branch employs point-wise convolution to preserve the local feature details of objects as much as possible. Finally, the processed tensor from the OmniKernel module is concatenated with the other split tensor and then passed through a 1 × 1 convolution layer for the final output.
By introducing the SOPN into the neck part of YOLO11n, the model’s feature extraction capability has been significantly enhanced. This enables the model to capture features of different scales and finer details in actual detection. Consequently, the model achieves more comprehensive coverage of targets differing in size. This comprehensive coverage serves to enhance the robustness of the detection system. Furthermore, it significantly amplifies the effectiveness of detecting defects in insulators. It exhibits better performance in identifying small-object defects that are challenging to distinguish against complex backgrounds.
3.
ADown Module
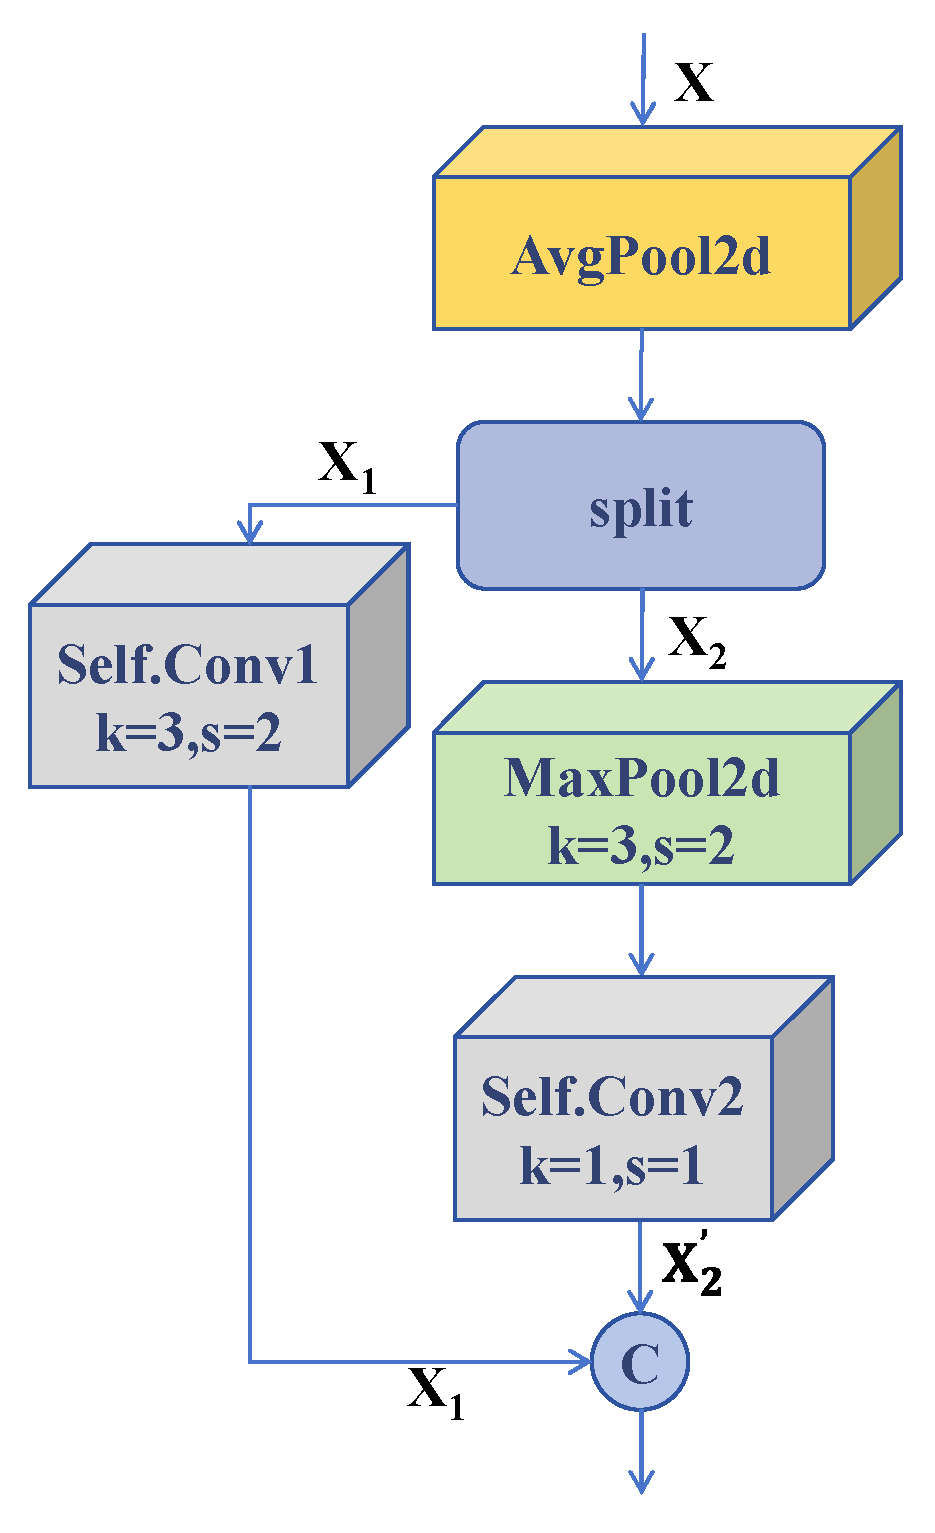
To enhance edge device detection efficiency without compromising YOLO11n’s performance, we integrate the YOLOv9’s ADown downsampling module [34], the architecture of which is detailed in Figure 7. The ADown module integrates a dual-branch downsampling structure. This structure incorporates max pooling operations. Additionally, the module leverages convolutional layers to extract key information from feature maps. This integration effectively reduces computational costs. Simultaneously, it maximizes the retention of key feature information of the target. Consequently, the ADown module is rendered more suitable for UAV inspection scenarios.
Let us define the number of input channels as S 1 and the number of output channels as S 2 . We set half of the output channels S 2 as the number of output channels for the two internal convolutional layers and store them in the Self.Conv convolutional module. We apply an 2 × 2 average pooling operation with a stride of 1 to the input feature map X , halving its spatial dimensions. As shown in Figure 7, the pooled feature map X is subsequently partitioned into two-channel-balanced components along the channel axis, formally defined as X 1 and X 2 . We create two convolutional layers, denoted as Self.Conv1 and Self.Conv2. Specifically, Self.Conv1 employs a kernel size of 3 with a stride of 2, while Self.Conv2 utilizes a kernel size of 1 and a stride of 1. We apply the Self.Conv1 convolutional layer to X 1 , and the processed feature map remains X 1 ; for X 2 , we first apply max pooling with a window size of 3 and a stride of 2, and then it is processed via the pooled X 2 through the Self.Conv2 convolutional layer to obtain X 2 . The features X 1 and X 2 are concatenated along the channel axis to synthesize the final output tensor.
By replacing the Conv modules in the backbone and neck with the ADown module, it performs downsampling between different layers of the feature map, effectively reducing parameter count and computational cost significantly while further refining the resolution of the feature map to facilitate more precise detection.
4.
Improvement in NWD Loss Function
Given the prevalence of numerous small objects in insulator defect detection which occupy only a limited number of pixels in images, current object detection algorithms relying on the IOU (Intersection over Union) evaluation metric face significant challenges in accurately identifying defects when positional deviations occur for small objects. To address this challenge, the experiment integrates the NWD [35] to enhance the model’s loss function. The Normalized Wasserstein Distance (NWD) operates as a similarity evaluation metric, computed by modeling bounding boxes as 2D Gaussian distributions and measuring the distributional divergence through Wasserstein distance computation.
For insulator defect object detection, most rectangular bounding boxes typically include a small number of background pixels. The bounding boxes exhibit distinct spatial distributions, with defective target pixels aggregating predominantly in central regions and background pixels preferentially localizing along peripheral areas. To achieve a more precise characterization of the weights assigned to individual pixels within the bounding box, the bounding box is mathematically modeled as a two-dimensional Gaussian distribution. For a horizontally oriented bounding box R = d x , d y , l , h , where d x , d y represents the center coordinates and l and h denote the width and height, respectively, the probability density function of the 2D Gaussian distribution is defined as follows:
f x | μ , Σ = e x p ( 1 2 x μ T Σ 1 x μ ) 1 2 Π Σ 1 / 2
Here, x , μ , and Σ, respectively, denote the coordinates x , y , the mean vector of the Gaussian distribution, and the covariance matrix. When x μ T 1 x μ = 1 , it can be modeled as a 2D Gaussian distribution S μ , Σ , where
μ = d x d y ,   Σ = l 2 4 0 0 h 2 4 .
For two-dimensional Gaussian distributions considered in Wasserstein distance computation, designated as μ 1 = S m 1 , Σ 1 and μ 2 = S m 2 , Σ 2 , respectively, the distance metric is formally defined as follows:
W 2 2 μ 1 , μ 2 = m 1 m 22 2 + T r Σ 1 + Σ 2 2 Σ 2 1 / 2 Σ 1 Σ 2 1 / 2 1 / 2
Its simplified form is
W 2 2 μ 1 , μ 1 = m 1 m 2 2 2 + Σ 1 1 / 2 Σ 2 1 / 2 F 2   ,
where . is the Frobenius norm. For the bounding box A = d x a , d y a , l a , h a , B = d x b , d y b , l b , h b , and it can be further simplified in the following manner:
W 2 2 S a , S b = d x a , d y a , l a 2 , h a 2 T , d x b , d y b , l b 2 , h b 2 T 2 2
Since W 2 2 S a , S b serves as a distance metric, it is not directly applicable as a similarity metric. Consequently, by normalizing the exponential form of W 2 2 S a , S b , the NWD is derived, where C denotes a constant reflecting the dataset size.
Given that W 2 2 S a , S b functions as a distance metric, it is not inherently suitable for use as a similarity metric. To address this limitation, the exponential form of W 2 2 S a , S b is normalized, leading to the derivation of the NWD (Normalized Wasserstein Distance). Here, C represents a constant that reflects the size of the dataset:
N W D S a , S b = e x p W 2 2 S a , S b C
By incorporating the Normalized Wasserstein Distance, the detection model’s capability to compute similarity among various small-object defects has been effectively enhanced, thereby remarkably enhancing the model’s detection accuracy in detecting small-object insulator defects and strengthening its ability to recognize defects such as flashover and self-explosion during real inspection tasks.

3. Results

3.1. Dataset Preparation

From the publicly available outdoor background datasets CPLID, IDID, BGI, and OPDL (from GitHub, IEEE Data Port, and PPGEE) under normal lighting conditions, a dataset of 5632 insulator images is obtained, covering four categories: insulator self-explosion, insulator flashover, insulator damage, and normal insulators. To enhance the diversity of the dataset for better training results, this experiment utilizes the imgaug library to apply techniques such as noise addition, black box addition, rotation, and blurring to the images, resulting in a dataset of 5049 images. Additionally, in actual inspection scenarios, lighting conditions are complex. These conditions can be influenced by various factors. For instance, direct sunlight angles, such as midday direct sunlight, metal surface reflections, or backlit inspection, play a significant role. Importantly, low-light environments, such as inspections near dusk, can also affect the lighting. These factors contribute to the occurrence of both overexposed and low-light scenes. When the inspection location is in mountainous or urban areas, due to geographical and climatic conditions, after taking off under good weather conditions, local cloudy and foggy scenes may occur during the inspection process. To simulate these four scenarios, the experiment uses the imgaug library to process the dataset, obtaining 4800 images. A dataset comprising 15,481 insulator images is ultimately constructed and named as ‘Insulator Defect Dataset_2024’. Representative examples from the four source datasets are shown in Figure 8, with panels (a), (b), (c), and (d) corresponding to the CPLID, IDID, BGI, and OPDL datasets, respectively. The complete dataset is subsequently divided into training, validation, and test sets using an 8:1:1 ratio.

3.2. Experimental Environment

The experimental platform is equipped with a computational architecture featuring an Intel Xeon Platinum 8358P processor (32 cores @ 2.60 GHz), 80 GB DDR4 RAM, and an NVIDIA RTX 3090 GPU with 24 GB GDDR6X memory. The software environment is configured using CUDA 12.1 for acceleration on Ubuntu 22.04, utilizing Python 3.10 with PyTorch 2.1 within the JupyterLab framework. For model optimization, input images are resized to 640 × 640 pixels and the batch size is set to 32. Training proceeded over 300 epochs under a constant learning rate policy (α = 0.01).

3.3. Evaluation Metrics

In object detection frameworks, the evaluation of algorithm efficacy employs five principal quantitative metrics: precision (P), recall (R), mean Average Precision (mAP), parameters, and model size.
Precision quantifies the ratio of true positive predictions to total positive detections, while recall measures the proportion of ground-truth positives successfully identified by the model. The mAP@0.5 metric evaluates detection accuracy at a 50% Intersection over Union (IoU) threshold, whereas mAP@0.5:0.95 represents the average mAP value across IoU thresholds ranging from 50% to 95%. The mathematical formalization of these metrics is expressed through Formula (10):
P = N T P N T P + N F P , R = N T P N T P + N F N
In Formula (10), N T P denotes the number of bounding boxes correctly identified and localized for the target objects. N F P refers to the number of bounding boxes that the algorithm incorrectly identified for the target objects, meaning that the IOU (Intersection over Union) of these bounding boxes with any real target objects is lower than the set threshold. N F N indicates the number of target objects that the algorithm failed to identify, i.e., the existing real target objects that are not detected by the algorithm.
A P = 1 m × P 1 + 1 m × P 2 + + 1 m × P m = P R d R m a p = 1 c J C A P j
In Formula (11), R represents recall rate, P represents precision, and AP represents the average precision of one type of sample.

3.4. Experimental Results and Analysis

1.
Comparative Experiments
To validate the efficacy of the improved method, comparative experiments were conducted under the same experimental conditions as those used with other popular detection algorithms in recent years, including the latest YOLOv12n and YOLOv13n algorithms released in 2025. All experiments utilized the Insulator Defect Dataset_2024, and the results are summarized in Table 1.
Table 1 demonstrates that the proposed method surpasses other leading detection algorithms, including the 2025-released YOLOv12n and YOLOv13n, in multi-domain insulator detection. Furthermore, the enhanced algorithm YOLO11n-SSA achieves the highest mAP@0.5 score of 0.919, representing a 3.9% improvement over its predecessor, YOLO11n. It also reaches the highest values in precision (P), recall (R), and mAP@0.5:0.95, with respective improvements of 2%, 5.7%, and 5.5% over the original algorithm. Meanwhile, the YOLO11n-SSA algorithm not only achieves high detection performance but also balances model size, parameter quantity, and inference speed well. In particular, it reduces model size and parameter quantity by 5.5% and 5.3%, respectively, which better meets the hardware requirements for edge deployment on UAVs. Therefore, the YOLO11n-SSA algorithm has superior detection capabilities compared to other mainstream detection algorithms in insulator defect detection under complex environmental conditions.
2.
Ablation Experiments
To perform comprehensive analysis of the influence of the four enhancements in YOLO11n on the algorithm’s detection performance, this paper performs ablation experiments on these four improvement measures. The effects of the enhancements are evaluated based on four main evaluation metrics: precision (P), recall (R), mAP@0.5, and mAP@0.5:0.95. To ensure the consistency of the referenced datasets, a unified dataset (Insulator Defect Dataset_2024) is used for experimental verification. The comparative analysis of the experimental results is presented in Table 2.
From the above table, it can be observed that through the effectiveness analysis of the YOLO11n-SSA algorithm, it is found that each improvement method positively impacts the algorithm. Among these enhancements, the SOPN achieves the most substantial improvement in mAP@0.5. Furthermore, both StarNB and ADown contribute to enhancing the model’s detection speed to some extent while reducing the algorithm’s parameter count.
When StarNB is introduced into the YOLO11n algorithm by stacking multiple layers of star operations at each stage, the implicit feature dimension is significantly increased while maintaining computational efficiency. This enables the acquisition of richer and more expressive feature representations. Consequently, although accuracy slightly decreases, parameter count is reduced by 5.5% and model size is decreased by 7.9%.
By introducing the SOPN, the model’s feature extraction capability is effectively enhanced, enabling it to capture more detailed feature information at different scales in actual detection, comprehensively covering objects of various sizes and improving detection robustness. On this basis, the mAP@0.5 value increases by 6.9%, the mAP@0.5:0.95 value increases by 8.2%, precision improves by 3.7%, the recall rate decreases by 9.7%, parameter count increases by 19.6%, and the model size increases by 19%.
When the ADown module is combined with the first two improvement steps, both the spatial dimension of the feature map and model complexity are reduced by adjusting the stride of the convolutional layer while simultaneously optimizing parameter count in the convolutional layer. Upon integration with the first two improvement steps, the detection accuracy remains largely unchanged, while parameter count is reduced by 16.5% and the model size is decreased by 15.6%.
The object detection algorithm based on the IOU evaluation metric is insufficient to address the issue of accurately identifying defects in small objects when dealing with positional deviations. To improve this, the NWD is introduced to enhance the loss function in the model. This enhancement is built upon the previous three improvement measures. As a result, the accuracy is increased by 0.7% and the mAP@0.5:0.95 value is improved by 0.8%, while the other parameters remain basically unchanged.
3.
Presentation of Detection Results
In actual situations, insulators are prone to being affected by the natural climate, material aging, and other factors, which can lead to defects such as self-explosion, damage, and flashover. Defects such as insulator damage and flashover are often very small in size. They are also difficult to detect accurately. Therefore, the defect detection effects of the algorithm are tested through experiments. The testing is conducted under different environments, comparing the performance before and after the improvement in the algorithm. As shown in Figure 9, in this group of images, by comparing the detection results of the original algorithm with those of the improved algorithm, the excellent detection performance of the YOLO11n-SSA algorithm under common clear weather conditions is demonstrated.
As illustrated in Figure 10, the detection performance of the YOLO11n-SSA algorithm across three types of defects is evaluated under four typical environmental conditions using the set of images presented: low light, local overexposure, localized foggy weather, and localized cloudy weather.
(1)
The YOLO11n-SSA algorithm significantly enhances the detection performance of small objects in complex backgrounds.
As can be seen from Figure 9e and Figure 10e–g, when there are small-object defects in the original image with a complex background, the YOLO11n algorithm has difficulty in accurately identifying the scattered defects in the complex environment, resulting in missed detections and false detections. As shown in Figure 9h and Figure 10i–k, when the YOLO11n-SSA algorithm is used, it comprehensively detects and marks small-object defects such as damage and flashover, thereby effectively enhancing the detection confidence and performance of the algorithm.
(2)
The YOLO11n-SSA algorithm improves the detection of small objects at long distances.
From the detection results of the YOLO11n algorithm for self-explosion defects in Figure 9f and Figure 10h, it can be found that when the detection object is at a relatively distant position, its object size is often small. At this time, the original algorithm can only detect larger objects such as insulators, and there is a phenomenon of missed detection for small self-explosion defects. As shown in Figure 9i and Figure 10l, through improvement, the YOLO11n-SSA algorithm can accurately identify the small-sized self-explosion defects in complex backgrounds, demonstrating superior capability.
The comparison results presented in Figure 9 and Figure 10 confirm the findings. In contrast to the YOLO11n algorithm, the YOLO11n-SSA algorithm effectively mitigates the adverse effects of complex environmental conditions on detection accuracy. Furthermore, it enhances the performance of small-object defect detection. The YOLO11n-SSA algorithm achieves more accurate and comprehensive detection of insulator defects. This improvement is observed across varying distances, angles, and environmental conditions. As a result, the YOLO11n-SSA algorithm demonstrates superior detection performance.
4.
Visualization of Prediction Results: Heat Map Comparison Chart
To verify that the improved algorithm can more accurately identify insulator self-explosion, damage, and flashover defects, as shown in Figure 11, the visualization heat maps of the prediction results generated by YOLO11n and the improved algorithm are compared as follows. Figure 11a represents the original input image, Figure 11b illustrates the visualization heat map generated by the YOLO11n algorithm after passing through the module, and Figure 11c displays the visualization heat map generated by the YOLO11n-SSA algorithm after passing through the module. This category activation mapping uses cold and warm tones to show which areas the model mainly focuses on when performing object detection on the image. The warm tones in the figure indicate that the model focuses more on this region, while cold tones suggest that this region has less influence on the model’s final detection result.
Through the analysis of the visualization heat map results in Figure 11b, it is evident that the YOLO11n algorithm still has deficiencies in the process of object detection for insulator images. When the model detects insulator objects, its attention on the defect areas of the object is not significantly higher than that on the background areas. This indicates that the model’s learning of object features during the training process is inadequate, thereby making it challenging for the model to distinguish between object regions and background regions during object detection. By analyzing the visualization heat map of the YOLO11n-SSA algorithm in Figure 11c, it is evident that the YOLO11n-SSA algorithm pays significantly less attention to the background areas than to the defect areas of the object, thereby enabling better distinction between the object and the background. At this time, the main focus of the model is concentrated on the areas of insulator self-explosion, damage, and flashover defects. By comparing Figure 11b,c, it can be seen that the YOLO11n-SSA algorithm can provide detection results with higher confidence when detecting defect areas in images and more accurately predict the areas where insulator self-explosion, damage, and flashover defects exist in the image.

4. Conclusions

In this study, public datasets are aggregated and expanded to construct a dataset encompassing four types of insulators, self-explosion, damage, flashover, and normal, under complex environmental conditions. Based on the YOLO11n network architecture, an improved method YOLO11n-SSA is proposed. The main innovations and conclusions are as follows:
(1)
The StarNet network structure is integrated into the model, which not only accelerates the model’s inference speed but also reduces both model size and parameter quantity. Additionally, the SOPN is incorporated in the model’s neck structure to strengthen multi-scale feature extraction for small objects, achieving enhanced detection performance through optimized feature fusion mechanisms. Furthermore, the ADown module is introduced to enhance the model’s capability of capturing image features while reducing its parameter quantity and size, thus enhancing the adaptability of the model for real-time object detection tasks. Ultimately, through the integration of the Normalized Wasserstein Distance (NWD), the loss function is reformulated by replacing conventional IoU metrics, achieving consistent accuracy improvements in small-object detection across multi-scale scenarios.
(2)
The proposed algorithm is tested and validated in this paper using the dataset. The experimental results demonstrate that the mAP@0.5 is effectively increased from 0.879 to 0.919, the mAP@0.5:0.95 from 0.652 to 0.707, the accuracy rate from 0.93 to 0.95, and the recall rate from 0.818 to 0.875. Moreover, it maintains a high detection speed, low parameter count, and low model size, reaching 13.4 ms, 2,438,620, and 4.94 MB, respectively. The experimental results confirm that the improved algorithm still has effective performance in detecting insulator defects under complex environmental conditions.
(3)
Although the YOLO11n-SSA algorithm has achieved accurate detection of insulator defects, opportunities for refinement persist in computational efficiency and parameter optimization. Future research will focus on optimizing the algorithm’s structure to achieve higher detection efficiency.

Author Contributions

S.D.: The project leader, undertook key tasks in the project, including conceptualization, methodological design, and revising the paper. Y.Q.: performed dataset enrichment processing, model training and improvement, and manuscript writing. B.L.: performed the literature review, analysis of the current research status both domestically and internationally, and derivation of formulas. Q.Z.: collected the data, analyzed the experimental results, and adjusted the format of the thesis. Y.Z.: provided the model training platform, conducted the experimental evaluation, and reviewed the paper. All authors have read and agreed to the published version of the manuscript.

Funding

This research was funded by the National Science and Technology Major Project (2021ZD0110904).

Data Availability Statement

The raw data supporting the conclusions of this article will be made available by the authors upon request. CPLID: address (https://github.com/InsulatorData/InsulatorDataSet, accessed on 15 September 2024); IDID: address (https://dx.doi.org/10.21227/vkdw-x769, accessed on 15 September 2024); BGI: address (https://github.com/phd-benel/BGI, accessed on 16 September 2024); OPDL: address (https://www.sciencedirect.com/science/article/abs/pii/S004579061930967X?via%3Dihub, accessed on 17 September 2024).

Conflicts of Interest

All authors declare no conflicts of interest.

References

  1. Liu, J.; Hu, M.; Dong, J.; Lu, X. Summary of insulator defect detection based on deep learning. Electr. Power Syst. Res. 2023, 224, 109688. [Google Scholar] [CrossRef]
  2. Deng, L.; Wang, Z.; Liu, Q. AH-YOLO: An Improved YOLOv8-Based Lightweight Model for Fire Detection in Aircraft Hangars. Fire 2025, 8, 199. [Google Scholar] [CrossRef]
  3. Liu, F.; Mo, Q.; Zhao, X. Two-level optimal scheduling method for a renewable microgrid considering charging performances of heat pump with thermal storages. Renew. Energy 2023, 203, 102–112. [Google Scholar] [CrossRef]
  4. Liu, W.; Liu, Z.; Nunez, A.; Han, Z. Unified deep learning architecture for the detection of all catenary support components. IEEE Access 2020, 8, 17049–17059. [Google Scholar] [CrossRef]
  5. Song, B.; Li, X. Power line detection from optical images. Neurocomputing 2014, 129, 350–361. [Google Scholar] [CrossRef]
  6. Yi, W.; Ma, S.; Li, R. Insulator and Defect Detection Model Based on Improved Yolo-S. IEEE Access 2023, 11, 93215–93226. [Google Scholar] [CrossRef]
  7. Jenssen, R.; Roverso, D. Intelligent monitoring and inspection of power line components powered by UAVs and deep learning. IEEE Power Energy Technol. Syst. J. 2019, 6, 11–21. [Google Scholar] [CrossRef]
  8. Wang, D.; Yao, Y.; Zhang, S.; Zhu, R.; Zhao, W. Deep Learning Method for Detecting Heat Spots of Photovoltaic Modules Based on Infrared Thermal Images. Proc. CSEE 2023, 43, 9608–9616. [Google Scholar]
  9. Li, J.; Li, H.; Hu, X.; Li, S.; Qiao, J. Research progress of surface defect detection technology based on deep learning. Comput. Integr. Manuf. Syst. 2024, 30, 774–790. [Google Scholar]
  10. Hu, S. Development Direction and Application of Smart Grid Digital Twin Technology. Acta Energiae Solaris Sin. 2023, 44, 576. [Google Scholar]
  11. Wang, S.; Liu, Y.; Qing, Y.; Wang, C.; Lan, T.; Yao, R. Detection of insulator defects with improved ResNeSt and region proposal network. IEEE Access 2020, 8, 184841–184850. [Google Scholar] [CrossRef]
  12. Ma, B.; Fu, Y.; Wang, C.; Li, J.; Wang, Y. A high-performance insulators location scheme based on YOLOv4 deep learning network with GDIoU loss function. IET Image Process. 2022, 16, 1124–1134. [Google Scholar] [CrossRef]
  13. Cheng, H.; Zhai, Y.; Chen, R. Faster R-CNN based recognition of insulators in aerial images. Mod. Electron. Tech. 2019, 42, 98–102. [Google Scholar]
  14. Yaseen, M. What is yolov9: An in-depth exploration of the internal features of the next-generation object detector. arXiv 2024, arXiv:2409.07813. [Google Scholar]
  15. Ma, N.; Sun, Y.; Li, C.; Liu, Z.; Song, H. AHG-YOLO: Multi-category detection for occluded pear fruits in complex orchard scenes. Front. Plant Sci. 2025, 16, 1580325. [Google Scholar] [CrossRef]
  16. Hui, Z.; Fang, T. Optimization of YOLOv11 for Fire Hazard Detection in Ultra-Small Targets. Res. Sq. 2025. [Google Scholar] [CrossRef]
  17. Kang, J.; Wang, Q.; Liu, W.; Xia, Y. Detection Model of Multi-Defect of Aerial Photo Insulator by Integrating CAT-BiFPN and Attention Mechanism. High Volt. Eng. 2023, 49, 3361–3372. [Google Scholar]
  18. Wang, L.; Qin, J.; Yan, K.; Sun, H.; Sun, S.; Geng, Y. A Lightweight Insulator Defect Detection Model Based on YOLOv8. In Proceedings of the 2024 5th International Seminar on Artificial Intelligence, Networking and Information Technology, Nanjing, China, 22–24 March 2024; pp. 2349–2353. [Google Scholar]
  19. Dong, L.; Zhu, H.; Ren, H.; Lin, T.-Y.; Lin, K.-P. A novel lightweight MT-YOLO detection model for identifying defects in permanent magnet tiles of electric vehicle motors. Expert Syst. Appl. 2025, 288, 128247. [Google Scholar] [CrossRef]
  20. Jocher, G.; Chaurasia, A.; Qiu, J. YOLO by Ultralytics. Available online: https://github.com/ultralytics/ultralytics (accessed on 5 June 2024).
  21. Wang, C.-Y.; Yeh, I.-H.; Mark Liao, H.-Y. Yolov9: Learning what you want to learn using programmable gradient information. In Proceedings of the European Conference on Computer Vision, Milan, Italy, 29 September–4 October 2024; pp. 1–21. [Google Scholar]
  22. Wang, A.; Chen, H.; Liu, L.; Chen, K.; Lin, Z.; Han, J. Yolov10: Real-time end-to-end object detection. Adv. Neural Inf. Process. Syst. 2024, 37, 107984–108011. [Google Scholar]
  23. Tian, Y.; Ye, Q.; Doermann, D. Yolov12: Attention-centric real-time object detectors. arXiv 2025, arXiv:2502.12524. [Google Scholar]
  24. Li, M.; Li, S.; Wu, Y.; Hu, H.; Zhou, Y.; Zheng, X.; Ding, G.; Du, S.; Wu, Z.; Gao, Y. YOLOv13: Real-Time Object Detection with Hypergraph-Enhanced Adaptive Visual Perception. arXiv 2025, arXiv:2506.17733. [Google Scholar]
  25. Fu, J.; Tan, J.; Zhou, L.; Cai, H.; Chen, B. Analysis of Intelligent Defect Recognition Method in UAV Inspection Images of Transmission Lines. High Volt. Technol. 2023, 49, 103–110. [Google Scholar]
  26. Liu, Y.; Huang, X.; Liu, D. Weather-domain transfer-based attention YOLO for multi-domain insulator defect detection and classification in UAV images. Entropy 2024, 26, 136. [Google Scholar] [CrossRef] [PubMed]
  27. Jocher, G.; Qiu, J. Ultralytics YOLO11. Available online: https://docs.ultralytics.com/zh/ (accessed on 30 September 2024).
  28. Liu, C.; Wu, Y.; Liu, J. Research Progress of Deep Learning Methods for Insulator Defect Detection in UAV Aerial Images. J. Electrotech. 2024, 40, 2897–2916. [Google Scholar]
  29. Pei, S.; Wang, W.; Wu, P.; Hu, C.; Sun, H.; Li, K.; Wu, M.; Lan, B. Detection of hydrophobicity grade of insulators based on AHC-YOLO algorithm. Sci. Rep. 2025, 15, 9673. [Google Scholar] [CrossRef] [PubMed]
  30. Dai, J.; Ren, J.; Li, S. PHL-YOLO: A real-time lightweight yarn inspection method. J Real-Time Image Process. 2025, 22, 20. [Google Scholar] [CrossRef]
  31. Ma, X.; Dai, X.; Bai, Y.; Wang, Y.; Fu, Y. Rewrite the stars. In Proceedings of the IEEE/CVF Conference on Computer Vision and Pattern Recognition, Seattle, WA, USA, 17–21 June 2024; pp. 5694–5703. [Google Scholar]
  32. Cao, Q.; Chen, H.; Wang, S.; Wang, Y.; Fu, H.; Chen, Z.; Liang, F. LH-YOLO: A Lightweight and High-Precision SAR Ship Detection Model Based on the Improved YOLOv8n. Remote Sens. 2024, 16, 4340. [Google Scholar] [CrossRef]
  33. Sunkara, R.; Luo, T. No more strided convolutions or pooling: A new CNN building block for low-resolution images and small objects. In Proceedings of the Joint European Conference on Machine Learning and Knowledge Discovery in Databases, Grenoble, France, 19–23 September 2022; pp. 443–459. [Google Scholar]
  34. Xu, G.; Liao, W.; Zhang, X.; Li, C.; He, X.; Wu, X. Haar wavelet downsampling: A simple but effective downsampling module for semantic segmentation. Pattern Recognit. 2023, 143, 109819. [Google Scholar] [CrossRef]
  35. Wang, J.; Xu, C.; Yang, W.; Yu, L. A normalized Gaussian Wasserstein distance for tiny object detection. arXiv 2021, arXiv:2110.13389. [Google Scholar]
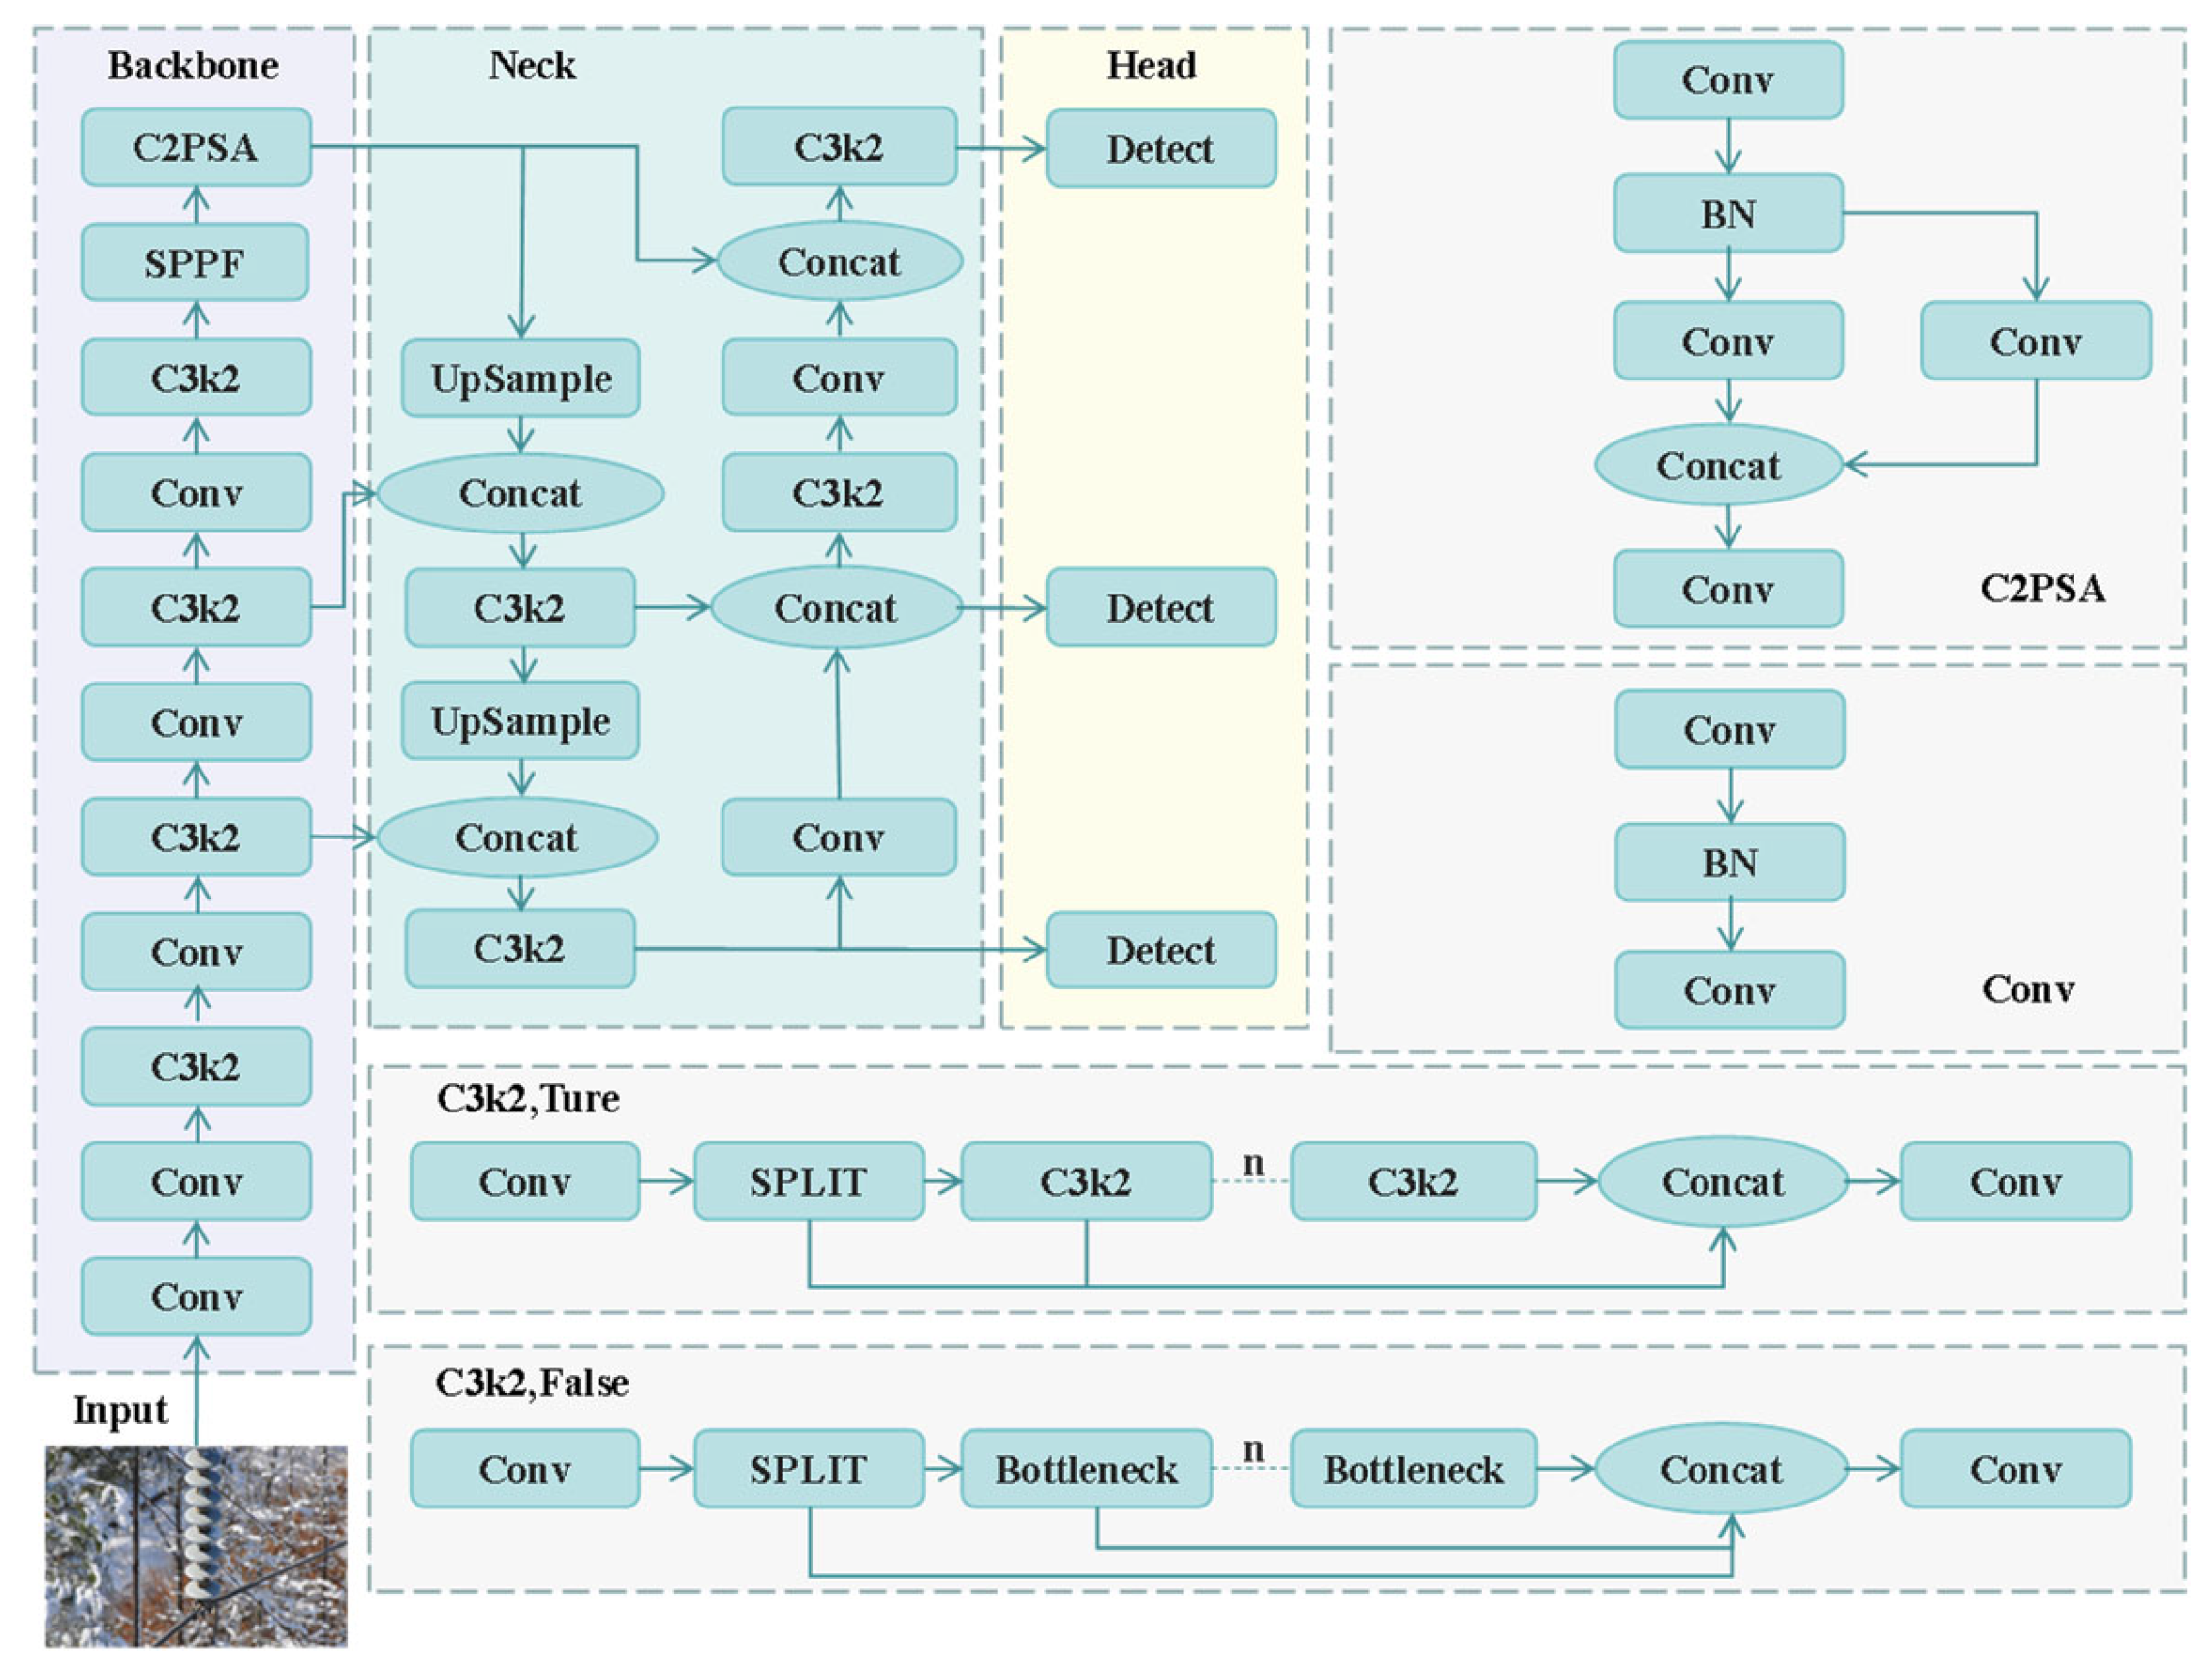
Figure 1. YOLO11n network structure.
Electronics 14 02898 g001
Figure 2. Improved YOLO11n network structure.
Electronics 14 02898 g002
Figure 3. StarNet block structure.
Electronics 14 02898 g003
Figure 4. Feature pyramid network structure of SOPN.
Electronics 14 02898 g004
Figure 5. SPDConv structure when F = 2 .
Electronics 14 02898 g005
Figure 6. CSP-Omnikernel block.
Electronics 14 02898 g006
Figure 7. ADown module structure.
Electronics 14 02898 g007
Figure 8. Representative examples of datasets.
Electronics 14 02898 g008
Figure 9. Comparison of test results under sunny conditions.
Electronics 14 02898 g009
Figure 10. Comparison of test results under different weather conditions.
Electronics 14 02898 g010
Figure 11. Visualization heat map of prediction results for three types of insulator defects.
Electronics 14 02898 g011
Table 1. Comparison of detection results of different models.
ModelPrecisionRecallmAP@0.5mAP@0.5:0.95Size (MB)ParametersSpeed (ms)
Faster R-CNN0.8520.7570.8950.578317413,640,00060.6
SSD0.8050.7730.8270.477181238,800,00040.7
YOLOv7-t0.9340.8320.8910.62511.76,705,16910
YOLOv8n0.9260.8160.8760.6475.983,006,4286
YOLOv9-t0.9150.7960.8560.6275.822,618,12018
YOLOv10n0.9170.8120.8720.6405.512,707,4307.5
YOLO11n0.930.8180.880.6525.232,582,9328
YOLOv12n0.9240.8000.8660.6455.22,520,4287.9
YOLOv13n0.9410.8220.8890.6695.42,460,67516
YOLO11n-SSA (Ours)0.950.8750.9190.7074.942,444,8289.7
Table 2. Comparison of ablation experiment results.
StarNBSOPNADownNWDPrecisionRecallmAP@0.5mAP@0.5:0.95ParametersSize
(MB)
0.930.8180.880.6522,582,9325.23
0.9090.7750.8510.6182,440,5724.91
0.950.8660.9190.7053,062,8686.17
0.9390.8250.8850.6582,100,3724.32
0.9310.8280.8880.6562,582,9325.23
0.9460.8720.920.72,920,5085.85
0.9430.8760.9190.6992,438,6204.94
0.950.8750.9190.7072,438,6204.94
Disclaimer/Publisher’s Note: The statements, opinions and data contained in all publications are solely those of the individual author(s) and contributor(s) and not of MDPI and/or the editor(s). MDPI and/or the editor(s) disclaim responsibility for any injury to people or property resulting from any ideas, methods, instructions or products referred to in the content.