Article

Electromagnetic Noise and Vibration Analyses in PMSMs: Considering Stator Tooth Modulation and Magnetic Force

1
Department of Electrical Engineering, Chungnam National University, Daejeon 34134, Republic of Korea
2
Gasan R&D Center, LG Electronics Inc., Seoul 08592, Republic of Korea
3
Department of Biosystems Machinery Engineering, Chungnam National University, Daejeon 34134, Republic of Korea
4
Department of Electrical Engineering, Changwon National University, Changwon 51140, Republic of Korea
*
Authors to whom correspondence should be addressed.
Electronics 2025, 14(14), 2882; https://doi.org/10.3390/electronics14142882
Submission received: 15 June 2025 / Revised: 8 July 2025 / Accepted: 14 July 2025 / Published: 18 July 2025

Abstract

This study presents an analysis of the electromagnetic noise and vibration in a surface-mounted permanent magnet synchronous machine (SPMSM), focusing on their excitation sources. To investigate this, the excitation sources were identified through an analytical approach, and their effects on electromagnetic noise and vibration were evaluated using a finite element method (FEM)-based analysis approach. Additionally, an equivalent curved-beam model based on three-dimensional shell theory was applied to determine the deflection forces on the stator yoke, accounting for the tooth-modulation effect. The stator’s natural frequencies were derived through the characteristic equation in free vibration analysis. Modal analysis was performed to validate the analytically derived natural frequencies and to investigate stator deformation under the tooth-modulation effect across various vibration modes. Furthermore, noise, vibration, and harshness (NVH) analysis via FEM reveals that major harmonic components align closely with the natural frequencies, identifying them as primary sources of elevated vibrations. A comparative study between 8-pole–9-slot and 8-pole–12-slot SPMSMs highlights the impact of force variations on the stator teeth in relation to vibration and noise characteristics, with FEM verification. The proposed method provides a valuable tool for early-stage motor design, enabling the rapid identification of resonance operating points that may induce severe vibrations. This facilitates proactive mitigation strategies to enhance motor performance and reliability.

1. Introduction

The presence of electrical machines in daily life has been steadily increasing in response to the growing demand for automated electrical systems. In recent decades, advancements in electrical machines have focused on enhancing efficiency and compactness due to cost and environmental constraints. Additionally, as electrical machines operate in closer proximity to people, vibration and acoustic noise have emerged as critical factors in their design and development [1]. Accordingly, extensive research has been conducted to reduce the vibration and noise produced by electrical machines.
A systematic procedure is followed to analyze the vibration and acoustic noise characteristics of electrical machines. Noise is generated by vibrations, which involve the movement of air particles and propagate through the air in the form of sound waves. Within the audible frequency range, Devillers [1] classified noise into mechanical noise and electromagnetic noise. Mechanical noise arises from friction between moving parts, whereas electromagnetic noise is induced by the fluctuating electromagnetic fields within an electrical machine. These fields generate electromagnetic forces at slot-passing frequencies, leading to vibrations in the mechanical structure and ultimately contributing to noise generation. In their studies on the vibration of electrical machines, Zou [2] analyzed the effects of global and local force harmonics on the vibration of PMSMs, while Lin [3] proposed an accurate multiphysics model that incorporates current harmonics and examined their impact on vibration. Regarding studies focused on acoustic noise, Fang [4] utilized the mode superposition method and boundary element method to calculate vibration and acoustic noise, validating the results through vibroacoustic experiments. Meanwhile, Lin [5] analyzed noise characteristics across the entire operating speed range and evaluated sound quality under various current waveforms.
The vibration and noise characteristics derived from these multiphysics models exhibit high accuracy but require complex software configurations and long computation times. In early design stages, frequent modifications to model parameters and geometry can significantly increase costs and development time. To address this issue and streamline the process, simplified analytical models have been developed. Weilharter [6] proposed an analytical approach that simplifies the slotted stator of an induction motor into a ring structure, formulating an electromagnetic, structural, and acoustical model based on Jordan’s approach [7]. The radial vibrations of the stator surface and the acoustic sources were derived using an equivalent ring model and a cylindrical sound radiator. However, since this method simplifies the slotted stator into a ring, it does not fully account for the vibroacoustic sources acting on the stator teeth, leading to lower accuracy. To improve this, Gieras [8] incorporated the effects of stator teeth and windings, conducting a more detailed vibration analysis of the stator ring. The analytical formulations and methodologies used in these studies for analyzing vibration and noise characteristics in electrical machines provide theoretical insights that are valuable for motor design and understanding [9]. However, they can be overly complex and challenging for many to comprehend or directly apply in practical design processes. Therefore, in the early stages of vibration and noise analysis, it is beneficial to first utilize analytical methods for preliminary calculations. In subsequent stages, finite element analysis (FEA) should be employed to achieve more accurate and detailed evaluations [10,11,12,13,14,15,16,17,18,19].
The purpose of this paper is to combine analytics- and FEM-based multiphysics models at an optimal balance, aiming to reduce computation time while enhancing the accuracy of vibration and noise analysis in electrical machines. First, Section 2 presents an analytical approach to derive the forces acting on the stator teeth, incorporating the modulation effect. This approach is based on the previously established theoretical frameworks reported in the literature. Then, in Section 3, the natural frequencies of the stator are determined using the characteristic equation in free vibration analysis, which also follows conventional analytical methods documented in prior studies. These natural frequencies are validated through FEM modal analysis, where the deformation shapes of the stator are examined. Next, Section 4 performs NVH analysis using FEM, identifying resonance points that induce stronger vibrations by comparing them to the analytically derived stator natural frequencies. Finally, Section 5 presents a comparative analysis of vibration and noise characteristics based on the slot number variations in electrical machines.

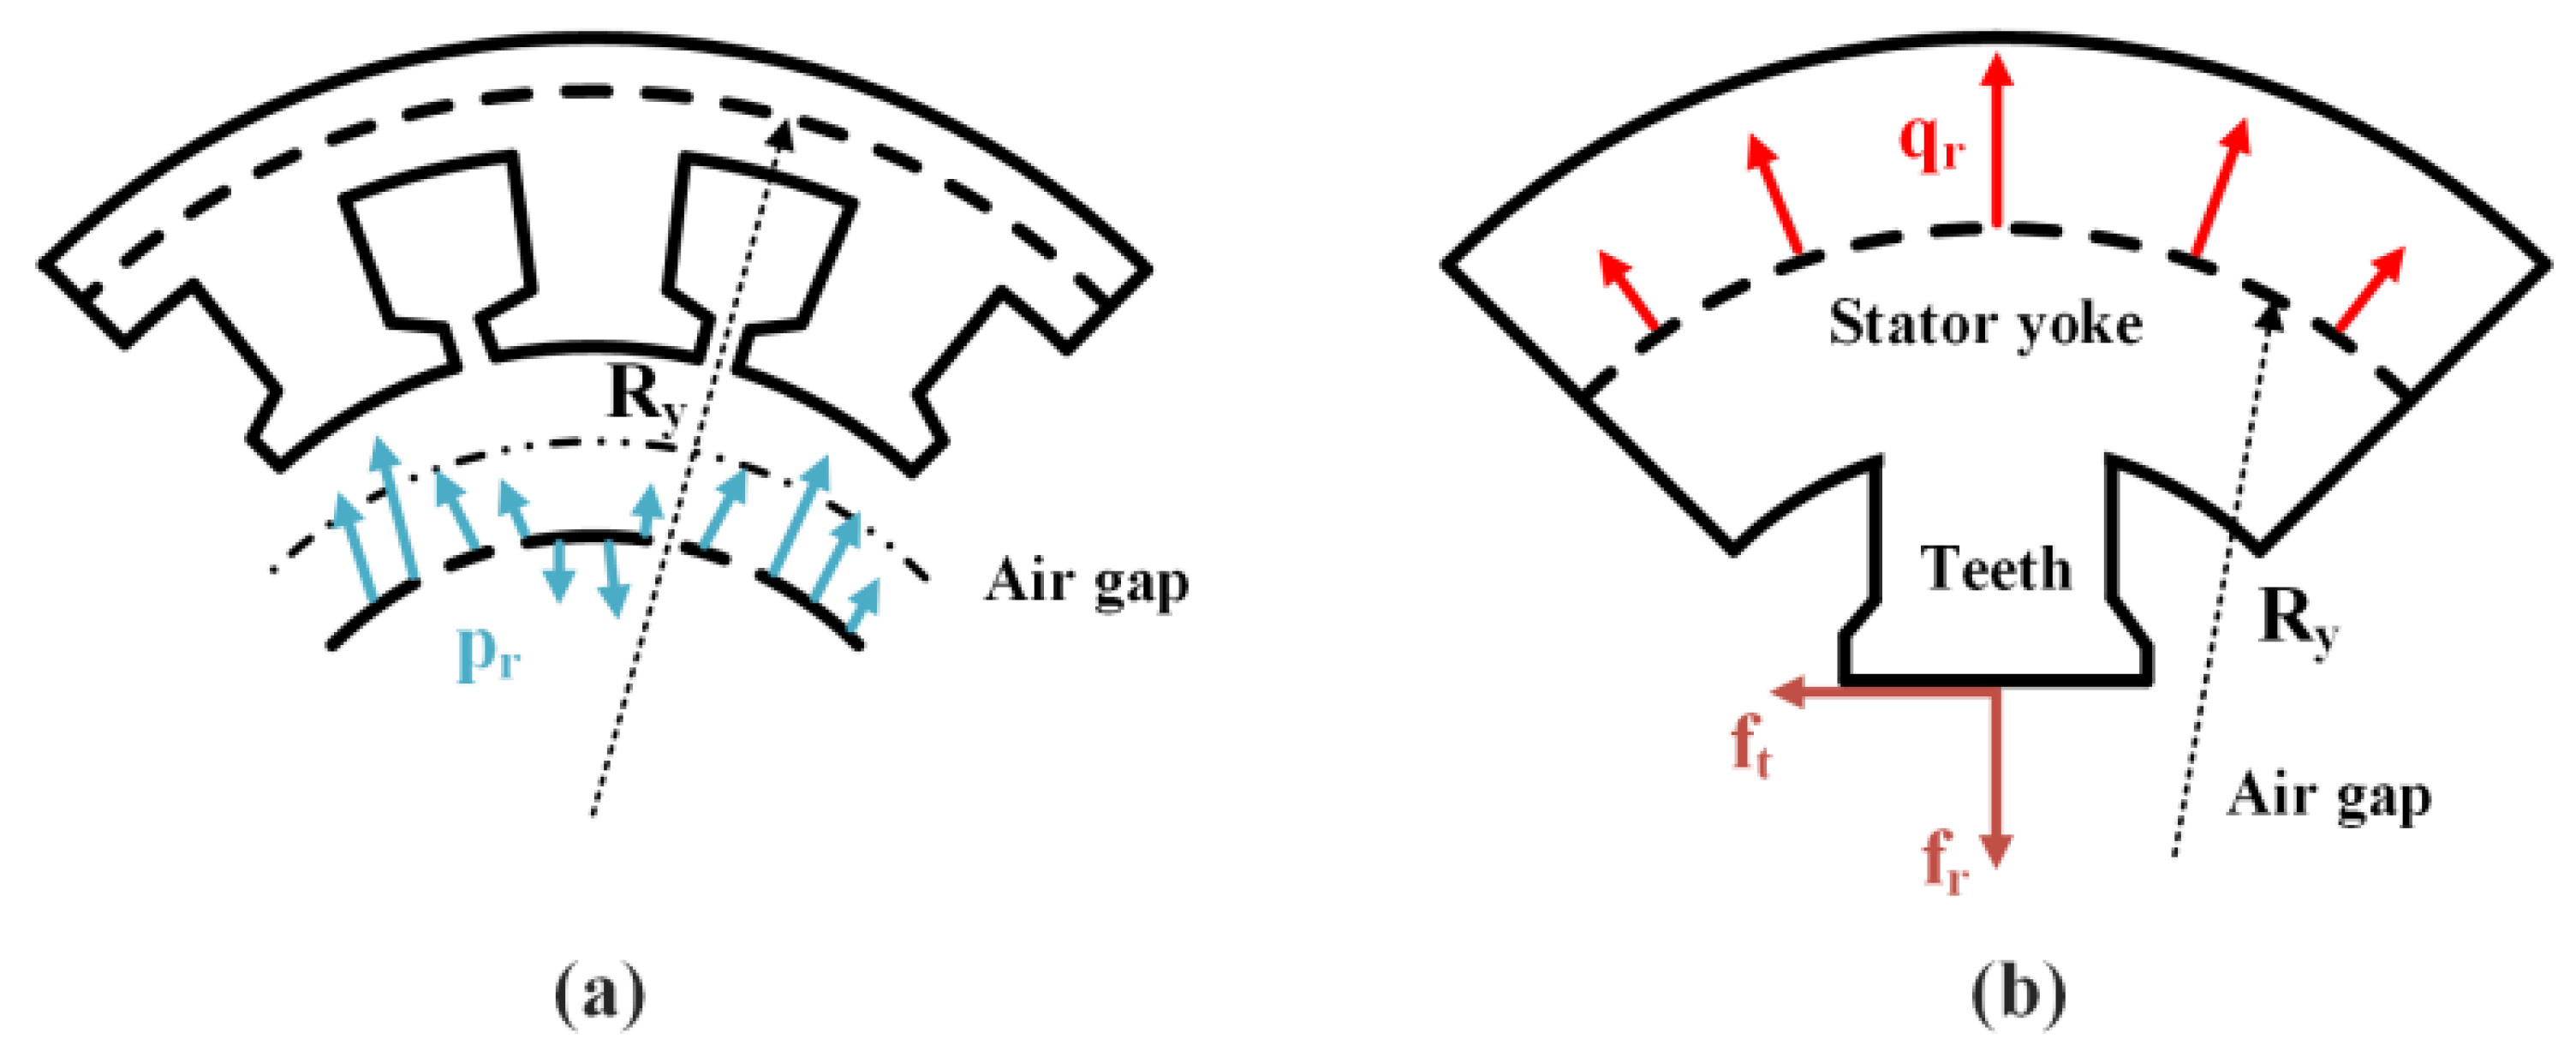
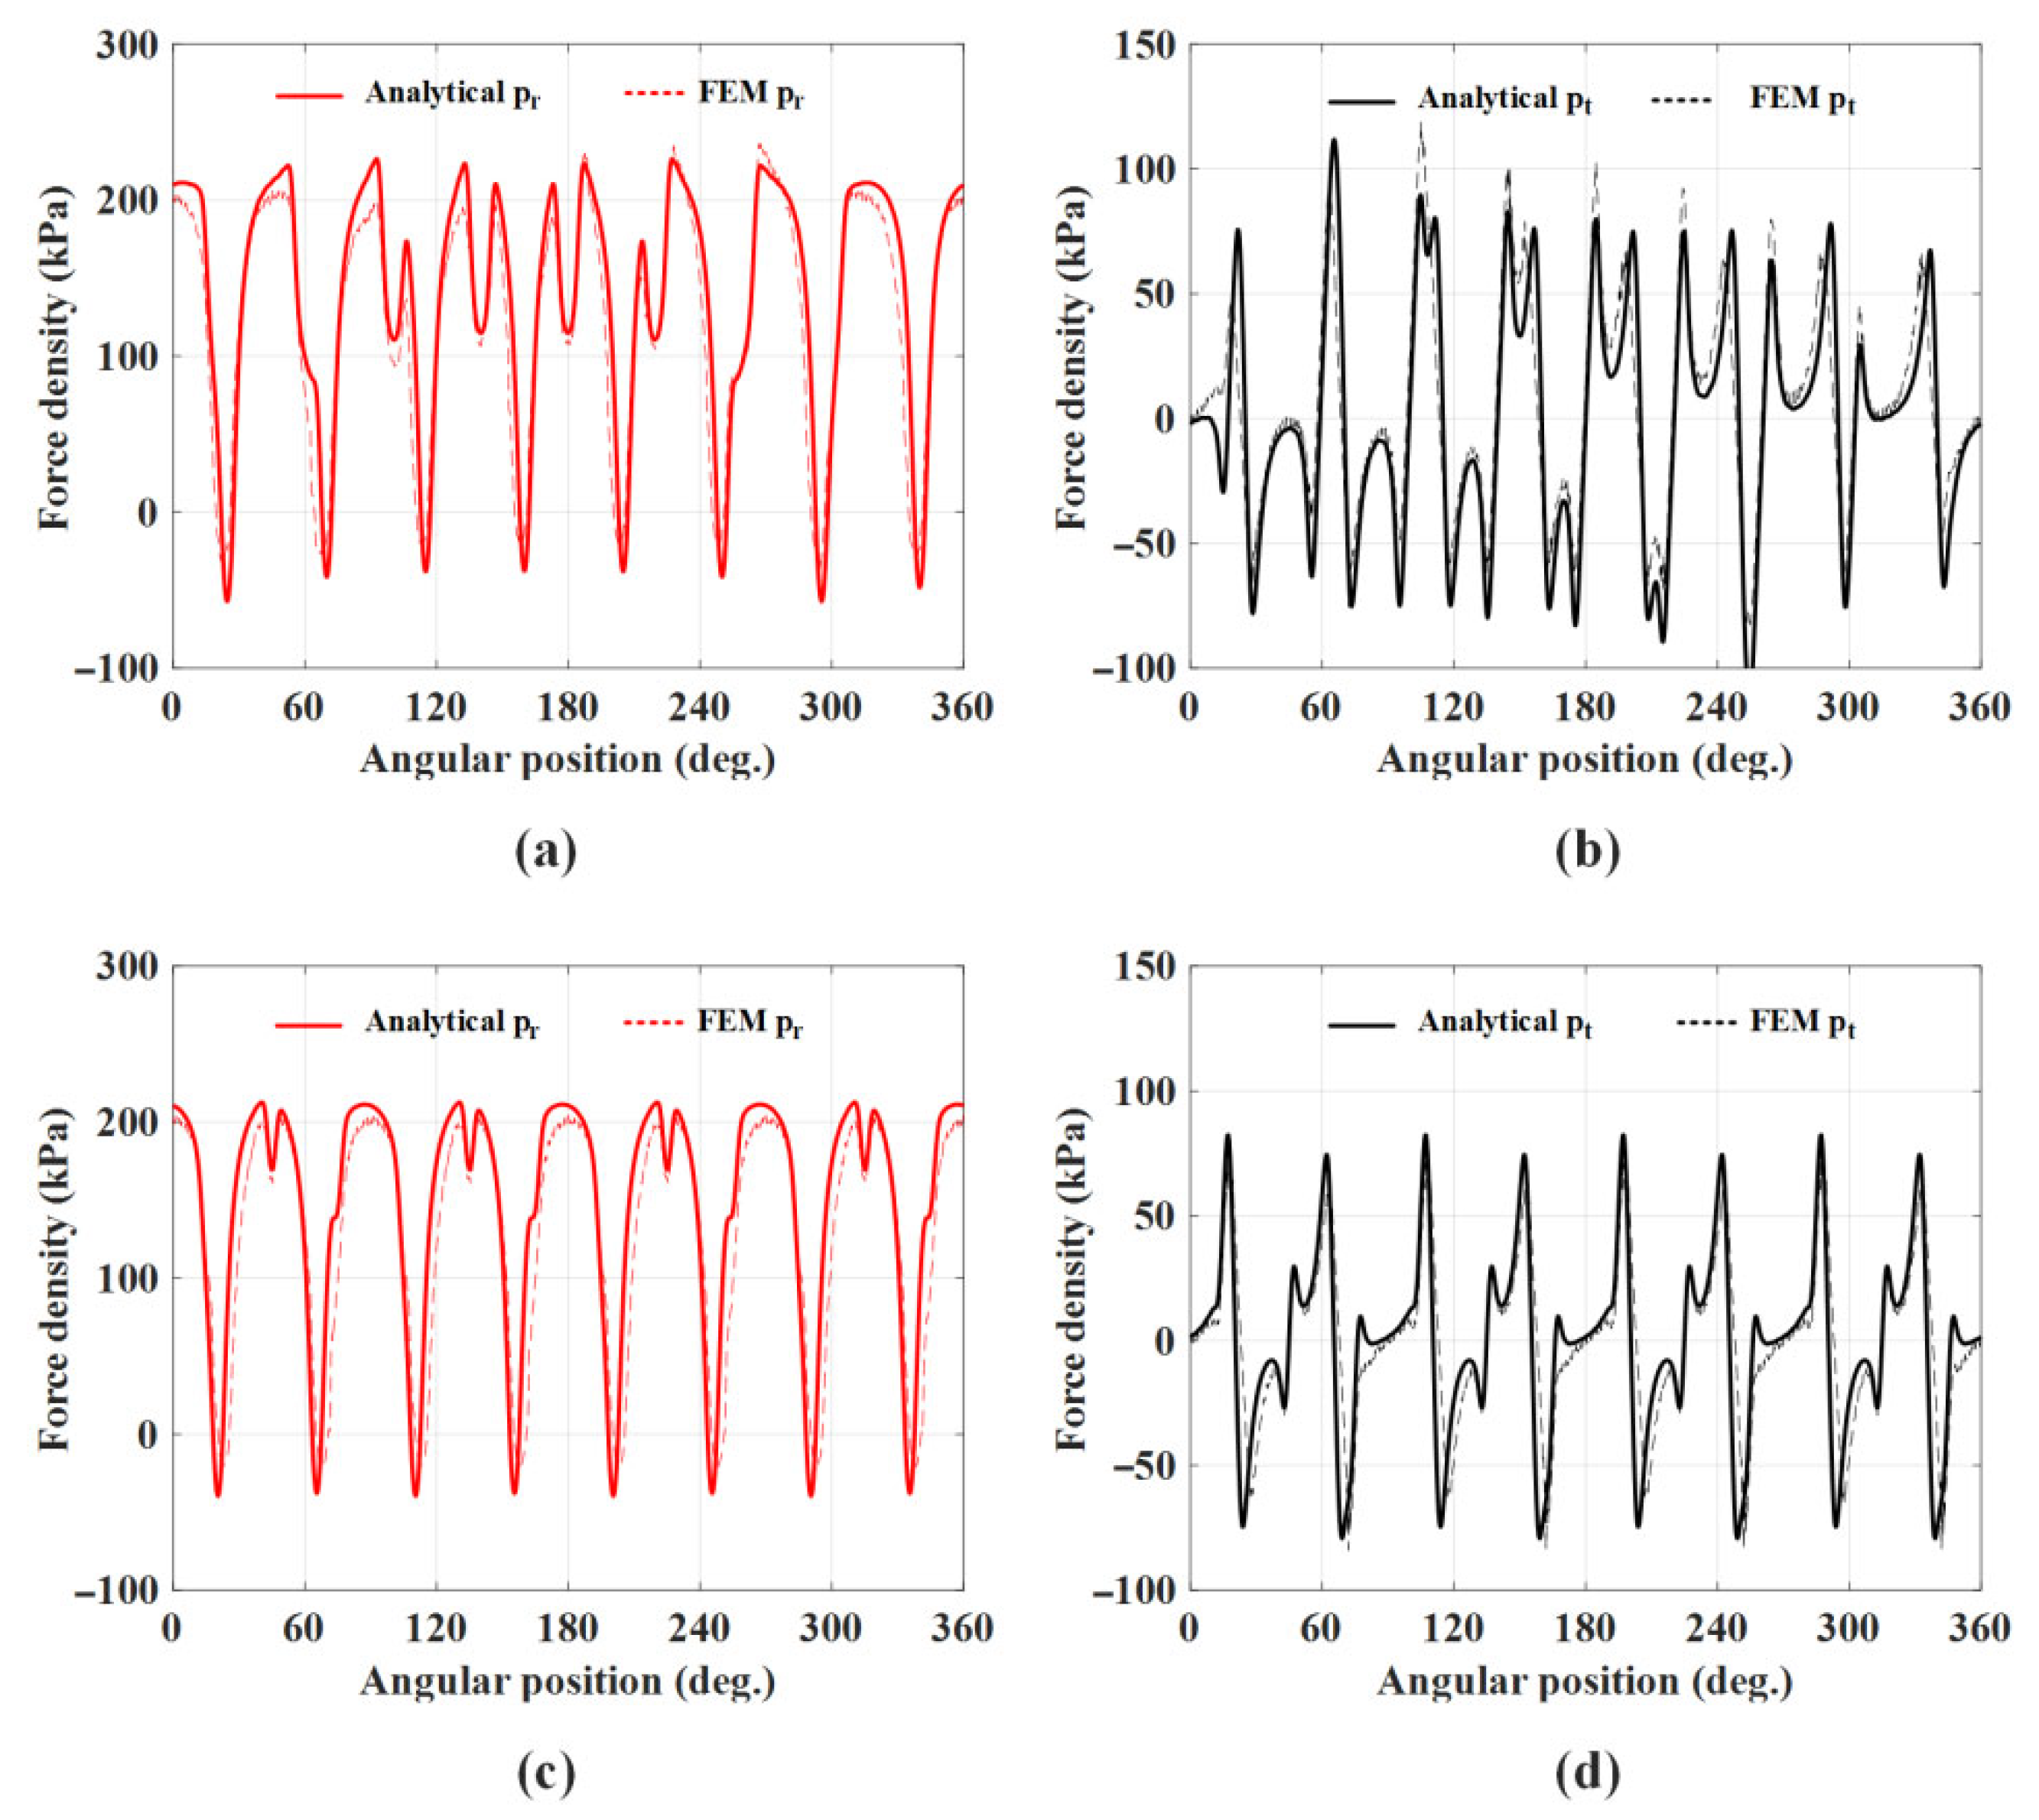
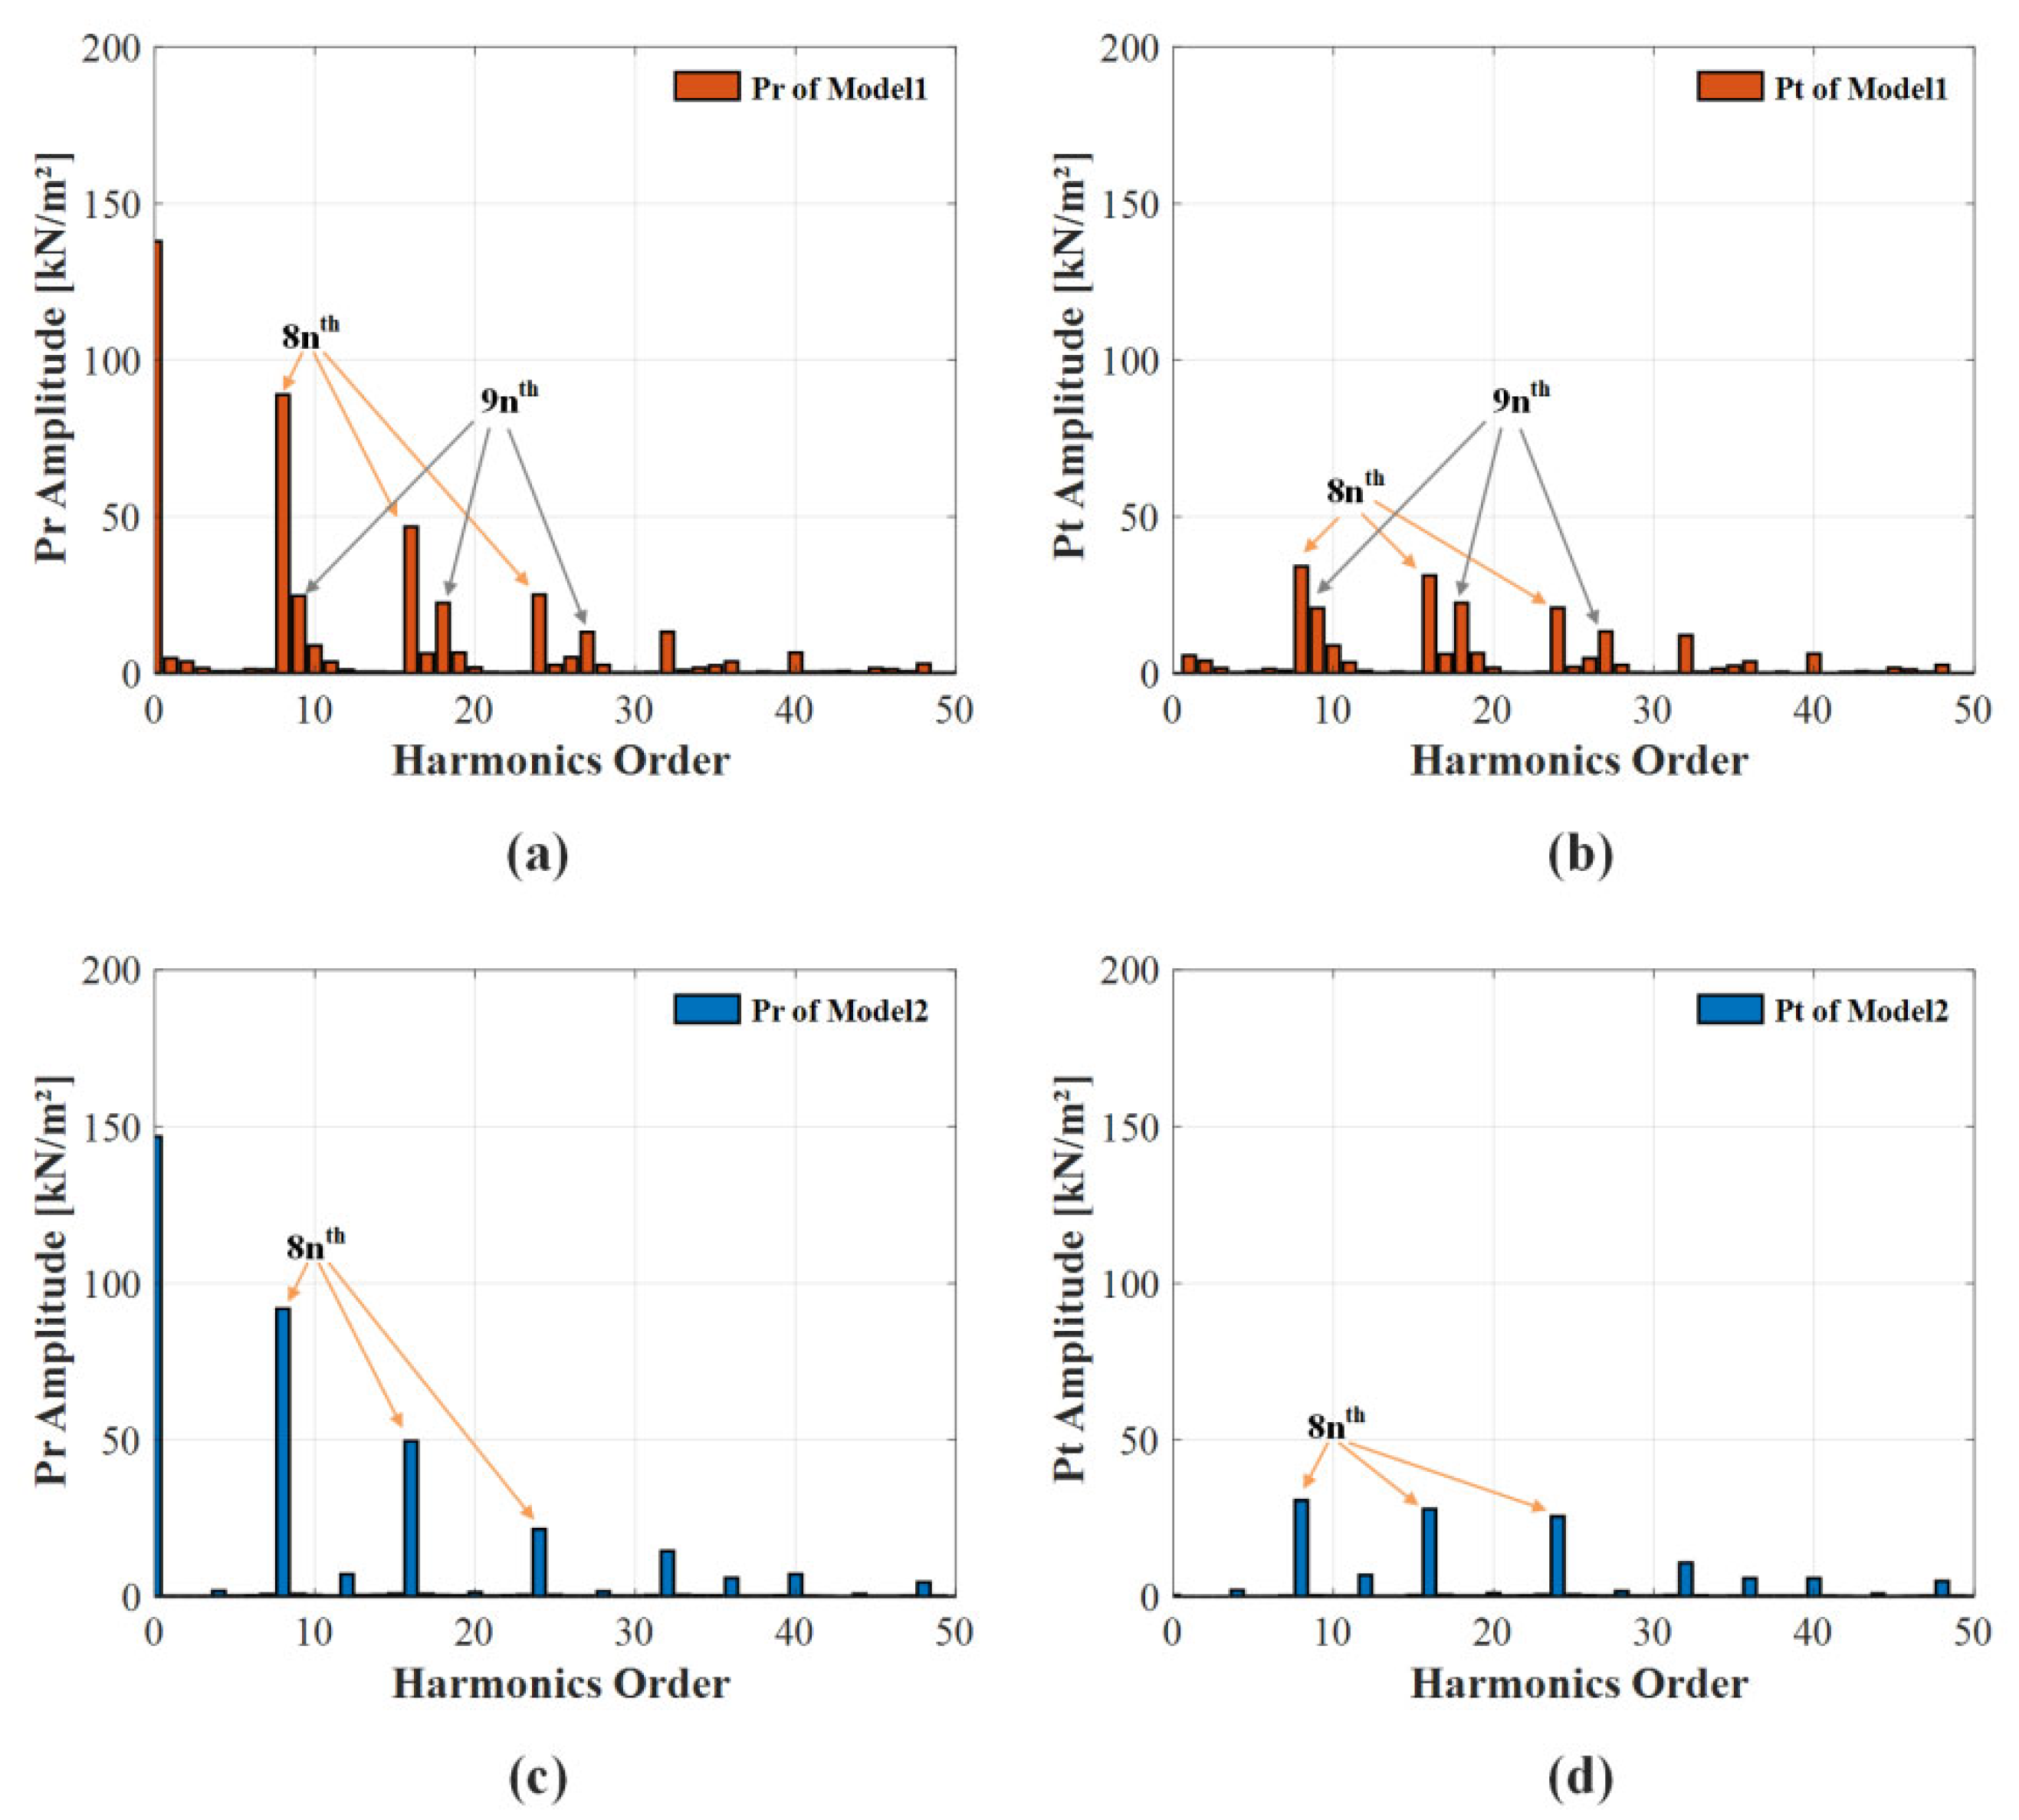
2. Electromagnetic Forces

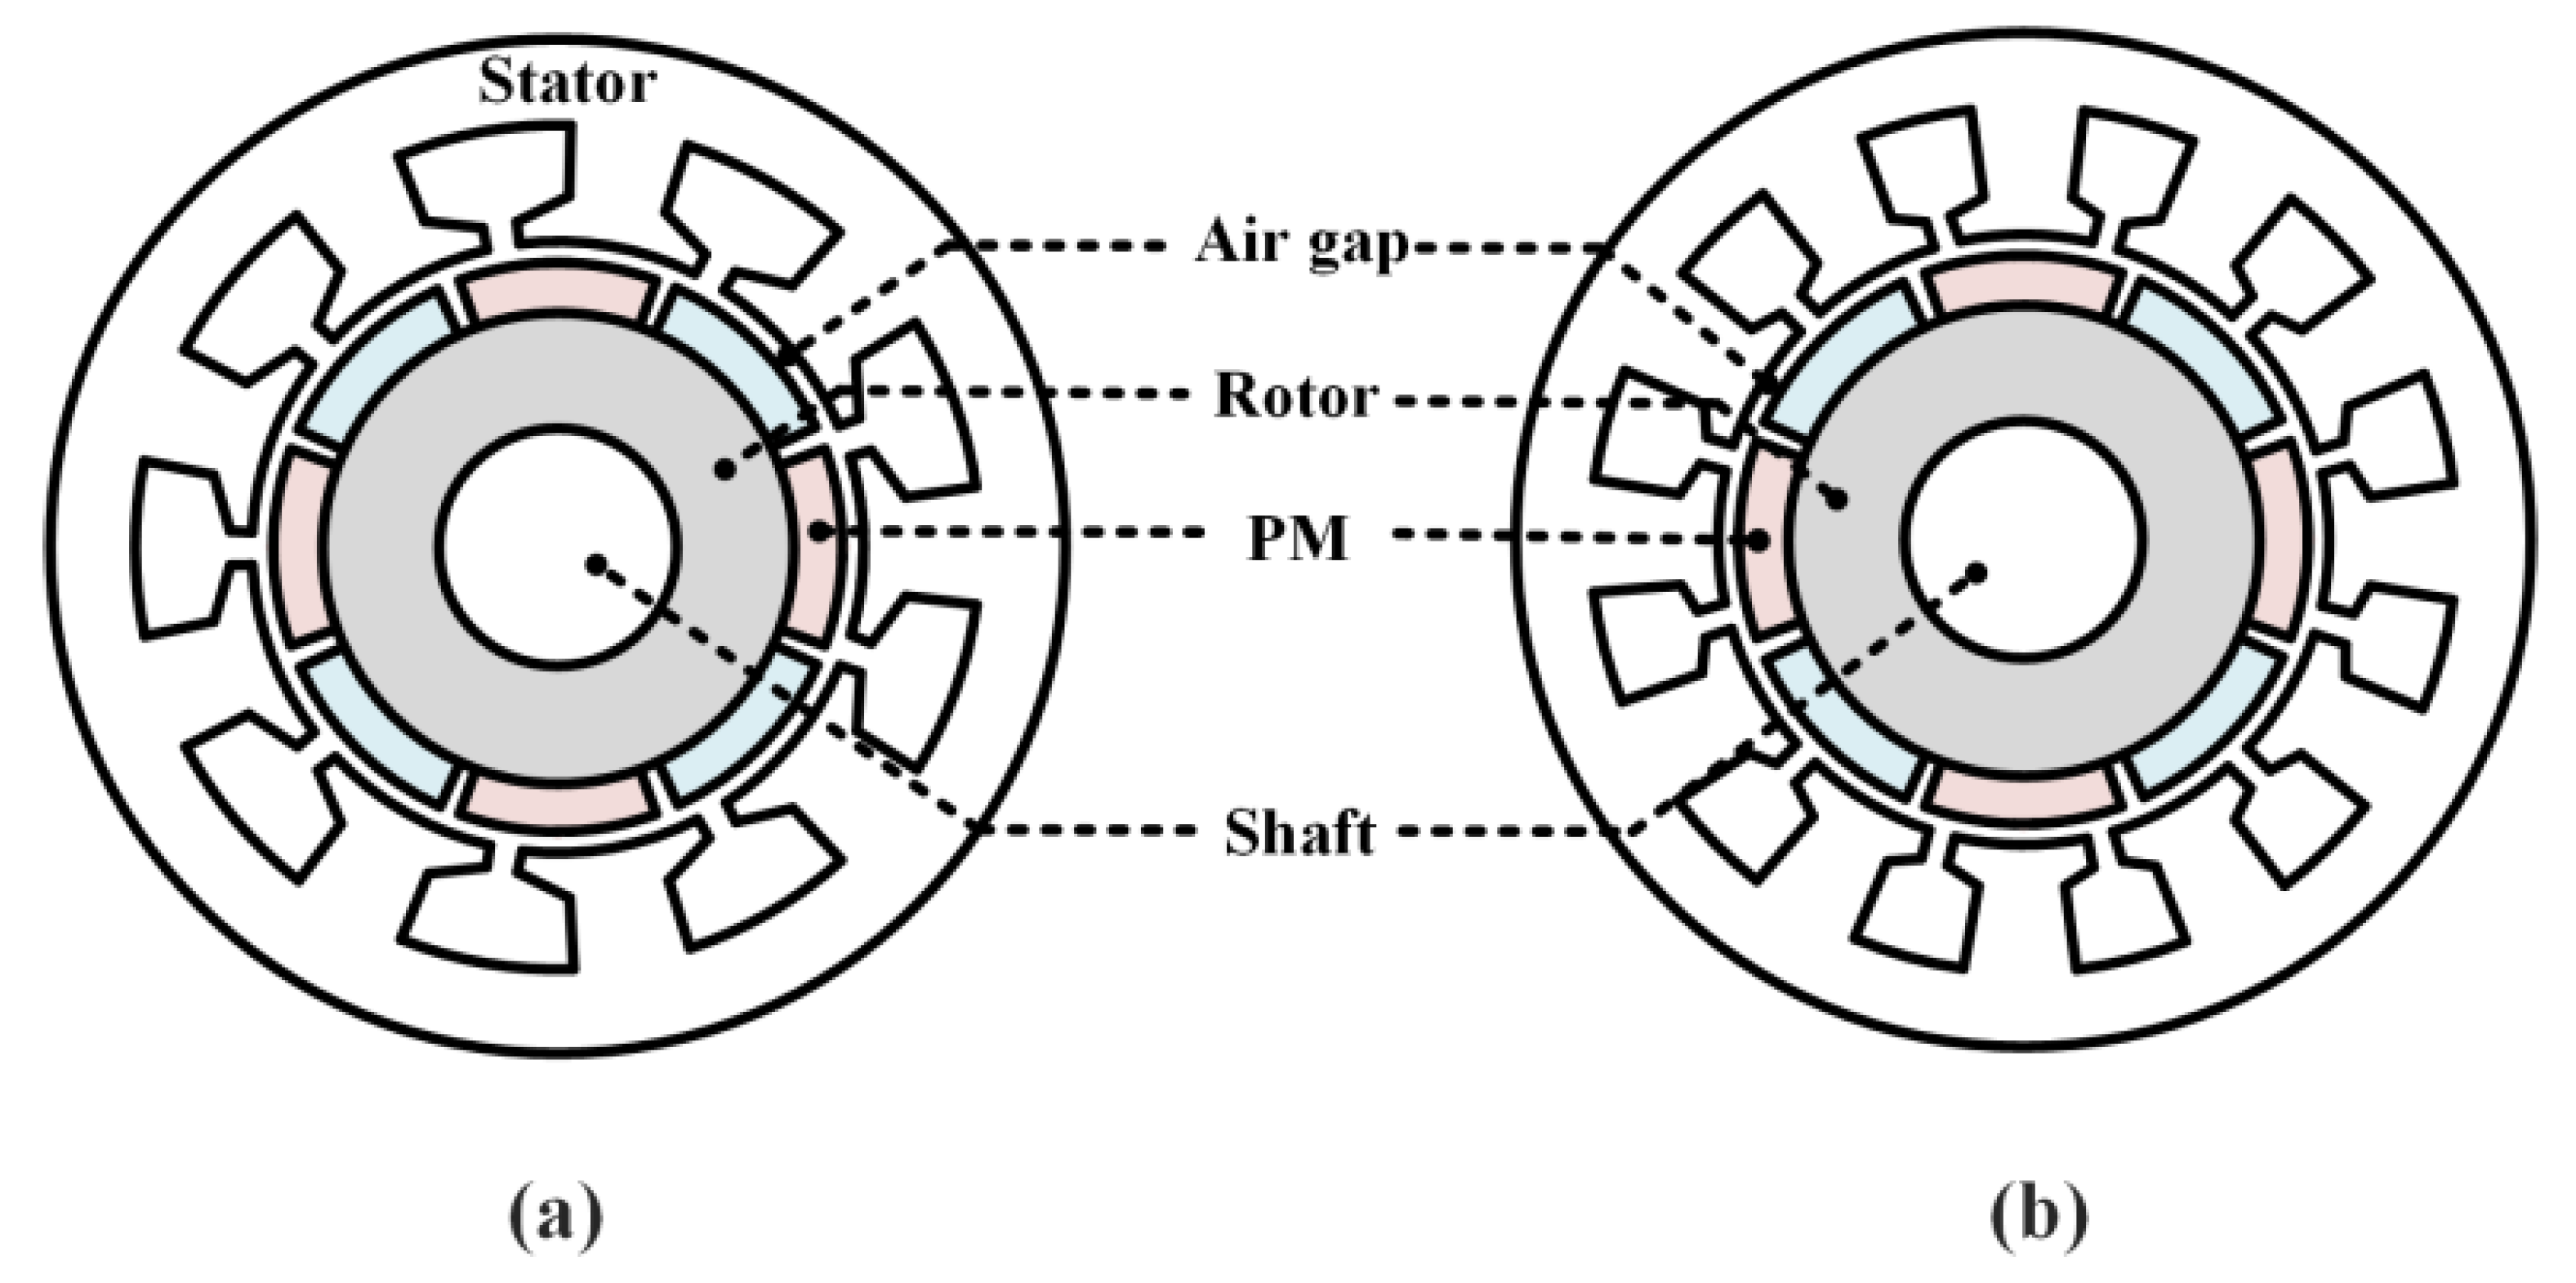
2.1. Analysis Model and Assumptions

Figure 1 illustrates the FEA models used in this study: Figure 1a depicts an 8-pole–9-slot SPMSM and Figure 1b shows an 8-pole–12-slot SPMSM. A simplified subdomain model of the SPMSM was adopted as an analytical approach. The analysis domain is divided into four main regions: the permanent magnet region (Region I), the air gap region (Region II), the slot open region (Region III), and the slot region (Region IV). The parameters Rr, Rm, Rs, Rt, and Rq denote the outer radius of the rotor, the outer radius extending to the permanent magnet, the inner radius of the stator, the radius at the center of the tooth, and the radius up to the top of the slot, respectively. The detailed model parameters used for the simulation are listed in Table 1.
In this section, several assumptions are made to simplify the analysis while maintaining accuracy. First, eddy current effects are neglected to allow a focus on the primary electromagnetic interactions. Second, the current density in the stator slots is assumed to have only one component along the z-axis, ensuring computational efficiency. Third, both the stator and rotor slots, including their teeth, are considered to have perfectly radial sides. Additionally, end effects are disregarded to maintain a two-dimensional analytical approach. Lastly, all magnetic materials are treated as isotropic, with a constant magnetic permeability corresponding to the linear region of the B-H curve. These assumptions allow for a more manageable yet effective modeling of the system.

2.2. Tooth Modulation

The primary source of electromagnetic vibration and noise in PMSMs is the air gap force acting on, the stator teeth. Therefore, an accurate determination of the air gap force is essential as the initial step in the vibration analysis. The forces generated by the analysis model can be derived using the Maxwell stress tensor, and the 2D stress F is expressed by following equations [20]:
F = 1 μ 0 ( B n 2 1 2 B 2 ) i n 1 μ 0 B n B t i z
p r = 1 2 μ 0 ( B r g 2 B θ g 2 )
p t = 1 μ 0 B r g B θ g
where Brg and Bθg represent the radial and tangential components of the air gap flux density, which are analytically derived using the general solutions obtained for each subdomain. General solutions are derived using Laplace’s equation in the air gap and slot regions, and Poisson’s equation in the permanent magnet region, to calculate the magnetic vector potential in each subdomain. The undetermined coefficients of the magnetic vector potential are then obtained by applying matrix operations to the boundary conditions between the subdomains, as described in Appendix A [21].
In Figure 2a, pr and pt are the radial and tangential components of the magnetic attraction force. The air gap force density is typically analyzed using a 2D Fourier transform, decomposing it into temporal and spatial harmonics, which are then utilized for excitation source analysis. To account for the tooth-modulation effects, the force densities are first converted into equivalent forces acting on the surface of the stator teeth [22].
The transformation of force density into the force acting on the stator tooth is carried out as follows:
f r = L s t k R s θ δ 2 θ + δ 2 p r cos ( θ i θ ) + p t sin ( θ i θ ) d θ
f t = L s t k R s θ δ 2 θ + δ 2 p r sin ( θ i θ ) + p t cos ( θ i θ ) d θ
As shown in Figure 2b, fr and ft represent the radial and tangential forces acting on the stator tooth, respectively. To account for the vibrations induced by tangential forces, the tangential forces were expressed as an equivalent force, qr, using a transformation technique based on the work of Roivanen [23].
q r = h t o o t h + h y o k e 2 Q 2 π R y f t
where Ry represents the radius at the center of the yoke, and the transformed force acting on the midpoint of the stator yoke. To model the effect of the tangential magnetic force on the stator yoke, an equivalent radial force, qr, is derived using the principle of torque equivalence. This transformation is based on the approach proposed by Roivainen [23], where the tooth torque generated by ft is mapped to a stator yoke force couple through an equivalent gain factor. The resulting expression reflects the effective moment arm and the circumferential distribution of the force, ensuring that the dynamic impact on the yoke structure is appropriately captured.
In Figure 3, the force density in the air gap obtained from the analytical approach and FEA is compared to validate the accuracy of the analytical model. In this study, only the radial and tangential components of the electromagnetic force density along the angular position are presented, as they directly represent the excitation sources responsible for vibration and noise. Since the force density is derived from the spatial distribution of the magnetic flux density, presenting both may introduce redundancy without providing additional insight into the vibration mechanisms. Focusing on force density thus ensures clarity and highlights the physical quantities most relevant to the analysis. Figure 4 presents the FFT results of air gap force density for Models 1 and 2, allowing comparison of harmonic influences. In Figure 4, the fast Fourier transform (FFT) of the air gap force density is presented. It can be observed that the 8th and 9th harmonic orders, influenced by the pole-and-slot combinations, have significant force components, which in turn affect the electromagnetic vibroacoustic characteristics. In addition, the results indicate that the slot harmonics have a more pronounced effect in Model 1, suggesting a higher level of electromagnetic force excitation compared to the other model.
While the force density in the circumferential direction has a lesser impact compared to the radial direction, it can still generate a certain amount of force. Therefore, this force can be equivalently converted into a radial force using the previously derived Equation (6) for further consideration. Figure 5 presents the radial and tangential forces acting on the stator tooth, which are obtained through FEM based on Equations (4) and (5). Here, the effect of the slot-induced harmonics seen in Figure 4 can be seen in Model 1. By applying the derived tangential force, ft, to Equation (6), the equivalent radial forces were calculated. As a result, Model 1 yields an equivalent radial force with an average magnitude of approximately 2.6 N, while Model 2 yields approximately 1 N. These values correspond to about 1.5% of the primary radial force obtained earlier for both models, providing a more realistic representation of the actual force characteristics in practical PMSM operation. Therefore, including this equivalent force enhances the accuracy of the vibration modeling.

3. Calculation of Stator Natural Frequencies

3.1. Mechanical Equivalent Parameters

The structural parameters for the electromagnetic vibration and noise analysis of PMSMs are as follows. First, the stator core was divided into two regions: the tooth region and the yoke region. The mass and area of each region were calculated separately. To set the stator core as an equivalent structure, the neutral axis of each region was set at radius Rn, calculated as follows [24]:
R n = E c o r e A t o o t h R t + E c o r e A y o k e R y E c o r e A t o o t h + E c o r e A y o k e
where Ecore represents the Young’s modulus of the stator core, while Atooth and Ayoke denote the cross-sectional areas of the stator tooth and yoke, respectively. Additionally, Rt and Ry correspond to the radius extending to the center of the stator tooth and yoke.
J t , y = ( h t o o t h ,     y o k e ) 3 L s t k 12
The second moment of area Jt,y represents a geometrical property that quantifies how the cross-sectional area is distributed relative to a reference axis. It plays a critical role in determining the bending stiffness and deformation behavior of structural elements under loading conditions. In the context of electromagnetic machines, Jt,y is essential for accurately estimating the structural response of components such as the stator core, particularly when evaluating their natural frequencies and vibration characteristics. The mechanical parameters used in the analysis are listed in Table 2.

3.2. Natural Frequencies

To simplify the calculation of the natural frequencies of the stator core, it is assumed to be under a free boundary condition. Under this free-to-free boundary assumption, the structural vibration of the stator core is modeled as an equivalent structure. The bending stiffness, EJ, of the equivalent structure is a physical property that indicates how much a structure resists bending against external loads, as calculated in [24].
E J = E c o r e J t + γ A t o o t h Δ t o o t h 2 + E c o r e J y + γ A y o k e Δ y o k e 2
where Jt and Jy represent the second moments of inertia of the stator tooth and yoke, respectively, while Δtooth and Δyoke denote the distances from the stator tooth and yoke to the central axis of the equivalent structure. In Equation (9), the term γ serves as a correction factor to account for the relative motion acting on the equivalent structure. This coefficient, with a value of 0.4, is applicable only for mode orders higher than 2 and has been determined based on experimental data from various motor structures [24]. ρ and A are the mass density and the cross-section. In the structural model, the stator laminations are represented as a homogeneous equivalent solid. This approach assumes perfect bonding between the layers and is commonly used in vibration analysis due to its simplicity and computational efficiency. To ensure that the weight and area of the equivalent structure match those of the actual PMSM, they are calculated as follows:
ρ A = W t o o t h + W y o k e 2 π R n
where Wtooth and Wyoke represent the weight of the stator tooth and yoke, respectively.
The natural frequency and mode shape were predicted by viewing the stator as a simple ring and considering the stator teeth and yoke as additional mass. The natural frequency fw acting on the stator core can be calculated using the following equation:
f w = E J ( ρ A ) ( R n ) 4 w 6 2 w 4 + w 2 w 2     ,         w = 2 , 3 , 4 ,
where w is mode number, the form of deformation of the stator core due to pressure, which exhibits periodic variations over time, is presented. If the rotating body operates at the same frequency as the first bending mode, high-frequency vibrations may arise, potentially leading to damage or deformation of the rotating body. Therefore, it is essential to perform a critical speed analysis during the early design stage to ensure that the excitation frequencies, including both mechanical rotation speeds and electrical harmonics, do not align with the structural natural frequencies. Accurately predicting these frequencies enables engineers to design mechanical structures that are robust against resonance phenomena, thereby improving the operational reliability and acoustic performance of the electrical machine.

4. Vibroacoustic Analysis

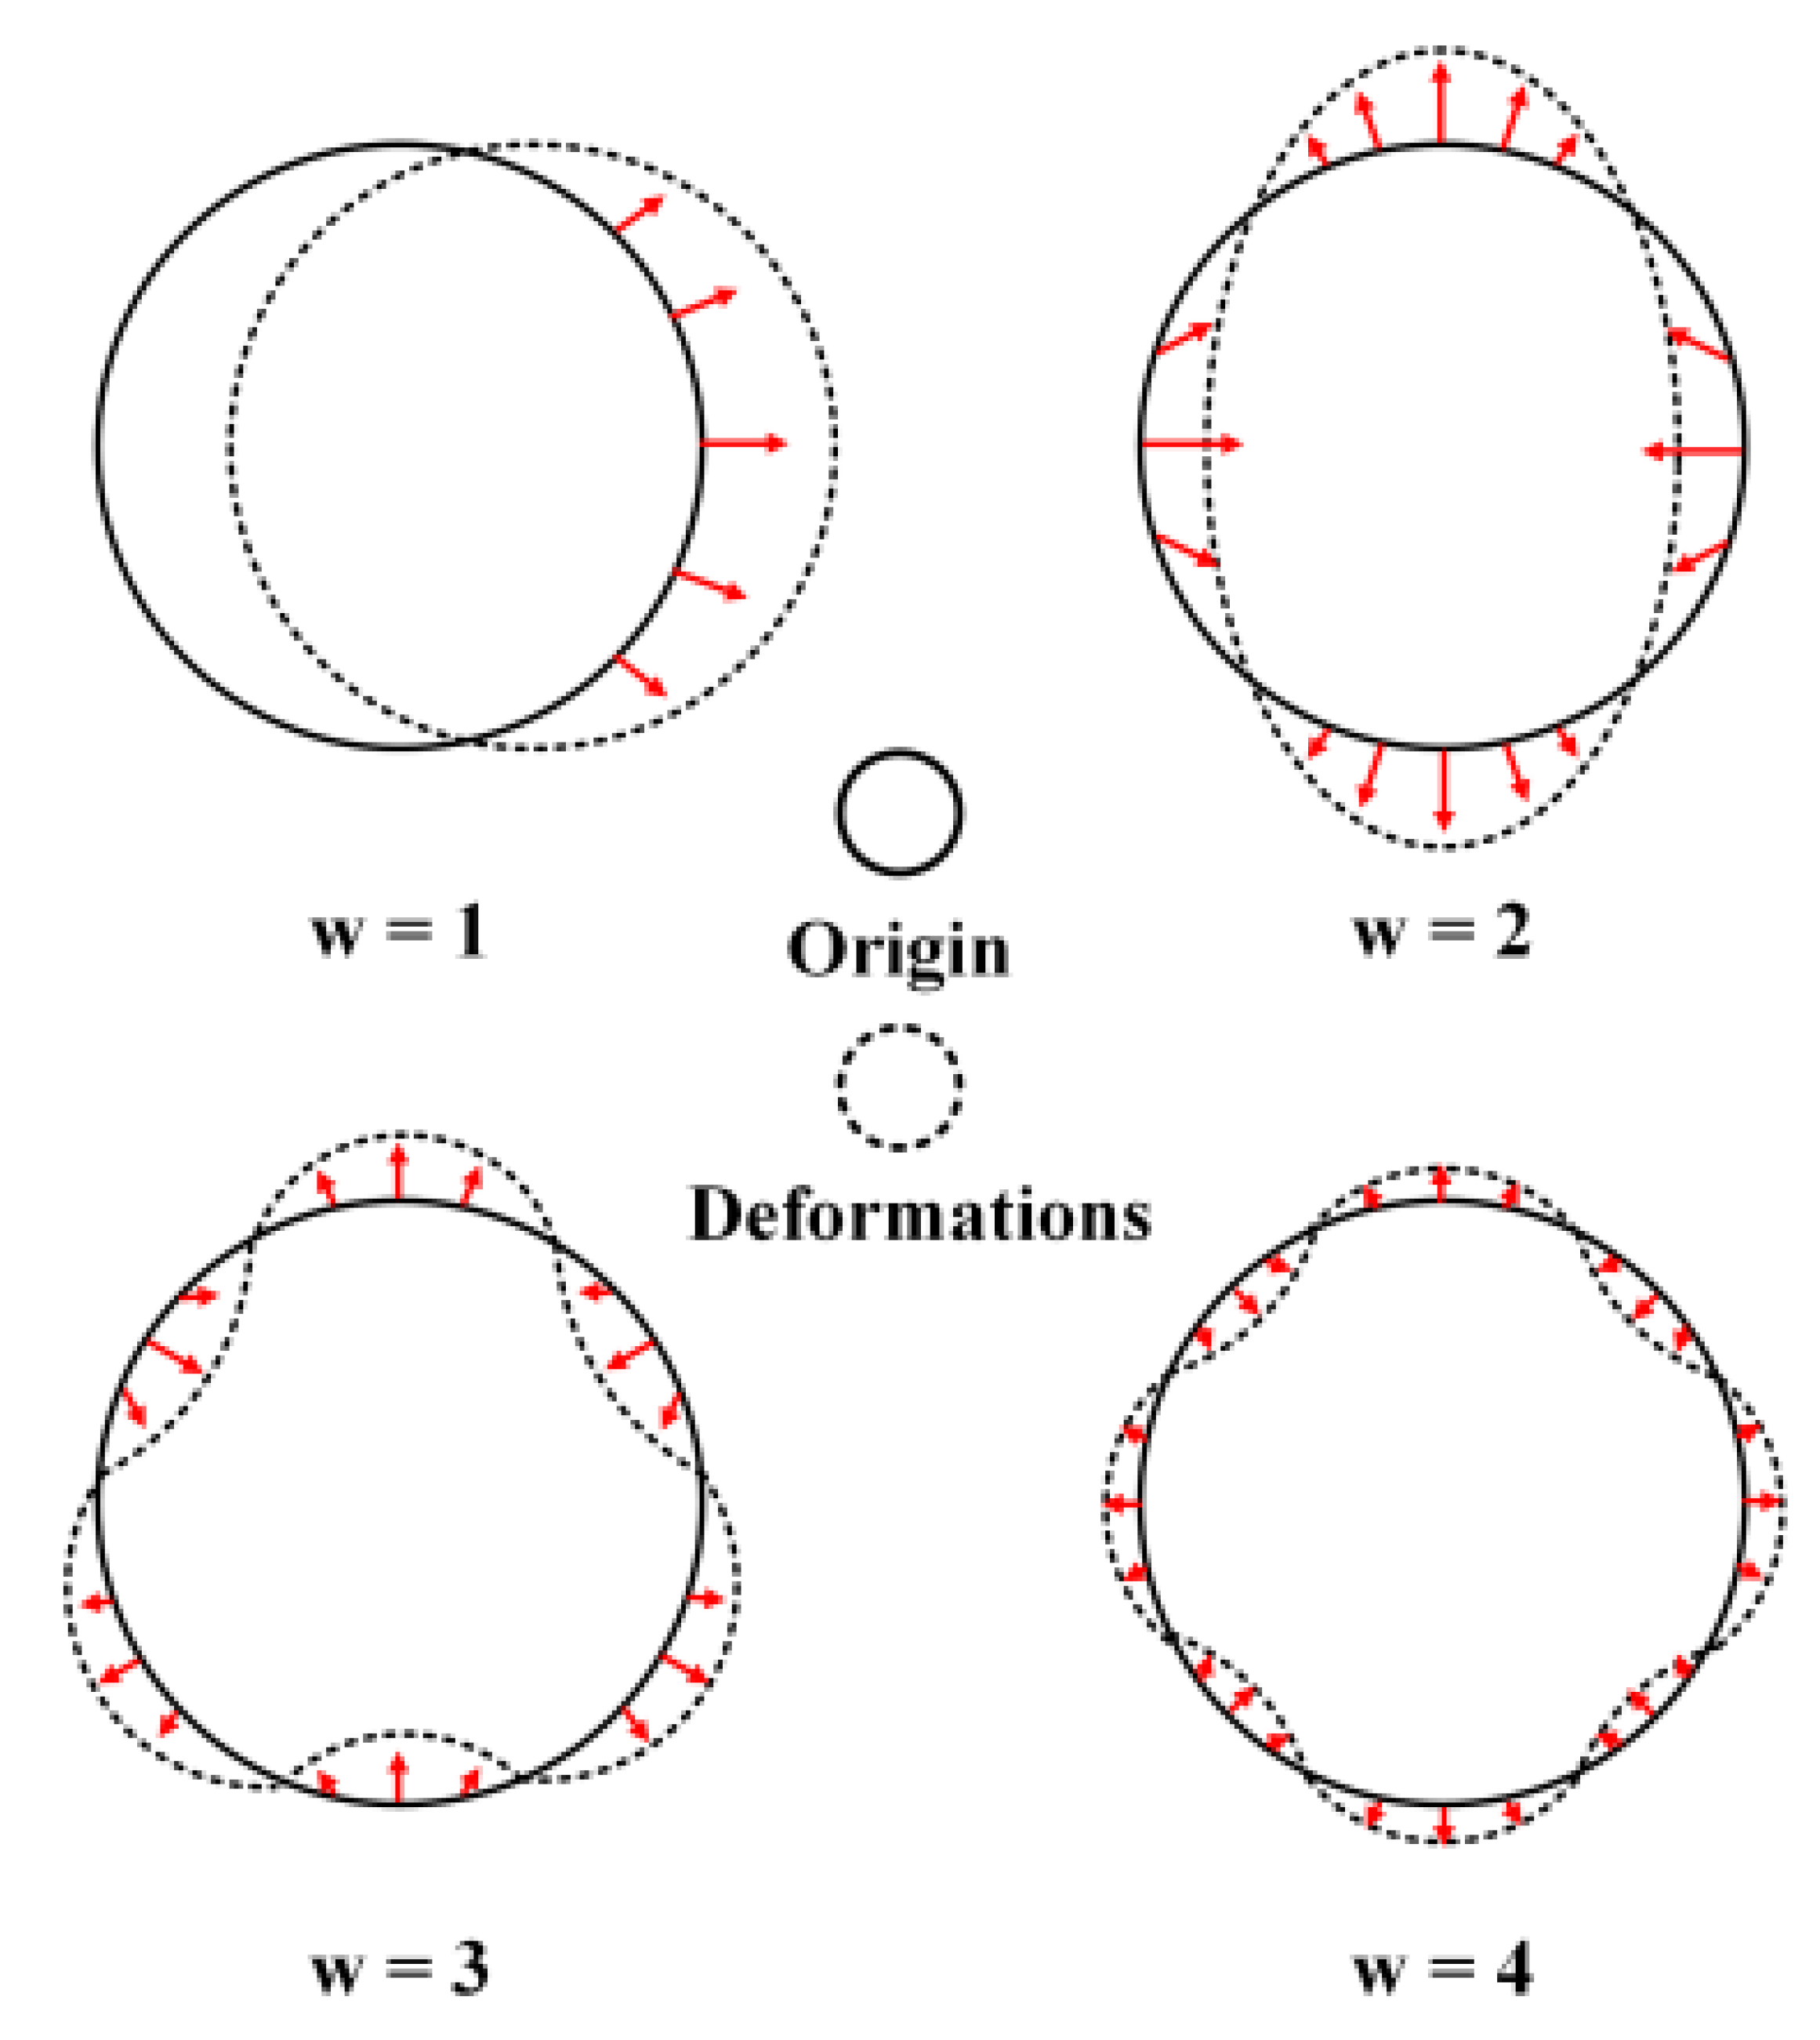
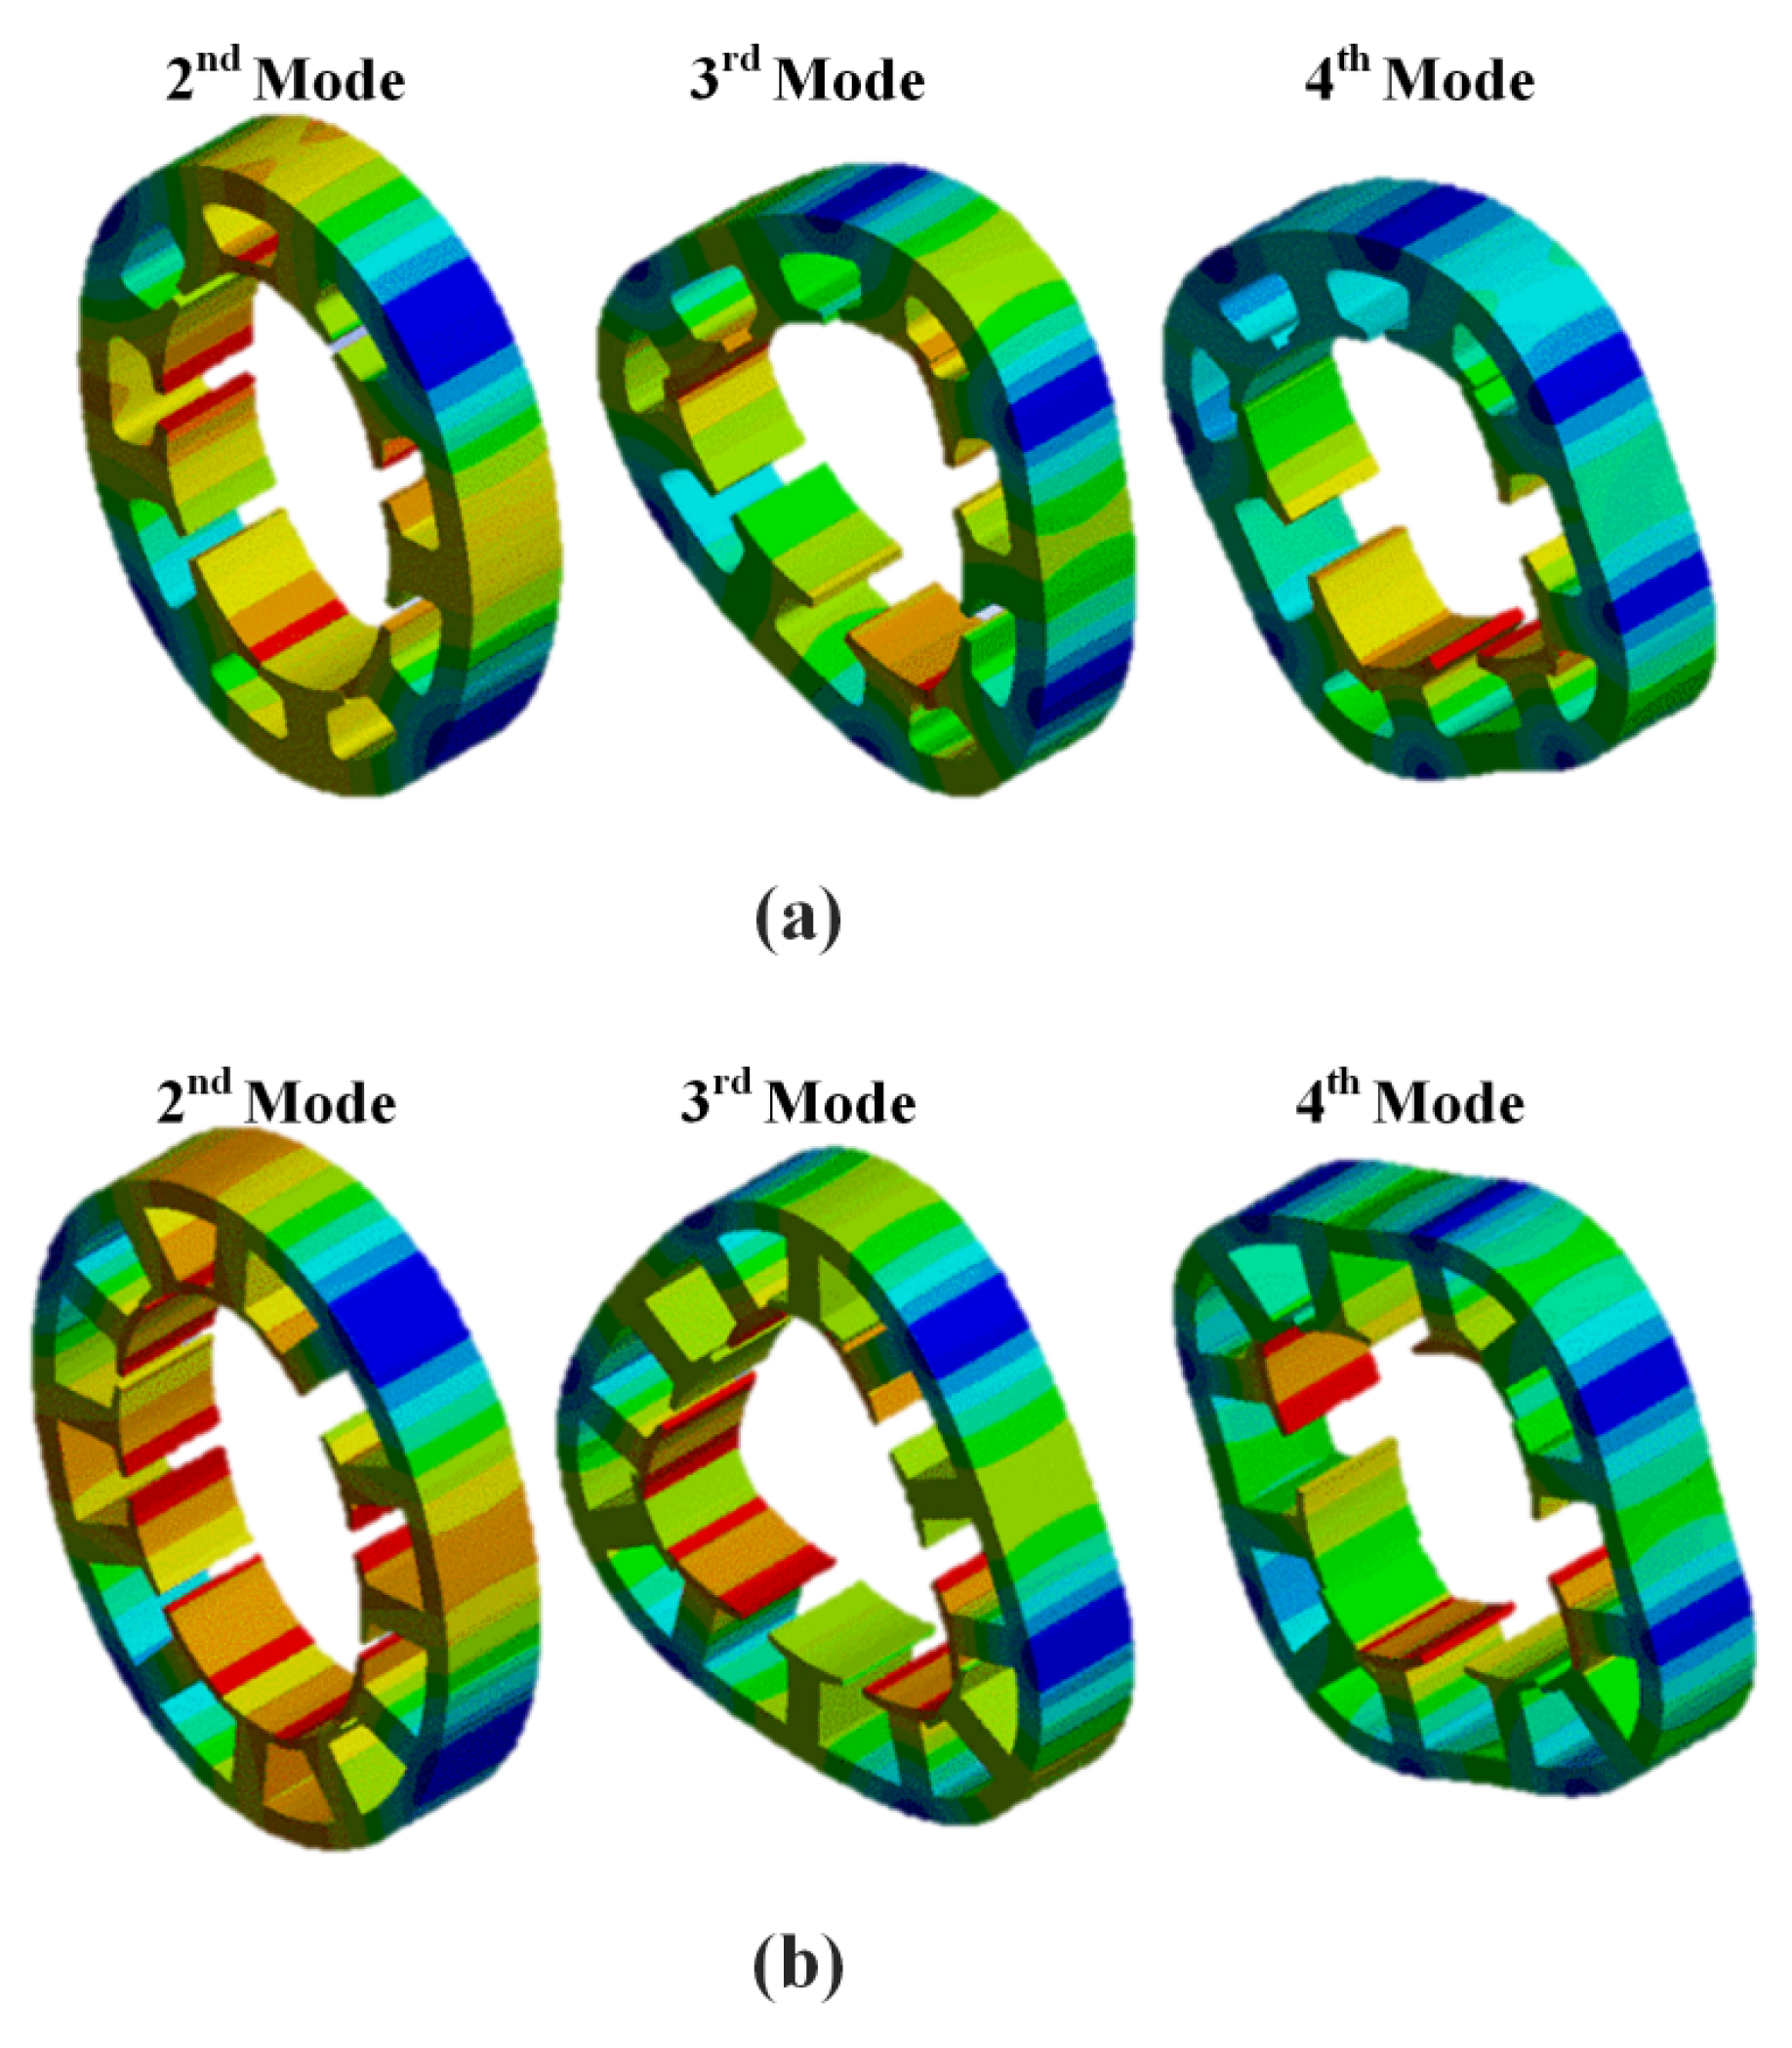
4.1. Structural Vibration Modes Analysis

The excitation of radial modes induces radial deformation of the external structure, as observed in Figure 6, leading to noise and vibrations. While radial modes are primarily influenced by radial stress harmonics, they can also be affected by circumferential harmonics due to the tooth-modulation effect described in Section 2. When the vibrating type is w = 1, it corresponds to the bending mode. For w = 2, 3, and 4, the stator core undergoes deformation due to forces with periodic wave characteristics. The ovalization mode (w = 2) is especially important due to its low natural frequency and high likelihood of being excited within the audible frequency range. This makes it a critical factor in evaluating noise and vibration levels in PMSMs. Furthermore, the amplitude of stator deformation is inversely proportional to the fourth power of the mode number, indicating that lower-order modes dominate the dynamic response.

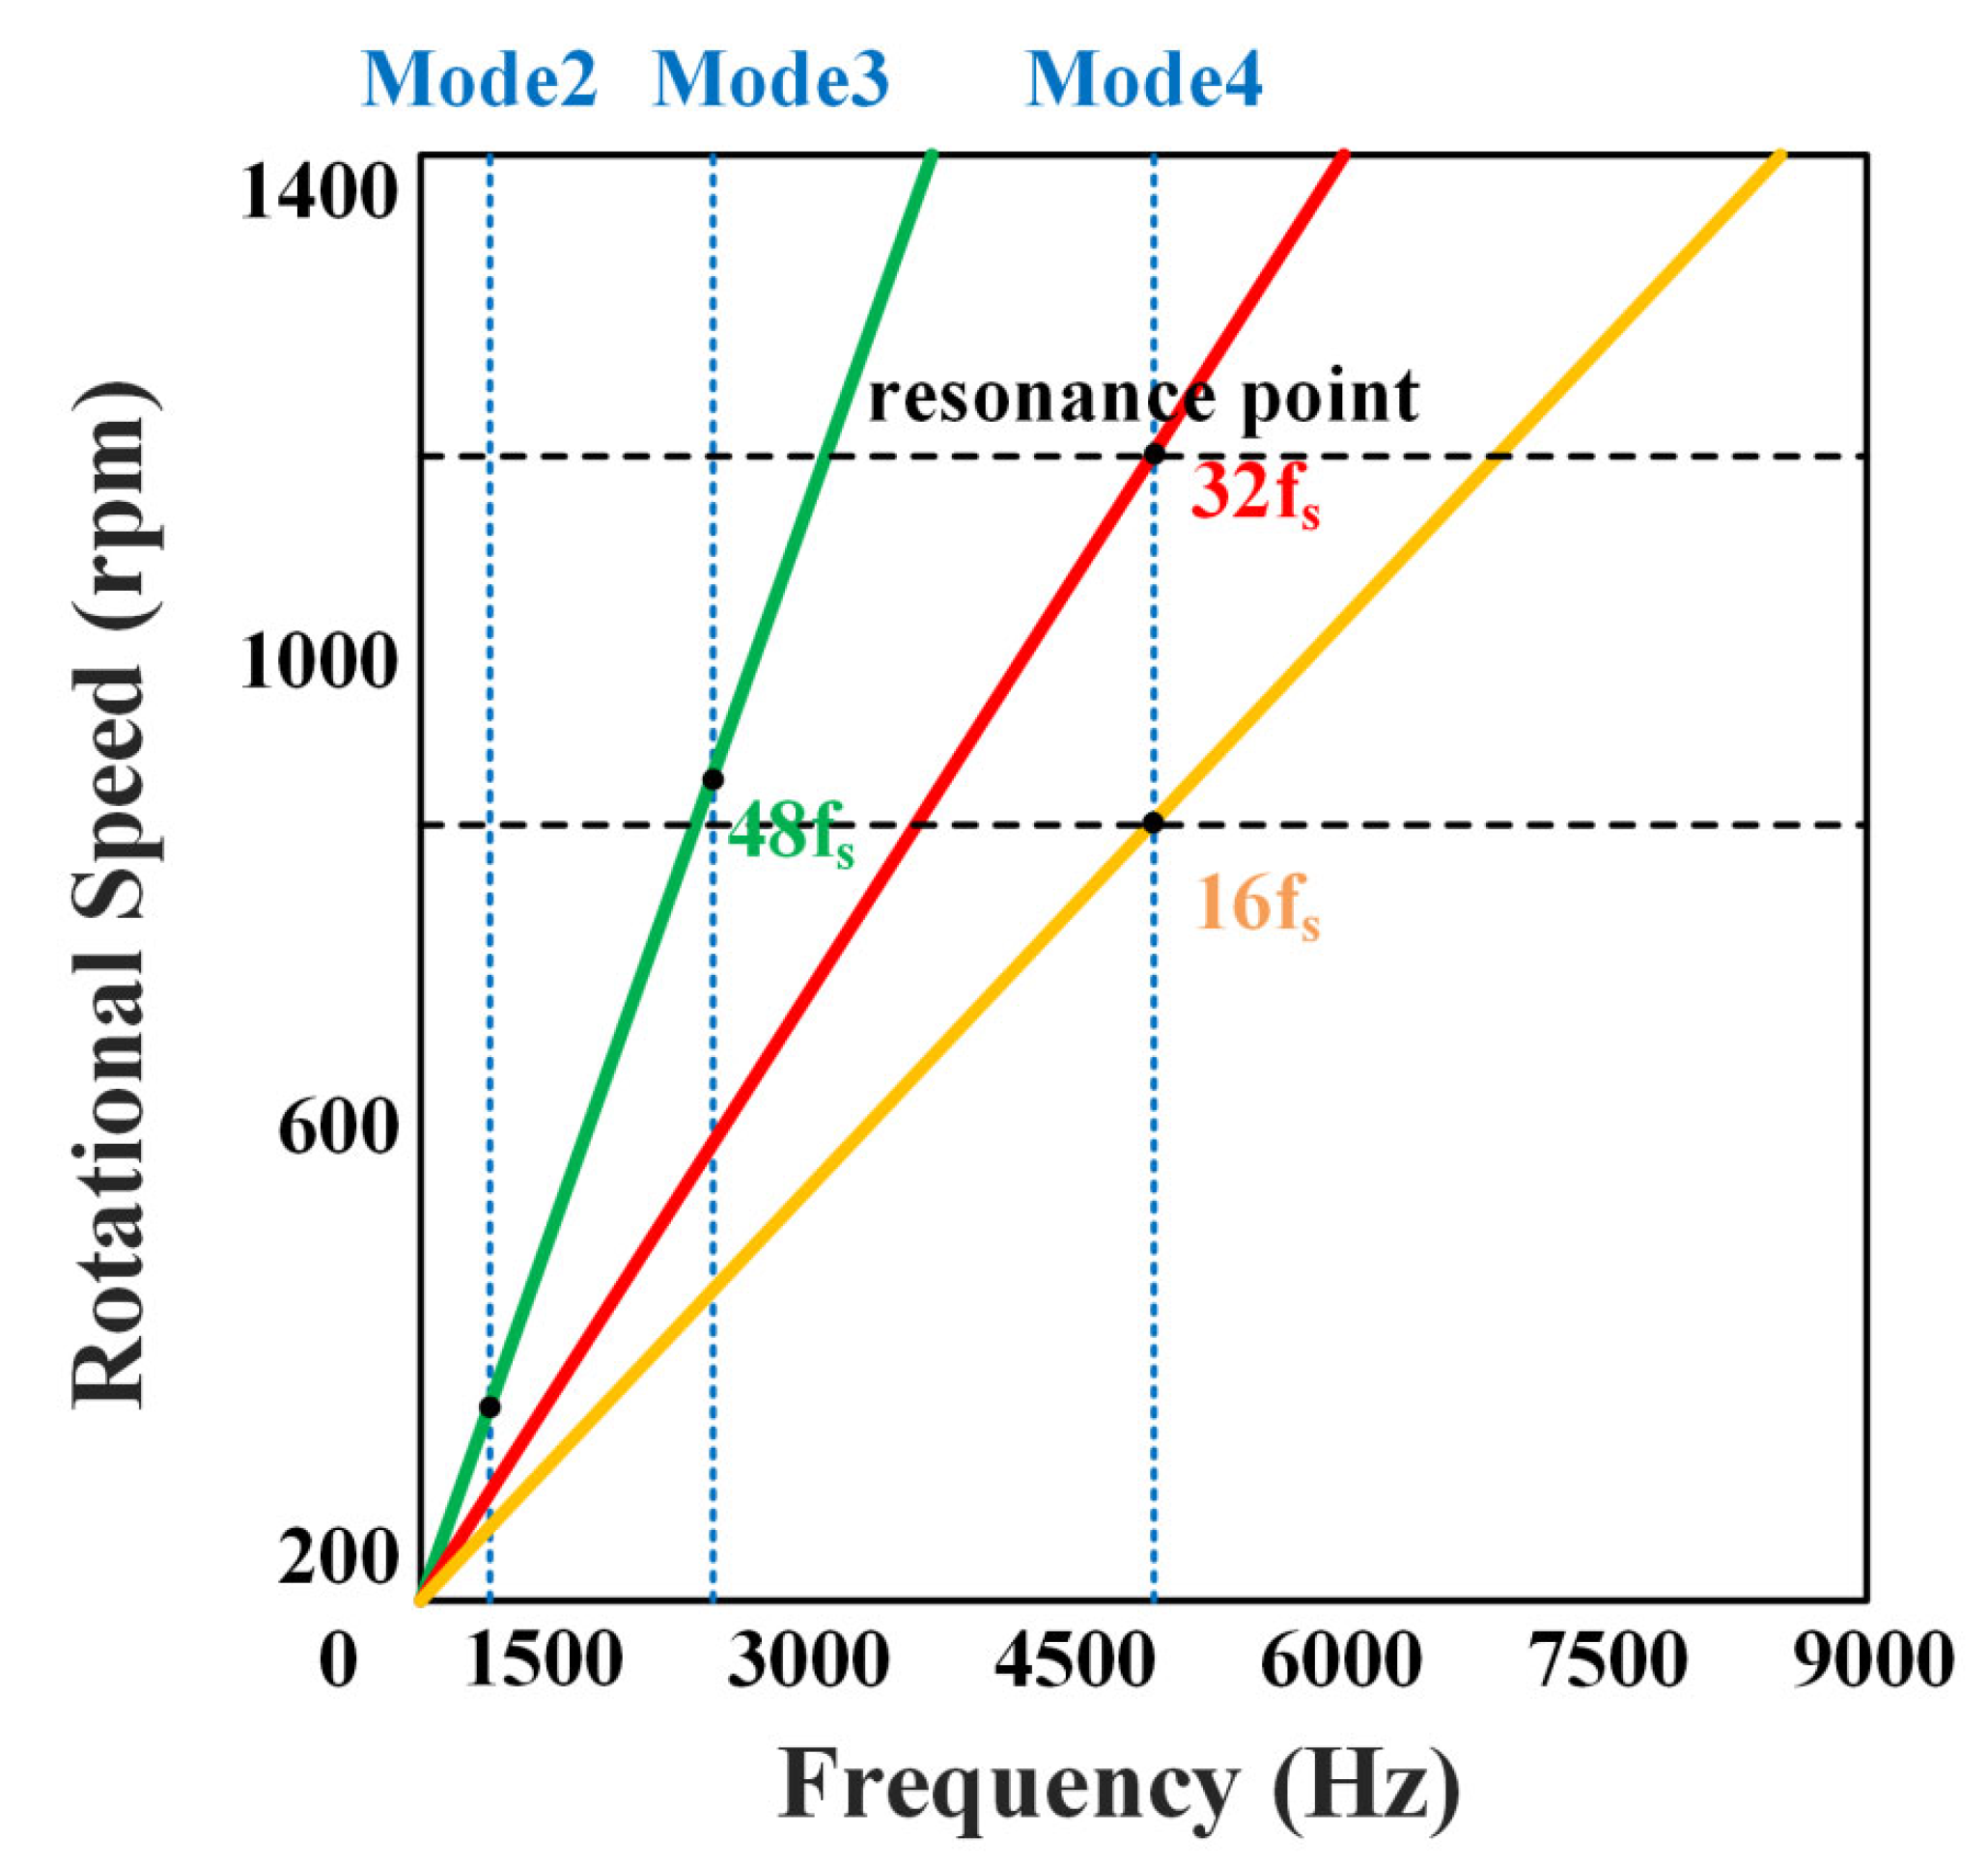
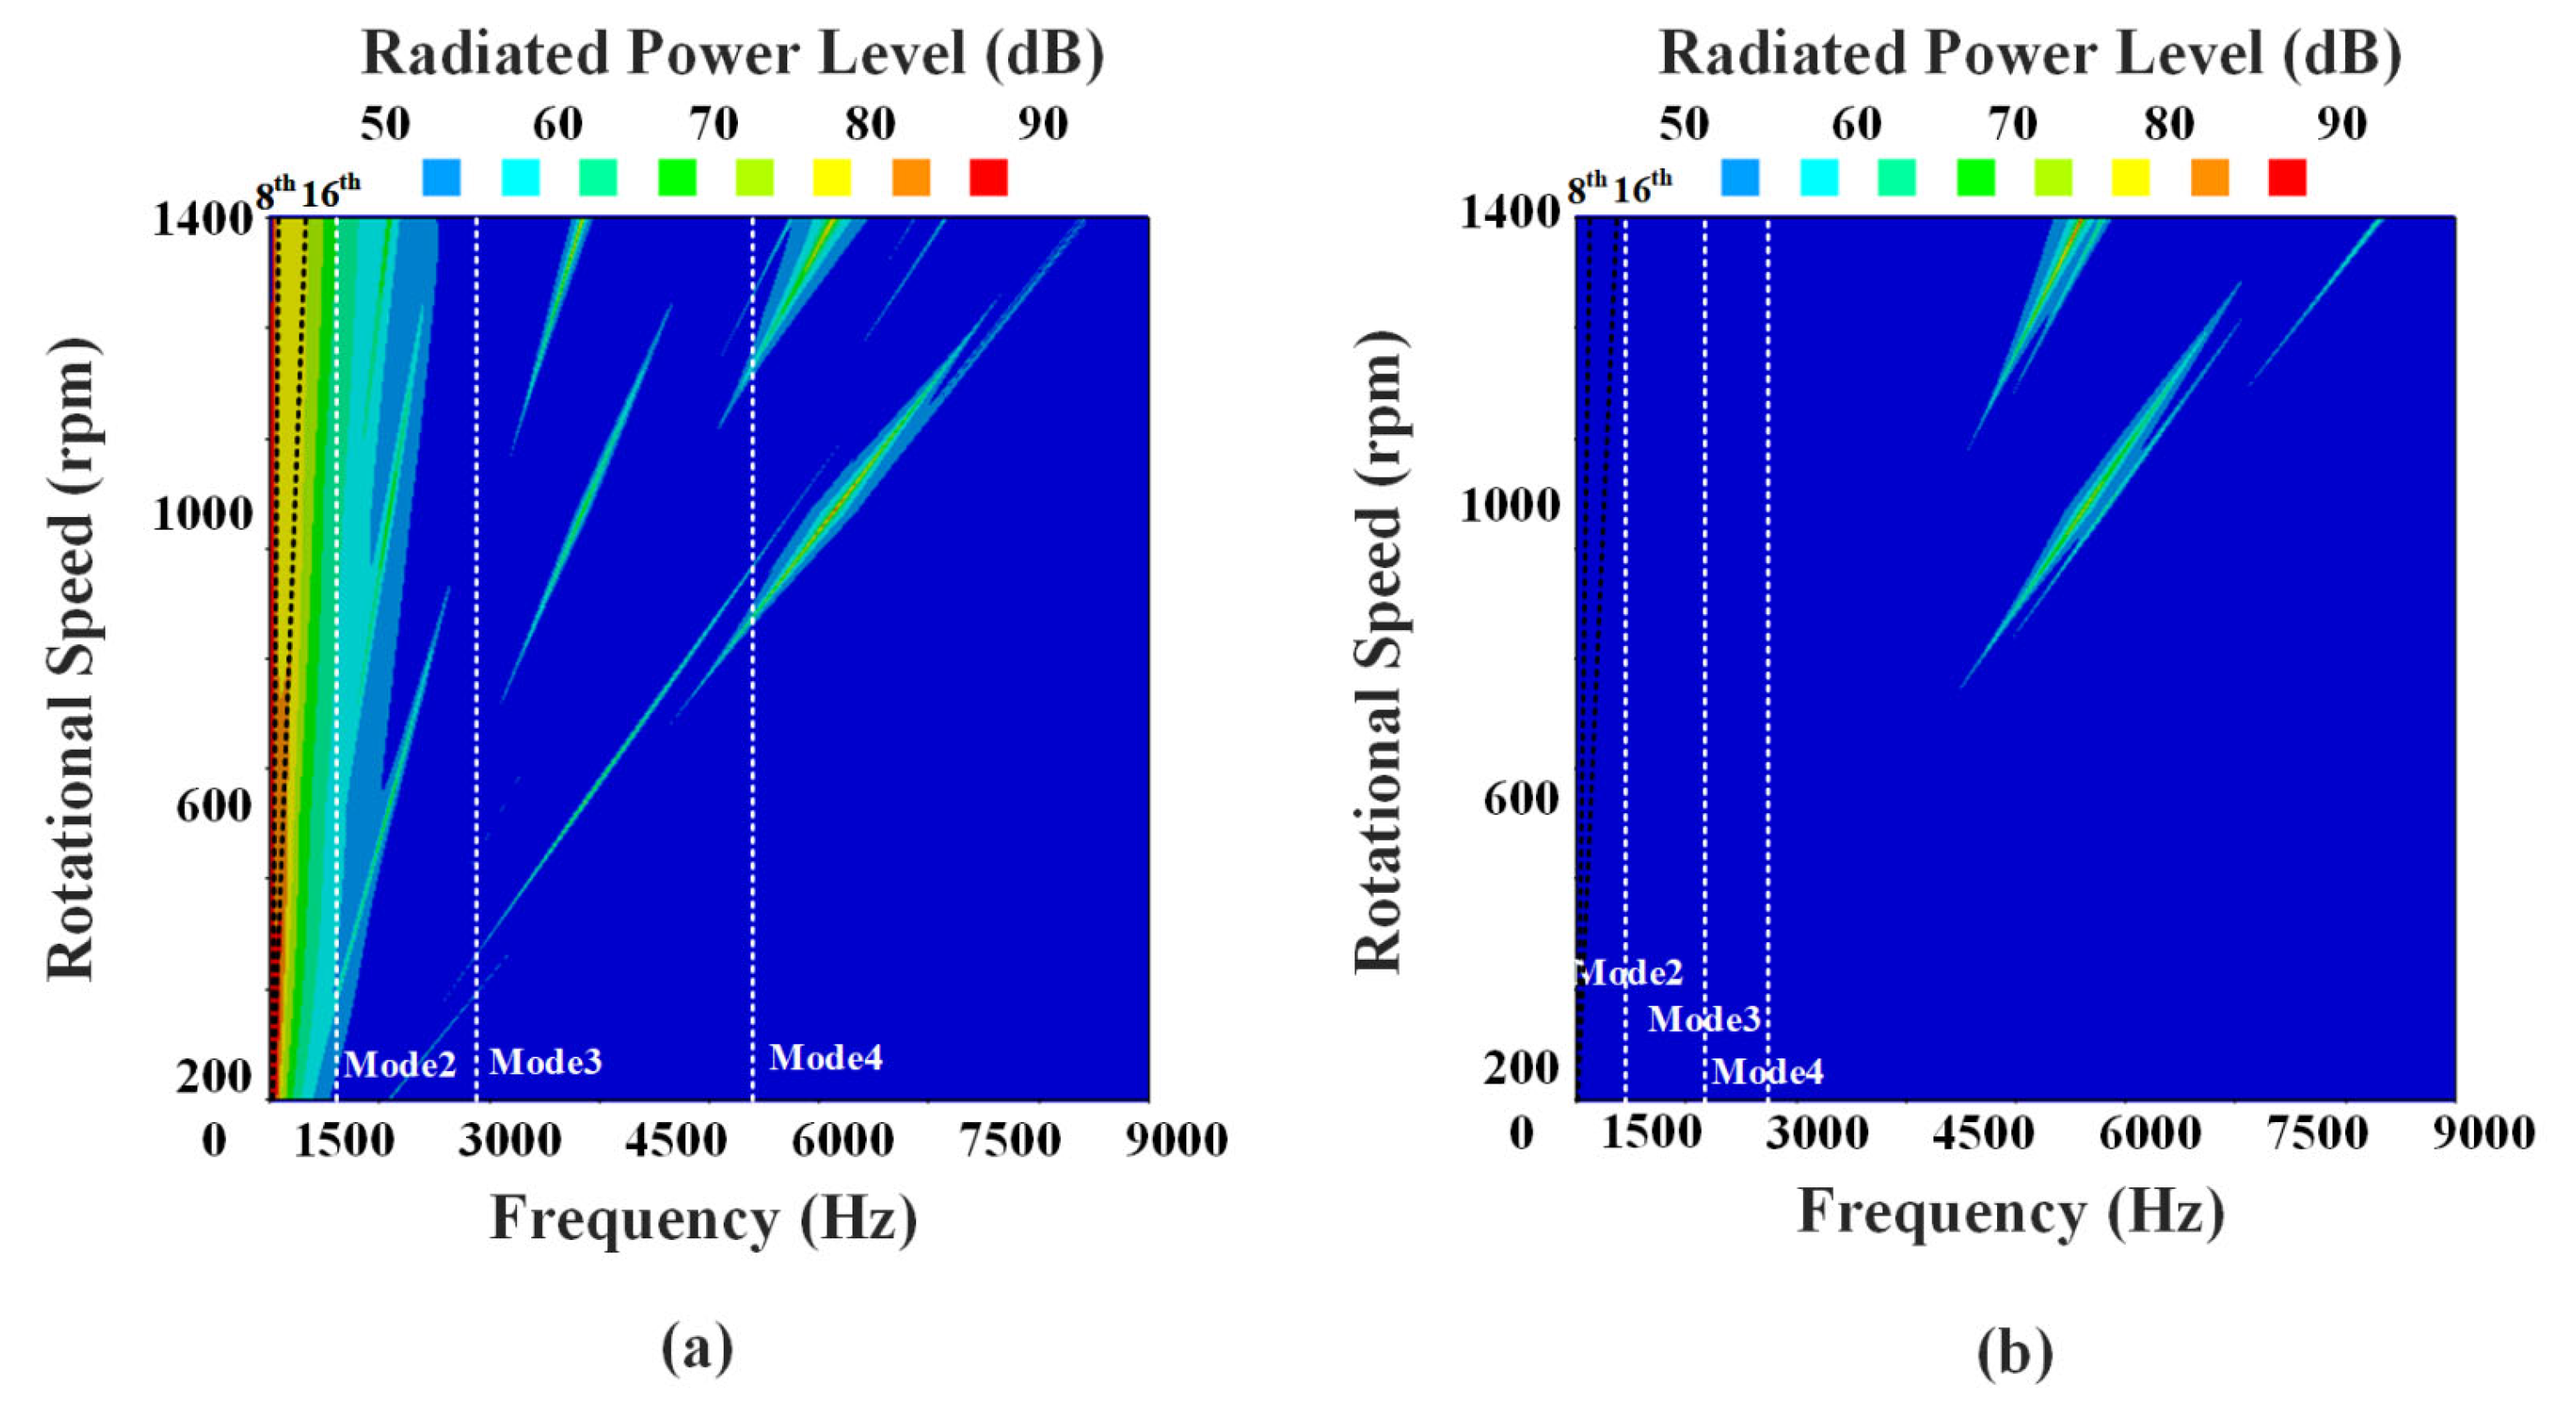
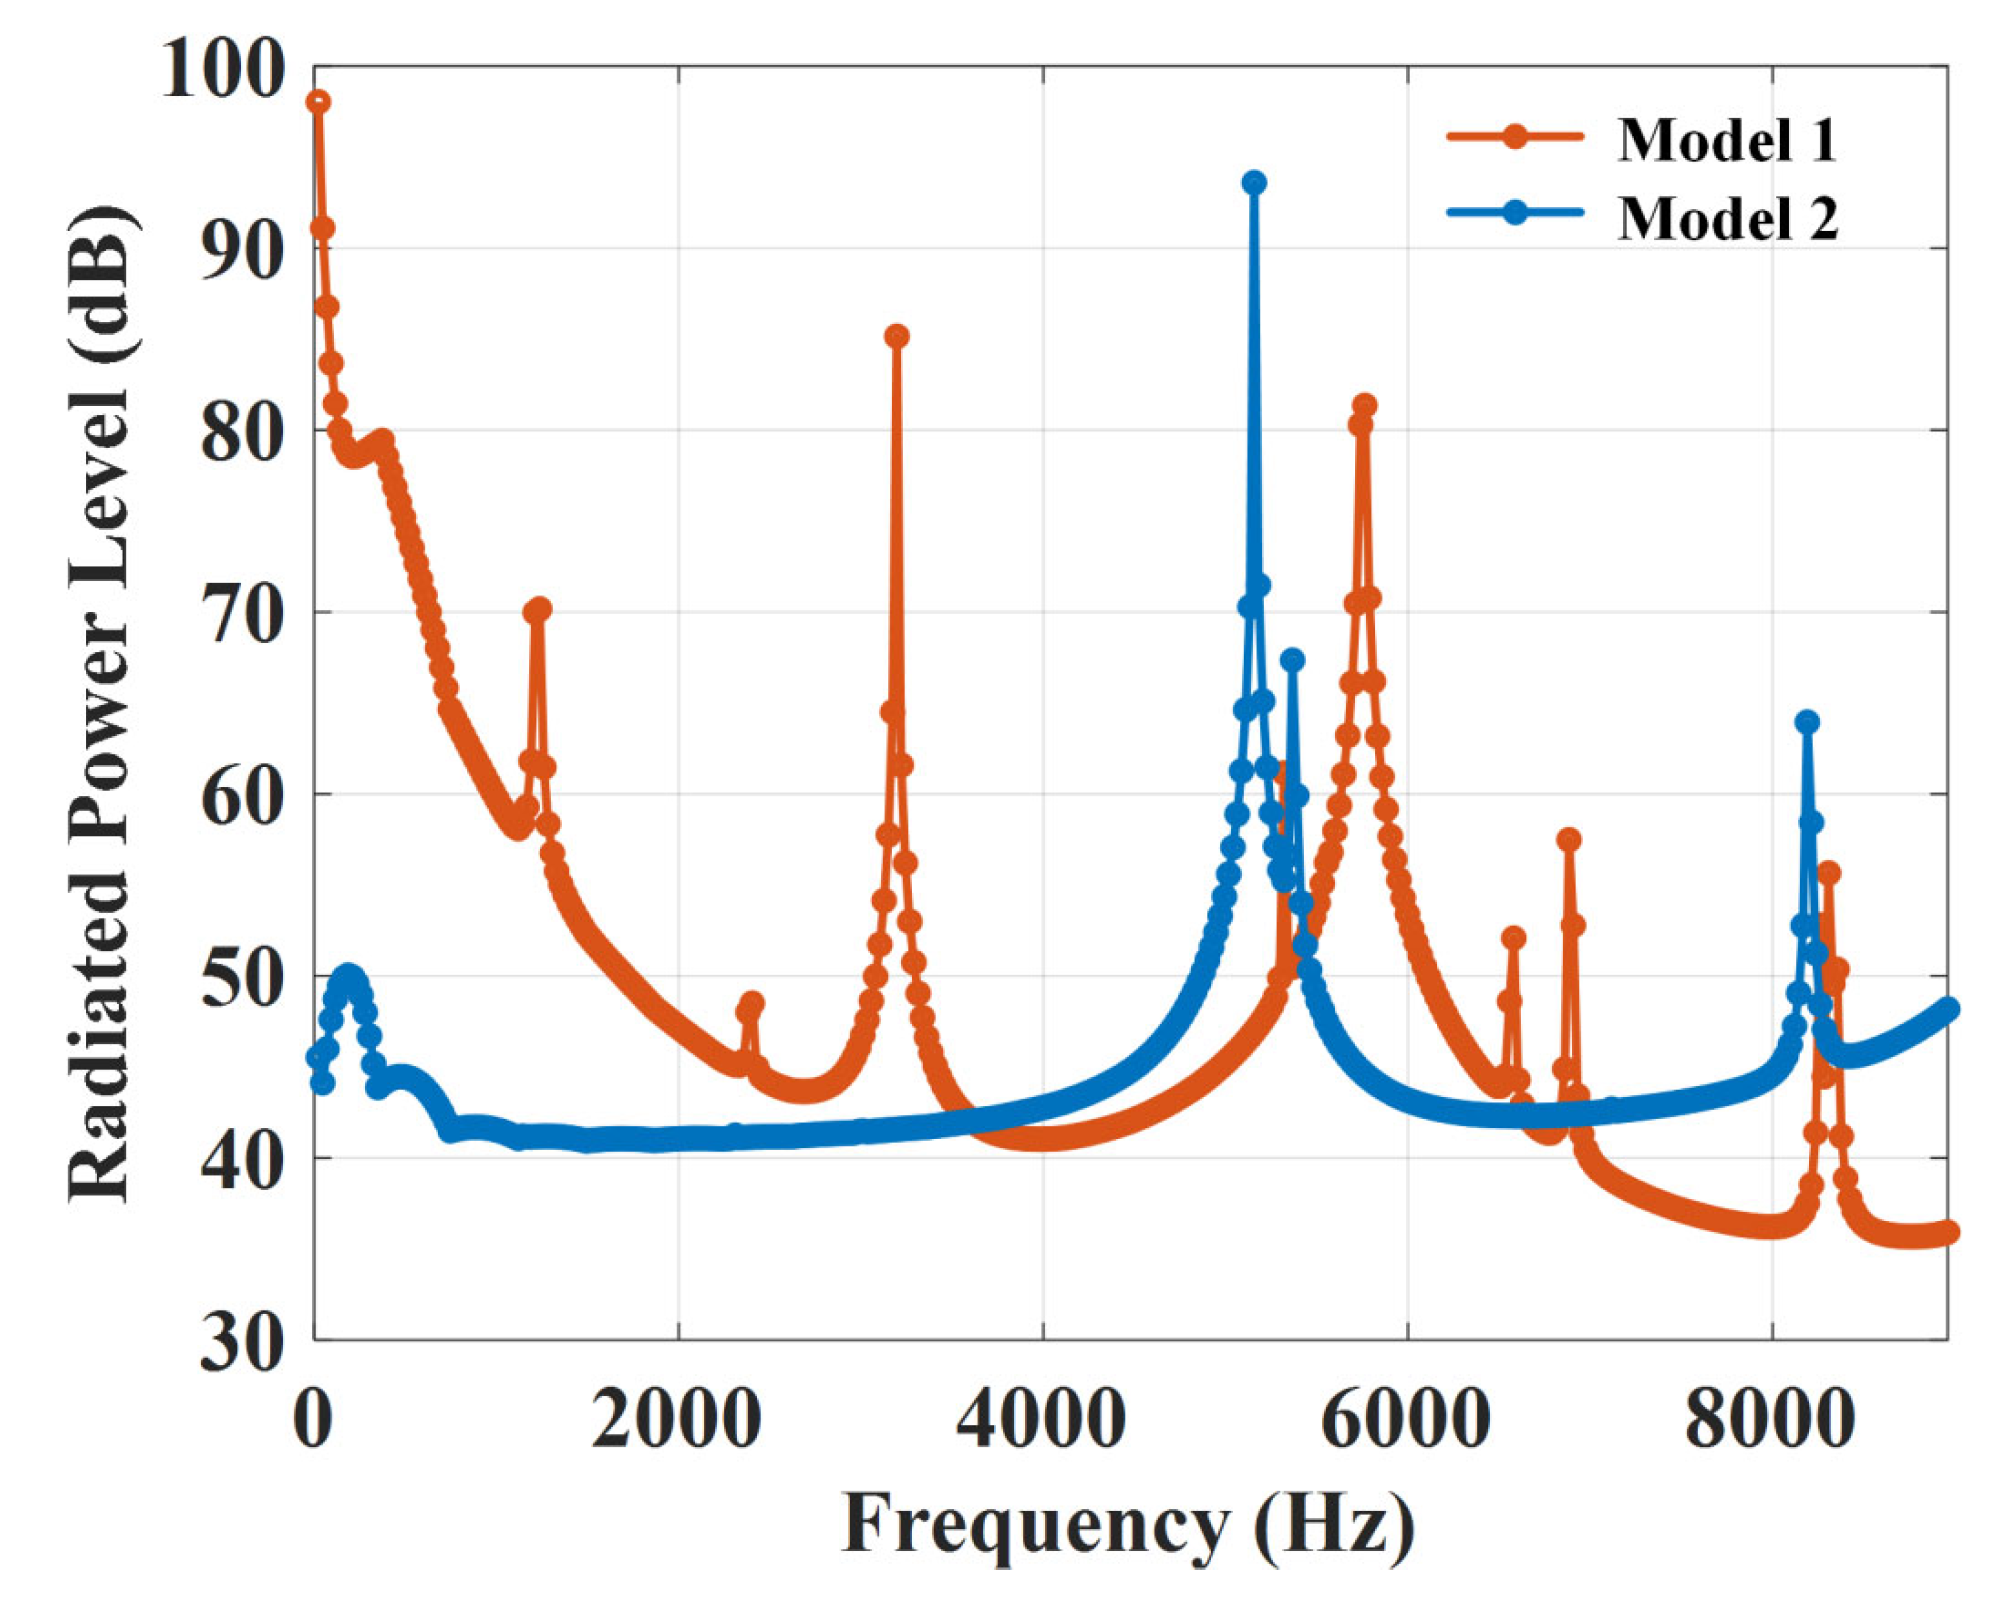
4.2. Acoustic Radiation Analysis

When analyzing the dynamic behavior of rotating systems to prevent resonance, it is essential to ensure that the natural frequencies do not coincide with any critical or operational speeds. Critical speeds are rotational speeds at which resonance is more likely to occur. Electrical machines with variable speed are designed with consideration of both the converter and the machine to minimize structural excitation. For example, by ensuring that the synchronous frequency, fs, determined by the PWM switching frequency of the converter, does not coincide with the structural mode frequencies, the likelihood of vibration and noise generation in electrical machines can be reduced. Figure 7 illustrates the resonance points that should be avoided by marking the critical speeds where resonance occurs with the previously derived structural mode frequencies.

5. Results and Discussion

The structural vibration modes analysis of SPMSM is shown in Figure 8. As mentioned in Section 4, the radial mode of structural vibration induces deformation in the stator structure. The stator deformation can be observed in Figure 8a,b, caused by periodic forces influenced by radial stress harmonics and circumferential harmonics considering the tooth-modulation effect. It can be observed that the natural frequency mentioned in Section 3 varies depending on the analysis model. This variation arises because the bending stiffness, calculated based on the mechanical parameters of the stator yoke and teeth, differs and is subsequently applied to Equation (11), resulting in different outcomes. The comparison between the natural frequencies obtained using the analytical method and those derived from the FEA-based modal analysis can be found in Table 3 and Table 4. For Model 1, the error rates for the second, third, and fourth modes are approximately 3.8%, 2.15%, and 8.19%, respectively. In Model 2, the corresponding error rates are about 8.78%, 10.46%, and 19.37%. It was observed that the error increases as the structural vibration mode increases. The acoustic radiation analysis of the SPMSMs can be seen in Figure 9. As mentioned in Section 4, resonance occurs when the natural frequency of the stator, determined by the structural vibration mode, coincides with the excitation frequency. Therefore, the design must consider the synchronous frequency imposed by the converter. As shown in Figure 9, electromagnetic force harmonics caused by the pole-and-slot combination serve as electromagnetic influence factors, leading to vibroacoustic excitation. In Figure 9, the radiated power levels of Model 1 and Model 2 are plotted within a range of 50 dB to 90 dB for effective comparison. The acoustic radiation power level of the SPMSM was analyzed for both models, as shown in Figure 10. This enables the identification of which model is more affected by electromagnetic force harmonics, such as the 8th and 16th harmonics. It can be observed that Model 1 is significantly influenced by electromagnetic force harmonics, leading to higher noise and vibration levels. In contrast, Model 2 exhibits relatively stabilized noise and vibration characteristics compared to Model 1. Therefore, when selecting the pole-and-slot combination during the initial design phase, it is beneficial to analyze and compare not only the electromagnetic characteristics but also the vibroacoustic properties to achieve a more stable model.

6. Conclusions

In this study, an analysis of electromagnetic noise and vibration was conducted by considering the magnetic forces that account for the tooth-modulation effect. In Section 2, an analysis of the radial and circumferential forces acting on the stator teeth was conducted. Not only was the dominant radial force considered, but the circumferential force was also equivalently converted into a radial force for comprehensive evaluation. Since these forces are primary factors influencing electromagnetic vibration and noise in PMSMs, they were derived using the Maxwell stress tensor and relevant equations. Additionally, FFT analysis was performed to identify the harmonic orders with the most significant impact. In Section 3, the natural frequencies corresponding to the vibration modes of the stator’s structural vibration were determined by applying the equivalent mechanical parameters of the stator to the bending stiffness equation. These analytically derived natural frequencies were then compared with those obtained through FEA modal analysis in Section 4, which evaluated the deformation shapes of the stator, allowing for an assessment of the accuracy of the analytical approach. Subsequently, FEA harmonic response analysis was conducted for each analytical model, generating an acoustic radiation waterfall plot. The electromagnetic finite element analysis was conducted using the commercial software ANSYS Maxwell, and the structural NVH analysis was performed using ANSYS Mechanical, both included in ANSYS Electronics Desktop 2024 R2 (ANSYS Inc., Canonsburg, PA, USA). The radial and tangential magnetic force densities obtained from the 2D transient magnetic simulation were exported and applied as external loads on the inner surface of the stator in the structural analysis domain. To ensure accurate coupling between the electromagnetic and structural analyses, identical mesh geometry and nodal mapping were used at the interface, enabling one-way force transfer from the electromagnetic model to the structural domain. By examining the resonance points corresponding to the previously derived natural frequencies of each mode, variations in the radiated power level were analyzed. In this work, mechanical vibration is analyzed under the assumption of ideal mechanical structure and symmetric winding layout. The study focuses exclusively on vibration induced by electromagnetic forces due to slot–pole interaction and stator tooth modulation. The effects of rotor imbalance, bearing nonlinearity, and current harmonic content are not considered in the current model but are recognized as important topics for future investigation. By reviewing the results obtained from the electromagnetic noise and vibration analysis, it is evident that considering not only the electromagnetic characteristics related to pole-and-slot combinations and stator geometry but also the vibroacoustic properties during the initial design phase is essential for ensuring the stability of the design model. Although optimal slot–pole combinations are widely accepted for reducing vibration and noise, the physical reasoning behind their effectiveness is often discussed qualitatively. The present study provides an analytical framework to examine the harmonic interaction between slot and pole numbers and their influence on electromagnetic force generation, offering a more generalized and explainable approach for low-noise design.

Author Contributions

Conceptualization, Y.-S.K.; methodology, Y.-S.K., K.-H.S., Y.-J.K. and J.-Y.C.; software, Y.-S.K.; validation, Y.-S.K.; formal analysis, Y.-S.K.; investigation, Y.-S.K.; resources, J.-Y.C.; data curation, Y.-S.K.; writing—original draft preparation, Y.-S.K.; writing—review and editing, H.-K.L., J.-W.Y., W.-S.J., Y.-T.C., J.-H.J., Y.-J.K., K.-H.S. and J.-Y.C.; visualization, Y.-S.K.; supervision, K.-H.S., Y.-J.K. and J.-Y.C.; project administration, J.-Y.C. and K.-H.S.; funding acquisition, J.-Y.C. and K.-H.S. All authors have read and agreed to the published version of the manuscript.

Funding

This work was supported in part by BK21 FOUR Program funded by Chungnam National University Research Grant, 2024; and in part by the ‘New Faculty Research Support Grant’ at Changwon National University in 2024.

Data Availability Statement

Data are contained within the article.

Conflicts of Interest

Author Hoon-Ki Lee was employed by the company LG Electronics Inc. The remaining authors declare that the research was conducted in the absence of any commercial or financial relationships that could be construed as a potential conflict of interest.

Appendix A

From (1)–(6), magnetization modeling, representing the magnetization vector in the region where the permanent magnet is considered, is expressed:
M z n I = n = 1 , 2 M r n cos n ( θ θ 0 ) i r + n = 1 , 2 M θ n sin n ( θ θ 0 ) i θ
where
M r n = 1 π x = 1 P π 2 p α p + ( x 1 ) π p π 2 p α p + ( x 1 ) π p M 0 cos ( θ ( x 1 ) π p ) cos ( n θ ) d θ M θ n = 1 π x = 1 P π 2 p α p + ( x 1 ) π p π 2 p α p + ( x 1 ) π p M 0 sin ( θ ( x 1 ) π p ) sin ( n θ ) d θ                                                   x = o d d     M r n = 1 π x = 1 P π 2 p α p + ( x 1 ) π p π 2 p α p + ( x 1 ) π p M 0 cos ( θ ( x 1 ) π p ) cos ( n θ ) d θ M θ n = 1 π x = 1 P π 2 p α p + ( x 1 ) π p π 2 p α p + ( x 1 ) π p M 0 sin ( θ ( x 1 ) π p ) sin ( n θ ) d θ                                           x = e v e n  
The vector potential in each subdomain can be rewritten using the following equations:
A z n I = n = 1 , 2 ( A n I R r r n r R r n + B n I R m r n r R m n + W s ( r ) ) sin n θ + ( C n I R r r n r R r n + D n I R m r n r R m n W c ( r ) ) cos n θ i z
A z n I I = n = 1 , 2 ( A n I I R m r n r R m n + B n I I R s r n r R s n ) sin n θ + ( C n I I R m r n r R m n + D n I I R s r n r R s n ) cos n θ i z
A z m i = A 0 i + B 0 i ln r + m = 1 , 2 ( A m i R s r m π β r R s m π β + B m i R s o r m π β r R s o m π β ) cos m π β θ θ i i z
A z k j , I = A 0 j , I + B 0 j , I ln r 1 4 μ 0 J 0 j , I r 2             + k = 1 , 2 ( A k j , I R s o r k π δ r R s o k π δ + B k j , I R t r k π δ r R t k π δ + μ 0 J k I , j ( k π δ ) 2 4 r 2 ) cos ( k π δ ( θ θ j i ) )   i z  
A z k j , I I = A 0 j , I I + 1 2 μ 0 J 0 I I , j ( R q ) 2 ln r 1 2 r 2               + k = 1 , 2 ( A k j , I I R t r k π δ r R t k π δ + B k j , I I R q r k π δ r R q k π δ + μ 0 J k I I , j ( k π δ ) 2 4 r 2 ) cos ( k π δ ( θ θ j i ) )   i z  
where
W c ( r ) = μ 0 2 r ln r M n sin ( n θ 0 )     n = 1 r μ 0 M n ( n 2 1 ) sin ( n θ 0 )         n 1 ,   W c ( r ) = μ 0 2 r ln r M n cos ( n θ 0 )     n = 1 r μ 0 M n ( n 2 1 ) cos ( n θ 0 )         n 1
J z I , j = J z 0 I , j + k = 1 J z k I , j cos k π δ θ θ j i i z ,   J z I I , j = J z 0 I I , j + k = 1 J z k I I , j cos k π δ θ θ j i i z
B r = 1 r A θ i r ,   B θ = A r i θ
The general solution of the vector potential was applied with boundary conditions, and the coefficients were derived using the following equations:
A n I r n B n I r n = μ 0 r n cos ( n θ 0 ) ( M n n 2 1 + M θ n ) C n I r n D n I r n = μ 0 r n sin ( n θ 0 ) ( M n n 2 1 + M θ n )                             r = R r
A n I r n + B n I r n A n I I r n B n I I r n = μ 0 M n n 2 1 cos ( n θ 0 ) C n I r n + D n I r n C n I I r n D n I I r n = μ 0 M n n 2 1 sin ( n θ 0 ) A n I r n B n I r n A n I I r n + B n I I r n = μ 0 r n cos ( n θ 0 ) ( M n n 2 1 + M θ n ) C n I r n D n I r n C n I I r n + D n I I r n = μ 0 r n sin ( n θ 0 ) ( M n n 2 1 + M θ n )                           r = R m
A z n I I = A m i                       r = R s
A z m i = A z k j , I               r = R s o
A 0 j , I + B 0 j , I ln r 1 4 μ 0 J 0 j , I r 2 = A 0 j , I I + 1 2 μ 0 J 0 I I , j r 5 2 ln r 1 2 r 2 A k j , I R s o r k π δ r R s o k π δ + B k j , I R t r k π δ r R t k π δ = A k j , I I R t r k π δ r R t k π δ + B k j , I I R q r k π δ r R q k π δ B 0 j , I = 1 2 μ 0 J 0 j , I I ( R q ) 2 r 2 + 1 2 μ 0 J 0 j , I r 2 k π δ A k j , I R s o r k π δ + r R s o k π δ + B k j , I R t r k π δ + r R t k π δ = k π δ A k j , I I R t r k π δ + r R t k π δ + B k j , I I R q r k π δ + r R q k π δ                   r = R t
k π δ A k j R t r k π δ + r R t k π δ + B k j R q r k π δ + r R q k π δ + 2 μ 0 J k j r k π δ 2 4 = 0                               r = R q
Matrix operations were performed using MATLAB R2022a (MathWorks Inc., Natick, MA, USA) by reconstructing the above equations.

References

  1. Devillers, E. Electromagnetic Subdomain Modeling Technique for the Fast Prediction of Radial and Circumferential Stress Harmonics in Electrical Machines; Ecole Centrale de Lille: Villeneuve-d’Ascq, France, 2018. [Google Scholar]
  2. Zou, J.; Lan, H.; Xu, Y.; Zhao, B. Analysis of global and local force harmonics and their effects on vibration in permanent magnet synchronous machines. IEEE Trans. Energy Convers. 2017, 32, 1523–1532. [Google Scholar] [CrossRef]
  3. Lin, F.; Zuo, S.; Deng, W.; Wu, S. Modeling and analysis of electromagnetic force, vibration, and noise in permanent-magnet synchronous motor considering current harmonics. IEEE Trans. Ind. Electron. 2016, 63, 7455–7466. [Google Scholar] [CrossRef]
  4. Fang, Y.; Zhang, T. Vibroacoustic characterization of a permanent magnet synchronous motor powertrain for electric vehicles. IEEE Trans. Energy Convers. 2017, 33, 272–280. [Google Scholar] [CrossRef]
  5. Lin, F.; Zuo, S.; Deng, W.; Wu, S. Noise prediction and sound quality analysis of variable-speed permanent magnet synchronous motor. IEEE Trans. Energy Convers. 2017, 32, 698–706. [Google Scholar] [CrossRef]
  6. Weilharter, B.; Biro, O.; Lang, H.; Ofner, G.; Rainer, S. Validation of a comprehensive analytic noise computation method for induction machines. IEEE Trans. Ind. Electron. 2011, 59, 2248–2257. [Google Scholar] [CrossRef]
  7. Jordan, H. Electric Motor Silencer: Formation and Elimination of the Noises in the Electric Motors; Siemens-Schuckertwerke: Berlin, Germany, 1950. [Google Scholar]
  8. Gieras, J.F.; Wang, C.; Lai, J.C. Noise of Polyphase Electric Motors; CRC Press: Boca Raton, FL, USA, 2018. [Google Scholar]
  9. Kim, Y.-S.; Yang, J.-W.; Kim, Y.-J.; Shin, K.-H.; Choi, J.-Y. Analytical and Experimental Approaches to Predicting Magnetic Field Asymmetry and Electromagnetic Forces in Slotted Surface-Mounted Permanent Magnet Machines with Rotor Eccentricity. IEEE Trans. Magn. 2025. [Google Scholar] [CrossRef]
  10. Maliti, K.C. Modeling and Analysis of Magnetic Noise in Squirre-Cage Induction Motors; Institutionen för Elkraftteknik: Stockholm, Sweden, 2000. [Google Scholar]
  11. Wang, Y.; Guo, H.; Yuan, T.; Ma, L.; Wang, C. Electromagnetic noise analysis and optimization for permanent magnet synchronous motor used on electric vehicles. Eng. Comput. 2021, 38, 699–719. [Google Scholar] [CrossRef]
  12. Devillers, E.; Hecquet, M.; Cimetiere, X.; Lecointe, J.-P.; Le Besnerais, J.; Lubin, T. Experimental benchmark for magnetic noise and vibrations analysis in electrical machines. In Proceedings of the 2018 XIII International Conference on Electrical Machines (ICEM), Alexandroupoli, Greece, 3–6 September 2018; pp. 745–751. [Google Scholar]
  13. Pile, R.; Le Besnerais, J. Comparison of main magnetic force computation methods for noise and vibration assessment in electrical machines. IEEE Trans. Magn. 2018, 54, 1–13. [Google Scholar] [CrossRef]
  14. Xing, Z.; Wang, X.; Zhao, W.; Sun, L.; Niu, N. Calculation method for natural frequencies of stator of permanent magnet synchronous motors based on three-dimensional elastic theory. IEEE Trans. Energy Convers. 2020, 36, 755–766. [Google Scholar] [CrossRef]
  15. Lan, H.; Zou, J.; Xu, Y.; Liu, M. Effect of local tangential force on vibration performance in fractional-slot concentrated winding permanent magnet synchronous machines. IEEE Trans. Energy Convers. 2018, 34, 1082–1093. [Google Scholar] [CrossRef]
  16. Kim, J.-H.; Park, S.-H.; Ryu, J.-Y.; Lim, M.-S. Comparative study of vibration on 10-pole 12-slot and 14-pole 12-slot PMSM considering tooth modulation effect. IEEE Trans. Ind. Electron. 2022, 70, 4007–4017. [Google Scholar] [CrossRef]
  17. Bösing, M. Acoustic Modeling of Electrical Drives: Noise and Vibration Synthesis Based on Force Response Superposition. Doctor Dissertation, Technische Hochschule Aachen, Aachen, Germany, 2013. [Google Scholar]
  18. Zhang, A.; Bai, Y.; Yang, B.; Li, H. Analysis of nonlinear vibration in permanent magnet synchronous motors under unbalanced magnetic pull. Appl. Sci. 2018, 8, 113. [Google Scholar] [CrossRef]
  19. Le Besnerais, J. Reduction of Magnetic Noise in PWM-Supplied Induction Machines-Low-Noise Design Rules and Multi-Objective Optimization; Ecole Centrale de Lille: Villeneuve-d’Ascq, France, 2008. [Google Scholar]
  20. Fang, H.; Li, D.; Qu, R.; Yan, P. Modulation effect of slotted structure on vibration response in electrical machines. IEEE Trans. Ind. Electron. 2018, 66, 2998–3007. [Google Scholar] [CrossRef]
  21. Shin, K.-H.; Cho, H.-W.; Choi, J.-Y. Experimental verification and analytical calculation of unbalanced magnetic force in permanent magnet machines. AIP Adv. 2017, 7, 056652. [Google Scholar] [CrossRef]
  22. Andreou, P.; Hajjaj, A.Z.; Mohammadpour, M.; Theodossiades, S. Analytical Multiphysics Methodology to Predict Vibroacoustics in PMSMs Combining Tangential Electromagnetic Excitation and Tooth Modulation Effects. IEEE Trans. Transp. Electrif. 2023, 10, 5997–6009. [Google Scholar] [CrossRef]
  23. Roivainen, J. Unit-Wave Response-Based Modeling of Electromechanical Noise and Vibration of Electrical Machines. Doctor Dissertation, Helsinki University of Technology, Espoo, Finland, 2009. [Google Scholar]
  24. Ballo, F.; Gobbi, M.; Mastinu, G.; Palazzetti, R. Noise and vibration of permanent magnet synchronous electric motors: A simplified analytical model. IEEE Trans. Transp. Electrif. 2022, 9, 2486–2496. [Google Scholar] [CrossRef]
Figure 1. FE analysis model of PMSM: (a) Model 1; (b) Model 2.
Electronics 14 02882 g001
Figure 2. Transformation of force density: (a) air gap force density; (b) equivalent concentrated force on stator tooth and yoke.
Electronics 14 02882 g002
Figure 3. Force density in air gap: (a) radial force density of Model 1; (b) tangential force density of Model 1; (c) radial force density of Model 2; (d) tangential force density of Model 2.
Electronics 14 02882 g003
Figure 4. FFT analysis results of air gap force density: (a) radial force density of Model 1; (b) tangential force density of Model 1; (c) radial force density of Model 2; (d) tangential force density of Model 2.
Electronics 14 02882 g004
Figure 5. Forces acting on the tooth: (a) radial force of Model 1; (b) tangential force of Model 1; (c) radial force of Model 2; (d) tangential force of Model 2.
Electronics 14 02882 g005
Figure 6. Deformation shape of structural modes by radial pressure.
Electronics 14 02882 g006
Figure 7. Spectrogram of vibration resonance at variable speed for analysis model.
Electronics 14 02882 g007
Figure 8. Radial deformation of SPMSM caused by structural vibration modes: (a) Model 1; (b) Model 2.
Electronics 14 02882 g008
Figure 9. Acoustic radiation waterfall plot of SPMSM: (a) Model 1; (b) Model 2.
Electronics 14 02882 g009
Figure 10. Acoustic radiation power level of SPMSM for Model 1 and Model 2.
Electronics 14 02882 g010
Table 1. Model parameters.
ParametersSymbolUnitModel 1Model 2
Pole numberP-8-
Slot numberQ-912
Pole embraceαp-0.9-
Stack lengthLstkmm30-
Rotor radiusRrmm38-
Radius at magnet surfaceRmmm43-
Opening slot radiusRsmm47-
Slot outer radiusRqmm6768
Radius at center of yokeRymm73.574
Radius at center of toothRtmm5757.5
Stator outer radiusRomm80-
Stator tooth thicknesshtoothmm2021
Stator yoke thicknesshyokemm1312
Slot angleδdeg.2015
Opening slot angleβdeg.54
Vacuum permeabilityμ0H/m4π·10−7-
Magnetic remanenceBrT1.28-
Turns--60-
Rated speed-rpm1400-
Table 2. Mechanical parameters.
ParametersSymbolUnitModel 1Model 2
Young’s modulus of coreEcoreGPa193-
Poisson’s ratio of core--0.29-
Core mass densityρcorekg/m38000-
Mass of stator yokeWyokekg1.441.34
Mass of stator toothWtoothkg0.86-
Stator yoke areaAyokemm260005580
Stator tooth areaAtoothmm24000-
Table 3. Comparison of the natural frequencies of Model 1.
Parameter2nd Mode3rd Mode4th Mode
Analytical996 Hz2657 Hz4983 Hz
FEM1036 Hz2716 Hz4575 Hz
Table 4. Comparison of the natural frequencies of Model 2.
Parameter2nd Mode3rd Mode4th Mode
Analytical669 Hz1784 Hz3346 Hz
FEM615 Hz1615 Hz2803 Hz
Disclaimer/Publisher’s Note: The statements, opinions and data contained in all publications are solely those of the individual author(s) and contributor(s) and not of MDPI and/or the editor(s). MDPI and/or the editor(s) disclaim responsibility for any injury to people or property resulting from any ideas, methods, instructions or products referred to in the content.

