1. Introduction
Skin cancer is one of the most prevalent forms of cancer worldwide, with millions of new cases reported annually [
1,
2,
3]. This high mortality rate demands early and accurate diagnosis to reduce mortality rates and improve treatment outcomes [
4,
5]. Traditionally, this type of diagnosis heavily relies on medical specialist, such as dermatologists in the case of skin cancer, which can be limited by factors such as geographical access, the availability of specialists, and the subjective nature of visual assessments [
6,
7]. In recent years, advancements in artificial intelligence (AI) and machine learning have shown promise in augmenting diagnostic capabilities, offering new avenues for early detection and personalized treatment strategies [
8,
9,
10,
11,
12,
13].
Skin cancer encompasses several subtypes, with melanoma being the most deadly form [
14]. According to the 2017 statistics by the World Health Organization (WHO), an estimated 2–3 million non-melanoma and 132,000 melanoma skin cancers occur globally each year [
15,
16], with updated statistics recording 331,722 new cases of skin cancer in 2022 alone [
17,
18]. Risk factors for skin cancer include excessive UV exposure, sunburn history, tanning bed use, and genetic [
19]. Melanoma, which is more common in white people, causes most skin cancer deaths. Existing diagnostics solutions typically operate on a uni-modality, employing text, tabular or image modality features to retrieve possible diagnostic results [
20,
21,
22,
23,
24]. Relying on single modality-based solutions leads to misleading suggestions; therefore, multimodality solutions are used to enhance the interpretability of results [
10,
25,
26,
27,
28].
The integration of multimodal data, such as dermoscopic images, patient demographics, and genomic information, has the potential to enhance the accuracy and robustness of skin cancer diagnoses [
29,
30,
31]. Multimodal solutions saw significant growth after OpenAI officially launched multimodal model ChatGPT-4.0 in March 2023 [
29,
32]. With the advent of multimodal advancements, deep learning models, particularly convolutional neural networks (CNNs), have shown remarkable performance in automated skin lesion classification tasks. However, training such models requires large amounts of labeled data, which is often distributed across multiple hospitals and medical institutions. Due to privacy concerns and regulatory restrictions, such as the General Data Protection Regulation (GDPR), sharing sensitive patient data among institutions is impractical [
33]. Federated learning (FL) offers a viable solution by enabling multiple institutions to collaboratively train a global model without sharing raw data [
34]. Initially proposed by [
34], FL has shown promising results across various applications, including healthcare [
29,
35,
36,
37,
38,
39]. Despite its potential, existing FL methods face significant challenges in skin cancer diagnosis:
Limited Exploration of Multimodal Learning: Most existing skin cancer diagnosis methods focus on uni-modal data (e.g., dermoscopic images). However, the availability of multimodal data, such as dermoscopic images and clinical metadata, varies across institutions. Some institutions may have access to both modalities, while others may have only images or only tabular data. This heterogeneity makes it difficult to develop models that generalize well across different institutions. Additionally, some modality samples may be missing in multimodal institutions. Above all, the heterogeneous modalities and missing modalities in federated settings degrade the diagnostic accuracy.
Absence of Personalized Federated Training Paradigms: State-of-the-art federated learning frameworks for skin cancer diagnosis adopt a rigid dichotomy, training either a one-size-fits-all global model (neglecting client-specific heterogeneity) or fully isolated local models (losing collaborative advantages). There is a critical lack of a method that harmonizes global knowledge with local adaptation, which would have potential for real-world model applications and deployment.
Severe Class Imbalance and Limited Positive Samples: Existing skin cancer diagnosis studies suffer from extremely skewed class distributions, where positive samples (e.g., malignant cases) are scarce and often limited to short-term datasets (e.g., one-year collections). This is the cause of the lack of real-world diversity and results in a poor generalization diagnosis model.
To address the challenges discussed, we propose the PMM-FL framework. The design enables effective knowledge-sharing across modalities and clients, addressing the challenge of data heterogeneity. This approach improves the accuracy and application of the model in real-world scenes. As far as we know, this is the first study to address personalized federated learning with heterogeneous modalities and a missing modality for skin cancer diagnosis. Finally, this study makes the following contributions:
Personalized Multimodal Federated Learning: We propose PMM-FL, an effective and robust framework that decouples multi-module aggregation from local deployment via global modular-separated aggregation and local client fine-tuning. This design enables efficient cross-client knowledge transfer while maintaining a personalized performance under heterogeneous and incomplete modality conditions. Unlike traditional FL, which synchronizes all parameters in each round (leading to communication bottlenecks for multimodal models), our method adopts a hierarchical aggregation strategy, synchronizing parameters based on their stability and functional roles.
Multitask Learning-Based Multimodal Fusion Approach: We propose a multitask strategy that jointly performs skin cancer diagnosis and missing modality prediction, enhancing feature robustness through cross-task learning and enabling reliable decisions to be made under incomplete data conditions.
Dataset Preparation: We prepared a custom dataset specifically tailored for our study, combining data from several years of the ISIC challenge dataset. This dataset addresses the challenges of data imbalance and an absence of modality, ensuring comprehensive coverage of various skin cancer types.
Numerical Evaluation: We conduct numerical evaluations demonstrating the effectiveness of our proposed method. The experiments show a significant improvement in model performance metrics compared to existing methods in the field.
The rest of paper is organized as follows:
Section 2 discusses related work, followed by
Section 3 formulates the problem definition, while
Section 4 explains the preparation of the dataset.
Section 5 details the methodological components. Then, in
Section 6, the implementation details are explained.
Section 7 presents the experimental work. Lastly,
Section 8 concludes the current study.
2. Related Work
Federated learning (FL) and multimodal federated learning (MMFL) have attracted significant attention in healthcare due to their adaptability and ability to address data privacy and heterogeneity challenges. In this section, we summarize the recent works focused on skin cancer diagnosis in medical imaging, dividing them into three sub-categories.
2.1. Advances in Skin Lesion Diagnosis
In recent years, we have witnessed significant progress in automating medical image tasks, including skin lesion analyses, using deep learning [
20,
40,
41,
42,
43]. Models such as ResNet, EfficientNet, and DenseNet, and combinations thereof, have been employed for tasks ranging from lesion segmentation to malignancy classification [
5,
42,
44,
45,
46]. Recent studies have explored the use of multimodal data (e.g., combining dermoscopic images with clinical metadata) to improve diagnostic accuracy. Despite their good performance, these models require large labeled datasets, which are often distributed across multiple institutions. Further, their reliance on centralized data collection often limits the applicability of these methods in real-world scenarios, where data is often distributed across multiple institutions.
2.2. Multimodal Federated Learning (MMFL)
In recent years, FL has become popular in healthcare due to its privacy-preserving properties. Uni-modal FL is the most frequently employed solution, while multimodal FL remains a challenge. MMFL is a technique where clients processes different data modalities across other clients to achieve improved diagnostic accuracy [
47,
48,
49]. Lucieri et al. [
48] introduced a multimodal explanation framework for computer-aided skin cancer diagnosis, providing interpretable predictions even in cases of incorrect diagnoses. Reference [
50] developed a collaborative FL framework for healthcare, focusing on privacy-preserving data-sharing across institutions. Further, the study [
51] proposed a personalized FL approach, adapting models to individual client data distributions to achieve a better performance in healthcare tasks. However, most existing approaches assume balanced and complete modalities across clients, which is unrealistic in practice [
29,
47,
50]. This problem was categorized into the missing modalities category.
Furthermore, recent studies have further advanced FL and MMFL across domains such as healthcare, such as some works that introduced a personalized FL approach, MRI synthesis, and MRI reconstruction, addressing the privacy and heterogeneity of the data [
52,
53,
54]. Additionally, [
55] proposed an effective skin cancer diagnosis framework using FL and Deep Convolutional Neural Networks (DCNN). Lastly,
Table 1 summarizes the recent work on MMFL in the literature. Although these studies collectively demonstrate the potential of FL and MMFL in addressing key challenges in healthcare, such as data privacy, heterogeneity, and personalization, they lack demonstrated effectiveness in the dermatology domain, specifically in skin lesion diagnosis. In this work, we fill this gap by introducing a novel framework that specifically focuses on federated learning with personalization, leveraging knowledge transfer.
2.3. Knowledge Transfer in FL
Knowledge transfer in federated learning focuses on enabling clients to share and leverage insights across different domains or modalities without compromising privacy. In the context of FL, knowledge transfer helps clients with missing modalities by leveraging information from clients with complete data. A recent work by Islam et al. [
44] used a knowledge distillation-based approach to propose a lightweight and high-performing skin cancer classifier. Further, study [
56] proposed a self-supervised diverse knowledge distillation method for lightweight skin lesion classification. A few more recent works, such as [
57,
58], reported the classification of skin lesions using the knowledge distillation technique, achieving effective results.
Recent advancements in cross-modal knowledge transfer have shown promising results; however, they lack personalization and cross-modality effectiveness, and also struggle with non-IID and missing modalities. This work builds on these concepts by introducing a two-stage knowledge transfer mechanism.
Table 1.
Summarizing the literature on MMFLs proposed in different healthcare applications. [FL type = personalized/centralized/N/A].
Table 1.
Summarizing the literature on MMFLs proposed in different healthcare applications. [FL type = personalized/centralized/N/A].
| Ref. & YoP | Short Summary | Task | Included Modalities | FL Type | Dataset |
|---|
| [47] 2021 | Multimodal melanoma
detection with federated
learning | Detection | Images and tabular | Centralized | ISIC 2018 |
| [59] 2021 | An adaptive federated machine learning-based intelligent system for skin disease detection | Detection | Images | Centralized | ISIC 2019 |
| [50]
2022 | The study proposed privacy-aware collaborative learning for skin cancer prediction. Further study transferred weights to a cloud-based server for training to enhance data privacy and security. | Prediction. | Images | Centralized | ISIC 2019 |
| [48] 2022 | The study presented a multimodal explanation framework for computer-aided skin cancer diagnosis. It shows explanations for
CAD-assisted scenarios even in the
case of incorrect disease
predictions. | Diagnosis and explanation | Image and text | N/A | SkinL2, Derm7, PH and ISIC 2018 |
| [45] 2023 | The paper presented an FL framework to train models using private patient data on local clients and aggregate models on a central server, facilitating joint model training across participants without data-sharing, thereby dismantling the problem of Data Silos and promoting AI collaboration. | Diagnosis | Image | Personalized | Skin Cancer MNIST: HAM10000 |
| [57] 2023 | The study introduced a new framework for classifying melanoma that is based on knowledge distillation and lightweight Deep-CNN. This framework was developed to address the issue of high inter-class similarity and low intra-class similarity. | Classification | Dermoscopy Images | N/A | ISIC 2020 |
| [31] 2023 | The study presented a review study on the need for a shift from uni-modal to multimodal federated learning | N/A | Discussed various modalities | N/A | Summarized various skin lesion datasets |
| [60] 2024 | The study presented a review study on federated learning-assisted deep learning methods for skin cancer detection | N/A | Discussed various modalities | N/A | Summarized various skin lesion datasets |
| [55] 2024 | This study proposed effective skin cancer diagnosis through federated learning and Deep Convolutional Neural Networks (DCNN). They employed three datasets of varying complexity and size to validate their method’s effectiveness. | Detection | Image | Centralized | ISIC 2018, PH2 and Curated dataset by merging of both |
| [61] 2025 | Reviews AI in healthcare, including disease detection and diagnosis. Mentions multimodal data, blockchain, and federated learning for skin cancer diagnosis. | Diagnosis | Discussed multimodal | Review | N/A |
| [62] 2025 | Proposes EffiCAT for skin disease classification using multi-dataset fusion and attention mechanism. | Classification | Custom dataset curated combining HAM10000 and PAD-UFES-20 | N/A | N/A |
| [63] 2025 | The study emphasizes the recent developments in AI in medical diagnostics, including dermatology and early skin cancer diagnosis. Further, the study mentions federated learning and multimodal techniques as a prospective work. | Diagnosis | Multimodal | N/A | Discussed various datasets |
| This work, 2025 | PMM-FL: A personalized multimodal FL framework with cross-modality knowledge transfer for skin cancer diagnosis | Skin lesion diagnosis | Image, Tabular, Fusion | Personalized | Privately curated from ISIC versions |
3. Problem Definition
We consider a PMM-FL setup, where there are M multimodal clients (each has two different data modalities: A represents the image modality and B represents the table modality, serving as its local data), N uni-modal clients (each has only one data modality, A) and R=unbalanced multimodal clients (each has two modalities but some B modality samples are missing).
Each multimodal client possesses a local dataset , where denotes the j-th aligned data pair of the -th multimodal client () and represents the corresponding label, and K denotes the total number of classes.
Similarly, each unimodal client possesses a local dataset , where represents the j-th data sample of the -th unimodal client (), and represents the corresponding label.
Each unbalanced multimodal client possesses a local dataset , where denotes the j-th aligned data pair of the -th unbalanced multimodal client () and represents the corresponding label, with K denoting the total number of classes. However, in the case of unbalanced multimodal clients, certain samples may have missing values in the B modality. This means that while most samples have both A and B modalities, some samples might only have the A modality available, making it necessary to handle these cases separately during data preprocessing and model training.
Our goal is to obtain an optimal personalized multimodal model
M for each client through collaborative training between clients. The overall objective is defined as follows:
where
represents the loss for multimodal clients.
represents the loss for unbalanced multimodal clients.
represents the loss for uni-modal clients.
represents a local dataset of the
m-th multimodal client.
represents a local dataset of the
r-th unbalanced multimodal client.
represents a local dataset of the
n-th uni-modal client.
4. Dataset Curation
The dataset used in this study was developed in accordance with guidelines of the ISIC 2024 challenge dataset [
64] (
https://www.kaggle.com/competitions/isic-2024-challenge/data, accessed on 1 March 2025). The study curated custom multimodal data by combining ISIC 2024 with previous years, mainly focusing on 2018, 2019, and 2020. The dataset emphasizes the importance of high-quality, annotated images for the training and validation of diagnostic models. ISIC 2024 contains a total 40,159 skin lesions. Among these, only 393 are malignant cases, while the rest are benign cases. For the current work, we included all 393 malignant lesions, and randomly selected 10,000 benign lesions to prepare a custom collection including data from challenges from previous years. This collection included a variety of Total Body Photography (TBP), focusing on distinguishing between cancerous and non-cancerous lesions. The prepared dataset aims to support advancements in automated diagnostic systems and contribute to improved clinical outcomes in dermatology.
The customized dataset comprises 15,670 lesion images, along with their tabular metadata, forming multimodal data. This includes 662 positive cases from 2018, 4522 positive cases from 2019, and 584 positive cases from 2020. The remaining 10,393, include10,000 benign and 393 malignant cases, contributing to the total of 15,670 images. All images were center-cropped and resized to 224 × 224 pixels to ensure consistency with the 2024 dataset. A custom dataset was prepared to balance the highly imbalanced nature of the provided dataset from 2024, which featured only 393 positive targets and over 400,000 negative targets, and reduce training bias. The sample of skin lesions is depicted in
Figure 1.
Data Processing
The multimodal system processes two primary data modalities: dermoscopic lesion images in JPEG format and structured clinical/demographic metadata in CSV format. The target variable represents a binary classification task, distinguishing malignant from benign lesions.
For tabular data processing, we first performed rigorous column alignment and cleaning by removing non-predictive identifiers (ISIC-ID, PATIENT-ID) and ensuring consistency between training and test datasets. This involved dropping clinically irrelevant features. We then engineered 22 clinically relevant/meaningful features spanning several categories: (1) morphological characteristics, including lesion size ratio and border complexity; (2) color-based metrics like hue_contrast and lesion color differences; (3) spatial properties such as 3D position distance; and (4) composite indices, including lesion severity index.
Image processing employed distinct pipelines for training versus validation and test data. The training augmentation strategy included random resized crops, horizontal vertical flips, and color jitters. This was followed by normalization using ImageNet statistics. For validation and testing, we used only central cropping after resizing to to ensure the evaluation included consistent, non-augmented images. This balanced approach ensured model generalizability while maintaining reliable assessment conditions.
The preprocessing pipeline was carefully designed to maintain data integrity across modalities while addressing real-world challenges like missing values and shifts in the dataset. Feature engineering incorporated domain knowledge about the dermatological lesion assessment, with the derived features capturing clinically relevant patterns that complement visual information from images. The combination of rigorous tabular processing and comprehensive image augmentation created a robust foundation for our proposed multimodal skin cancer diagnosis framework.
5. Methodology
This section presents an overview of our proposed framework, followed by detailed implementations of its core components.
5.1. Framework Overview
Personalized Multi-Modal Federated Learning (PMM-FL) is a novel framework that enables efficient and robust federated learning across heterogeneous medical data modalities while preserving patient privacy. The framework was set up as shown in
Figure 2. The key processes of our framework are described as follows:
- ①
Local Training: After server initialization, clients train models locally on their private data without sharing raw data. Single-modality clients train local image diagnosis models, while multimodality clients train multi-fusion models with missing modality predictions (illustrated in
Figure 2b).
- ②
Global Aggregation: During each global aggregation round, clients upload local model parameters to the server. Inspired by previous studies [
65], we designed a hierarchical aggregation strategy in the central server, where the parameters of each component—including single/multimodality encoders, missing-modality predictors, and skin cancer classifiers—are updated independently (illustrated in
Figure 2a). This approach offers three advantages: (1) By aggregating knowledge from diverse clients, the model reduces the risk of overfitting to individual clients or particular client distributions. (2) It supports its flexible deployment by institutions with heterogeneous modalities. For example, clients with only image data can download just the image encoder and classifier. (3) Independent parameter-sharing ensures that each task aggregates updates separately during global rounds, each with their own frequency, which can be designed to optimize the communication overhead.
- ③
Local Fine-Tuning: Finally, local institutions download specific module parameters for fine-tuning to adapt to local conditions. This process forms a continuous cycle, balancing global consistency and local adaptability. During client-side fine-tuning, the global backbone remains frozen while the task heads adapt to local data distributions and dynamically handle modality absence. The personalized model is retained locally for inference, ensuring both global consistency and local adaptability, with minimal data exposure (illustrated in
Figure 2b).
Building upon our framework, each hospital institution in the federated network can efficiently implement robust federated learning while reserving local data privacy. To address the challenges of the distributed and heterogeneous modality data, our framework integrates three core techniques: multi-task learning for multimodal fusion, missing modality prediction, and the hierarchical aggregation strategy. These techniques collectively enable adaptive learning in heterogeneous federated networks. The following sections detail their technical implementations.
5.2. Multitask Learning for Multimodal Fusion
We propose a novel multitask learning strategy that enables the robust integration of heterogeneous by jointly optimizing (1) the primary task—skin cancer classification with high diagnostic accuracy; (2) the auxiliary task—missing modality prediction to enhance feature robustness. As illustrated in
Figure 3, our approach dynamically leverages cross-modal correlations during training.
5.2.1. Uni-Modal Feature Encoders
We introduce a different model for the modality according to the specific modality’s characteristics. We realize feature extraction separately using the uni-modal feature encoders.
Image Modality Encoder: , where
H,
W, and
C represent the height, width, and number of channels of the image. This input modality captures visual information that can be crucial for diagnosing skin conditions. We use a pre-trained CNN model to extract features from images:
Tabular Modality Encoder: , representing clinical features associated with the patient (e.g., age, gender, medical history). Here,
is the dimensionality of the tabular data, which provides complementary information to the visual data. A fully connected network processes the tabular metadata:
The tabular data are projected in a same space as the image modality feature space.
5.2.2. Feature Fusion with Multi-Head Attention
To combine the features from different modalities, we first use an early concatenation fusion strategy. This approach merges the image and tabular embeddings along the feature dimension to form a unified representation:
After aligning and concatenating the features from both modalities, we apply a multi-head attention mechanism to further process these fused features. This step aims to capture the complex interactions between different parts of the features:
Here,
denotes the multi-head attention module, and
represents its set of parameters. Each attention head
is defined by
where
, and
are projection matrices for the
i-th head, with
being the dimensionality of each head. The multi-head attention output is as follows:
where
H is the number of heads and
is the output projection matrix.
This mechanism allows the model to focus on relevant parts of the multimodal features, improving the quality of the extracted representations.
5.2.3. Multitask Learning
Multi-task learning aims to improve model generalization and representation learning by jointly optimizing multiple related tasks. The primary objective is to leverage shared representations between tasks to enhance performance on each individual task, especially when some tasks have limited data.
In our design, multitask learning enables the model to simultaneously learn discriminative features for skin cancer diagnosis and missing modality predictions, leading to more robust and reliable decision-making. We optimize both the primary classification task and the auxiliary prediction task simultaneously.
Specifically, in the main task, the classification loss
is computed using the cross-entropy loss between the predicted class probabilities and the true labels, defined as follows:
where
N is the number of training samples,
is the true binary label (e.g., melanoma or benign),
is the predicted probability that sample
i belongs to the positive class,
denotes the sigmoid function,
is the fused feature vector for the
i-th sample,
and
b are the learnable parameters of the classifier.
An auxiliary branch learns to predict missing tabular features based on available image inputs. The modality prediction loss (
) is defined as the mean squared error (MSE) between the predicted and actual tabular features:
where
n is the number of samples,
and
are the predicted and actual table data for the
ith sample, respectively.
The overall loss function combines both tasks, balanced by hyperparameter
:
5.3. Missing Modality Prediction
Modality prediction is a crucial component in multi-task learning frameworks, in which the other modality is predicted using the modality we have. In our study setting, this mainly refers to predicting the table modality (the clinic’s information regarding the patient) with the image modality we have. We present the implementation details as follows:
5.3.1. Inputs
Dermoscopic image , where H, W, and C represent the height, width, and number of channels of the image.
5.3.2. Image Feature Extraction
Let , where is the extracted image feature representation, and denotes the image encoder function.
5.3.3. Table Feature Prediction
Given the image features
, the goal of the modality prediction branch is to generate approximate table features
, where
and
is the dimensionality of the tabular data (e.g., 68 dimensions). The loss for the modality prediction task can be defined as the mean squared error (MSE) of the predicted values and the actual tabular data:
where
n is the number of samples, and
and
are the predicted and actual table data for the
ith sample, respectively.
Missing modality prediction realizes knowledge transfer from image modality to table modality, which enhances the model’s adaption and its robustness to the unbalanced multimodal and uni-modality clients. The method can not only impute the missing table data for skin cancer diagnoses, but can also help the model to understand the relation between the image modality and table modality, and improve the accuracy of skin cancer diagnosis.
5.4. Federated Learning with Hierarchical Aggregation
We describe the detailed process of model training and inference, including local training, global aggregation, and client-personalized fine-tuning steps. The entire framework aims to support data collaboration across multiple institutions through federated learning mechanisms while ensuring data privacy protection and allowing for individual model adaptation.
5.4.1. Local Training
Each client trains the model locally using their own dataset. The objective is to minimize the local loss function:
is a hyperparameter balancing classification loss and missing modality prediction loss. A larger emphasizes enhancing robustness to modality absence via auxiliary tasks, while a smaller prioritizes optimizing core classification performance; proper tuning balances both to improve overall model adaptability.
5.4.2. Hierarchical Aggregation
FedProx is employed to aggregate global model updates, introducing a proximal term to mitigate heterogeneity in local training and ensure consistency across distributed clients. This approach aligns with the system’s design of separating backbone parameter aggregation from task head personalization, balancing global generalization and local adaptation. The optimization objective integrates the client-specific local loss:
where
K is the number of clients,
is the number of samples on client
k,
n is the total number of samples,
is the client-specific local loss function defined in Equation (11),
is a regularization parameter, and
is the current global model parameters.
Our framework employs a stratified parameter synchronization approach that intelligently segments model parameters based on their functional roles and stability characteristics. The core architecture divides parameters into two distinct tiers, each with specialized synchronization mechanisms:
1. Foundation Layers (Visual Backbone + Tabular Encoder): These fundamental feature extractors process raw input data into meaningful representations. The visual backbone (CNN) extracts spatial features from medical images, while the tabular encoder transforms structured clinical data into dense embeddings. These components are aggregated every two rounds using data-volume weighted averaging:
This frequent synchronization ensures consistent feature extraction across all institutions. Clients with larger datasets contribute proportionally more to the shared foundation model, creating a robust base that captures diverse data characteristics while maintaining visual–semantic coherence. The two-round interval balances stability with adaptability, allowing for the timely incorporation of new patterns without excessive communication overhead.
2. Decision Layers (Modality Predictor + Fusion + Attention + Classifier): These higher-level components integrate multimodal information for diagnostic decision-making. The modality predictor estimates missing tabular data from visual features, the fusion module combines visual and tabular embeddings, the attention mechanism weights important features, and the classifier makes final predictions. These specialized components are synchronized every five rounds using client-balanced averaging:
This less frequent synchronization preserves institutional specialization while periodically harmonizing global knowledge. The modality predictor learns to handle institution-specific missing data patterns, the attention mechanism adapts to local feature importance, and the classifier develops specialized diagnostic expertise. The five-round interval provides sufficient time for these specialized capabilities to develop before incorporating global insights.
5.4.3. Client Specific Fine-Tuning
We implemented a selective parameter optimization strategy: (1) global backbone parameters remain frozen to maintain shared feature representations; (2) task-specific classification heads are fine-tuned using localized learning rates to adapt to institutional data distributions. The optimization objective formalizes this process as follows:
where
represents all frozen parameters from the global model (Equation (
12)), including backbone, fusion layers, and modality predictors, while
denotes the client-specific classification head parameters being optimized. This formulation maintains the core
loss from Equation (11) while constraining updates exclusively to the classification layer, preserving shared knowledge while enabling personalized adaptation.
5.4.4. Federated Learning Algorithm
The high-level algorithm is further presented in Algorithm 1, which details the steps involved in the proposed framework.
Overall, the methodology focuses on addressing the unique challenges posed by real-world FL scenarios, including heterogeneous modality, incomplete modality, and collaborative learning across clients.
| Algorithm 1 Federated learning with hierarchical aggregation |
- 1:
Input: Client datasets , Tabular availability Global model , Local epochs E, FedProx parameter Aggregation frequencies - 2:
for communication round to T do - 3:
for each client to N in parallel do - 4:
Step 1: Model Initialization Initialize shared parameters: Load client-specific predictor: Freeze foundation layers: - 5:
Step 2: Adaptive Tabular Processing - 6:
for local epoch to E do - 7:
for batch do Extract image features: Predict missing tabular: Select appropriate features: Encode tabular features: Fuse multimodal features: Predict class: Compute classification loss: Compute tabular reconstruction loss: Combine losses: Add FedProx regularization: Update parameters: - 8:
end for - 9:
end for - 10:
Step 3: Parameter Extraction Extract foundation parameters: Extract decision parameters: Send parameters to server: - 11:
end for - 12:
Step 4: Hierarchical Aggregation - 13:
if then Aggregate foundation layer: - 14:
end if - 15:
if then Group clients by availability: Aggregate within groups: Fuse group models: - 16:
end if Update global model: - 17:
end for - 18:
Output: Global model , Personalized predictors
|
6. Implementation Details
In this section, we present the experimental setting and provide a description of the baseline methods.
6.1. System Information
The hardware and software configurations for our experiments are detailed as follows: we utilize an Intel(R) Xeon(R) CPU E5-2678 v3 at 2.50 GHz for processing, paired with an NVIDIA GeForce RTX 2080 Ti GPU for computational acceleration. Our algorithms are implemented using Python 3.9.18, and we rely on PyTorch 2.4.1 as our deep learning framework.
6.2. Experimental Setting
To comprehensively evaluate the effectiveness of the proposed framework, we designed several experimental parameters, such as dataset splits, feature extractors, and variation in the number of clients and conducted a variety of experiments. These experiments aimed to explore the nuances of our framework under different configurations. Key experimental parameters, such as learning rate, and the batch size and number of clients, are summarized in
Table 2. In summary, the subsequent experimental results are based on combinations of specific data splits and feature extractors and the federated model aggregator.
6.3. Backbone Models
In this study, to conduct various experiments, we used two variants of ResNet architecture as backbone models, utilizing pre-trained weights to facilitate feature extractions. The ResNet was chosen due to its efficiency and effectiveness in image classification. Specifically, we utilized ResNet18 and ResNet50, which were both initialized with pre-trained weights. Later, a feature extraction layer was adopted to output an embedding that is suitable for downstream tasks.
The ResNet architecture was chosen as the backbone due to its proven effectiveness in image classification tasks. ResNet utilizes residual connections to facilitate the training of deeper networks to achieve accurate results. Pre-trained weights from ImageNet were used to initialize the model, before being fine-tuned for downstream tasks that enhance convergence speed and accuracy. Additional layers were added to process the tabular metadata, to support missing modality predictions based on one available modality. This included linear layers that transform the features into a format suitable for concatenation with image features. These custom layers ensure that both modalities are appropriately represented and combined for robust and accurate results.
6.4. Evaluation Metrics
The aggregated global model was evaluated using a validation dataset from each institute. Key performance metrics such as accuracy, precision, recall, and F1-score, and Area Under the Curve (AUC), were computed to assess the model’s efficacy. A comprehensive analysis was conducted to identify potential biases in performance across different experimental settings, ensuring robustness and generalizability.
Performance measures are quantified through the following method:
Statistical significance of resultant metrics: Statistical significance was tested via Wilcoxon signed-rank test across five runs and the presented experiments were conducted according to the received factual data, not the incidental results, such that every experimental result’s
p-value remained under the following bound:
7. Experiments and Discussion
In this section, we systematically investigate the overall effectiveness of the proposed federated multimodal learning framework under various configurations. We first conduct extensive evaluations focusing on the impact of different imputation strategies, loss function combinations, and parameter configurations for the primary classification task (skin cancer diagnosis) and the auxiliary task (missing modality prediction). Next, image-only and multimodal performances are compared. Further, we conduct an ablation study to validate the impact of the federated aggregator and the model architecture design choice. Lastly, we provide an in-depth investigation of the missing modality handling techniques.
7.1. Effectiveness
This section represents the effectiveness of our method, derived both from the accuracy analysis and the aggregation overhead analysis.
7.1.1. Accuracy Analysis
To validate the effectiveness of our method and investigate the impact of loss function selection and parameter configuration on model performance, we conducted experiments using different loss metrics to evaluate the model. The results are shown in the
Table 3 below.
Since we adopted a multi-task learning approach for local training—jointly optimizing the primary task (skin cancer diagnosis) and an auxiliary task (missing modality prediction)—we tested various combinations of loss functions with different weight settings for model training. The federated learning setup consists of two clients with only image modalities and three clients with table modalities missing to varying degrees (10%, 20%, and 30%). As an alternative prediction metric, we employed cosine similarity, a classical vector similarity measure that is more suitable for assessing the angular closeness between vector representations. Furthermore, we explored a composite loss function that combines MSE with cosine similarity to balance the strengths of both metrics. The experimental results show the following:
First, compared to when using the Cls method alone, adding MSE or cosine similarity significantly improves performance on global tasks. For example, in the “Missing 30%” task, the accuracy of the Cls method is 91.19%. When MSE is added (with ), the accuracy increases to 94.10%. When cosine similarity is added (with ), accuracy increases to 93.27%. With the composite loss function (MSE+COS, , ), accuracy reaches 92.99%. Overall, all three methods enhance model performance to varying degrees, with MSE yielding the most significant gains.
More specifically, from the perspective of average performance across all metrics, the Cls+MSE strategy outperforms other loss combinations, achieving optimal or near-optimal results in multiple key indicators. This suggests that simply incorporating MSE is sufficient to effectively improve model performance across most task scenarios, without the need to introduce more complex loss compositions.
Building on this, we further compared different parameter settings and found that MSE performs best when . Under this setting, the “Missing 30%” global task achieved an accuracy of 94.10%, the highest among all methods. Accuracy on Client 1 and Client 2 reached 91.82% and 90.94%, respectively, with corresponding recall scores of 0.8972 and 0.8205, both outperforming other parameter combinations. On Client 4, which has the most severe missing modality, the recall reached 0.8772—the best performance for that client as well. This indicates that MSE is not only effective under severely missing modalities but also consistently performs well in partially missing scenarios.
The results show the effectiveness of our method in heterogeneous and incomplete modality conditions. Our model achieved 92.32% accuracy even with 30% of the table modality missing, which is significantly higher than the original unoptimized model and only 2% lower than the centralized method.
7.1.2. Aggregation Overhead Analysis
Traditional federated learning approaches synchronize all model parameters during each communication round, creating significant communication bottlenecks for multimodal models. This “all-in-every-round” strategy becomes prohibitively expensive as model complexity increases, especially when dealing with multimodal architectures that incorporate both visual and tabular data processing. To overcome these limitations, we introduced a hierarchical aggregation strategy that synchronizes parameters at varying frequencies based on their functional roles and stability characteristics. As shown in
Table 4, our approach significantly reduces communication overhead.
This stratified synchronization strategy achieves significant communication efficiency improvements compared to naive multimodal aggregation, reducing total transmission volume by 32.9% (from 4.90 GB to 3.28 GB) while specifically cutting upload volume by 65.6% (from 2.45 GB to 0.84 GB). The approach eliminates 6.97 million parameter transmissions over 10 rounds through three key mechanisms:
Asymmetric transmission: Only partial parameters are uploaded (48.8 MB download vs. 23.6–25.2 MB upload per client)
Stratified frequencies: Foundation layers upload 5× (vs. 10×); decision layers upload 2× (vs. 10×)
Parameter reduction: Eliminates 139,332 parameters per client from transmission
These optimizations demonstrate superior scalability, with communication savings growing proportionally to both client count and training duration. For 100 clients and 100 rounds, this strategy would reduce parameter transmissions by over 65 billion.
7.2. Performance Comparisons
Table 5 and
Table 6 presents an overview of the performance metrics for a multimodal federated learning framework utilizing two different feature extractors (ResNet18 and ResNet50) across various federated clients (3, 5, and 10).
Table 5 records the results for image-only model comparison, where we only include image modality, while
Table 6 presents the results obtained with multimodality, combining image and tabular modalities. These tabular analyses provide a comprehensive evaluation of the performance of different feature extraction models, with different data splits, across various federated client configurations in a multimodal federated learning framework setting. The metrics, including AUROC, AUPRC, balanced accuracy, precision, and recall, are recorded for each configuration to assess the models’ ability to correctly classify skin cancer cases.
7.2.1. Image Only
In the image-only modality model, we employed ResNet18 and ResNet50, both initialized with pre-trained weights. Late, a feature extraction layer was adopted to output an embedding suitable for downstream tasks. The image-only modality experiments are detailed in
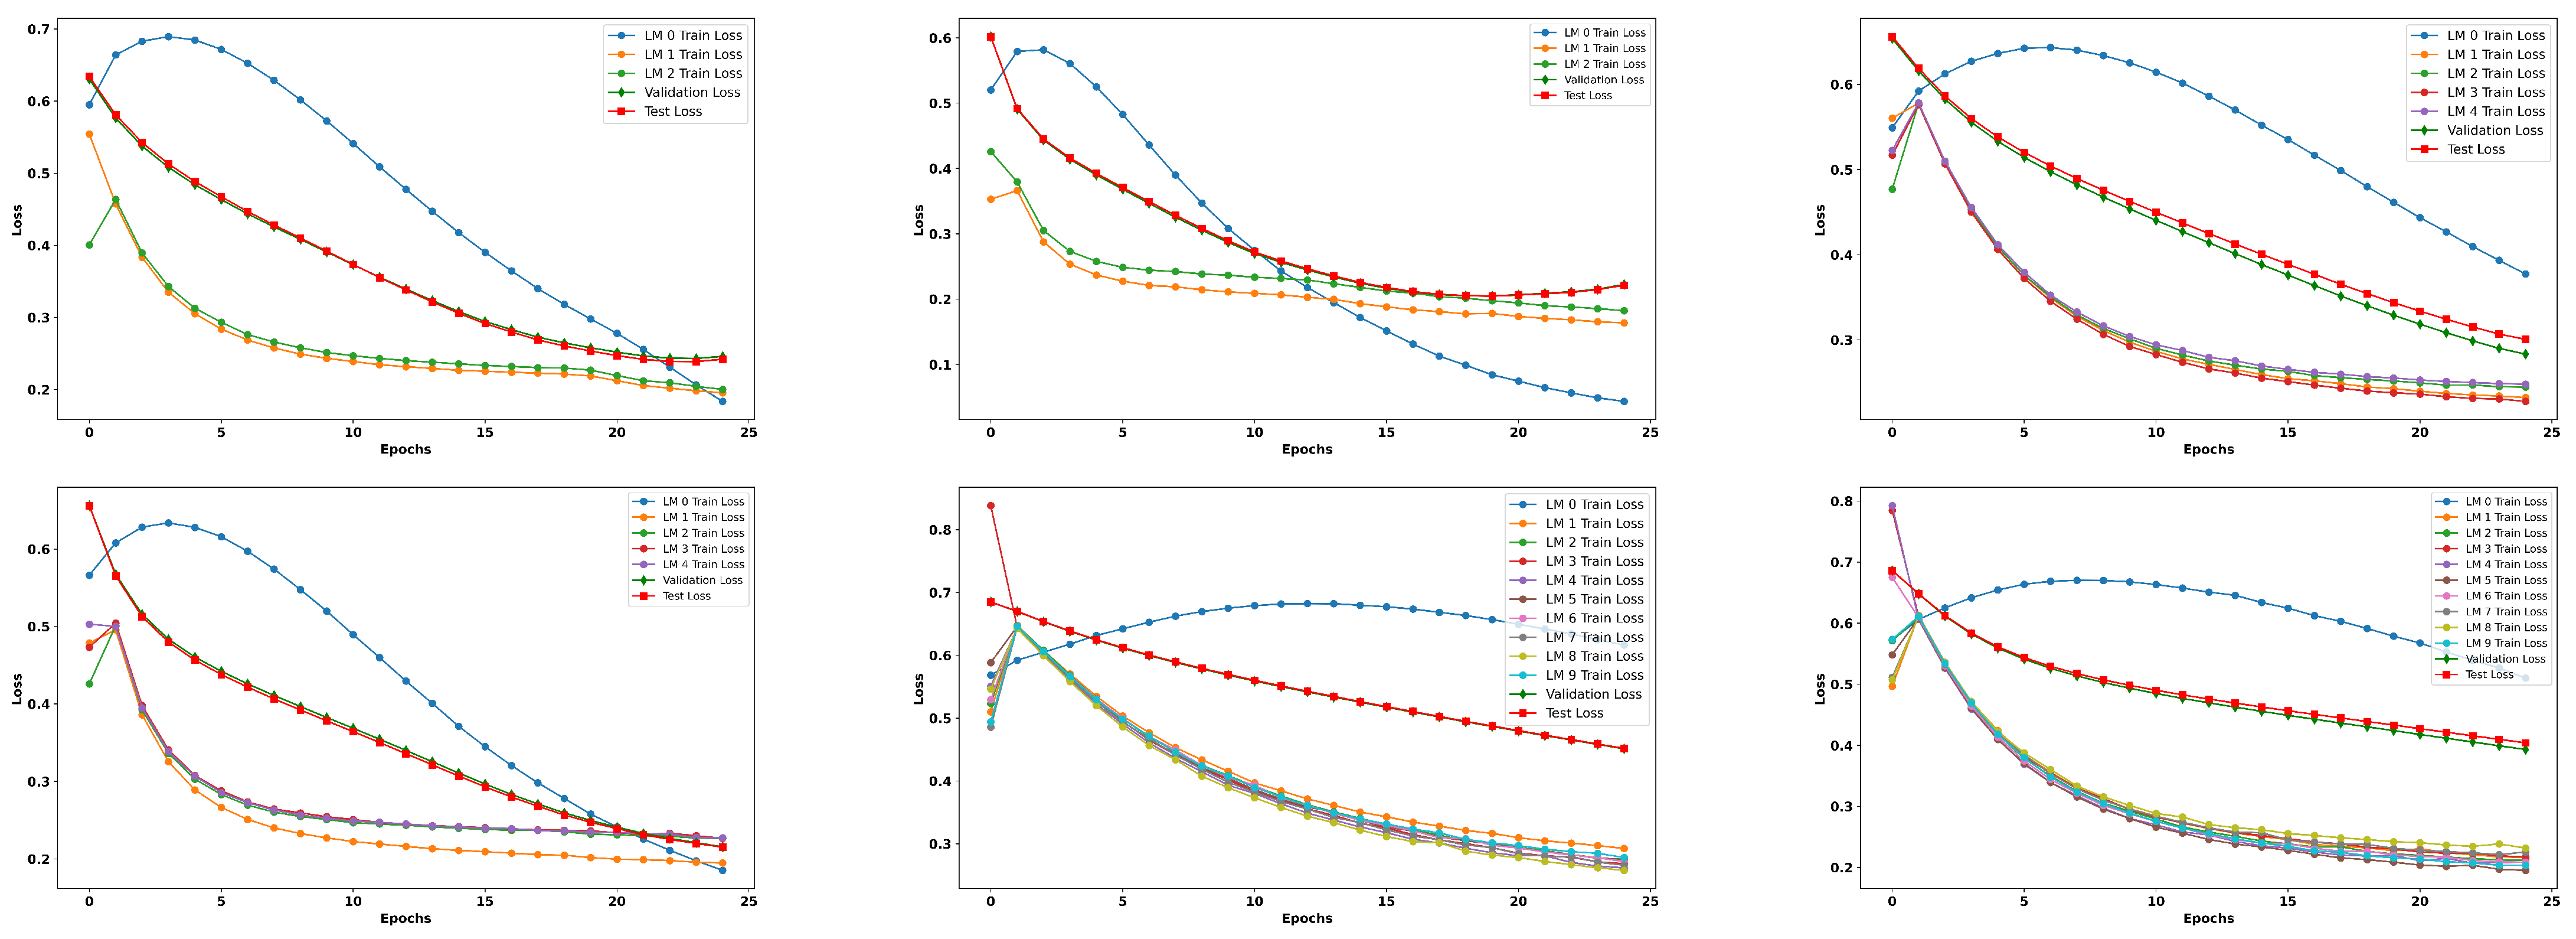
Table 5. As is evident from the results, the image-only model yielded improved results, showcasing the consistent performance and effectiveness of the proposed framework when utilizing imaging as the sole modality. Along with a detailed tabular analysis, we also recorded the training loss curves over the different federated clients, followed by validation loss curves; finally, the plot also presents the loss curves for the test set, as depicted in
Figure A1 and
Figure A2.
The achieved results align with our expectations, demonstrating that the image-only modality exhibits strong predictive capabilities. However, it is important to note that while the single modality performs well, it may have inherent limitations. This is where the potential of the multimodal approach becomes particularly significant. By integrating multiple modalities such as clinical meta data and imaging, we can capture a more comprehensive view of a patient’s condition, ultimately enhancing predictive accuracy and robustness. The synergy between the different data types and multimodal framework can mitigate the shortcomings of single modalities, leading to improved outcomes in skin cancer diagnosis. This reinforces the value of adopting a multimodal strategy to leverage the strengths of each modularity for a better predictive performance. In the subsequent subsection, our analysis shifts to the multimodal data.
7.2.2. Multimodal (Image and Tabular)
Comparatively, in the multimodal modality experiments presented in
Table 6, we observed that the recall values remained consistently high across all configurations, with nearly perfect sensitivity in identifying positive cases (cancerous lesions). However, the precision values are relatively lower, ranging from (0.3604 to 0.8471), indicating a higher false positive rate. This disparity between precision and recall suggests that while the models are adept at detecting cancerous samples, they struggle with false positives, which may affect the overall trustworthiness of the predictions in clinical settings. The balanced accuracy values range from (0.5000 to 0.9176), further highlighting this challenge and suggesting that the models may be oversensitive to the positive class while underperforming in correctly identifying negative (benign) samples.
Furthermore,
Table 7 summarizes the performance comparison across client pairs, and the different federated aggregator reveals interesting results. For instance, the ResNet18 configuration involving five clients paired with three multimodality clients achieved the highest AUROC of 0.9622 and an AUPRC of 0.9545, indicating strong discriminative power and a good balance between precision and recall. In contrast, for the ResNet50 configuration, involving 10 clients paired with 3 as multimodal clients, an AUROC of 0.9064 was achieved, with an AUPRC of 0.8471. These results suggest that the choice of client pairing (divided based on the multimodality approach, using some with the image modality only and others with multimodal data) and the number of modalities significantly impact the model’s performance, with larger client groups contributing to better overall outcomes. Upon careful examination, we found a reduced performance when using FedAvg as a federated model aggregator; consequently, we employed and validated some experiments with the FedProx aggregator, in combination with personalized federated learning, to enhance the results in the presence of heterogeneous data, as discussed in the subsequent
Section 7.3.
Additionally, we observed in
Table 7 that several configurations experienced higher recall with relatively lower precision. This behavior reflects our design bias toward minimizing false negatives, a desirable trait for early cancer detection tasks. The models are conservative in predicting benign classes, ensuring the most malignant lesions are detected, even at the cost of a higher false negative rate. In future work, we aim to explore adaptive loss weighting or precision–recall balancing techniques to mitigate this effect. Addressing this trade-off, particularly under class imbalances with non-IID federated settings, can further enhance the clinical applicability of the proposed framework by improving both its sensitivity and specificity without compromising patient safety.
Figure A3 and
Figure A4 illustrate the training, validation, and test loss trends for different configurations corresponding to
Table 6. A clear distinction can be observed in the loss curves of ResNet18 and ResNet50. While both models show a decreasing trend in training loss, indicating effective learning, the validation and test loss curves reveal potential overfitting in certain configurations, particularly in ResNet18. Notably, the configuration involving five clients per modality for ResNet18 exhibits fluctuations in the test loss curve, hinting at insufficient generalization despite the strong training performance. In contrast, ResNet50 shows more stable loss curves, especially in configurations with a larger number of clients, such as 10 clients paired with five modalities, suggesting better generalization due to the increased data diversity and model capacity.
The analysis of different client and modality configurations underscores several key findings. Firstly, while all models exhibited high recall, the relatively low precision and balanced accuracy values indicate a need for improved false positive control. Secondly, increasing the number of clients generally leads to improved performance and stability, as evidenced by the lower losses and higher AUROC/AUPRC scores in configurations with 10 clients. Finally, ResNet50 tends to outperform ResNet18 in configurations involving more clients and modalities, suggesting that deeper models benefit more from the diversity and quantity of data in federated learning setups.
Overall, the results highlight the critical role of client pairing, modality diversity, and model depth in developing a robust and efficient federated learning framework for skin cancer diagnosis.
7.2.3. Multimodal Input Strategies Comparison
This section summarizes the comprehensive work that was conducted, presenting a comparative analysis of the experimentation utilizing three distinct multimodal input strategies—image only, tabular only, and a centralized approach without knowledge transfer (No KT)—culminating in the proposed approach. The
Table 8 compares the accuracy, area under the curve, F1-score, and average training time.
The image-only modality recorded an accuracy of 92.12% with an AUC of 96.52% and an F1-score of 95.54%, and with an average training time per epoch of 39 s. When predicting a positive case, the image-only modality is approximately 92% accurate. However, its 82% recall shows it misses some actual positive cases. This is a critical limitation in medical diagnostics, where early detection is crucial.
In contrast, the tabular-only modality’s results are compromised compared to the image-only approach. It achieves an accuracy of 87% and an AUC of 92%, indicating a balanced but less effective performance in identifying skin cancer cases, with fewer false positives. However, its faster average training time per epoch of 28 s makes it appropriate for scenarios requiring rapid decision-making.
Comparatively, the no-knowledge-transfer centralized model outperforms both the image-only and tabular-only approaches, achieving an accuracy of 88.28% and an AUC of 91.26%. While this approach demonstrates effectiveness, the absence of knowledge transfer limits its potential for further improvements.
Finally, the proposed framework, PMM-FL (personalized federated learning with knowledge transfer), surpasses all baselines, recording the highest accuracy of 98.34%, with an F1-score of 97.65% and an AUC of 98.67%. These results highlight the framework’s strong ability to classify cases accurately and make confident positive predictions. The improved AUC demonstrates a significant enhancement in identifying true positive cases, which is crucial for early skin cancer diagnosis. However, the framework’s average training time of 43 s per epoch is the longest among the compared methods, which may lead to challenges in fast-paced clinical settings. This trade-off between diagnostic performance and processing time is a critical consideration for clinical implementation.
The table shows that PMM-FL improves diagnostic accuracy and precision by increasing knowledge transfer. The longer inference time may be a negative factor, but the improvements make it a good choice for applications requiring high accuracy. Future work may optimize the average training time and also improve its performance, making the model more suitable for real-time clinical settings.
In addition to tabular analysis, we present the bar chart shown in
Figure 4, illustrating the key performance metrics and comparing them to various baseline approaches, including image only, tabular only, centralized (no KT), and our proposed method PMM-FL.
7.3. Ablation
In this section, we discuss the impact of various components employed in our proposed framework. Each component is analyzed individually to understand its contribution to the overall system performance.
7.3.1. Federated Aggregator
In order to assess the impact of the federated aggregator, we conducted an ablation study with two aggregators (FedAvg and FedProx) for a better comparison of our proposed framework, as illustrated in
Table 7.
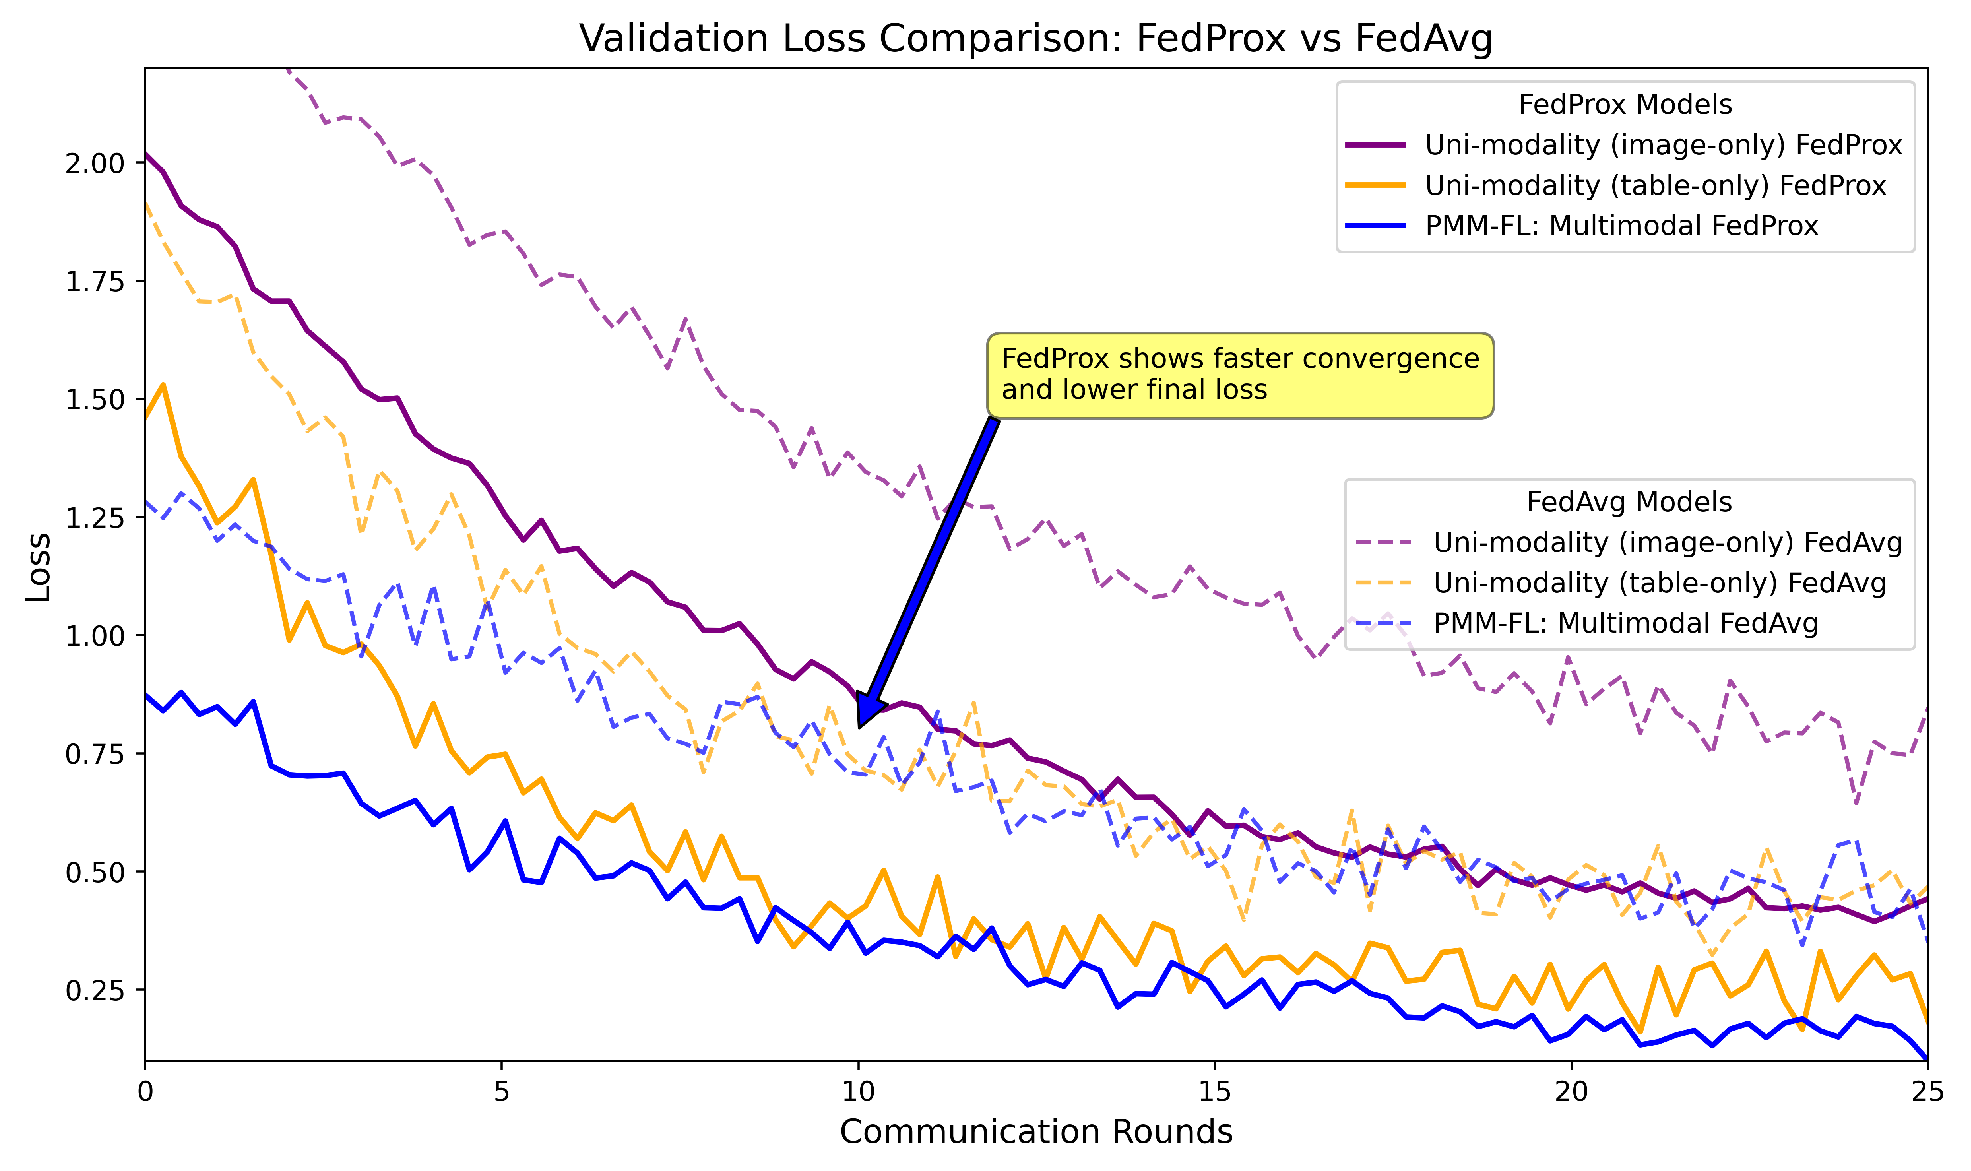
The analysis presented in
Figure 5 focuses on validation loss curves for the federated models when applied to skin cancer diagnosis, integrating both image and tabular data while ensuring privacy. The results aggregate findings from separate experiments. The image-only model (as detailed in
Section 7.2.1) and tabular models utilized 68 clinical metadata. The comparison of the federated aggregators, FedAvg and FedProx, reveals that the multimodal approach significantly outperforms uni-modal baselines, highlighting the benefits of complementary feature learning. Notably, FedProx achieves lower validation loss and faster convergence than FedAvg, underscoring the effectiveness of our personalized multimodal federated learning approach for enhancing diagnostic accuracy in real-world applications. Employing FedProx yielded excellent results, with a recorded accuracy of 98.34%, a balanced accuracy of 95.61%, and an F1-score of 97.65%, demonstrating significant improvements compared to the other state-of-the-art results, as well as the baseline models.
7.3.2. Model Architecture’s Impact
Above, we compare the results regarding the clients, data split, and feature extractors under varied experimental settings.Here, we discuss the impact of changing the model architecture and keeping all remaining factors consistent, comparing a few selected results for better understanding. The comparative analysis of feature extractors (FE) in combination with the proposed framework reveals significant variations in both performance and resource consumption. Swin and DeiT emerge as top performers, achieving higher and more balanced accuracy, as well as a higher F1-score, compared to the DenseNet in MobileNet. For instance, DeiT attained an accuracy of 0.65% for the client pair of (2, 3), while that of DenseNet reached 0.48%. However, this superior performance comes at a cost, as both have the highest parameter counts, at 85 M and 86 M, respectively, and memory footprints of above 300 megabites (MBs). In contrast, MobileNetV3 strikes a balance between performance and efficiency, offering competitive metrics. Our fine-tuned feature extractor within PMM-FL outperformed all the other tested options with 98.34% accuracy, along with an impressive AUC of 98.67% and an F1-score recorded at 97.65%. These comparative metrics are summarized in
Table 9, and respective model size comparisons are recorded in
Table 10.
7.3.3. Handling Missing Modality
In this section, we present a tabular result analysis of various ways to handle missing modality, as discussed in the methodology, particularly in
Section 5.3. It is essential to evaluate the multimodal system. As it relies on both image and tabular data, understanding how effectively it manages missing information is crucial for maintaining model performance. We evaluate four missing-data strategies on a multimodal framework (image + tabular) for robust skin cancer diagnosis, looking at increasing rates of missing tabular data (0–100%, with a step size of 10%). Recorded performance is presented in terms of accuracy, with lower values indicating greater sensitivity to the missing data (modality), while higher values indicate a better performance.
For a numerical evaluation of missing modality, we conducted a detailed investigation through focusing on client-wise modality configurations with different proportions of missing modalities, and employed imputation strategies, as detailed in
Table 11 and
Table 12.
Table 13 summarizes the performance metrics (accuracy) of the model under different missing data rates, illustrating how each handling strategy affects overall system performance.
Implications:
Zero imputation used a default zero tensor to fill in for any missing tabular data. While simple, this method can lead to suboptimal performance if the model relies heavily on the tabular features for predictions.
Learned feature representation involves training a separate model to learn a default representation of missing tabular data based on the existing data distribution. This approach yielded a better performance compared to zero imputation.
In scenarios where tabular data is entirely missing, the system must rely solely on the image modality. This has been shown to have a significant impact on the model’s accuracy, which can be significantly increased if the tabular data contains critical information for classification.
The dataset wrapper was designed to transparently handle missing modalities by returning either the available tabular data or a default tensor. This strategy aimed to mitigate the performance drop associated with missing data by providing a consistent input format.
Table 13.
Performance comparison of missing modality handling strategies across increasing missing data rates with the diverse methods employed in our work.
Table 14 presents a comparative ratio distribution across modalities. The bold and rounded row is a critical missing modality ratio. CT is short for Critical Threshold.
| Missing Data Rate | Zero Imputation | Learned Default | No Tabular Data | Dataset Wrapper |
|---|
| 0% | 0.9 | 0.92 | N/A | 0.9 |
| 10% | 0.88 | 0.91 | 0.85 | 0.87 |
| 20% | 0.85 | 0.89 | 0.8 | 0.83 |
| 30% CT | 0.8 | 0.85 | 0.75 | 0.78 |
| 40% | 0.75 | 0.82 | 0.7 | 0.73 |
| 50% | 0.7 | 0.8 | 0.65 | 0.68 |
| 60% | 0.65 | 0.78 | 0.6 | 0.63 |
| 70% | 0.6 | 0.75 | 0.55 | 0.58 |
| 80% | 0.55 | 0.72 | 0.5 | 0.53 |
| 90% | 0.5 | 0.7 | 0.45 | 0.48 |
| 100% | 0.45 | 0.67 | 0.4 | 0.43 |
Table 14.
Missing modality ratio (Reference Table to
Table 13).
Table 14.
Missing modality ratio (Reference Table to
Table 13).
| Missing Data Rate | Image Modality | Tabular Modality |
|---|
| 0% | 100% | 100% |
| 10% | 100% | 90% |
| 20% | 100% | 80% |
| 30% | 100% | 70% |
| 40% | 100% | 60% |
| 50% | 100% | 50% |
| 60% | 100% | 40% |
| 70% | 100% | 30% |
| 80% | 100% | 20% |
| 90% | 100% | 10% |
| 100% | 100% | 0% |
As evident from the results, a 30% missing data rate is the critical ratio (critical threshold). Beyond this point, the likelihood of irregularities in model performance increases significantly, which can ultimately lead to incorrect model predictions.
Further research could explore its scalability to larger, more diverse federated networks and its integration with expandability features for clinical deployment. In summary, this work contributes towards privacy-preserving AI in healthcare, enabling multi-institutional collaboration without compromising data security.
7.4. Comparison with SOTA
Table 15 demonstrates our framework superior performance compared to the current state-of-the-art methods, achieving remarkable matrices of 98.34% accuracy, 98.67% AUC, and an F1-score of 97.65% on our curated multimodal dataset. These results substantially outperform existing approaches such as Al et al. (90.70% accuracy, 95.00% AUC) [
55] and Hashmani et al. (92.30% accuracy, 97.00 AUC) [
59], while also addressing key limitations observed in other studies. Notably, our solution overcomes the existing challenges and achieves robust results while handling non-IID data distributions. These improvements are particularly significant given the challenging nature of medical data analysis in the federated environment, where modality heterogeneity and privacy constraints typically degrade model performance. The consistent superiority across all three key evaluation matrices suggest that our approach offers both technical and practical advantages for real-world medical applications.
7.5. Discussion
Federal learning (FL) has emerged as a promising paradigm for collaborative model training while preserving data privacy, particularly in sensitive domains such as healthcare. Unlike centralized learning, which requires raw data to be aggregated on a central server, FL enables clients to train models locally and only share model updates, thereby mitigating the privacy risk associated with data-sharing. In the context of skin cancer diagnosis, where medical data is often distributed across institutions and subject to strict privacy regulations, FL provides a practical solution for building robust diagnostic models without compromising patient confidentiality.
One of the key challenges in federated learning is handling heterogeneous and missing modalities across hospital institutions—issues that are common in real-world medical datasets. Our framework, PMM-FL, explicitly addresses these challenges through a multitask multimodal learning method, handling missing table modalities and using an aggregation strategy, which achieved a superior performance compared to baseline methods. This flexibility ensures that the model remains effective even with an unbalanced and incomplete modality across institutions, a critical requirement for deployment in a diverse healthcare environments.
7.6. Key Contributions
Our proposed framework addresses several practical challenges:
Flexible Deployment:Supports clients with heterogeneous multimodal configurations (single modality; unbalanced modality; balanced modality).
Missing Modality Robustness: Employs learned defaults and auxiliary supervision to recover information loss due to missing tabular data.
Federated Aggregation and Local Adaptation: Maintains a strong global model performance while allowing for personalization at the client level.
7.7. Limitations and Future Work
Despite its strengths, FL introduces several challenges:
Generalization to Unseen Clients: In dynamic contexts, new clients may subsequently join the federated network. An effective model must exhibit a robust performance on unfamiliar/unseen data distributions without necessitating extensive retraining.
Communication Overhead: Frequent synchronization between clients and the central server can be costly in resource-constrained environments, which requires further optimization techniques.
Privacy Extensions: While FL is privacy-preserving by design, integrating differential privacy or secure multi-party computation could further enhance its trustworthiness.
Dynamic Client Management: Future work will focus on extending the framework to support dynamic client arrival, model personalization, and lifelong federated updates.
8. Conclusions
In this paper, we proposed PMM-FL, a personalized multimodal federated learning framework with knowledge transfer for skin cancer diagnosis. By integrating multimodal data fusion, personalized model adaptation, and advanced aggregation techniques (FedAvg and FedProx), PMM-FL effectively addressed key challenges such as data heterogeneity and missing modalities, achieving superior performance in terms of accuracy, convergence speed, and robustness. The experimental results demonstrated the effectiveness of our framework on a curated multimodal skin lesion dataset, highlighting its potential for real-world clinical applications.


